Article

Analysis of Interannual and Seasonal Nearshore Bar Behaviour Observed from Decadal Optical Satellite Data in the Curonian Spit, Baltic Sea

by
Rasa Janušaitė
1,
Darius Jarmalavičius
1,*,
Laurynas Jukna
2,
Gintautas Žilinskas
1 and
Donatas Pupienis
1
1
Laboratory of Geoenvironmental Research, Nature Research Centre, 08412 Vilnius, Lithuania
2
Institute of Geosciences, Vilnius University, 03101 Vilnius, Lithuania
*
Author to whom correspondence should be addressed.
Remote Sens. 2022, 14(14), 3423; https://0-doi-org.brum.beds.ac.uk/10.3390/rs14143423
Submission received: 2 June 2022 / Revised: 3 July 2022 / Accepted: 14 July 2022 / Published: 16 July 2022
(This article belongs to the Special Issue Remote Sensing Application in Coastal Geomorphology and Processes)

Abstract

:
Long-term observations of nearshore bar behaviour are a vital component of coastal monitoring, management, and prediction. Optical satellite remote sensing enables the possibility of such observations over large spatial areas, but its full potential remains unexploited. This study assessed alongshore variability in cross-shore nearshore bar behaviour on a wave-dominated multi-bar coast of the Curonian Spit (south-eastern Baltic Sea) between 2011 and 2021, using satellite-derived bar data. Nearshore bars were extracted from a time series of PlanetScope and RapidEye satellite images with an automated GIS-based algorithm, previously proposed by the study authors. The cross-shore behaviour of a multiple bar system was analysed by adapting traditional bathymetry-based analysis techniques to satellite-derived data that included bar crestlines and images of multi-scale Relative Bathymetric Position Index (RBPI). The analysis was performed on 1071 shore-perpendicular transects. Multi-bar onshore and offshore migration rates were quantified on interannual and seasonal timescales. The results show that, on an interannual timescale, bars migrated offshore at rates up to 9.7 m/month, while the rates of onshore migration reached up to 11 m/month. During the months of low wave energy, bars moved offshore at rates up to 6.2 m/month, and during the months of high wave energy, up to 12.9 m/month. However onshore migration rates, during the months of low and high wave energy, reached up to 7.0 and 13.4 m/month, respectively. A complex empirical orthogonal function (CEOF) analysis was performed on RBPI-derived cross-shore profiles, and cyclic offshore directed bar behaviour was examined. For the first time, the net offshore migration (NOM) cycle with bar cycle return periods of 1.8 to 13.5 years was investigated on the south-eastern Baltic Sea coast. Bar cycle return periods increased and rates of bar cross-shore migration decreased from north to south along the Curonian Spit. Similar nearshore bar behaviour regions were identified using clustering analysis based on quantified temporal and morphological characteristics of the bars. Factors controlling alongshore variability in bar cross-shore behaviour were determined. The study results suggest that small alongshore variations in nearshore hydrodynamics, caused by the local wave climate and its interplay with the shoreline orientation, determine the morphological and temporal variability of the multi-bar system in the Curonian Spit.

1. Introduction

Sandy coastal systems are characterised by submerged shore-parallel ridges, also known as nearshore bars, which form as a result of sedimentary processes in the surf zone. They are frequently observed as single or multiple bar systems in wave-dominated environments, ranging from non-tidal to macrotidal [1]. As the first line of coastal protection, bars are closely related to coastal stability, beach erosion, and shoreline position [2,3,4]. Bar morphologies are portrayed by striking variability in their cross-shore and alongshore appearances [5,6].
In response to variability in the wave climate, bar cross-shore positions change over time [7,8,9]. Nearshore bars have been observed to respond to hydrodynamic forcing on a variety of timescales, from storm-related [10,11,12] to seasonal [13,14] and interannual [15,16,17]. The size of the bars appears to govern the dominant timescale [18].
On a storm-related timescale, the strong undertow induced by energetic wave conditions causes bars to migrate offshore [19]. Offshore bar migration rates of 1 m/day to 50 m/day have been reported during high-wave events [7,10,20]. Although rarely, onshore bar movement under storm conditions has also been observed [21,22].
On a seasonal timescale, seaward and landward bar movements are observed. Typically, periods of low-wave-energy conditions are associated with slow onshore bar movement, while periods of high-energy conditions are related to fast episodic offshore movements [13]. Seasonal variations in the bar position of up to 1 m/day and up to 1.2 m/day have been observed for landward and seaward migration, respectively [5,23].
On an interannual timescale, cyclic bar behaviour incorporating net offshore migration (NOM) has been observed at many sites worldwide [15,17,23,24,25,26,27] with several locations exhibiting net onshore migration [28,29]. During the interannual cross-shore migration cycles, bars generate near the shoreline, move offshore across the nearshore, and decay at the outer nearshore boundary [15]. NOM has been observed to last from a year [26] to nearly two decades [15,24,25,27,30,31,32,33]. At NOM sites, seaward bar migration rates of 20 to 200 m/year have been reported [15,24,32,34].
Most studies that analysed bar behaviour on storm-related, seasonal, or interannual timescales assessed the cross-shore movement of single, double, or triple bar systems and provided migration rates, mostly for the inner and outer bars only. Several studies attempted to quantify the cross-shore migration of bars on multiple timescales simultaneously [5,7,14,23], but such quantifications were completed only for limited alongshore lengths (<5 km).
Numerous studies used bathymetric [13,14,23,25,27,30,32,33,35,36] or remotely sensed data acquired by video monitoring systems [5,7,37] to determine the variability of bar cross-shore temporal and morphological characteristics. Only a very few of these studies focused on regions with alongshore lengths greater than tens [25,27] or hundreds of kilometres [17,35]. Recently, studies that used optical satellite imagery to detect nearshore bars emerged [38,39,40,41,42]. The methods proposed in these studies, when combined with Earth observation satellites, enable the possibility of studying bars over large spatial scales with a temporal frequency of days [43]. Since datasets with such spatiotemporal extents are unavailable for many sandy beaches worldwide, satellite remote sensing is a cost-effective alternative to state-of-the-art methods used to investigate bar behaviour. However, research involving the use of satellite images to investigate bars has not yet specifically focused on quantifying the cross-shore behaviour of bars.
The aim of this study is to assess the alongshore variability in interannual and seasonal bar cross-shore behaviour by adapting traditional analysis techniques to satellite-derived bar data using a case study of the multi-bar system, located along the Curonian Spit, south-eastern Baltic Sea. It is an extension of a previous study by Janušaitė et al. [39] who suggested a methodology to automatically extract nearshore bars from satellite images. Another study by Janušaitė et al. [2] proved that the medium-resolution satellite imagery used in this study is a powerful tool to study the phenomena of three-dimensional bar behaviour, particularly multi-bar switching, and its interplay with coastal evolution, whereas this study focuses on the analysis of two-dimensional bar behaviour. The motivation for this study is based on a paucity of studies focussing on: (1) the alongshore variability of cross-shore behaviour of bars in large spatial extents; (2) bar cross-shore behaviour in multi-bar systems with more than two or three bars; (3) quantification of cross-shore movement of bars and NOM using satellite-derived data; and (4) alongshore variability in bar cross-shore migration rates on multiple timescales. As an outcome of this study, we provide a detailed methodology for using satellite-derived data to quantify the morphological and temporal characteristics of bars, including rates of cross-shore migration of bars on multiple timescales and NOM characteristics. The results are then demonstrated by analysing alongshore variability for the derived characteristics of the multi-bar system in the Curonian Spit and identifying nearshore regions with similar bar behaviour. We discuss the results by identifying factors influencing alongshore variability in bar dynamics and defining the limitations of this study.

2. Materials and Methods
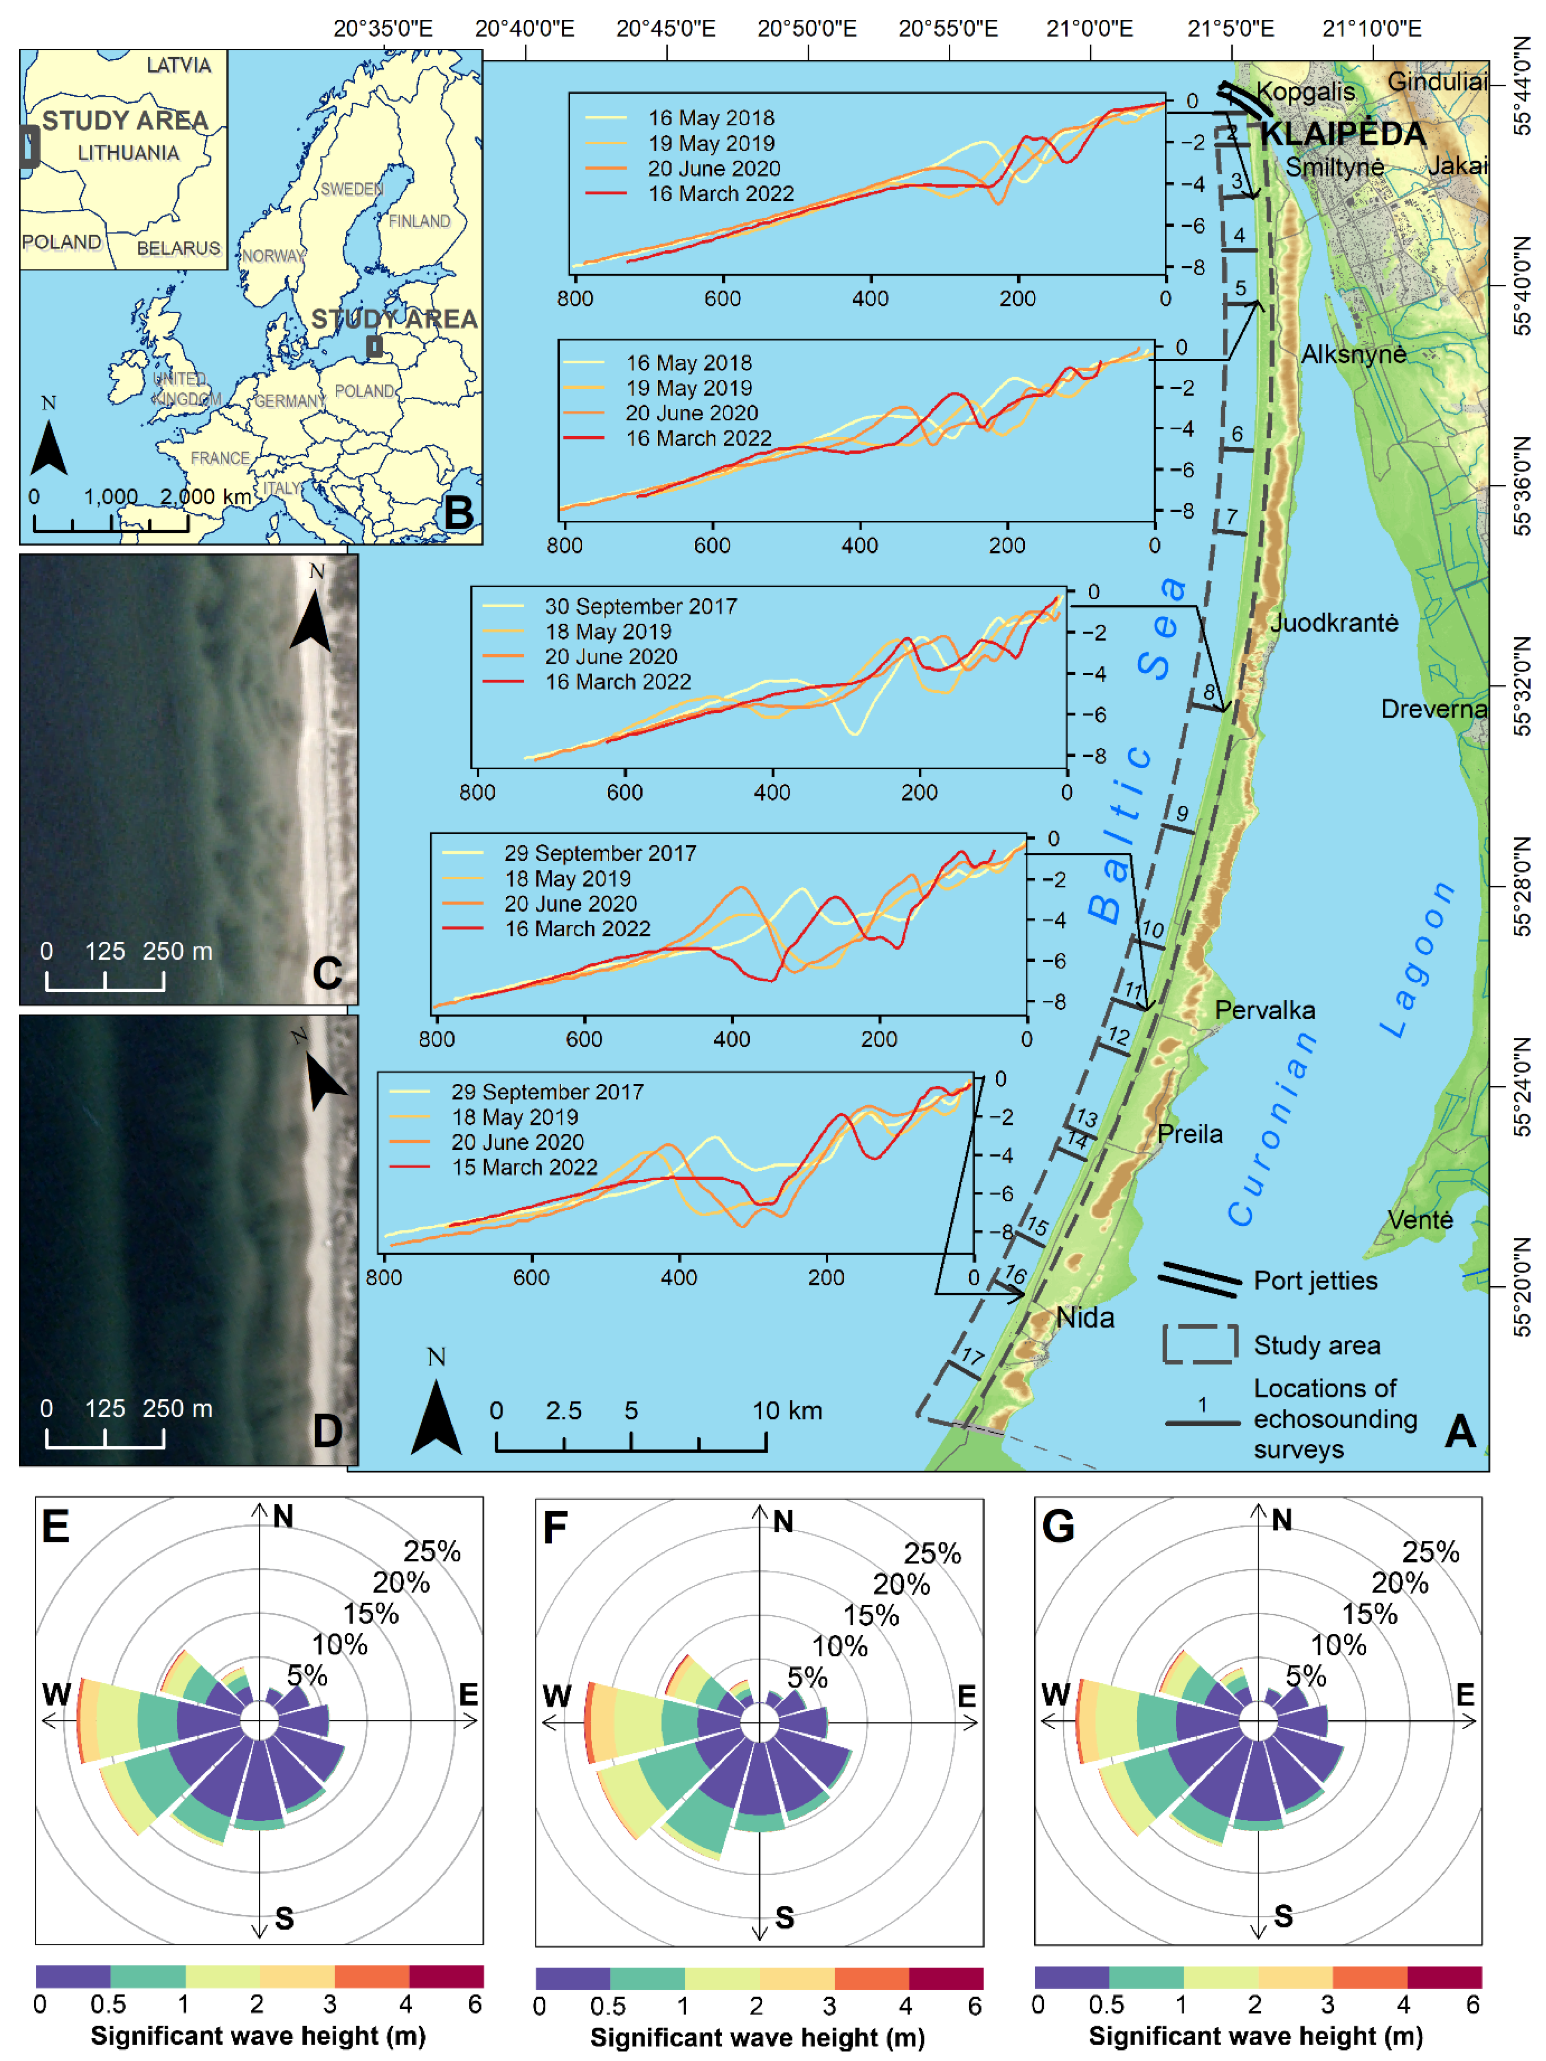
2.1. Study Area

The research was undertaken in the Curonian Spit, located on the south-eastern coast of the Baltic Sea. The Curonian Spit is a 98-km-long sandy barrier, the territory of which is divided between the Republic of Lithuania and the Russian Federation. In this study, the 51-km-long Lithuanian part, stretching from the Klaipėda Strait in the northern end to the settlement of Nida in the south, is analysed (Figure 1).
The study area is a non-tidal (3.5–4.0 cm tidal range) environment with predominant wind-generated waves, alongshore currents, and net sediment transport directed from south to north. The Curonian Spit is predominantly exposed to a wave climate with waves approaching from westerly (NW, W, SW) directions [44,45] with an annual mean significant wave height of 0.52 m. Based on Copernicus Baltic Sea wave reanalysis data [46], monthly averaged significant wave heights from April to September range between 0.33 m and 0.55 m, while from October to March they vary between 0.60–0.84 m. During the strongest storms, when the wind speeds are close to or above the hurricane-force threshold, the wave height in the nearshore region reaches up to 5–6 m.
The subaerial beaches are composed of fine to medium sands. They are 30–65 m wide, with the widest at Smiltynė and the narrowest at Juodkrantė [47]. The beaches are bounded by a foredune ridge with high alongshore variability in height above mean sea level and sediment volume, determined as enclosed sand from the foredune toe to a point inland where the vertical variability are minimal. These characteristics range from 110 m3/m at Juodkrantė to 2200 m3/m at Smiltynė, and from 6 m at Juodkrantė to 16 m at Alksnynė [47].
The surf zone is characterised by a mean nearshore slope of 0.01 (up to 8 m depth) and features a multiple bar system with 2–5 bars. The morphologies of the bars vary from longshore straight to quasi-regular crescentic and shore-attached with shore-parallel or slightly oblique orientation (Figure 1C,D). Bars are composed of fine sand (0.1–0.25 mm), while troughs are made of coarser grain sizes ranging from fine to medium (0.25–0.5 mm) and coarse (0.5–1 mm) sands, sometimes with an admixture of shingle [48]. The development of most of the study area is governed by natural processes and only the northern end of the Curonian Spit is influenced by the Klaipėda port jetties [49]. Therefore, the approximately 300 m longshore section around Kopgalis lacks a well-developed bar system and was excluded from the analysis.

2.2. Data

The main data source for this study was multispectral images captured by the RapidEye and PlanetScope satellite constellations between 2011 and 2021 [50]. The RapidEye constellation consisted of five identical sensors that acquired images with five spectral bands (blue, green, red, red-edge, and near-infrared) at a 5-m spatial resolution every 5.5 days between 2008 and 2020. Since 2017, groups of individual CubeSats of the PlanetScope constellation have been acquiring images daily with four spectral bands (blue, green, red, and near-infrared) at a 3-m spatial resolution. To match the spatial resolution of RapidEye images, PlanetScope images were resampled at a 5-m resolution using bilinear interpolation. Images were selected based on three criteria: cloud cover of less than 20%, no visible wave breaking, and bars were visible. A total of 145 dates met the criteria. However, to maintain evenly spaced observations with a relatively low number of gaps, we decided to use monthly data, with the first available date of each month being chosen for analysis. The average difference between two consecutive observations was 2.3 months, but since the PlanetScope constellation was only launched in 2017, the available observations were unevenly distributed during the analysed period. Between 2011 and 2016, the difference between the two consecutive observations ranged from 1 to 10 months (on average, 3.4 months). Between 2017 and 2021, the difference between two consecutive observations varied from 1 to 5 months (on average, 1.6 months). In addition, the seasonal distribution of the available data was uneven, with most images captured between March and October and only a small number of images acquired between November and February, as the Curonian Spit rarely has cloud- and wave-free days during these months.
To determine the factors that influence the temporal characteristics of the nearshore bars, we used bathymetric and wave data. Bathymetric data were obtained from semi-annual echo-sounding surveys performed between 2017 and 2022 at 17 cross-shore locations along the study area (Figure 1A). Wave parameters for shallow nearshore waters were extracted from the hourly Baltic Sea wave reanalysis data with a spatial resolution of 2 km, provided by the Copernicus Marine Service [46].

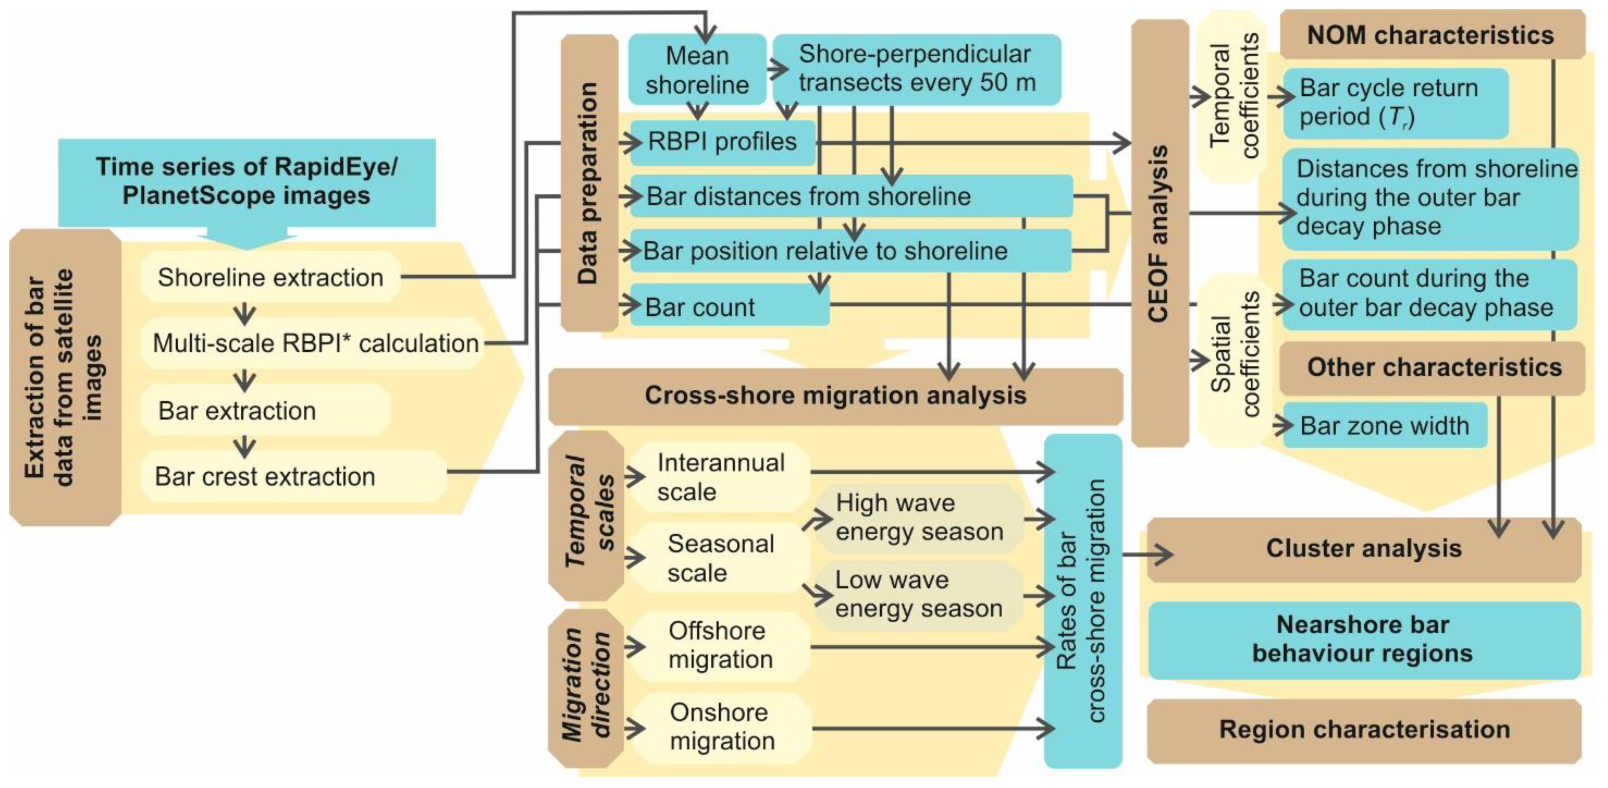
2.3. Extraction and Preparation of Bar Data

We extracted bar data from satellite images following the approach proposed by Janušaitė et al. [39]. It is a multi-step algorithm that consists of four stages used to detect various morphological features for bar analysis: extracting the shoreline, calculating the multi-scale Relative Bathymetric Position Index (RBPI) with nearshore morphological features, identifying the bar boundaries, and deriving the positions of the bar crests within defined boundaries. RBPI is a signed metric of a local bathymetric position that indicates whether the pixel depth is higher or lower than the mean in the local neighbourhood, defined by the window size and normalised by the minimum and maximum values within the local neighbourhood [51]. We used surface reflectance of visible spectrum bands in the calculation of the RBPI as an indicator of shallower and deeper nearshore regions. The RBPI result is very similar to the bathymetry-derived perturbations except that the values do not match the true depth deviations. This enables the possibility to analyse bar behaviour without the necessity of expensive and time-intensive bathymetric surveys or implementation of bathymetry derivation algorithms.
The RBPI outputs were created by implementing a multi-scale approach that combines RBPI values in different-sized local neighbourhoods (3–39 pixels). Such an approach allows the identification of both smaller and larger bar morphologies, regardless of their distance from the shoreline. RBPI images, used as inputs for unsupervised classification and criteria-based selection operations, were employed to distinguish bar boundaries. Within these boundaries, bar crest locations were derived as maximum value pixels in shore-perpendicular and shore-oblique directions, then non-crest pixels were removed with a proximity-based filter. This approach to deriving bar crests, designed for variously oriented crests, is customised for diverse bar morphologies. The accuracy of the method was assessed by comparing satellite-derived crest positions with a bathymetry-derived algorithm. It was determined that with this algorithm, bar crests were derived with an average root mean squared error (RMSE) of 5.8 and 7.0 m for PlanetScope and RapidEye sensors, accordingly. Between the inner and outer bars, the RMSE was between 3.8 m and 7.7 m [39]. To avoid the influence of possible errors on the results, we decided to exclude short-term changes in bar morphology from the analysis, and only seasonal and interannual bar behaviour were evaluated.
We conducted a further analysis of the cross-shore temporal and morphological characteristics of the bars using two satellite-derived outputs: RBPI images and bar crest positions. The traditional cross-shore profiling technique was applied, and 1071 shore-perpendicular profiles with 50-m alongshore spacing were employed for analysis. Two databases with bar characteristics were created: one with a monthly time series of RBPI cross-shore profiles at a 5-m spatial resolution and another with a monthly time series of bar distances from the shoreline, bar positions relative to the shoreline, and bar counts. The bar distance from the shoreline was defined as the distance from the mean shoreline of the intersection point between the bar crestline and the profiles. The mean shoreline was obtained from the time series of satellite-derived shorelines by identifying their mean position at each profile between 2011 and 2021. Positions relative to the shoreline, from first to fifth, were assigned to the bars, with the first bar being the seaward-most (outer) bar, the second being the second-seaward-most bar, etc. Figure 2 overviews the main data extraction and analysis steps of this study.
Bar data extraction, preparation, and further spatiotemporal analysis were performed in the R programming language or with ArcGIS Desktop 10.7.

2.4. Assessment of Interannual and Seasonal Migration Rates

We determined the rates of interannual and seasonal bar migration using the seasonal and interannual components of the time series of the bar distances from the shoreline for each cross-shore profile, as proposed by [5,23]. It was achieved in the following order: (1) an interannual component was obtained by computing a 12-month rolling mean of the time series of the bar distances from the shoreline; (2) the difference between the original time series of the bar distances from the shoreline and the interannual component was calculated; (3) a seasonal component was obtained by computing a 6-month rolling mean of the difference, determined in point two; (4) interannual migration rates were computed as a temporal derivative of the interannual component; and (5) seasonal migration rates were computed as a temporal derivative of the sum of seasonal and interannual components. Positive rates of the interannual and seasonal bar migration, determined in steps four and five, were considered as the rates of offshore bar migration, while the negative rates were considered as the rates of onshore bar migration. A 6-month rolling mean was chosen to compute the seasonal component because two seasons were considered when evaluating seasonal bar migration: seasons of relatively low (April–September) and high (October–March) wave energy. Four seasons could be distinguished in the Curonian Spit, but because the availability of cloudless and wave-free satellite images in the winter months is limited, we decided to only use the two most important seasons, which are separated by the typical beginning and the end of the storm season. Seasonal bar migration rates were divided between these two periods of the year. Prior to the computation of the interannual and seasonal components, the bar distances from the shoreline were longshore averaged using a 500-m sliding window.

2.5. Assessment of Net Offshore Migration and Other Characteristics

Previous studies established the bar cycle return period ( T r )—a time between two successive bar decay events—as a core parameter describing progressive offshore bar behaviour [17,25,30,31,32]. Ruessink et al. [30] suggested a detailed methodology to extract T r , along with the other geometric and temporal bar characteristics, via complex empirical orthogonal function analysis (CEOF) using cross-shore bathymetric profiles. Here, we adapted this CEOF-based methodology to non-bathymetric satellite-derived bar data.
Originally, the perturbation matrix is computed by subtracting the mean bathymetric profile from the original profile time series, and CEOF is performed on a complex matrix whose real part is the perturbation matrix and the imaginary part is the Hilbert transform of that matrix. In this study, the bathymetric perturbation matrix was replaced with that retrieved from the time series of RBPI profiles (Figure 3).
Prior to CEOF analysis, the RBPI profiles were filtered with a fifth-order Butterworth low-pass filter and longshore averaged using a rolling mean with a 500-m window (Figure 3). A linear-weighted moving average was used to fill in missing values in the monthly RBPI time series with a moving average window equal to 4 (both sides left and right) (Figure 4B). To remove periodic noise introduced by longshore averaging and missing data filling, a fast Fourier transform filter was applied. The data were then smoothed using least asymmetric (la16) wavelets in a two-dimensional discrete wavelet transform (Figure 4C). A space-wide RBPI perturbation matrix was computed from the smoothed data, and CEOF was performed.
Similar to Ruessink et al. [30], T r was computed from the third CEOF mode as the ratio between the 2π and the slope of the linear regression line between the unwrapped temporal phase and time. To identify the boundaries of the bar zone ( W b z ), the spatial envelope of the bar amplitude ( S ) was extracted from the spatial CEOF coefficients. This shows the part of the profile where the bars were active. With a threshold S = 0.35 , the landward and seaward limits of the barred part of the RBPI profile were defined.
Other NOM-related characteristics were computed using the database with bar distances from the shoreline. Outer bar distances from the shoreline during the decay phase of the NOM cycle ( X o u t p e a k ) were determined by identifying peak locations in a curve of a time series of the outer bar distances from the shoreline ( X 1 s t ) To locate the middle and inner bars during the decay phase of the outer bar, their distances from the shoreline for the dates of the X o u t p e a k were extracted as X m i d p e a k and X i n n p e a k , respectively. Table 1 lists all parameters used to assess the temporal and morphological characteristics of bars.
We compared the RBPI-derived cross-shore profiles with the bathymetry-derived profiles to illustrate the accuracy of the results and discuss the limitations of satellite-derived bar data in Section 4.3.

2.6. Definition of Nearshore Bar Behaviour Regions

We performed a cluster analysis to objectively separate alongshore nearshore regions that demonstrated similar patterns of bar morphology and behaviour. The clustering of cross-shore profiles included all parameters listed in Table 1. Although several clustering methods were tested, a hybrid approach combining agglomerative hierarchical and k-means clustering was selected and complete linkage was used as the agglomeration method. To identify multi-scale bar behaviour regions, clustering was performed on several levels. As a result, three-level clusters were distinguished, with two, four, and six clusters. The number of clusters was determined using the dendrogram of hierarchical clustering and several indices intended for choosing the optimal number of clusters. Six indices proposed two, three proposed four, and one proposed six as the optimal number of clusters.

3. Results

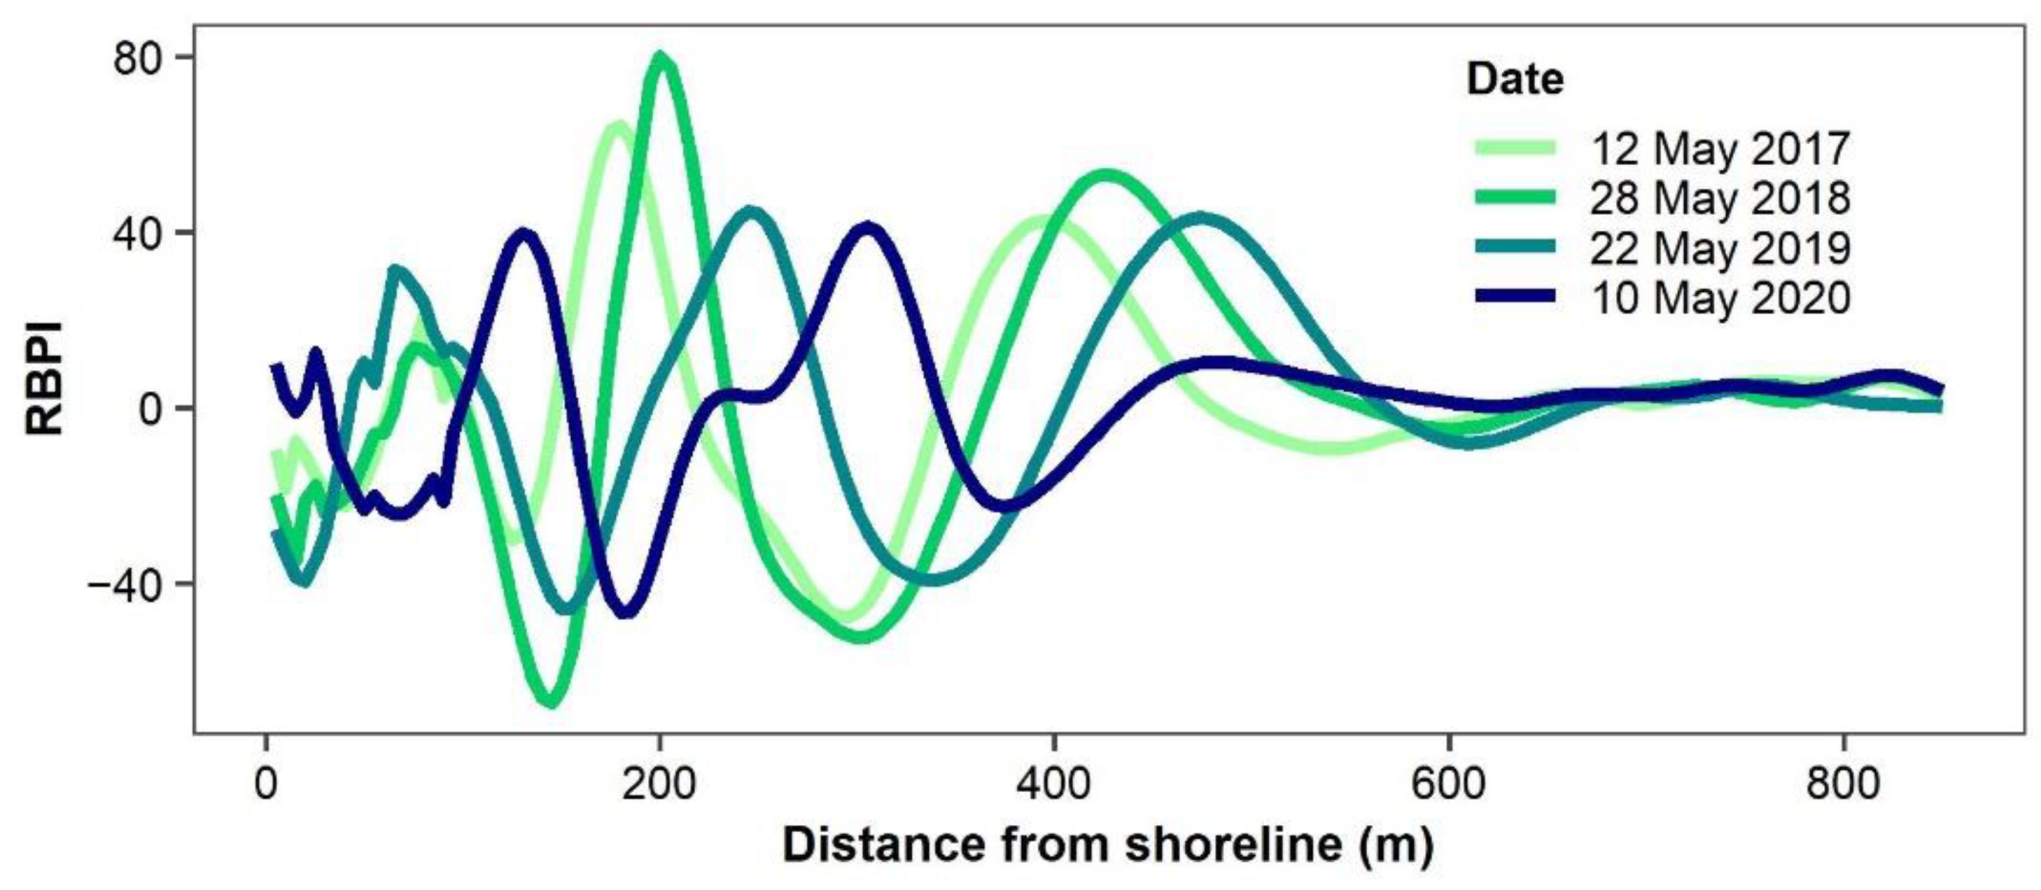
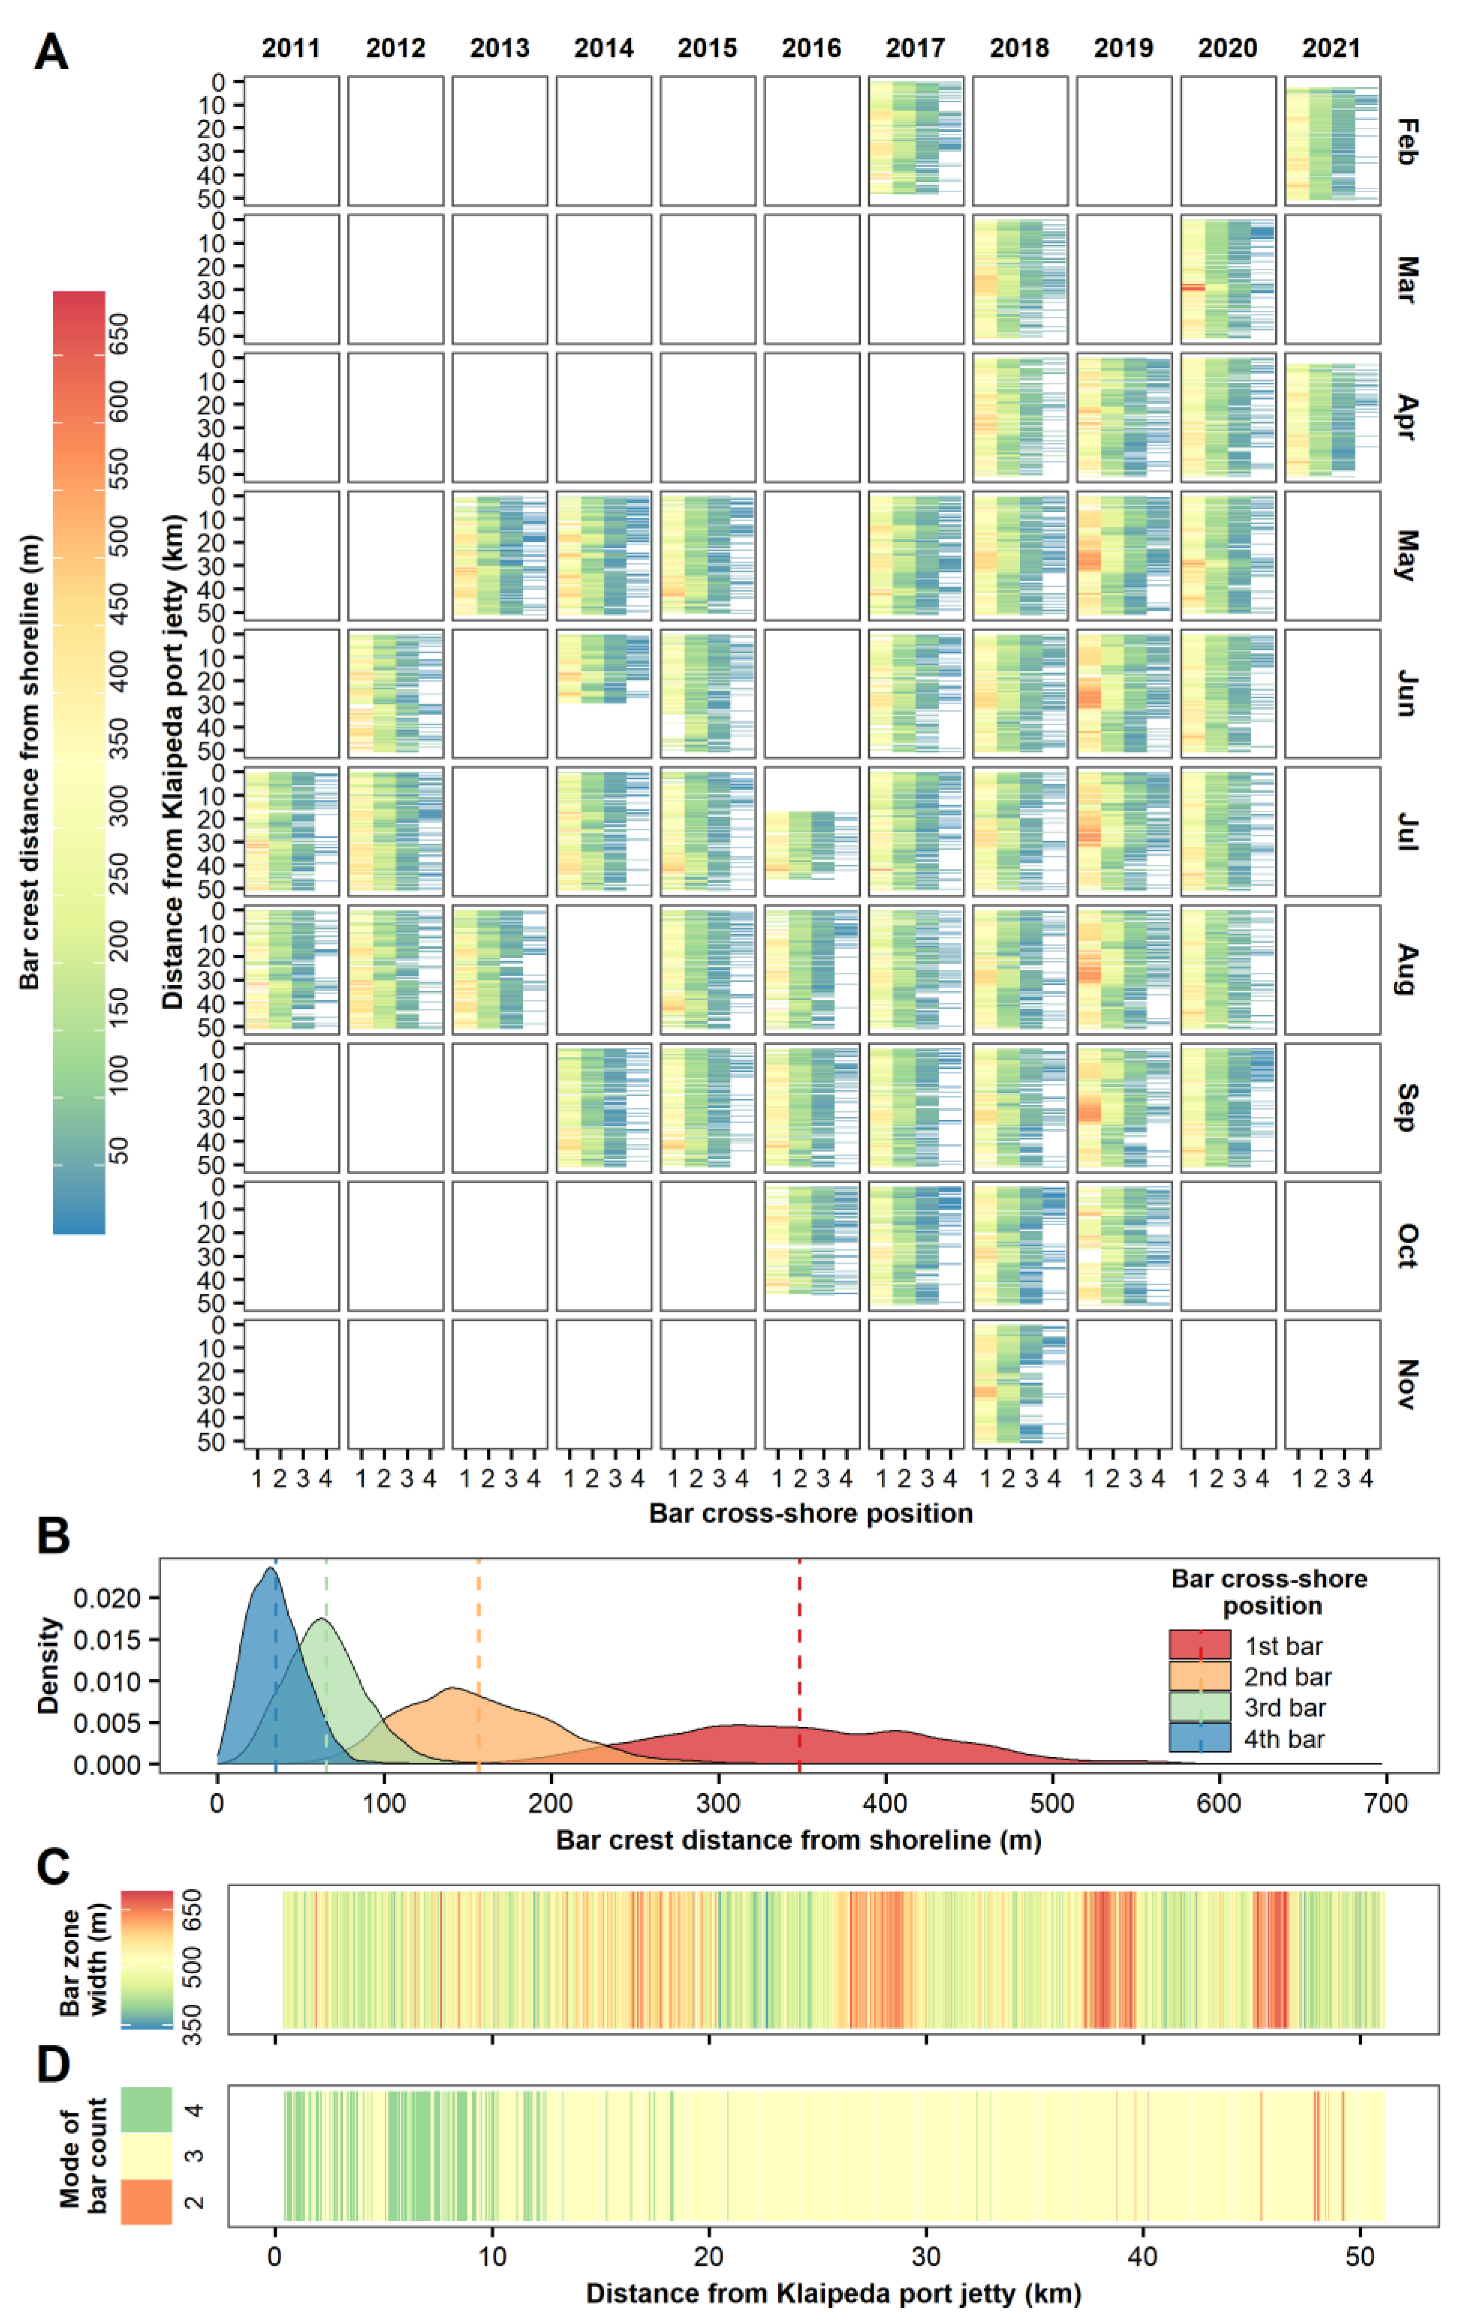
3.1. Morphological Characteristics of the Bar System

The multi-bar system of the study area displays a diverse alongshore configuration: the triple-bar system dominates in a major part of the Curonian Spit, especially to the south of Alksnynė, while to the north of Alksnynė, the triple-bar system alternates with the quadruple-bar system (Figure 5D). Therefore, the bar count mode ( N b ) is three in 85.4% of the profiles, four in 13.0%, and two in 1.6%.
The first bar originates at 104–697 m distance from the shoreline ( X 1 s t , IQR = 290–408 m). The mean crest position of the first bar is 349 m from the shoreline (Figure 5B). Along the Curonian Spit, the mean X 1 s t oscillates between 247 and 431 m, with the lowest mean X 1 s t at Smiltynė and the highest in the sector between southern Juodkrantė and Pervalka. The crest position of the second bar ( X 2 n d ) oscillates between 25 and 336 m (IQR = 123–186 m). It is located at X 2 n d = 156 m on average (Figure 5B), but the mean X 2 n d varies alongshore between 120 and 189 m, with minimum and maximum values in the same sectors as the first bar.
The third and fourth bars are located at X 3 r d = 1–208 m (IQR = 48–80 m) and X 4 t h = 1–127 m (IQR = 22–45 m), respectively. The mean X 3 r d and X 4 t h are 65 and 35 m, accordingly (Figure 5B). The mean crest position of the third and fourth bars decreases from north to south from 81 to 41 m and from 57 to 11 m, respectively. This is related to the fact that, due to the higher bar count in the north, the third bar is typically one of the middle bars, and in the south, it is typically an inner bar. The spacing between the bars increases with their distance from the shoreline. This kind of morphology corresponds to the typical bar distribution in multiple bar systems [1,52].
The average bar zone width ( W b z ) for the Curonian Spit is 512.5 m, but it ranges alongshore between 340 m and 700 m. The alongshore non-uniformity of W b z is the most evident to the south of Juodkrantė, where the sectors of W b z = 400–600 m and W b z = 550–700 m alternate (Figure 5C).

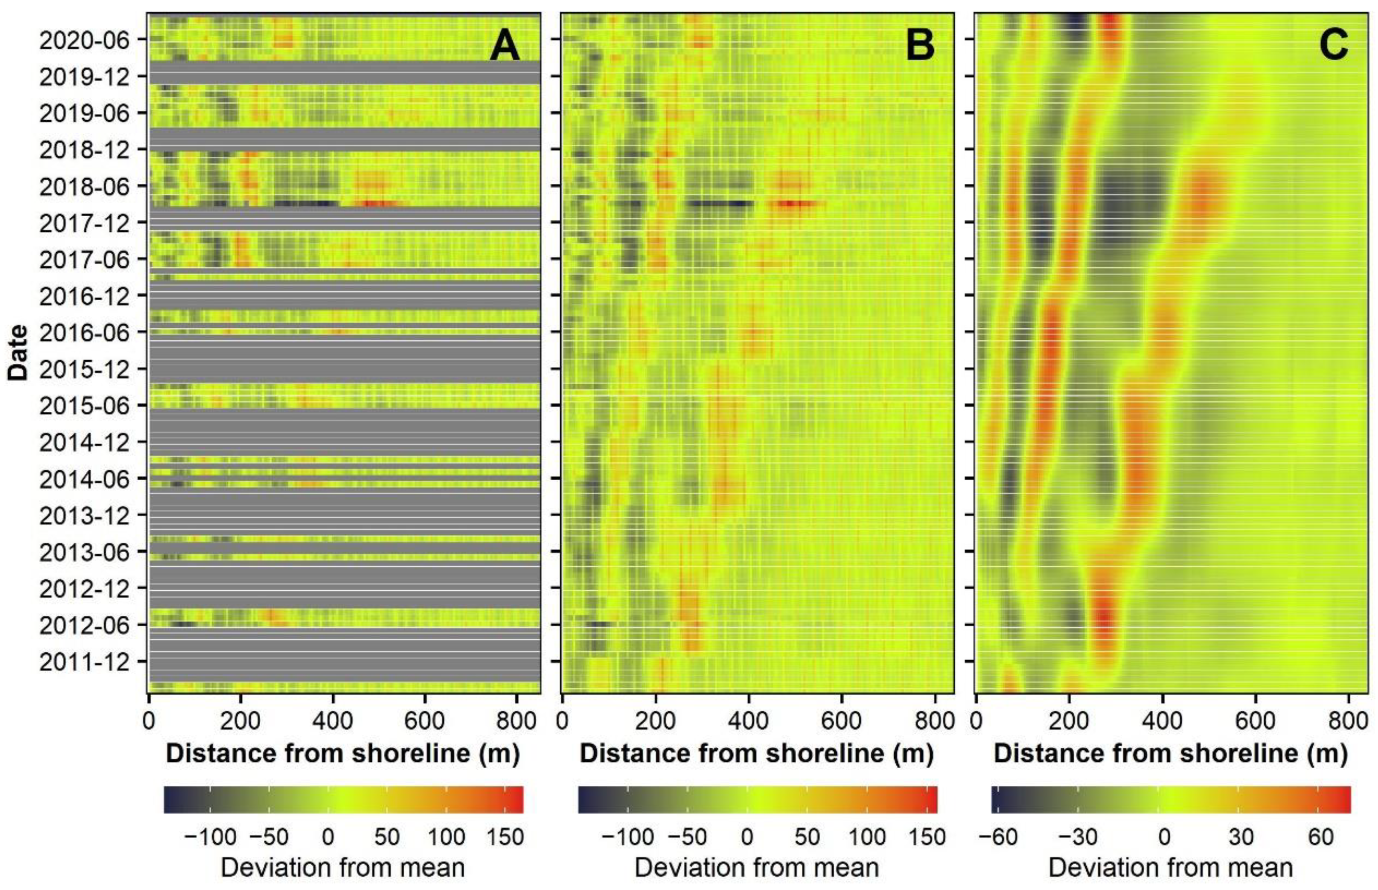
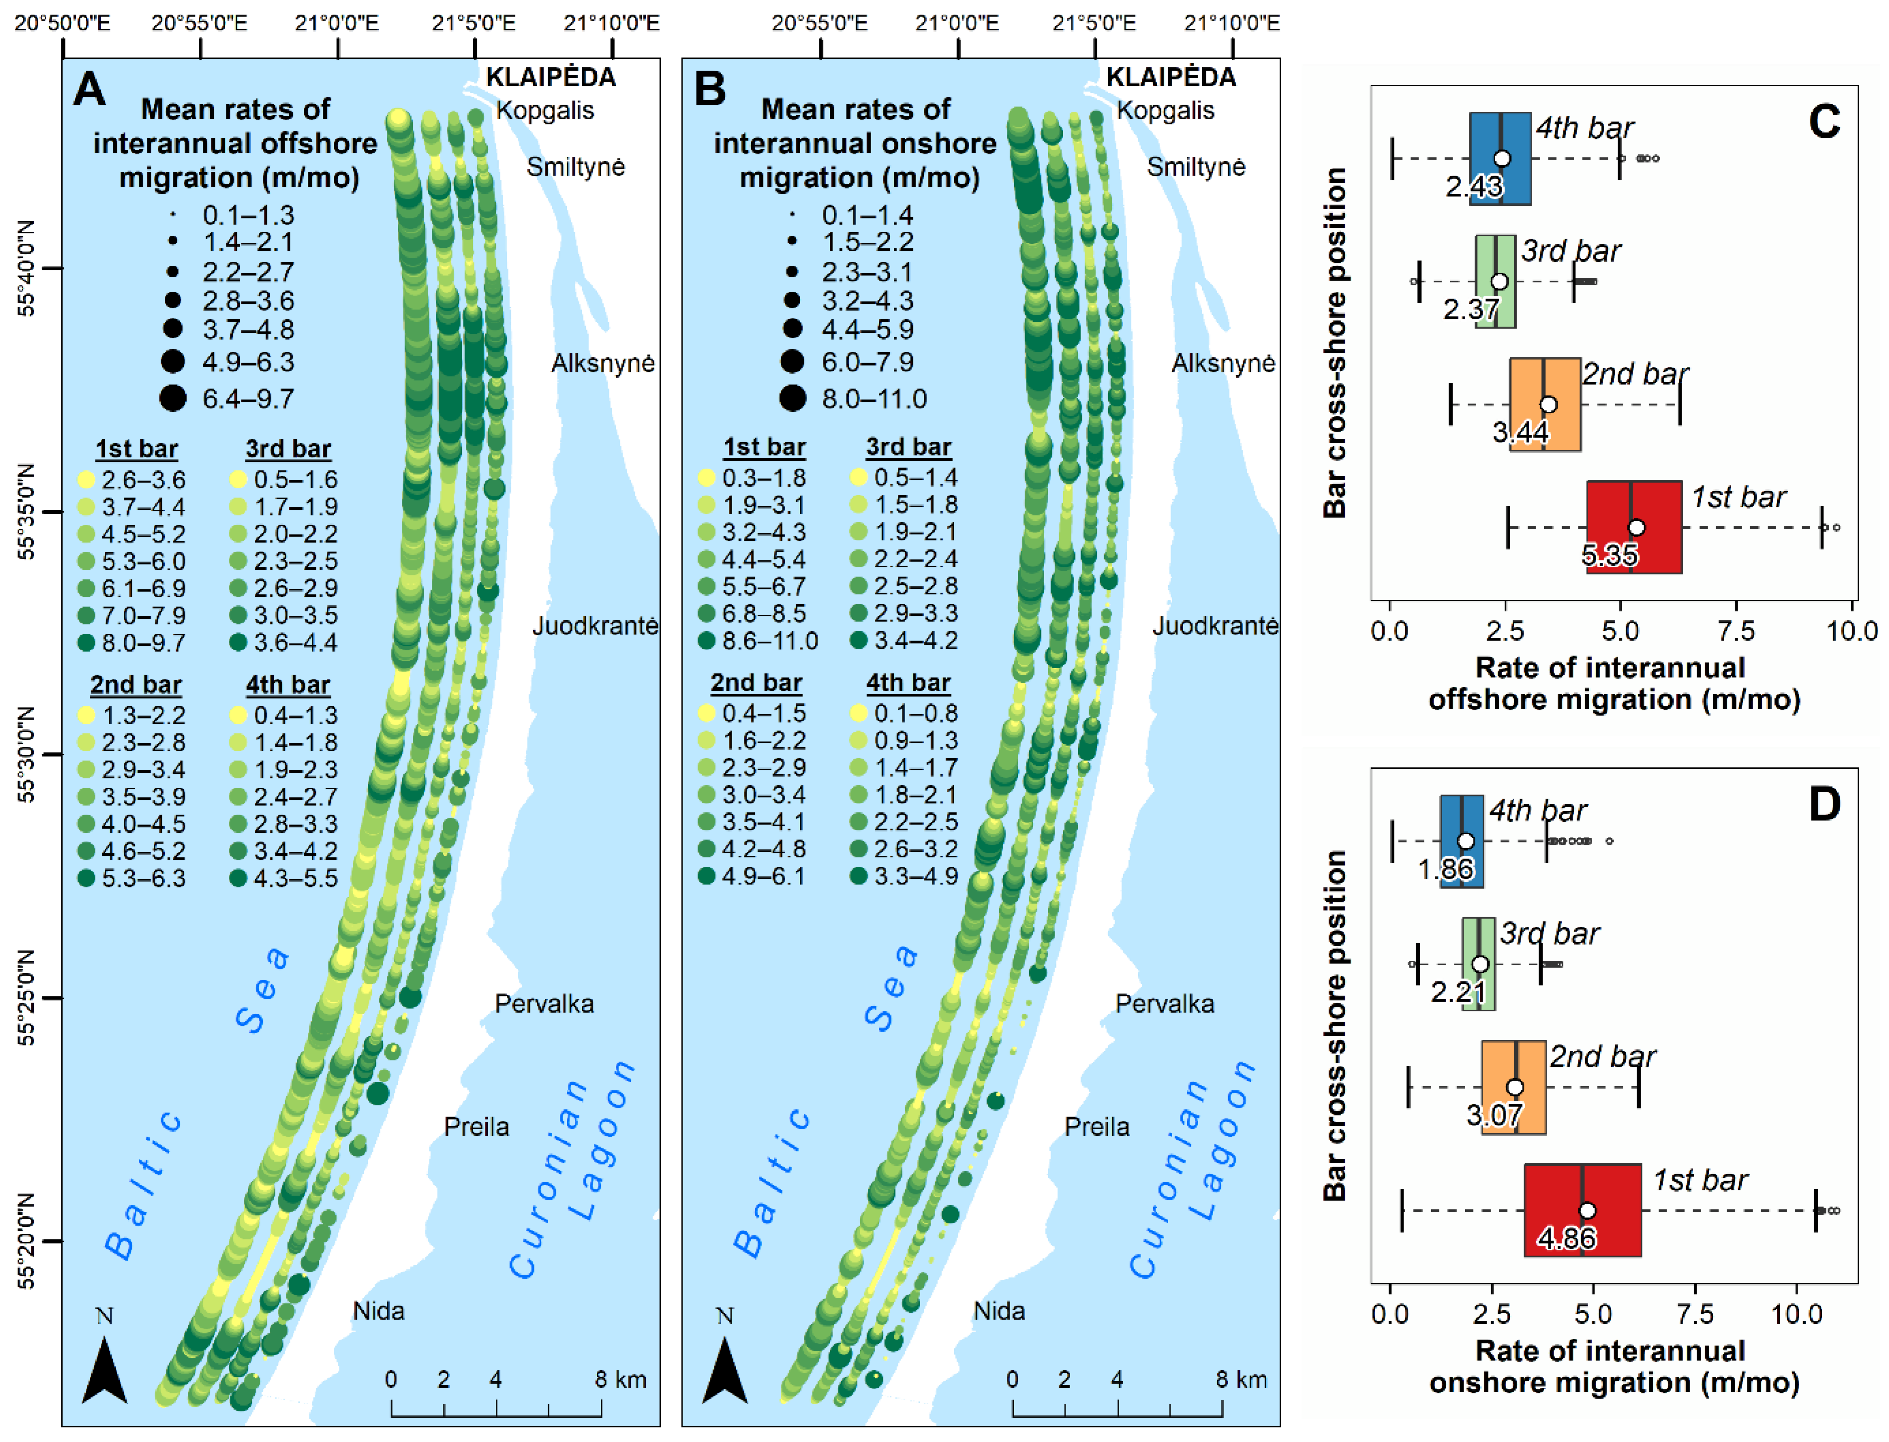
3.2. Interannual Bar Cross-Shore Migration

Both seaward- and landward-directed bar migration rates were computed for the interannual timescale. Depending on bar cross-shore and alongshore location, the time-averaged interannual offshore migration rates ( V o f f ) varied between 0.1 and 9.7 m/mo, while the interannual onshore migration rates ( V o n ) ranged between 0.1 and 11.0 m/mo (Figure 6A,B). Interannual migration rates were higher in the north of the study area than in the south. The boundary between faster and slower nearshore regions for seaward bar movement was at Juodkrantė, and for landward bar movement, it was at Pervalka (Figure 6A,B).
The time-averaged V o f f exceeded V o n in most profiles for all bar cross-shore positions: 60.2%, 64.4%, 59.4%, and 67.3% for the first, second, third, and the fourth bars, respectively. The first bar exhibited a higher V o n than V o f f rates, mainly around Smiltynė, the northern part of Alksnynė, and south of Juodkrantė. Other bars demonstrated similar alongshore trends.
The first (outer) bar had the highest overall average of V o f f and V o n ( V o f f = 5.35 m/mo, V o n = 4.86 m/mo) (Figure 6C,D). It moved fastest offshore and onshore in almost the entire study area (in 90.4% and 77.7% of the profiles). In the case of offshore migration, the first bar fell behind other bars only on short random nearshore sectors, while in the case of onshore migration, it was shortly surpassed by the second bar in the north and by the second to fourth bars in the south. The overall average rates of V o f f and Von for the second bar were 3.44 m/mo and 3.07 m/mo, respectively (Figure 6C,D). The third and fourth bars demonstrated a similar overall average V o f f ( V o f f = 2.37 m/mo and 2.43 m/mo) and V o n ( V o n = 2.21 and 1.86 m/mo) rates. Together, they were the slowest offshore and onshore migrating bars along a major part of the Curonian Spit (in 91.6% and 80.8% of the profiles). In the north, between Kopgalis and Juodkrantė, the fourth bar dominated as the slowest bar in landward-directed migration and alternated with the third bar as the slowest in the seaward migration. In the south, the third bar was the slowest in the seaward migration and alternated with the fourth and second bars as the slowest in the landward migration.

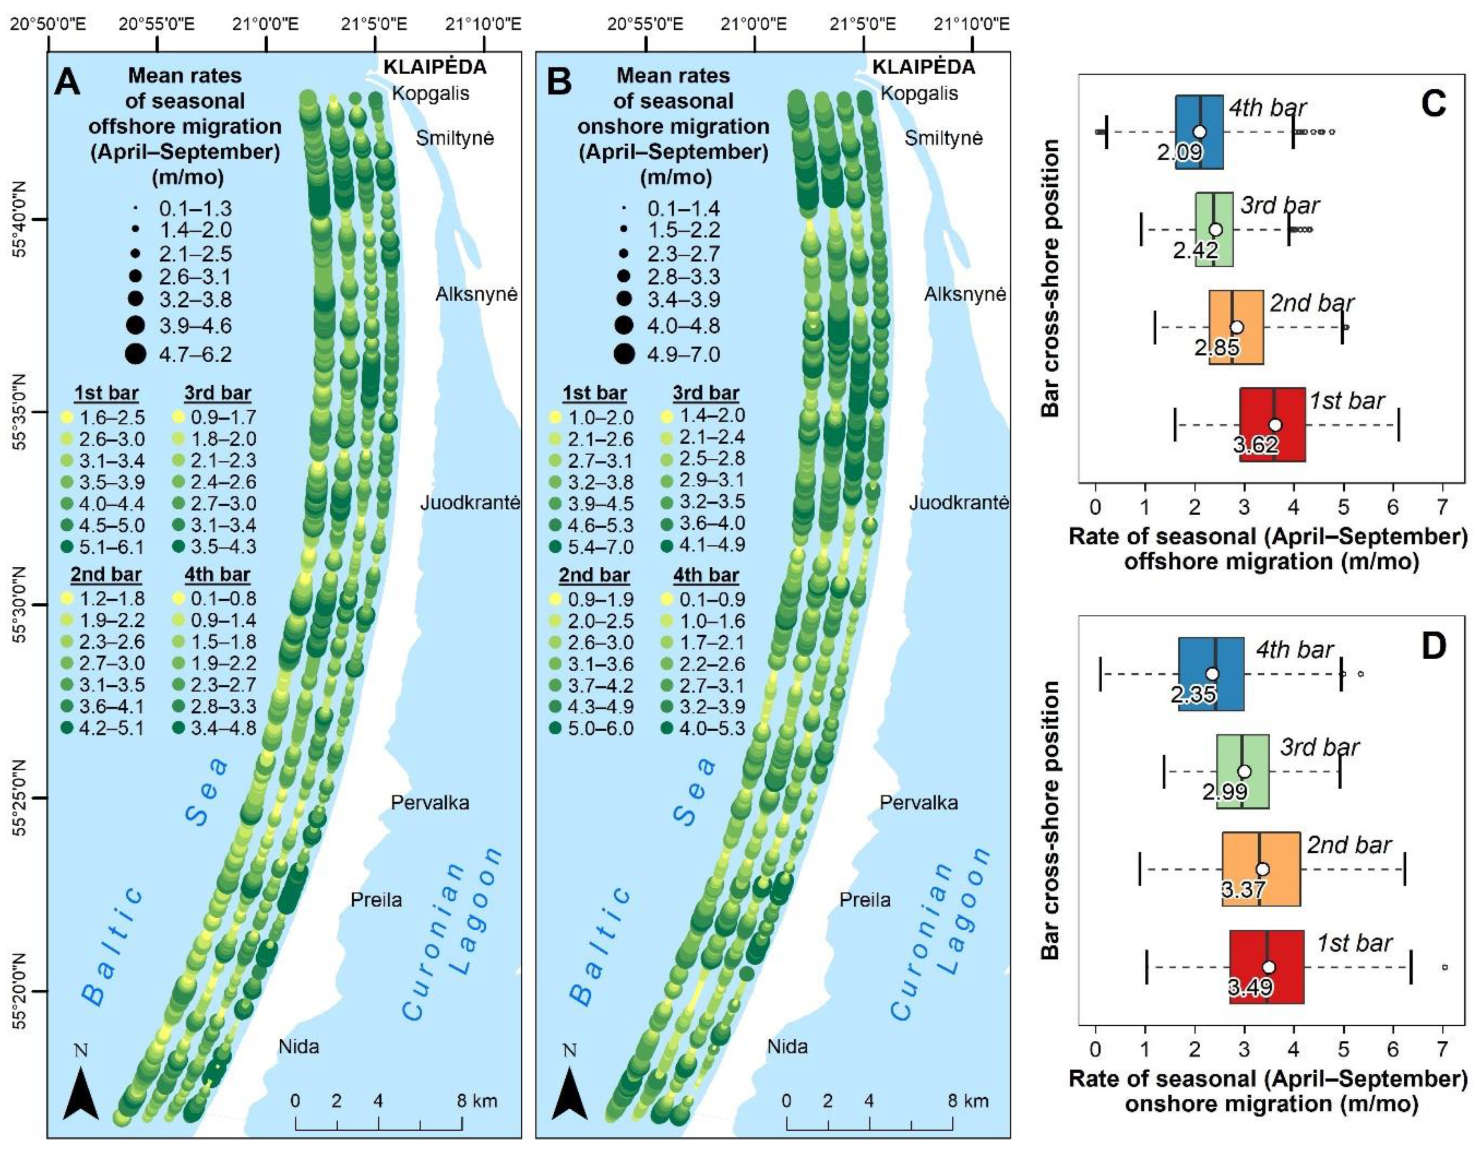
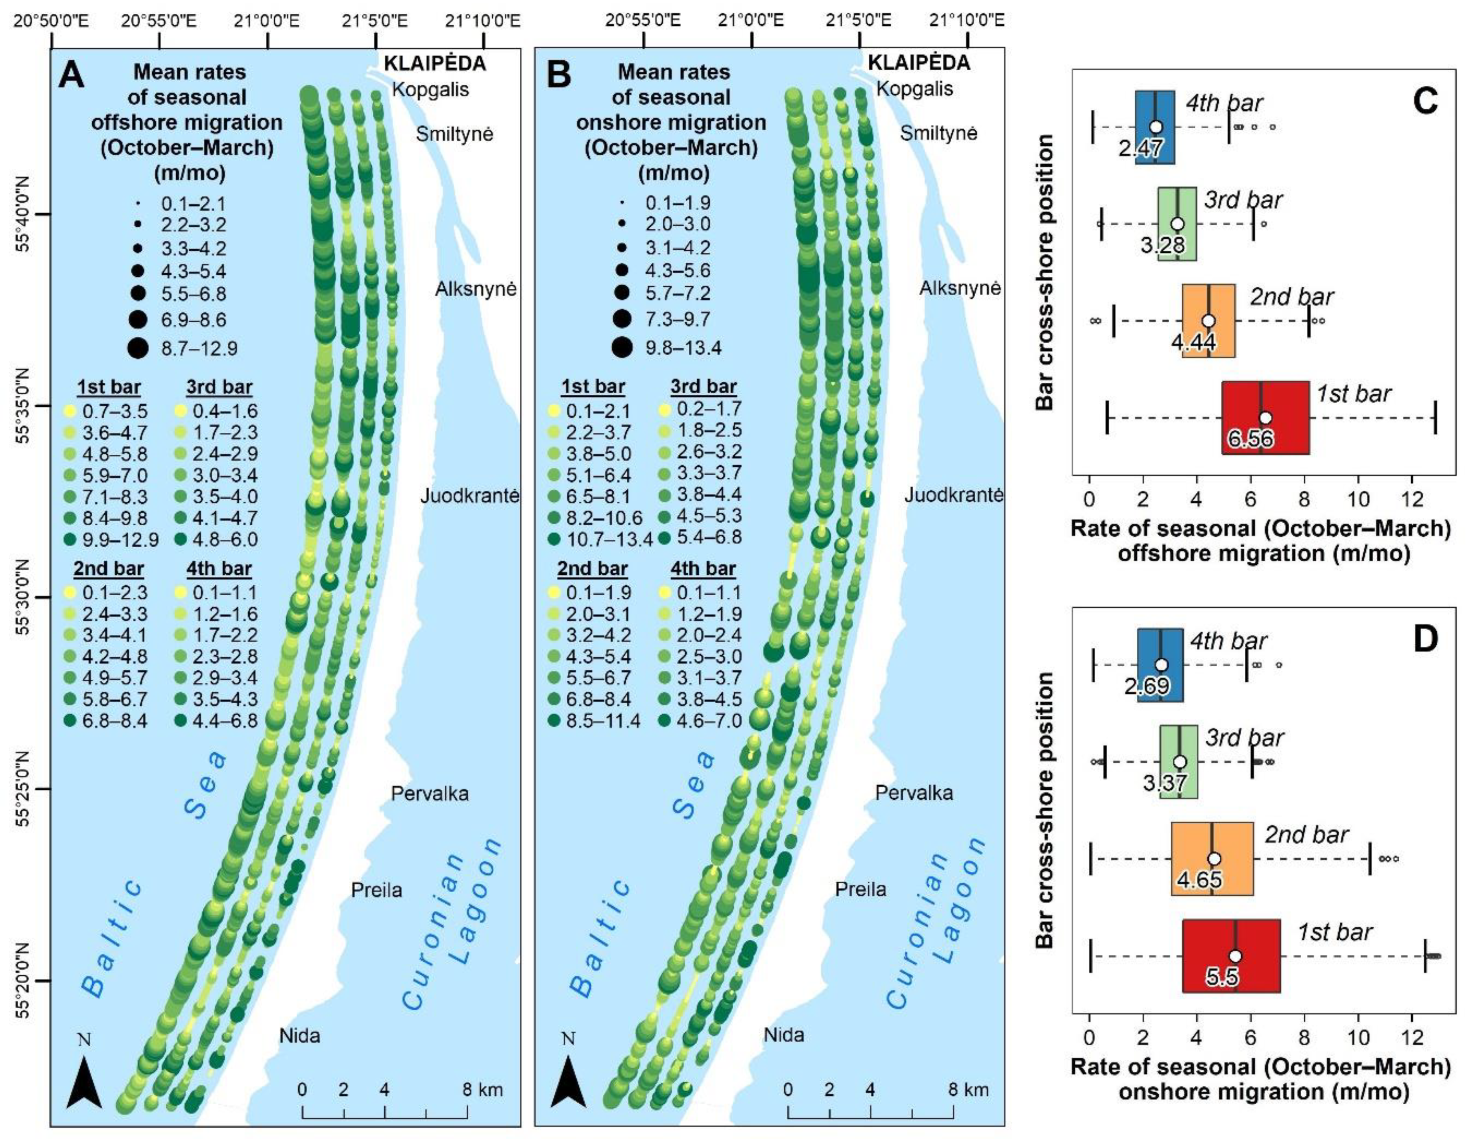
3.3. Seasonal Bar Cross-Shore Migration

3.3.1. Low-Wave-Energy Season

In the low-wave-energy season, comprising the months between April and October, ranges of time-averaged offshore ( V o f f l o w ) and onshore ( V o n l o w ) migration rates were similar: 0.1–6.2 m/mo and 0.1–7.0 m/mo, respectively, depending on bar cross- and alongshore positions (Figure 7A,B). In the north, between Kopgalis and Juodkrantė, bars exhibited higher rates of V o f f l o w and V o n l o w than in the rest of the study area. The rapid northern sector was characterised by the fastest part around Smiltynė and the slowest part around Alksnynė.
The time-averaged V o n l o w exceeded V o f f l o w in a slightly larger portion of the Curonian Spit for the second to fourth bars: in 54.6% of the profiles for the second bar, 54.1% for the third, and 57.4% for the fourth. However, for the first bar, time-averaged rates of V o n l o w were lower than V o f f l o w in 64.5% of the profiles. For the second to fourth bars, V o n l o w exceeded V o f f l o w the most between Alksnynė and Juodkrantė. For the first bar, the V o f f l o w was higher than V o n l o w the most around Alksnynė.
The overall average V o f f l o w ( V o f f l o w = 3.62 m/mo) was the highest for the first bar (Figure 7C), which was fastest-moving in the majority of the profiles (71.5%). The overall averages of V o f f l o w for the second, third, and fourth bars were 2.85 m/mo, 2.42 m/mo, and 2.09 m/mo, respectively (Figure 7C). On the contrary, the global averages of V o n l o w for the first and second bars were more similar (3.37–3.49 m/mo), while the third and fourth bars exhibited lower overall average rates of V o n l o w (2.35–2.99 m/mo) (Figure 7D). In terms of V o n l o w , the first and the second bars were the fastest in more than three quarters of the profiles. The first was the fastest around Juodkrantė and between Preila and Nida, the second around Smiltynė and Alksnynė, and in the rest of the study area, the fastest bars alternated without a consistent pattern. The fourth bar was the slowest in over a half of the profiles in both, V o n l o w and V o f f l o w , most evidently in the central sector of the study area. In the case of V o f f l o w , it alternated with the second and third bars in another half of the profiles, and with the first and third bars in the case of V o n l o w .

3.3.2. High-Wave-Energy Season

During the high-wave-energy season, comprising the months between October and March, the ranges of time-averaged offshore ( V o f f h i g h ) and onshore ( V o n h i g h ) migration rates were similar: 0.1–12.9 m/mo and 0.1–13.4 m/mo, respectively, depending on bar cross- and alongshore positions (Figure 8A,B). Globally, bars in the north exhibited higher time-averaged rates of V o f f h i g h and V o n h i g h than bars in the south. For the first bar, the highest offshore and onshore migration rates were observed between Smiltynė and Alksnynė, while other bars seemed to be faster between Alksnynė and Juodkrantė (Figure 8A,B).
The time-averaged V o f f h i g h exceeded V o n h i g h in the major part of the Curonian Spit for the first (in 64.5% of profiles) bar, but for other cross-shore positions, V o n h i g h was higher than V o f f h i g h in the larger share of profiles (53.5–57.4%).
The global average rates of V o f f h i g h depended on the bar cross-shore position, with the first bar demonstrating the highest average rate of 6.56 m/mo, and the fourth bar exhibiting the lowest average rate of 2.47 m/mo (Figure 8C). The first bar showed the highest rates of V o f f h i g h in 77.2% of the study area and dominated as the fastest almost along the entire study area except for the sector around Juodkrantė, where the second bar often surpassed the first bar. Together, the fourth and the third bars displayed the lowest rates of V o f f h i g h in 85.0% of the study area. Between Kopgalis and Pervalka, the fourth bar dominated as the slowest bar, whereas, in the remainder of the study area, the third bar was the slowest, occasionally alternating with other bars.
Analogous to the low wave energy season, the overall average rates of V o n h i g h were relatively similar for the first and the second bars (4.65–5.5 m/mo), while the third and the fourth bars demonstrated lower average rates of V o n h i g h (2.69–3.37 m/mo) (Figure 8D). Together, the first and second bars showed the highest rates of V o n h i g h in 83.0% of the profiles, whereas the third and the fourth bars displayed the lowest rates of V o n h i g h in 71.9% of profiles. The first bar dominated as the fastest in the major part of the Curonian Spit, except for the sector around Juodkrantė, where it was surpassed by the second bar. Between Kopgalis and Juodkrantė, the fourth bar emerged as the slowest in V o n h i g h , and in the rest of the Curonian Spit, it alternated with the second and the third bars.

3.4. Comparison of Bar Cross-Shore Migration on Seasonal and Interannual Timescales

Figure 9 shows cross comparisons of bar migration rates on timescales discussed in the previous sections. It shows that, during the months of high wave energy, the rates of seasonal migration in the first bar exceeded the rates of interannual migration in the larger part of the Curonian Spit (in 71.6% of the profiles for offshore and 59.4% for onshore migration). However, the rates of seasonal migration of the first bar during the months of low wave energy were lower than the rates of interannual migration in most of the Curonian Spit (in 92.1% of the profiles for offshore and 65.8% for onshore migration).
The offshore migration trends of other bars were similar: rates of seasonal displacements during the months of high wave energy exceeded the rates of interannual migration in most of the Curonian Spit (in 56.0–81.2% of the profiles), but the rates of interannual migration were higher than the seasonal rates during the months of low wave energy. The onshore migration rates for the second to fourth bars, on the other hand, were slightly different: the seasonal migration rates during the months of high wave energy exceeded the rates during the months of low wave energy in 58.6–73.1% of the profiles, and the seasonal rates during the months of low wave energy were higher than the rates of interannual onshore migration in 61.7–84.6% of the profiles. These results indicate that seasonal variations in bar cross-shore position during the high-wave-energy season account for the largest share of the cross-shore variability of the bars. This also implies that the largest share of bar cross-shore behaviour in the Curonian Spit is governed by high-wave-energy events.
With the increasing distance from the shoreline, the share of profiles, where the average seasonal migration rates exceeded the rates of the interannual bar movements, decreased slightly. This shows that, with the increasing distance from the shoreline, the seasonal cross-shore variability of the bars decreased slightly compared to the interannual variability.

3.5. Net Offshore Migration (NOM)

On an interannual timescale, bars in the Curonian Spit display a progressive offshore-directed cyclic behaviour, first described on the Dutch coast [15], and then followed by observations at many other sites worldwide [17,23,24,25,26]. Consistent with the Dutch model, bars in the Curonian Spit generate near the shoreline and subsequently move seaward and landward at rates described in the previous sections. On a multi-annual scale, bars migrate net offshore across the surf zone until they finally decay at the seaward limit of the nearshore. A time period, separating two consecutive bar decay events, is defined by the bar cycle return period ( T r ), estimated from the third complex mode as a result of the CEOF analysis. The average estimated T r in the Curonian Spit was 6.7 years. However, bar cycle return periods highly varied alongshore, ranging from 1.8 years in the north to 13.5 years in the south (Figure 10).
Bars between Kopgalis and Juodkrantė demonstrated shorter-than-average return periods (1.8–5.3 years), while from southern Juodkrantė to Nida, T r was longer than average (7–13.5 years) (Figure 10). Around the southern Juodkrantė, the return periods greatly varied and ranged from 4.3 to 9.6 years (Figure 10). During the study period, the 3.5 km-long southernmost nearshore sector showed no evident NOM-like behaviour, hence T r was not estimated here.
The outer bars decayed located at X o u t p e a k = 255–696 m ( X ˜ o u t p e a k = 472 m). They degenerated at positions furthest from the shoreline between 20 and 30 km from the Klaipėda port jetty ( X ˜ o u t p e a k = 552 m) and decayed closest to the shoreline at the northern end of the study area ( X ˜ o u t p e a k = 357 m). On the dates of X 1 s t = X o u t p e a k , middle (second) and inner bars were located at X m i d p e a k = 121–331 m ( X ˜ m i d p e a k = 208 m) and X i n n p e a k = 41–258 m ( X ˜ i n n p e a k = 67 m).

3.6. Similar Nearshore Bar Behaviour Regions

Wijnberg and Terwindt [53] introduced the concept of large-scale coastal behaviour (LSCB) regions, in which bars exhibit similar patterns of cross-shore temporal and morphological characteristics. The LSCB regions were based on changes in profile shape and cross-shore position determined from the long-term bathymetric dataset. Similarly, we sought to identify alongshore nearshore regions, which demonstrated similar features of bar cross-shore behaviour based on a cluster analysis of 36 satellite-derived characteristics of the multiple bar system at three spatial scales. Because of the differences in the nature of methodology, we refer to them as large-scale (L1), mid-scale (L2), and small-scale (L3) nearshore bar behaviour (NBB) regions. Identified NBB regions and their mean characteristics are given in Figure 11.
At the large-scale level, two NBB regions (L1-1 and L1-2) mainly divided the study area into southern (L1-2) and northern (L1-1) parts (Figure 11B). In the northern part, the average bar return periods were twice as short as in the southern part (4.3 and 9.0 years), bars exhibited higher rates of interannual and seasonal migration, nearshore contained a higher number of bars, narrower bar zone, and outer bars located closer to the shoreline (Figure 11A).
At the mid-scale level, four NBB regions (L2-1, L2-2, L2-3, and L2-4) were distinguished (Figure 11B). The central part of the study area emerged as L2-3 and L2-4 regions, separating the northern (L2-1) and southern (L2-2) parts. The cross-shore profiles that belonged to the faster northern sector (L1-1) at the large-scale level are attributed to the L2-3 region, and those belonging to the slower southern sector (L1-2) are assigned to the L2-4 region. Located closer to the north, the L2-4 region featured characteristics that were more similar to the northern NBB region (L2-1), while L2-3 was more similar to the southern NBB region (L2-2). However, in the L2-4 region, the bars demonstrated lower rates of interannual and seasonal offshore migration than in the L2-1 region. Meanwhile, bars in the L2-3 region exhibited lower rates of interannual offshore and seasonal onshore migration, but higher rates of interannual onshore and seasonal offshore migration than in the L2-2 region. In the northern (L2-1), central (L2-4 and L2-3), and southern NBB regions, the average return periods were 2.9, 6.0, 7.5, and 9.9 years, respectively. Bars in both central NBB regions (L2-3 and L2-4) were located further from the shoreline than in the southern (L2-2) and northern regions (L2-1) (Figure 11A).
At the smallest-scale level, six NBB regions (L3-1, L3-2, L3-3, L3-4, L3-5, and L3-6) were distinguished (Figure 11B). The fast northern NBB region (L2-1) was divided into L3-1 and L3-5 regions. The bars showed average return periods of just over 3 years in both small-scale northern NBB regions, but in the L3-1 region, the second to fourth bars were located relatively close to the shoreline, and in the L3-5 region, bars exhibited higher than the average distances from the shoreline (Figure 11A). Bars in L3-1 demonstrated mostly high rates of seasonal and average interannual migration rates. In contrast, the bars in L3-5 showed average-to-high seasonal migration rates and very high interannual migration rates, suggesting that the interannual timescale is more important in L3-5 and that the seasonal scale plays a more important role in L3-3. At this level, the L3-6 region emerged as a discontinuous NBB region incorporating two narrow sectors assigned with cross-shore profiles from the central L2-3 and southern L2-2 regions (Figure 11B). Bars in L3-6 demonstrated low rates of interannual and seasonal onshore migration and very low rates of seasonal offshore migration. The inner bar system in the L3-6 region was located closer to the shoreline than in the surrounding regions, while the outer bar system was located at the average distances from the shoreline (Figure 11). Although it was not among the clustering characteristics, it was previously observed that bars in locations of L3-6 often tend to switch [2], and this type of behaviour results in different bar characteristics than in the surrounding regions.

4. Discussion

4.1. General Patterns of Bar Cross-Shore Behaviour

Quantitative analysis of bar cross-shore migration shows that bars in the Curonian Spit migrated at rates up to 11.0 m/mo on an interannual timescale and up to 13.4 m/mo on a seasonal timescale. On an interannual timescale, the time-averaged offshore bar migration rates exceeded the rates of onshore bar migration, suggesting that bars in the Curonian Spit are gradually moving offshore over the years and display NOM-like behaviour, observed on many multi-barred coasts [7,15,17,24,25,26,27].
The cross-shore migration rates of the bars depended on their cross-shore position, with the first (outer) bar demonstrating the highest rates, while the fourth bar exhibited the lowest rates. While this pattern observed in the Curonian Spit is consistent with several other microtidal coasts [5,7], there are also documented cases of different distributions of migration speeds between bar cross-shore positions [54,55]. In the non-tidal setting of the Curonian Spit, wave action is the main driver that causes bar movements. As waves approach the shoreline, wave energy dissipation increases with each more shoreward located bar; therefore, the outer bar is exposed to the highest wave energy, resulting in its fastest motion [56]. The cross-shore mobility of the second to fourth bars, especially directed seaward, is also limited by the position of the outer bar.
On the seasonal timescale, the outer bar moved faster offshore during the months of high wave energy and displayed similar off- and on-shore migration rates during the months of low wave energy, while other bars moved faster onshore during the months of low wave energy and displayed similar off- and on-shore migration rates during the months of low wave energy. The seasonal variations in the cross-shore positions of the bars during the high wave energy season were the highest, implying that the largest share of bar cross-shore behaviour in the Curonian Spit is governed by the energetic wave conditions in the months between October and March. The breaking of high waves during these months induces a strong offshore-directed undertow, causing rapid bar offshore migration [10,19], which mostly contributes to the gradual interannuall offshore migration. The seasonal offshore migration during the less energetic months between April and September was mostly slower than the interannual migration, suggesting that processes during these months do not significantly influence offshore bar movement on an interannual timescale. For the second to fourth bars, seasonal onshore migration during the months of both high and low wave energy exceeded interannual onshore migration, hence hydrodynamic processes in these two seasons appear to be important for onshore migration on an interannual timescale. For the outer bar, however, only rates of onshore migration during months of energetic wave conditions exceeded the interannual migration. The reason for this might be that the outer bar is often too deep to be affected by nearshore hydrodynamics during the months of low wave energy. Therefore, its onshore movement on an interannual timescale is mostly governed by onshore migration during the months of high wave energy.
In the Curonian Spit, the rates of bar cross-shore movements may also have been affected by the three-dimensional behaviour of the bars. During bar switching episodes, which frequently occur in the Curonian Spit, the cross-shore positions of the bars change significantly [2]. Similarly, bars in the Curonian Spit often develop irregular crescentic or sinuous shapes visible in satellite imagery; the development of these shapes may also be the cause of the landward bar movements at the bar horns and seaward bar movements at the bays, especially during the months of low wave energy, when the formation of such shapes is most probable [6,57].

4.2. Factors Determining the Alongshore Variability of Morphological and Temporal Characteristics of Bars

The study results show high alongshore variability in bar cycle return periods ( T r ), migration rates, and bar morphology. The duration of the bar cycle return period increases, while bar migration and bar count rates decrease from north to south along the Curonian Spit. This is reflected in the large-scale NBB regions identified in this study, which divided the Curonian Spit into faster northern and slower southern sectors (Figure 11). Previous studies on multi-barred coasts have suggested that alongshore variations in T r and bar migration are related to the depth range of the bar zone [25,30], nearshore slope [31], bar size, or the width of the bar zone [24,25]. To identify possible factors determining such variations at the current study site, a linear regression analysis was performed between T r , time-averaged bar migration rates ( V o n , V o f f , V o n l o w , V o f f l o w , V o n h i g h , V o f f h i g h ), bar zone morphological (bar zone width ( W b z ), volume ( S b z ), depth range ( D b z ), depth at the seaward limit of the bar zone ( D s e a ), bar count ( N b ), the total number of observed bar switching episodes ( N s w i t c h )) and environmental parameters (overall mean significant wave height ( H w ), mean significant wave height in April–September ( H w l o w ) and October–March ( H w h i g h ), mean wave period ( T w ), mean deviation of wave direction from a shore-perpendicular angle ( α w ), and shoreline compass angle ( α s h o r e l i n e )).
A strong statistically significant ( p < 0.05) linear correlation was observed between bar cycle return periods and depth-related ( D b z , D s e a ), bar-size-related ( W b z , Sbz), and wave-related ( α w , H w , H w h i g h , H w l o w , T w ) parameters in the Curonian Spit (Figure 12A). A moderate correlation coefficient was found between T r and α s h o r e l i n e , N b , N s w i t c h . Time-averaged bar migration rates had a negative linear relationship with T r -increasing parameters, but the correlation was weaker than with T r and, in some cases, statistically insignificant (Figure 12A).
In general, these findings show that, in a wider and deeper bar zone with larger volume bars, T r is longer and bars move slower than in a narrower and shallower bar zone with smaller volume bars but a greater number of bars. Ruessink et al. [30] found that T r increases by 4 years when D b z increases by 1 m. Here, similar results were found with an increase of 3.7 years/m, implying that a similar rule applies to both tidal and non-tidal environments.
With higher waves, longer wave periods, and waves propagating more obliquely with respect to the shoreline, the bar return periods also tend to be prolonged, although the alongshore variations of H w and T w in the Curonian Spit are relatively low (≈0.4 m and ≈0.6 s) (Figure 4B).
How these parameters affect the alongshore variability of bar dynamics is determined by the prevalent hydrodynamic processes and their interaction with the shoreline orientation. Predominant wind directions from west and south–west [45] and the shifting of the shoreline orientation from SW-NE to S-N (Figure 1A) cause a more oblique wave incidence angle southward of the study area (Figure 4C). Oblique waves cause stronger longshore currents, and in combination, they produce stronger longshore sediment transport in the southern part of the Curonian Spit than in the northern part between Alksnynė and Kopgalis, where cross-shore sediment transport prevails. The longshore distribution of sand grain fractions in the Curonian Spit supports the assumption of stronger longshore sediment transport to its southern part [58].
Generally, larger S b z , W b z , H w , and α w with a steeper nearshore slope are observed in the southern large-scale NBB region than in the northern region (Table 2). It is well-known that oblique wave energy, frequently observed in the southern NBB region, straightens longshore bars [59,60,61]. Therefore, the nearshore morphology results in well-pronounced bars with deeper continuous troughs. Higher waves activate greater amounts of sediment at greater depths, resulting in the formation of larger volume bars. Bars with a larger volume respond more slowly to wave forcing than smaller bars [62]; therefore, specific wave conditions may have to last longer for bars to change. Additionally, it was estimated that bars migrate cross-shore at a maximum rate under shore-normal wave incidence [63]. As a result, larger bar volumes and waves with high angles of incidence reduce the cross-shore mobility of bars, leading to longer T r and slower bar motion in the southern NBB region. On the contrary, from Kopgalis to Alksnynė, where cross-shore sediment transport prevails, the bars are smaller with better-pronounced crescentic morphologies, resulting in a shorter T r and faster bar motion in the northern NBB region. Analogous dependencies of bar temporal and environmental characteristics are observed in mid- and small-scale NBB regions (Figure 11; Table 2). These results suggest that small alongshore variations in nearshore hydrodynamics, caused by local wave climate and its interaction with the shoreline orientation, decide the morphological and temporal characteristics of the multi-bar system in the Curonian Spit. This is also evident in the identified NBB regions, whose boundaries are mostly located where shoreline orientation shifts (Figure 11B). The importance of the interaction between shoreline orientation and local wave climate in decadal bar evolution was also recently observed on a single-bar microtidal coast [36].

4.3. Accuracy and Limitations of Satellite-Derived Temporal Characteristics of Bars

This study suggests a methodology to analyse cross-shore morphology and dynamics of bars solely based on optical satellite data as an alternative to resource-intensive bathymetric surveys or other state-of-the-art remote sensing techniques such as video monitoring. Previous studies have proven satellite-derived bar positions to be an accurate measure of bar morphology [38,39,40,42]. However, clouds, haze, and water turbidity, all of which limit water clarity, have a significant impact on the quality of satellite-derived data. Nonetheless, the nearly daily frequency of satellite observations helps to select only good-quality data (cloud- and wave-free) for the monthly observations required for the proposed analysis mechanism, especially between March and October. The Curonian Spit, on the other hand, rarely has cloudless and wave-free days between November and February. Because there are only a few bar observations during these months, the seasonal characteristics of bars in the high-wave-energy season are mostly based on observations from March and October. Moreover, the analysis only covers from 2011 to 2021, which is three years less than the maximum estimated T r in the study area, and thus may not fully reflect the variability of the multi-bar system, where T r   > 10 years.
The algorithm used to derive bar data was found to be better at detecting inner-bar morphologies in the shallowest nearshore regions (depths < 1 m), where echo-sounding techniques tend to fail, but it can overlook decaying bars at depths greater than 6 m [39]. This means that the outer bar may decay sooner from a satellite-derived RBPI profile than from a bathymetric profile, resulting in a shorter satellite-derived bar life span. Though it may cause the location of the bar decay to shift shoreward, the bar cycle return period, which indicates the time between two successive bar decay events, should remain precise. Figure 13 illustrates that RBPI-derived perturbations are less pronounced on the outer bar and more pronounced on the inner and middle bars than bathymetry-derived perturbations.

5. Conclusions

This study examines intra-site variations in the cross-shore morphological and temporal characteristics of a multiple bar system on a 51-km-long sandy barrier, using satellite-derived data. The study suggests a methodology for the analysis of bar cross-shore behaviour solely based on satellite imagery, without the need for in situ measurements. This proves that RBPI-derived data can be treated in a similar way to the traditional cross-shore bathymetric profiles.
A triple–quadruple-bar system with a well-known multi-annual progressive offshore-directed cyclic behaviour was observed at the study site. Bar cycle return periods ranging from 1.8 to 13.5 years were estimated along with NOM phase-related bar characteristics. To our knowledge, this is the first time NOM-like behaviour that has been documented on the south-eastern coast of the Baltic Sea, showing that this model of multi-annual bar behaviour is also applicable in this region and demonstrating the potential of satellite remote sensing in the exploration of the bars in coastal regions that are understudied. Seaward and landward migration of the first to fourth bars was quantified on interannual and seasonal timescales, showing that bars exhibited the highest migration rates on a seasonal timescale during the months of high wave energy. Cross-shore migration rates depended on the cross-shore position of the bars, with the outer bar migrating fastest, as observed on several other microtidal coasts. The interannual offshore migration of the bars outpaced onshore migration, while the seasonal offshore migration exceeded onshore migration for the outer bar only.
In general, bar cycle return periods increased and migration rates decreased from north to south in the study area. This is exemplified by the identified nearshore bar behaviour regions, which, at the largest scale, subdivide the Curonian Spit into faster northern and slower southern regions. Strong significant correlation rates were found between the temporal characteristics of the bars and the variables whose values increase southward of the Curonian Spit, including bar zone depth, bar size, wave height, and wave obliquity. The study results suggest that the interaction between shoreline orientation and small alongshore differences in nearshore hydrodynamics determines the alongshore variability of the morphological and temporal characteristics of the nearshore bars.
The study expands the knowledge of the large-extent cross-shore behaviour of multi-bar systems with more than two or three bars on the non-tidal coasts and illustrates the capabilities of optical satellite remote sensing in the field of nearshore morphodynamics. Nearshore bar systems on other tideless and microtidal coasts could be explored, using the combination of satellite imagery and analysis mechanism, proposed in this study. This could lead to new insights into nearshore bar behaviour, particularly at sites previously overlooked due to an absence of bar data.

Author Contributions

Conceptualization, R.J. and L.J.; methodology, R.J.; formal analysis, R.J.; investigation, R.J., D.J., L.J., D.P. and G.Ž.; resources, L.J. and G.Ž.; data curation, R.J. and D.P.; writing—original draft preparation, R.J.; writing—review and editing, D.J. and L.J.; visualization, R.J.; supervision, D.J. All authors have read and agreed to the published version of the manuscript.

Funding

This research received no external funding.

Data Availability Statement

The data presented in this study are available on request from the corresponding author. The data are not publicly available due to the Data Use Agreement with Planet Labs.

Conflicts of Interest

The authors declare no conflict of interest.

References

  1. Wijnberg, K.M.; Kroon, A. Barred beaches. Geomorphology 2002, 48, 103–120. [Google Scholar] [CrossRef]
  2. Janušaitė, R.; Jarmalavičius, D.; Pupienis, D.; Žilinskas, G.; Jukna, L. Nearshore sandbar switching episodes and their relationship with coastal erosion at the Curonian Spit, Baltic Sea. Oceanologia 2021, in press. [CrossRef]
  3. Phillips, M.S.; Harley, M.D.; Turner, I.L.; Splinter, K.D.; Cox, R.J. Shoreline recovery on wave-dominated sandy coastlines: The role of sandbar morphodynamics and nearshore wave parameters. Mar. Geol. 2017, 385, 146–159. [Google Scholar] [CrossRef]
  4. Van de Lageweg, W.I.; Bryan, K.R.; Coco, G.; Ruessink, B.G. Observations of shoreline-sandbar coupling on an embayed beach. Mar. Geol. 2013, 344, 101–114. [Google Scholar] [CrossRef]
  5. Van Enckevort, I.M.J.; Ruessink, B.G. Video observations of nearshore bar behaviour. Part 1: Alongshore uniform variability. Cont. Shelf Res. 2003, 23, 501–512. [Google Scholar] [CrossRef]
  6. Van Enckevort, I.M.J.; Ruessink, B.G.; Coco, G.; Suzuki, K.; Turner, I.L.; Plant, N.G.; Holman, R.A. Observations of nearshore crescentic sandbars. J. Geophys. Res. C Ocean. 2004, 109, C06028. [Google Scholar] [CrossRef]
  7. Melito, L.; Parlagreco, L.; Perugini, E.; Postacchini, M.; Devoti, S.; Soldini, L.; Zitti, G.; Liberti, L.; Brocchini, M. Sandbar dynamics in microtidal environments: Migration patterns in unprotected and bounded beaches. Coast. Eng. 2020, 161, 103768. [Google Scholar] [CrossRef]
  8. Hsu, T.J.; Elgar, S.; Guza, R.T. Wave-induced sediment transport and onshore sandbar migration. Coast. Eng. 2006, 53, 817–824. [Google Scholar] [CrossRef] [Green Version]
  9. Hoefel, F.; Elgar, S. Wave-Induced Sediment Transport and Sandbar Migration. Science 2003, 299, 1885–1887. [Google Scholar] [CrossRef] [Green Version]
  10. Gallagher, E.L.; Elgar, S.; Guza, R.T. Observations of sand bar evolution on a natural beach. J. Geophys. Res. Ocean. 1998, 103, 3203–3215. [Google Scholar] [CrossRef] [Green Version]
  11. Sallenger, A.H.; Holman, R.A.; Birkemeier, W.A. Storm-induced response of a nearshore-bar system. Mar. Geol. 1985, 64, 237–257. [Google Scholar] [CrossRef]
  12. Ostrowski, R.; Pruszak, Z.; Zeidler, R.B. Multi-scale nearshore & beach changes. In Proceedings of the Coastal Engineering Conference, Auckland, New Zealand, 2–6 December 1991; Volume 2, pp. 2101–2116. [Google Scholar]
  13. Vidal-Ruiz, J.A.; Ruiz de Alegría-Arzaburu, A. Variability of sandbar morphometrics over three seasonal cycles on a single-barred beach. Geomorphology 2019, 333, 61–72. [Google Scholar] [CrossRef]
  14. Larson, M.; Kraus, N.C. Temporal and spatial scales of beach profile change, Duck, North Carolina. Mar. Geol. 1994, 117, 75–94. [Google Scholar] [CrossRef]
  15. Ruessink, B.G.; Kroon, A. The behaviour of a multiple bar system in the nearshore zone of Terschelling, The Netherlands: 1965–1993. Mar. Geol. 1994, 121, 187–197. [Google Scholar] [CrossRef]
  16. Shand, R.D.; Bailey, D.G. A review of net offshore bar migration with photographic illustrations from Wanganui, New Zealand. J. Coast. Res. 1999, 15, 365–378. [Google Scholar]
  17. Aleman, N.; Certain, R.; Robin, N.; Barusseau, J.P. Morphodynamics of slightly oblique nearshore bars and their relationship with the cycle of net offshore migration. Mar. Geol. 2017, 392, 41–52. [Google Scholar] [CrossRef]
  18. Ruessink, B.G.; Pape, L.; Turner, I.L. Daily to interannual cross-shore sandbar migration: Observations from a multiple sandbar system. Cont. Shelf Res. 2009, 29, 1663–1677. [Google Scholar] [CrossRef]
  19. Elgar, S.; Gallagher, E.L.; Guza, R.T. Nearshore sandbar migration. J. Geophys. Res. Ocean. 2001, 106, 11623–11627. [Google Scholar] [CrossRef]
  20. Almar, R.; Castelle, B.; Ruessink, B.G.; Senechal, N.; Bonneton, P.; Marieu, V. High-frequency video observation of two nearby double-barred beaches under high-energy wave forcing. J. Coast. Res. 2009, 2009, 1706–1710. [Google Scholar]
  21. Houser, C.; Greenwood, B. Onshore migration of a swash bar during a storm. J. Coast. Res. 2007, 23, 1–14. [Google Scholar] [CrossRef]
  22. Aagaard, T.; Nielsen, J.; Greenwood, B. Suspended sediment transport and nearshore bar formation on a shallow intermediate-state beach. Mar. Geol. 1998, 148, 203–225. [Google Scholar] [CrossRef]
  23. Plant, N.G.; Holman, R.A.; Freilich, M.H.; Birkemeier, W.A. A simple model for interannual sandbar behavior. J. Geophys. Res. Ocean. 1999, 104, 15755–15776. [Google Scholar] [CrossRef]
  24. Shand, R.D.; Shepherd, M.J.; Bailey, D.G. An inter-site comparison of net offshore bar migration characteristics and environmental conditions. J. Coast. Res. 1999, 15, 750–765. [Google Scholar]
  25. Tătui, F.; Vespremeanu-Stroe, A.; Ruessink, G.B. Alongshore variability of cross-shore bar behavior on a nontidal beach. Earth Surf. Processes Landf. 2016, 41, 2085–2097. [Google Scholar] [CrossRef]
  26. Kuriyama, Y. Medium-term bar behavior and associated sediment transport at Hasaki, Japan. J. Geophys. Res. Ocean. 2002, 107, 15-1–15-12. [Google Scholar] [CrossRef]
  27. Yuhi, M.; Okada, M. Long-term field observations of multiple bar properties on an eroding coast. J. Coast. Res. 2011, 64, 860–864. [Google Scholar] [CrossRef]
  28. Aagaard, T.; Davidson-Arnott, R.; Greenwood, B.; Nielsen, J. Sediment supply from shoreface to dunes: Linking sediment transport measurements and long-term morphological evolution. Geomorphology 2004, 60, 205–224. [Google Scholar] [CrossRef]
  29. Anthony, E.J.; Vanhee, S.; Ruz, M.H. Short-term beach-dune sand budgets on the north sea coast of France: Sand supply from shoreface to dunes, and the role of wind and fetch. Geomorphology 2006, 81, 316–329. [Google Scholar] [CrossRef]
  30. Ruessink, B.G.; Wijnberg, K.M.; Holman, R.A.; Kuriyama, Y.; van Enckevort, I.M.J. Intersite comparison of interannual nearshore bar behavior. J. Geophys. Res. C Ocean. 2003, 108, 3249–3260. [Google Scholar] [CrossRef]
  31. Walstra, D.-J.; Wesselman, D.; van der Deijl, E.; Ruessink, G. On the Intersite Variability in Inter-Annual Nearshore Sandbar Cycles. J. Mar. Sci. Eng. 2016, 4, 15. [Google Scholar] [CrossRef] [Green Version]
  32. Grunnet, N.M.; Hoekstra, P. Alongshore variability of the multiple barred coast of Terschelling, The Netherlands. Mar. Geol. 2004, 203, 23–41. [Google Scholar] [CrossRef]
  33. Aleman, N.; Robin, N.; Certain, R.; Barusseau, J.-P.; Gervais, M. Net offshore bar migration variability at a regional scale: Inter-site comparison (Languedoc-Roussillon, France). J. Coast. Res. 2013, 165, 1715–1720. [Google Scholar] [CrossRef]
  34. Aagaard, T.; Kroon, A.; Greenwood, B.; Hughes, M.G. Observations of offshore bar decay: Sediment budgets and the role of lower shoreface processes. Cont. Shelf Res. 2010, 30, 1497–1510. [Google Scholar] [CrossRef]
  35. Di Leonardo, D.; Ruggiero, P. Regional scale sandbar variability: Observations from the U.S. Pacific Northwest. Cont. Shelf Res. 2015, 95, 74–88. [Google Scholar] [CrossRef]
  36. Gijsman, R.; Ruessink, B.G.; Visscher, J.; Schlurmann, T. Observations on decadal sandbar behaviour along a large-scale curved shoreline. Earth Surf. Processes Landf. 2021, 46, 490–503. [Google Scholar] [CrossRef]
  37. Masselink, G.; Austin, M.; Scott, T.; Poate, T.; Russell, P. Role of wave forcing, storms and NAO in outer bar dynamics on a high-energy, macro-tidal beach. Geomorphology 2014, 226, 76–93. [Google Scholar] [CrossRef] [Green Version]
  38. Tătui, F.; Constantin, S. Nearshore sandbars crest position dynamics analysed based on Earth Observation data. Remote Sens. Environ. 2020, 237, 111555. [Google Scholar] [CrossRef]
  39. Janušaitė, R.; Jukna, L.; Jarmalavičius, D.; Pupienis, D.; Žilinskas, G. A Novel GIS-Based Approach for Automated Detection of Nearshore Sandbar Morphological Characteristics in Optical Satellite Imagery. Remote Sens. 2021, 13, 2233. [Google Scholar] [CrossRef]
  40. Román-Rivera, M.A.; Ellis, J.T.; Wang, C. Applying a rule-based object-based image analysis approach for nearshore bar identification and characterization. J. Appl. Remote Sens. 2020, 14, 044502. [Google Scholar] [CrossRef]
  41. Do, J.D.; Jin, J.-Y.; Jeong, W.M.; Lee, B.; Kim, C.H.; Chang, Y.S. Observation of nearshore crescentic sandbar formation during storm wave conditions using satellite images and video monitoring data. Mar. Geol. 2021, 442, 106661. [Google Scholar] [CrossRef]
  42. Athanasiou, P.; de Boer, W.; Yoo, J.; Ranasinghe, R.; Reniers, A. Analysing decadal-scale crescentic bar dynamics using satellite imagery: A case study at Anmok beach, South Korea. Mar. Geol. 2018, 405, 1–11. [Google Scholar] [CrossRef] [Green Version]
  43. Román-Rivera, M.A.; Ellis, J.T. A synthetic review of remote sensing applications to detect nearshore bars. Mar. Geol. 2019, 408, 144–153. [Google Scholar] [CrossRef]
  44. Kelpšaite, L.; Dailidiene, I.; Soomere, T. Changes in wave dynamics at the south-eastern coast of the Baltic Proper during 1993–2008. Boreal Environ. Res. 2011, 16, 220–232. [Google Scholar]
  45. Jakimavičius, D.; Kriaučiūnienė, J.; Šarauskienė, D. Assessment of wave climate and energy resources in the Baltic Sea nearshore (Lithuanian territorial water). Oceanologia 2018, 60, 207–218. [Google Scholar] [CrossRef]
  46. EU. Copernicus Marine Service Information Baltic Sea Wave Hindcast. Available online: https://resources.marine.copernicus.eu/product-detail/BALTICSEA_REANALYSIS_WAV_003_015/INFORMATION (accessed on 18 May 2022). [CrossRef]
  47. Jarmalavičius, D.; Pupienis, D.; Žilinskas, G.; Janušaite, R.; Karaliunas, V. Beach-foredune sediment budget response to sea level fluctuation. Curonian Spit, Lithuania. Water 2020, 12, 583. [Google Scholar] [CrossRef] [Green Version]
  48. Janušaitė, R.; Jukna, L. Morphology of Curonian Spit Nearshore Zone Bars. Ann. Geogr. 2017, 50, 3–20. [Google Scholar]
  49. Žilinskas, G.; Janušaitė, R.; Jarmalavičius, D.; Pupienis, D. The impact of Klaipėda Port entrance channel dredging on the dynamics of coastal zone, Lithuania. Oceanologia 2020, 62, 489–500. [Google Scholar] [CrossRef]
  50. Planet Team Planet Application Program Interface: In Space for Life on Earth. Available online: https://api.planet.com/ (accessed on 9 May 2021).
  51. Newman, D.R.; Lindsay, J.B.; Cockburn, J.M.H. Evaluating metrics of local topographic position for multiscale geomorphometric analysis. Geomorphology 2018, 312, 40–50. [Google Scholar] [CrossRef]
  52. Short, A.D. Beach systems of the central Netherlands coast: Processes, morphology and structural impacts in a storm driven multi-bar system. Mar. Geol. 1992, 107, 103–132. [Google Scholar] [CrossRef]
  53. Wijnberg, K.M.; Terwindt, J.H.J. Extracting decadal morphological behaviour from high-resolution, long-term bathymetric surveys along the Holland coast using eigenfunction analysis. Mar. Geol. 1995, 126, 301–330. [Google Scholar] [CrossRef]
  54. Larson, M.; Kraus, N.C. Dynamics of longshore bars. In Proceedings of the Coastal Engineering Conference, Venice, Italy, 4–9 October 1992; Volume 2, p. 2219. [Google Scholar]
  55. Goulart, E.S.; Calliari, L.J. Medium-term morphodynamic behavior of a multiple sand bar beach. J. Coast. Res. 2013, 165, 1774–1779. [Google Scholar] [CrossRef] [Green Version]
  56. Alexander, P.S.; Holman, R.A. Quantification of nearshore morphology based on video imaging. Mar. Geol. 2004, 208, 101–111. [Google Scholar] [CrossRef]
  57. Wright, L.D.; Short, A.D. Morphodynamic variability of surf zones and beaches: A synthesis. Mar. Geol. 1984, 56, 93–118. [Google Scholar] [CrossRef]
  58. Žilinskas, G.; Jarmalavičius, D. Interrelation of morphometric parameters of the submarine shore slope of the Curonian Spit, Lithuania. Baltica 2007, 20, 46–52. [Google Scholar]
  59. Garnier, R.; Falqués, A.; Calvete, D.; Thiébot, J.; Ribas, F. A mechanism for sandbar straightening by oblique wave incidence. Geophys. Res. Lett. 2013, 40, 2726–2730. [Google Scholar] [CrossRef] [Green Version]
  60. Gu, Z.; Zhang, C.; Zheng, J. Influences of wave forcing and morphological variability on the evolution of a double-sandbar system. Proc. Inst. Mech. Eng. Part M J. Eng. Marit. Environ. 2016, 230, 467–480. [Google Scholar] [CrossRef]
  61. De Swart, R.L.; Ribas, F.; Simarro, G.; Guillén, J.; Calvete, D. The role of bathymetry and directional wave conditions on observed crescentic bar dynamics. Earth Surf. Processes Landf. 2021, 46, 3252–3270. [Google Scholar] [CrossRef]
  62. Smit, M.W.J.; Reniers, A.J.H.M.; Ruessink, B.G.; Roelvink, J.A. The morphological response of a nearshore double sandbar system to constant wave forcing. Coast. Eng. 2008, 55, 761–770. [Google Scholar] [CrossRef]
  63. Dubarbier, B.; Castelle, B.; Marieu, V.; Ruessink, G. Process-based modeling of cross-shore sandbar behavior. Coast. Eng. 2015, 95, 35–50. [Google Scholar] [CrossRef]
Figure 1. Configuration (A) and location (B) of the Curonian Spit (adapted from Janušaitė et al. [2,39]). Panels (C,D) contain PlanetScope images showing the typical bar morphologies at Smiltynė (C) and Nida (D). Panels (EG) display wave roses of the Curonian Spit in 2011–2021, derived from the Copernicus Baltic Sea wave reanalysis data [46] for the entire year (E), high- (F) and low- (G) wave-energy seasons.
Remotesensing 14 03423 g001
Figure 2. Flowchart describing the process of nearshore bar data extraction and analysis (RBPI*—Relative Bathymetric Position Index).
Remotesensing 14 03423 g002
Figure 3. An example time series of filtered profiles of Relative Bathymetric Position Index (RBPI). The NOM pattern is clearly detectable in the time series.
Remotesensing 14 03423 g003
Figure 4. Space-time maps of perturbations in a single cross-shore profile of Relative Bathymetric Position Index (RBPI): (A) gappy monthly data (gaps are marked in grey); (B) data filled with a linear-weighted moving average; (C) data filtered with fast Fourier transform and discrete wavelet transform.
Remotesensing 14 03423 g004
Figure 5. Morphological characteristics of the multi-bar system in the Curonian Spit: (A) alongshore variations in monthly bar distances from the shoreline by bar cross-shore position; (B) distribution of bar distances from the shoreline by bar cross-shore position; (C) alongshore variations in bar zone widths; (D) alongshore variations in bar count mode.
Remotesensing 14 03423 g005
Figure 6. Alongshore variability in rates (m/month) of interannual offshore (A) and onshore (B) migration. The colour scale indicates mean interannual migration rates for different bar cross-shore positions (1st to 4th bar). It is set separately for each position and explained by the legend below the underlines. The 1st bar is depicted furthest from the shore and the 4th bar–closest. Boxplots illustrate the statistical distribution of interannual offshore (C) and onshore (D) migration rates by the cross-shore position of the bars.
Remotesensing 14 03423 g006
Figure 7. Alongshore variability in rates (m/month) of seasonal offshore (A) and onshore (B) migration in April–September. The colour scale indicates seasonal migration rates in April–September for different bar cross-shore positions (1st to 4th bar). It is set separately for each position and explained by the legend below the underlines. The 1st bar is depicted furthest from the shore and the 4th bar–closest. Boxplots illustrate the statistical distribution of the seasonal offshore (C) and onshore (D) migration rates by the cross-shore position of the bars.
Remotesensing 14 03423 g007
Figure 8. Alongshore variability in seasonal bar offshore (A) and onshore (B) migration rates (m/month) from October to March. The colour scale indicates mean seasonal migration rates in October–March for different bar cross-shore positions (1st to 4th bar). It is set separately for each position and explained by the legend below the underlines. The 1st bar is depicted furthest from the shore and the 4th bar–closest. Boxplots on the right illustrate the statistical distribution of the seasonal offshore (C) and onshore (D) migration rates by the cross-shore position of the bars.
Remotesensing 14 03423 g008
Figure 9. Comparison of bar cross-shore migration rates on different timescales. The orange in the figure indicates the number of cross-shore profiles where the average migration rates on the timescale on the left side of the greater-than sign exceeded the rates on the timescale on the right side; pale yellow indicates where the right side exceeded the left side.
Remotesensing 14 03423 g009
Figure 10. Alongshore variability in the bar cycle return periods ( T r ).
Remotesensing 14 03423 g010
Figure 11. Large- (Level 1, L1), middle- (Level 2, L2), and small (Level 3, L3)-scale nearshore bar behaviour (NBB) regions in the Curonian Spit: (A) mean temporal and morphological bar characteristics in NBB regions; (B) location of the NBB regions.
Remotesensing 14 03423 g011
Figure 12. The relationship between temporal bar characteristics and environmental variables (A). Numbers in black indicate statistically significant correlation rates (with 95% confidence), and numbers in grey indicate statistically insignificant rates. The size of the number shows the magnitude of the correlation. Panels (B,C) display alongshore variability in the mean significant wave height (B) and the mean deviation of wave direction from the shore-normal angle (C) in the Curonian Spit in 2011–2021.
Remotesensing 14 03423 g012
Figure 13. Cross-shore profiles of bathymetry-derived and RBPI-derived perturbations (values were standardised for comparison) at different alongshore locations in the Curonian Spit. Bathymetric surveys were conducted on the 19 May 2019, and a satellite image was acquired on the 22 May 2019.
Remotesensing 14 03423 g013
Table 1. The abbreviations for the temporal and morphological parameters of the nearshore bars used in this study. The subscripts 1st, 2nd, 3rd, and 4th indicate if the parameter applies to the first, second, third, or fourth bar. Offshore and onshore bar migration rates were calculated in metres per month (m/mo).
ParameterAbbreviation
Bar cycle return period T r
Bar distances from shoreline X 1 s t ,   X 2 n d ,   X 3 r d ,   X 4 t h
Bar count (mode) N b
Bar zone width W b z
Rate of interannual offshore migration V o f f 1 s t ,   V o f f 2 n d ,   V o f f 3 r d ,   V o f f 4 t h
Rate of interannual onshore migration V o n 1 s t ,   V o n 2 n d ,   V o n 3 r d ,   V o n 4 t h
Rate of seasonal offshore migration (April-September) V o f f l o w 1 s t ,   V o f f l o w 2 n d ,   V o f f l o w 3 r d ,   V o f f l o w 4 t h
Rate of seasonal onshore migration (April-September) V o n l o w 1 s t ,   V o n l o w 2 n d ,   V o n l o w 3 r d ,   V o n l o w 4 t h
Rate of seasonal offshore migration (October-March) V o f f h i g h 1 s t ,   V o f f h i g h 2 n d ,   V o f f h i g h 3 r d ,   V o f f h i g h 4 t h
Rate of seasonal onshore migration (October-March) V o n h i g h 1 s t ,   V o n h i g h 2 n d ,   V o n h i g h 3 r d ,   V o n h i g h 4 t h
Maximum outer bar distance from shoreline at the decay phase X o u t p e a k
Average middle bar distance from shoreline at the outer bar decay phase X m i d p e a k
Average inner bar distance from shoreline at the outer bar decay phase X i n n p e a k
Bar count at the outer bar decay phase N b p e a k
Table 2. Mean values of the environmental and bar zone variables for the nearshore bar behaviour regions (clusters).
LevelCluster D s e a D b z S b z α s h o r e l i n e α w N s w i t c h H w H w l o w H w h i g h T w
L1L1-15.464.47301.57271.5063.001.000.420.330.532.07
L1-26.585.32471.25197.3676.791.430.600.470.742.34
L2L2-14.954.15246.29319.8358.630.000.350.270.451.97
L2-26.805.57505.14197.9177.311.600.590.460.722.33
L2-36.044.68386.54196.0075.501.000.630.490.782.36
L2-46.295.00393.71190.9570.292.670.530.420.672.24
L3L3-14.763.95233.39314.5859.500.480.370.280.461.98
L3-26.805.64507.20202.5479.132.470.590.470.722.33
L3-35.984.66393.33192.9172.090.650.540.420.662.27
L3-46.295.00393.71187.6767.610.930.490.380.622.19
L3-56.744.95297.86287.8060.170.000.410.310.522.05
L3-66.294.88423.33198.9174.261.060.570.450.712.30
Publisher’s Note: MDPI stays neutral with regard to jurisdictional claims in published maps and institutional affiliations.

