Article

Integrate the Canopy SIF and Its Derived Structural and Physiological Components for Wheat Stripe Rust Stress Monitoring

College of Geometrics, Xi’an University of Science and Technology, Xi’an 710054, China
*
Author to whom correspondence should be addressed.
Remote Sens. 2022, 14(14), 3427; https://0-doi-org.brum.beds.ac.uk/10.3390/rs14143427
Submission received: 10 June 2022 / Revised: 8 July 2022 / Accepted: 14 July 2022 / Published: 16 July 2022
(This article belongs to the Special Issue Remote Sensing for Crop Stress Monitoring and Yield Prediction)

Abstract

:
Solar-induced chlorophyll fluorescence (SIF) has great advantages in the remote sensing detection of crop stress. However, under stripe rust stress, the effects of canopy structure and leaf physiology on the variations in canopy SIF are unclear, and these influencing factors are entangled during the development of disease, resulting in an unclear coupling relationship between SIFcanopy and the severity level (SL) of disease, which affects the remote sensing detection accuracy of wheat stripe rust. In this study, the observed canopy SIF was decomposed into NIRVP, which can characterize the canopy structure, and SIFtot, which can sensitively reflect the physiological status of crops. Additionally, the main factors driving the variations in canopy SIF under different disease severities were analyzed, and the response characteristics of SIFcanopy, NIRVP, and SIFtot to SL under stripe rust stress were studied. The results showed that when the severity level (SL) of disease was lower than 20%, NIRVP was more sensitive to variation in SIFcanopy than SIFtot, and the correlation between SIFtot and SL was 6.6% higher than that of SIFcanopy. Using the decomposed SIFtot component allows one to detect the stress state of plants before variations in vegetation canopy structure and leaf area index and can realize the early diagnosis of crop diseases. When the severity level (SL) of disease was in the state of moderate incidence (20% < SL ≤ 45%), the variation in SIFcanopy was affected by both NIRVP and SIFtot, and the detection accuracy of SIFcanopy for wheat stripe rust was better than that of the NIRVP and SIFtot components. When the severity level (SL) of disease reached a severe level (SL > 45%), SIFtot was more sensitive to the variation in SIFcanopy, and NIRVP reached a highly significant level with SL, which could better realize the remote sensing detection of wheat stripe rust disease severity. The research results showed that analyzing variations in SIFcanopy by using the decomposed canopy structure and physiological response signals can effectively capture additional information about plant physiology, detect crop pathological variations caused by disease stress earlier and more accurately, and promote crop disease monitoring and research progress.

1. Introduction

Solar-induced chlorophyll fluorescence (SIF) is a light signal generated by the re-emission of photons from excited chlorophyll molecules back to ground state after absorption of photons in the 650–800 nm wavelength range [1], which can reflect the effects of vegetation photosynthesis [2]. It is considered to be a “probe” for detecting vegetation photosynthesis [3,4,5], and has good application potential in the remote sensing detection of early stress of crop diseases [6,7,8,9]. At present, studies have proved that using SIF data to evaluate the impact of environmental stresses (such as drought and heat stress) on crop growth has higher accuracy and sensitivity. For example, Song et al. [10] used satellite SIF to study the response of Indian wheat to heat stress, which revealed the physiological basis of heat stress affecting wheat yield, and SIF, as an effective substitute for photosynthetic activity, would improve the understanding of the effect of heat stress on wheat yield. Xian et al. [11] examined the potential of SIF to capture the influence of heat wave impacts on wheat in the NCP by comparing satellite remote sensing data of SIF and NDVI and validated ground-based yield data. The results showed that SIF can better capture the variations in wheat yield and the decline in yield due to heat waves. Furthermore, Sun et al. [12] found that satellite SIF is sensitive to both structural and physiological/biochemical variations of vegetation, and has excellent potential for dynamic drought monitoring. Shan et al. [13] found increased sensitivity of SIF to drought in a potato crop, relative to greenness-based Vegetation Indices, suggesting that diurnal variation in SIF is driven by photosynthetic and structural dynamics.
However, the canopy directional SIF detected by the sensor is the fluorescence signal of the “escape” canopy part in the observation direction, which is the result of the combined effect of three processes: the absorption of incident PAR by chlorophylls [14], emission of fluorescence by photosystems [15], and scattering and re-absorption of emitted fluorescence [16]. In the process of radiative transmission of fluorescent photons “escaping” from leaves and the canopy, some photons are reabsorbed and scattered due to the influence of plant biochemical components and canopy geometry [17] so that the total fluorescence intensity emitted by the leaves is inconsistent with the directional fluorescence intensity of the canopy received by the sensor [18], which hinders the direct linkage between apparent canopy SIF and emitted SIF from leaves [19].
This variable proportion between SIF at the leaf and canopy scales can be quantified by the directional or hemispherical photon escape ratio (fesc) of a canopy at a certain sun–sensor geometry [20]. At the canopy scale, the biophysical processes of SIFcanopy can be represented using a simple equation:
SIFcanopy = APAR green × Φ F × f esc
where APARgreen is the photosynthetically active radiation (PAR) absorbed by green leaves, which is decomposed into the product of the fraction of absorbed incident radiation (fAPARgreen) and incident PAR (APARgreen = fAPARgreen × PAR); ΦF is the physiological SIF emission yield of the whole canopy [21]; fesc is the probability that an emitted photon will escape the canopy in the direction of the sensor, i.e., the escape probability [20]; APARgreen × ΦF is the total SIF emitted by leaves (SIFtot), which represents the contribution of crop physiological information to the SIF signal; APARgreen × fesc represents the effect of canopy structure (NIRVP) on canopy SIF variations [22].
It can be seen from Equation (1) that the SIFcanopy information is affected by the combination of physiological variations and canopy structure effects, and it is difficult to distinguish physiological variations in the raw SIF signal from variations in SIFcanopy caused by radiative transfer processes [20]. That is, the variations in SIFcanopy detected by the sensor cannot be directly interpreted as variations in plant physiological state or canopy structure. If physiological information and the effects of canopy structure on sensor-detected canopy SIF are not studied separately, co-variation of fesc with the spatial, temporal, and observed geometry of the entire biome may bias the understanding of variations in SIFcanopy information [23]. To better understand the effects of stress on crop growth and yield, it is necessary to distinguish the effects of structural factors and physiological information on SIFcanopy, and to analyze the response characteristics of the two under stress conditions.
Wheat stripe rust is a wheat disease that spreads by air, with the characteristics of a fast transmission rate and strong damage which seriously affect the yield and quality of wheat [24]. The intensity of physiological variations and the degree of manifestation of symptoms are different in different infection stages of the disease [6], and the effects of physiological information and canopy structure on variations in canopy SIF signals are also different. In the early stage of crops under disease stress, it mainly occurs through the adjustment of physiological mechanisms to quickly adapt to changes in external stress [7,25]. When crops are subjected to continuous disease stress. Not only do their cell activity and biochemical components vary, but so do their leaf morphology, leaf inclination distribution, and canopy structure [26]. However, studies usually directly use sensor-detected SIFcanopy to monitor crop disease stress information, and do not consider the effects of canopy structure and leaf physiological signals on sensor-detected canopy SIF under different disease severities, nor quantify the relative contributions of leaf physiological and canopy structure effects to SL and how the physiological and structural components of SIFcanopy relate to the severity of wheat stripe rust at different disease stages. This leads to a lack of clarity of the effects of leaf physiology and canopy structure effects on the variations in SIFcanopy under stripe rust stress, and of the relationship between the physiological information and structural components of SIFcanopy and disease severity, which greatly affect the remote sensing detection accuracy of wheat stripe rust and the understanding of the SIFcanopy detection mechanism of wheat stripe rust.
Therefore, in this paper, the canopy SIF received by the sensor was decomposed into NIRVP (APARgreen × fesc), which can characterize the canopy structure, and SIFtot (APARgreen × ΦF), which can sensitively reflect the physiological status of crops. We aimed to (1) investigate the relative importance of NIRVP and SIFtot in SIFcanopy variation at different developmental stages of wheat stripe rust and to elucidate the main factors driving SIFcanopy variation under different disease severities, and (2) explore the relationship between SIFcanopy and SL of wheat stripe rust and the response characteristics of leaf physiology (SIFtot) and canopy structure (NIRVP) to SL under different disease severities. We hope the research results are of great significance for clarifying the effects of NIRVP and SIFtot on the variations in SIFcanopy information under stripe rust stress, for clarifying the SIFcanopy detection mechanism of wheat stripe rust, and for improving the detection accuracy of wheat stripe rust.

2. Materials and Methods

2.1. Field Experimental Areas

The natural disease under study was located in Qishan County, Baoji City, Shaanxi Province (34°26′52″N, 107°37′42″E), with high terrain in the north and south and low in the middle. Forests are distributed in the north and south mountainous areas, and the central part is cultivated land. The climate is a warm, temperate, continental monsoon, semi-humid climate. The wheat variety was “Xinong 822”, for which the wheat sowing time and management practices of the different farmers differ. In the natural infection investigation area, there were 104 slightly diseased samples, 99 moderately diseased samples, and 29 severely diseased samples, which were selected as test samples. Canopy spectral observations of all samples were obtained in a 40 cm × 40 cm wheat quadrat. On 16, 17, 28, 29, and 30 April and 12 and 13 May 2021, the severity of wheat stripe rust was investigated, and the canopy reflectance spectrum was simultaneously measured. Overview of the study area is shown in Figure 1.

2.2. Data Acquisition

2.2.1. Canopy Spectral Measurements

In this experiment, the crowns of wheat stripe rust under different disease indices were measured by an Ocean Optics QE-pro spectrometer. The Ocean Optics QE-pro spectrometer has a spectral resolution of 0.3 nm with a sampling interval of 0.15 nm in 640–800 nm. During the measurement, the height of the probe was 0.9 m away from the wheat canopy, and canopy spectrum data were measured between 11:00 and 15:00 Beijing time. Each sample was continuously observed 10 times, and the average was taken as the spectral data. The standard BaSO4 reference board was used to correct the radiance data before and after each sampling.

2.2.2. Severity Level Survey

The survey of canopy disease severity adopts a five-point sampling method, that is, five symmetrical points are selected in each quadrat (40 × 40 cm); each point is approximately 1 m2, four wheat plants are randomly selected from each point, and a total of 20 plants are selected for each quadrat. All of the sample leaves were inspected by the National Standard for the Investigation and Forecasting of Crop Disease (GB/T 15795) [27]. The severity level (SL) of disease (i.e., percentage of diseased spot area on the diseased leaf to the total leaf area) on wheat leaf was divided into 8 levels (1%, 5%, 10%, 20%, 40%, 60%, 80%, and 100%). The SL can be calculated by Equation (2) [28]:
SL = ( i × l i ) L
where i is the gradient value, li is the number of diseased leaves corresponding to each gradient value, and L is the number of leaves investigated.

2.2.3. SIFcanopy Retrieval Method

The 3FLD fluorescence prediction algorithm considers that the chlorophyll fluorescence and reflectance spectra vary linearly around the absorption line band and use the weighted average of one band to the left and right of the absorption line instead of a single band value in the standard FLD algorithm. This reduces, to some extent, the errors associated with the assumption of constant fluorescence and reflectance in the standard FLD method and improves the prediction accuracy of SIFcanopy [29]. Moreover, studies have shown that the 3FLD algorithm is the most robust algorithm for estimating SIF [30,31]; therefore, we estimated SIF at the canopy level with the 3FLD algorithm.
SIFcanopy = ( I left ω left + I right ω right ) L in I in ( L left ω left + L right ω right ) ( I left ω left + I right ω right ) I in
ω left = λ right λ in λ right λ left
ω right = λ in   λ left λ right   λ left
where λ left , λ right ,   and   λ in are the wavelengths of bands to the left, right, and inside of the absorption band, respectively; ω left   and ω right are the weights of the left and right reference bands of the absorption line, respectively; I left and I right are the solar irradiance spectral intensities on the left and right side of the absorption line, respectively; L left and L right refer to the vegetation canopy reflected radiance spectral intensity on the left and right side of the absorption line, respectively.

2.2.4. Estimation of NIRVP and SIFtot

We calculated the NDVI and NIR reflectance of vegetation (NIRv) from the spectral irradiance and radiance data as follows:
NDVI = ( R 800   R 670 ) ( R 800 + R 670 )
NIR V = NDVI   ×   R NIR
where R 670 and R 800 are canopy reflectance at 670 nm and 800 nm, respectively. Then, with the calculations, we used a mean reflectance of spectral ranges, 770–780 nm for NIR bands.
Accurate measurement of the fraction of absorbed photosynthetically active radiation by green leaves (fAPARgreen) is a critical step in the estimation of fesc, a wide dynamic range vegetation index (WDRVI) that has been proven to be linearly correlated with fAPARgreen [32,33]. The WDRVI is defined as:
fAPAR green = 0 . 85   ×   WDRVI + 0 . 16
WDRVI = ( α R NIR   R Red ) ( α R NIR + R Red )
where RNIR and RRed are the reflectance of near infrared and red band, respectively, and α is a weighting coefficient whose value is less than 1. Here, the value is 0.5 [34].
The escaping probability (fesc) is a parameter related to the optical properties of the canopy, which accounts for the fraction of SIF photons escaping from the leaf level to the canopy level. It is determined by the canopy structure and chlorophyll content, and can be calculated as:
f esc     NIR V fAPAR green
We then followed a framework to obtain the total emitted SIF (SIFtot) and canopy structure (NIRVP) using SIFcanopy, fesc, PAR, and NIRv data, which disaggregated SIFcanopy into non-physiological and physiological signals.
SIFtot is the product of APARgreen and ΦF, which represents the total emitted SIF and includes the signals emitted from the leaf adaxial and abaxial parts, and is therefore a mixture of the canopy radiation absorption and the physiological emission efficiency [22]. ΦF, as a portion of information embedded in SIF, is insensitive to canopy structural characteristics but purely related to plant physiological mechanisms; therefore, it could possibly indicate plant physiological responses in our experiment [35].
NIRVP is the product of APARgreen and fesc, which represents a combined canopy structure and radiation factor and includes both absorption and scattering aspects of the canopy structure. “Canopy structure” refers to the combined effects of canopy light absorptance and scattering captured by the product fAPARgreen × fesc, and “radiation” refers to PAR [22]. NIRv was used to eliminate the impact from the fraction of green leaf APAR (fAPARgreen) and the escaping probability (fesc) from SIF [35]. Finally, we calculated SIFtot as shown in Equation (11), and then NIRVP as in Equation (12):
SIF tot = SIF canopy /   f esc  
NIR V P = NIR V   ×   PAR

3. Results and Analysis

3.1. Effects of NIRVP and SIFtot on the Variations in SIFcanopy under Different Disease Severities

The SIFcanopy received by the sensor is simultaneously affected by the vegetation canopy structure and the physiological state of the crop. The variations in the SIFcanopy cannot be directly explained as the variation in the physiological state of the plant or the variation in the canopy structure [36]. Based on this, according to the disease index, this paper first divided the severity of wheat stripe rust into mild disease (0% < SL ≤ 20%), moderate disease (20% < SL ≤ 45%), and severe disease (SL > 45%) [37]. Afterward, we decomposed the SIFcanopy detected by the sensor into NIRVP (which can characterize the canopy structure) and SIFtot (which can sensitively reflect the physiological status of crops) to analyze the contribution of NIRVP and SIFtot to the variations in SIFcanopy under different disease severities of wheat stripe rust (Figure 2, Figure 3 and Figure 4).
One hundred and four points were used as samples to assess the relationship between the two components of SIFtot and NIRVP with SIFcanopy in the mild state of wheat stripe rust, as illustrated in Figure 2. In the mild disease state, the variations in SIFcanopy were simultaneously affected by wheat physiological status and canopy structure factors. The correlation between the NIRVP component representing canopy structure and SIFcanopy was better than that of the SIFtot component, reflecting crop physiological status. At this time, leaf physiology had not significantly varied, the effect of physiology on SIFcanopy was weak, and the responses of qL and NPQ in different layers at the top of the canopy canceled each other out [38]. This is consistent with previous studies that, in the absence of strong external factors (such as disease stress and environmental conditions), SIFcanopy variations are mainly driven by NIRVP rather than SIFtot. Therefore, if we do not isolate the effects of the NIRVP component (which characterizes the canopy structure) and the SIFtot component (which reflects crop physiology) on variations in SIFcanopy, and the variations in SIFcanopy are directly attributed to the influence of stripe rust stress, the remote sensing detection accuracy of wheat stripe rust may be greatly affected.
It can be seen that 99 points were used as samples to assess the relationship between the two components of SIFtot and NIRVP with the SIFcanopy under a moderate incidence of wheat stripe rust (Figure 3) that, despite the moderate disease state, the SIFcanopy detected by the sensor was still influenced by a combination of both canopy structure and leaf physiology. Moreover, the contributions of the two components SIFtot and NIRVP to the variations in SIFcanopy were more variable than those in the mild disease state. The contribution of the SIFtot component, which characterizes leaf physiology, to the variations in SIFcanopy was significantly better than that of the NIRVP component, which reflects the canopy geometry. The coefficient of determination between the SIFtot component and the SIFcanopy was 0.821, 148% higher than that of the NIRVP component. The physiological information of crops under a severe disease state explains the main part of the variation in SIFcanopy.
Twenty-nine points were used as samples to assess the relationship between the two components of SIFtot and NIRVP with SIFcanopy under severe incidence of wheat stripe rust, as shown in Figure 4. Under severe disease, the canopy structure and leaf physiology jointly affected the variations in SIFcanopy. The correlation between the canopy structure component NIRVP and SIFcanopy was 37% higher than that in the moderate disease state. Comparing the effects of NIRVP and SIFtot on SIFcanopy variability during the severe disease onset phase shows that the SIFtot component, which reflects leaf physiological information, better explains SIFcanopy variability, with an R2 between the two reaching 0.9588, consistent with mid-onset, and the physiological signal of SIFcanopy explaining a major part of the SIFcanopy variability.
The contribution of the NIRVP and SIFtot components to the variations in SIFcanopy varied by severity of disease. The NIRVP component had a more significant effect on the variations in SIFcanopy than the SIFtot component in the mild disease state, while the SIFtot component had a greater impact on the SIFcanopy variations in the moderate-to-severe disease states. Different forms of cumulative symptoms can be separated by the grading of different disease severities, and the impact of the SIFtot and NIRVP components on SIFcanopy can be quantified. Variations in the correlations between SIFcanopy, NIRVP, and SIFtot may be unavoidable due to the cumulative effects of persistent disease, indicating that canopy structural variation and canopy physiological variation occur simultaneously with the accumulation of physiological stress.

3.2. The Relationships between SIFcanopy, NIRVP, SIFtot, and SL of Different Disease Severities

After crops are infected by pathogens, the leaf pigment and water content, photosynthetic physiological state, and canopy geometry all change [39], and the intensity of change and degree of symptom manifestation are different in different infection stages of the disease [26]. To reveal whether the driver of SIFcanopy by canopy structure and leaf physiological signals affects the accuracy of monitoring disease severity at different developmental stages of wheat stripe rust, as well as to assess whether the SIFcanopy-derived canopy structure component (NIRVP) and leaf physiological component (SIFtot) improve the quantification of crop response to disease stress, we assessed the impact of variation in NIRVP and SIFtot on the SIFcanopy–SL relationship and compared the correlation between the SIFcanopy received by the sensor and its derived canopy structure and leaf physiological signals and the disease index in different states of wheat stripe rust incidence.
Figure 5 shows the relationship between the SIFcanopy, NIRVP, and SIFtot components and wheat stripe rust SL in 104 sample sites under mild disease state. There was a highly significant negative correlation between SIFcanopy, SIFtot, and wheat stripe rust severity (p < 0.001), while the negative correlation between the NIRVP component representing canopy structure and the severity of wheat stripe rust only reached a significant correlation (p < 0.05). The correlation between the SIFtot component, which can sensitively reflect physiological stress, and the severity of wheat stripe rust was 6.6%, 128.5% higher than that of the SIFcanopy and NIRVP components, respectively. This is because the effect of the disease on the spectrum depends on the intensity of physiological variations, the stage of disease development, and the degree of symptom manifestation [39]. No significant variations in canopy geometry during the early stages of disease were observed [40]. Plants respond to disease stress mainly by adjusting their photosynthetic rate and initiating their photoprotection mechanism to consume excess light energy by emitting chlorophyll fluorescence and non-photochemical quenching [41]. When the SIF was downscaled from the canopy level to the leaf level, the SIFtot component mainly reflected the physiological response of crops to disease stress, independent of canopy structural variations, so the sensitivity to the disease index was higher than SIFcanopy detected by the sensor. This clearly shows that in the mild incidence stage of wheat stripe rust, the SIFtot component, which characterizes leaf physiological signals, can more sensitively reflect the stress information of stripe rust disease.
It can be seen that 99 points were used as samples to assess the relationships between SIFcanopy, NIRVP, SIFtot, and SL in the moderate incidence stage of wheat stripe rust (Figure 6). When the severity of wheat stripe rust disease was in the state of moderate incidence (20% < SL ≤ 45%), the correlation between SIFcanopy and wheat stripe rust severity was 21.2% higher than SIFtot and 92.8% higher than NIRVP. At this time, the variation in SIFcanopy was more complicated, affected by both canopy structure and leaf physiological signals. On the one hand, SIFcanopy varies with the physiological regulation of energy dissipation pathways and, on the other hand, it is also affected by biochemical and physical parameters such as phytopigment composition, leaf area, and leaf inclination angle [26]. This is because, in the moderate disease state, after the wheat is infected by stripe rust, the cell tissue structure of its leaves is damaged, and long strips of bright yellow rust spots are formed on the surface of the wheat leaves, resulting in the rupture of the leaf epidermis and even tilting of the leaves [42], meaning the canopy structure has undergone certain variation. At the same time, due to the penetration and diffusion of pathogen hyphae in host cells, the chlorophyll content of rust-infected wheat is reduced, resulting in the destruction of the crop photosynthetic system and causing internal physiological changes in the leaves [43]. Both the leaf physiology and canopy structure parameters varied with the severity of stripe rust, and the two had a superimposed effect on the variations in SIFcanopy. By decoupling the contributions of leaf physiology and canopy structure to SIFcanopy, it was shown that the correlation between SIFcanopy and the severity of wheat stripe rust in a moderate disease state was better than that of its derivatives—NIRVP and SIFtot.
It can be seen that 29 points were used as samples to assess the relationships between SIFcanopy, NIRVP, SIFtot, and SL in the severe incidence stage of wheat stripe rust (Figure 7). The correlation between the NIRVP component, which characterizes the canopy structure, and wheat stripe rust SL was 135.5% and 123.7% higher than that of the SIFtot component and SIFcanopy, which reflect physiological stress, respectively. This is because in the severe disease state, with the strengthening of the infection of a plant by the pathogen, some organs of the plant begin to show obvious symptoms and round-to-oval black–brown spore piles appear on the leaf sheath, emitting bright yellow powder [44]. The continuous proliferation of wheat stripe rust mycelium accelerated the rupture of leaf epidermis and cuticle, and symptoms of wilting and necrosis even appeared [45], leading to major variations in the canopy structure. The NIRVP component captures quantified non-physiological signals at this time and shows its superiority in disease stress detection with higher sensitivity than SIFcanopy.

3.3. Model Accuracy Test

In order to determine the suitable models for remote sensing monitoring of wheat stripe rust under different disease states, especially the early remote sensing detection model of wheat stripe rust, we divided wheat stripe rust into three disease levels according to the severity of the disease, namely mild, moderate, and severe. On this basis, we compared and analyzed the accuracy of SIF and its derived characteristic factors that can characterize canopy structure and leaf physiological signals to monitor the severity of wheat stripe rust.
Take SIFcanopy, SIFtot, and NIRVP as independent variables, and SL as the dependent variable. Overall, 72, 69, and 20 points were used as training samples to construct remote sensing estimation models of wheat stripe rust with different severity (Table 1). The determination coefficient (R2) and Root Mean Square Error (RMSE) between the predicted value and the measured value are selected as the model accuracy evaluation indicators.
It can be seen from Table 1 that, in the training sample data under mild disease, the R2 between predicted SL and measured SL built by the model with SIFtot as the independent variable is increased by 6% and 89.3%, respectively, while RMSE is decreased by 2.7% and 18.2%, respectively, compared with SIFcanopy and NIRvP. In the training sample data under moderate disease, the R2 between predicted SL and measured SL of the model constructed with SIFcanopy as the independent variable is increased by 48.4% and 100%, respectively, and the RMSE is decreased by 9.8% and 16.4%, respectively, compared with SIFtot and NIRvP. Compared with SIFcanopy and SIFtot, the R2 between the predicted SL and measured SL values of the model with NIRvP as the independent variable is increased by 73.5% and 73.5%, respectively, while RMSE is decreased by 32.7% and 37.6%, respectively, in the training sample data with severe morbidity.
In order to ensure the stability and reliability of the evaluation results and reduce the impact of a random grouping of sample data on the accuracy of the model, this paper used the remaining 32, 30, and 11 points of modeling as validation samples to test the accuracy of the prediction model for the severity of wheat stripe rust with extremely significant correlation (Figure 8).
According to the remote sensing monitoring model of wheat stripe rust under mild conditions Figure 8a, the model constructed with SIFtot, which is closely related to physiological information, as the independent variable which has the highest accuracy and is more suitable for the early detection of the severity of wheat stripe rust. It can be seen from the remote sensing monitoring model of wheat stripe rust under moderate conditions in Figure 8b that the prediction accuracy of the model constructed by SIFcanopy is better than that of NIRVP and SIFtot derived from SIFcanopy. According to Figure 8c, the remote sensing monitoring model of wheat stripe rust under severe conditions, it can be seen that the estimation accuracy of the wheat stripe rust detection model constructed with NIRVP, which is closely related to the canopy structure, has the highest estimation accuracy, and is more suitable for the monitoring of wheat stripe rust under severe conditions.
According to Table 1 and Figure 8, the optimal variables of wheat stripe rust detection model under mild, moderate, and severe disease severity are SIFtot, SIFcanopy, and NIRvP, respectively, and the predicted and the measured disease severity is extremely significant. It is consistent with the results of analysis in Section 3.2.

4. Discussion

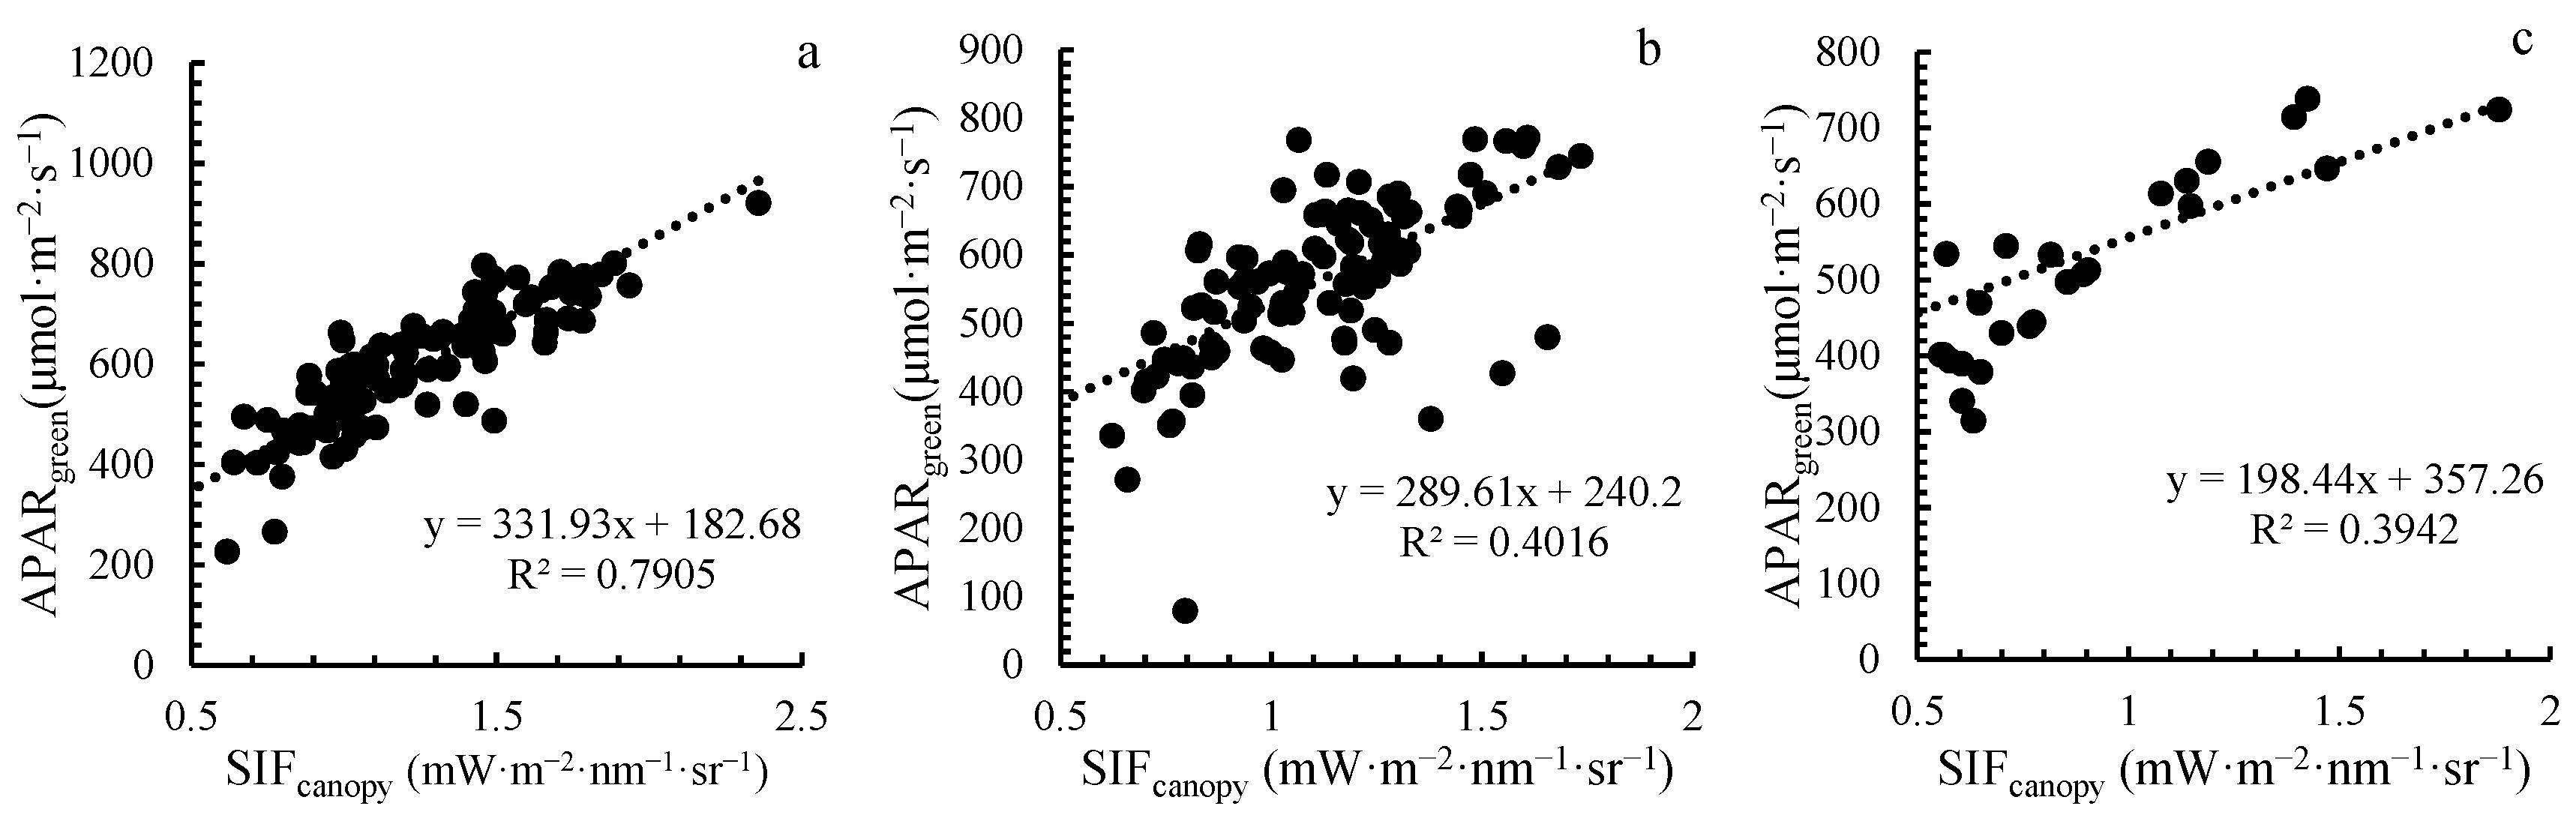
4.1. Response Characteristics between SIFcanopy and APARgreen under Stripe Rust Stress

In the early stage of crops under disease stress, it is mainly through the adjustment of physiological mechanisms that plants quickly adapt to variations in external stress [7]. SIFcanopy can sensitively reflect the changes in crop photosynthetic physiology and realize the early detection of crop diseases [39]. However, in the case of mixed canopy structure and leaf physiological information, SIFcanopy and NIRv may have similar or opposite trends in the stress response to ΦF [19]. Therefore, this study used the SIFtot and NIRVP components associated with APARgreen to represent the leaf physiological and canopy structure effects, respectively, to investigate their contributions to SIFcanopy and to further detect wheat stripe rust accuracy.
The canopy structure effect (NIRVP) was estimated as:
NIR V P = APAR green × f esc
Additionally, the total emitted SIF (SIFtot) was estimated as:
SIF tot = APAR green × Φ F
SIF emission is closely related to APAR (more specifically, PAR absorbed by green leaves (APARgreen)), which can be calculated by the product of the incident photosynthetically active radiation (PAR) reaching the vegetation canopy and the fraction of APARgreen (fAPARgreen). Herein, the incident photosynthetically active radiation (PAR) was calculated using the radiance reflected from a white reference panel measured by a spectrometer [18]. Consequently, the APARgreen can be calculated as:
APAR green = fAPAR green × PAR
The SIFcanopy was highly correlated with the APARgreen [46,47,48]; the canopy structure not only directly affects the diurnal dynamics of SIF via APARgreen, but also has a strong diurnal effect on photochemical and non-photochemical intra-canopy responses, in addition to SIFcanopy [38]. In order to better analyze the main factors driving SIFcanopy variations under stripe rust stress and the correlation between SIFcanopy and its derived variables and SL, this paper further investigated the response characteristics between SIFcanopy and APARgreen under stripe rust stress (Figure 9).
Figure 9 shows the positive linear relationship between SIFcanopy and APARgreen under the mild, moderate, and severe incidence states of stripe rust, and the correlation between SIFcanopy and APARgreen diminished as the severity of the disease increased. In the severe and moderate disease states, the correlation between SIFcanopy and APARgreen was 49.1% and 50.1% lower than that in the mild disease state, respectively. This is because the actual area of the leaves for photosynthesis was reduced by the lesions, and the epidermis was ruptured by the spore pile after the infection, which unbalanced the water metabolism of the remaining healthy parts and increased the movement resistance of CO2, thus affecting the photosynthesis of the remaining healthy parts [49]. When crops are subjected to continuous disease stress, their physiological and biochemical parameters and surface morphology vary, the photosynthetic pigments existing in the photosystem are damaged by stress factors, the light absorption efficiency of photosystem PSI and photosystem PSII decreases, and the photosynthetic capacity reduces [50]. Pathogen infection reduces the green leaf area or damages mesophyll cells, resulting in a significant reduction in the photosynthetic rate and in a reduced correlation of APARgreen with SIFcanopy.

4.2. Analysis of the Influence of Uncertainty Factors on SIFcanopy and fAPARgreen

SIFcanopy signaling is not only controlled by photosynthesis status but is also related to plant physiological processes [51,52,53]. It is also influenced by environmental factors such as canopy geometry, light intensity, and the geometry of the sun–ground–sensor relationship [54]. Variations in light intensity, direct and diffuse radiation of the canopy, and bidirectional reflectance distribution function (BRDF) properties all affect the inversion of SIFcanopy. The different absorption depths of the oxygen absorption band that absorb direct and diffuse radiation may lead to overestimating or underestimating the SIFcanopy value under certain observation geometries [55]. Canopy structure may introduce uncertainty in estimated irradiance due to differences in diffuse and direct irradiance components, leading to errors in the inversion [56]. Therefore, the influence of light intensity and the geometric relationship between the sun–surface–sensor on the canopy SIF should be considered in follow-up research.
In this study, the indirect estimation data of fAPARgreen was used to estimate the canopy escape rate fesc of SIFcanopy. Overestimation or underestimation of fAPARgreen would affect the fesc value, thus introducing uncertainty into the subsequent estimation of SIFtot. The WDRVI vegetation index was calculated based on the reflectance of the near-infrared and red bands of the Multispectral Instrument (MSI) on the Sentinel-2 satellite system based on the Moderate Resolution Imaging Spectrometer (MERIS), which confirmed that the relationship between fAPARgreen and WDRVI is not species-specific, with R2 = 0.92 (p < 0.001) and RMSE = 0.069 [34]. Therefore, the accuracy of the fAPARgreen measurements can be considered reliable.

4.3. Responses of SIFcanopy and SL to Canopy Structure and Plant Physiological Indicators under Disease Stress

Variations in SIFcanopy under disease stress are jointly driven by a combination of canopy structure and physiological factors; there is overlap between structural and physiological responses, and physiological differences risk being misinterpreted as structural differences. Furthermore, as different disease severities have different effects on variations in canopy structure and leaf physiology which, in turn, can affect changes in the relationships between NIRVP, SIFtot, and SIFcanopy; SL and SIFcanopy; and NIRVP, SIFtot, and SL, the effects of canopy structure and leaf physiology on SIFcanopy variations and SL during disease progression need to be discussed in stages.
The analysis in this study showed that both the NIRVP and SIFtot components contribute to variations in SIFcanopy under mild disease (Figure 2), and NIRVP can better detect said variations in SIFcanopy, due to the fact that in the early stage of wheat stripe rust disease, most early infection hyphae do not form haustorial mother cells and tend to grow between the mesophyll and the adaxial epidermis rather than ramify through the mesophyll tissue [57]. However, NIRVP’s response to SL is not advantageous. It can be seen from Figure 5 that in the early stage of disease stress, after eliminating the influence of canopy structure, the detection of SL by physiological signals was more sensitive than that of SIFcanopy, and the relationship between NIRVP and SL was only significantly correlated (p < 0.05), while the SIFtot–SL relationship was extremely significant (p < 0.001). The correlation between SIFtot and SL was better than that of SIFcanopy and NIRVP, which is more conducive to detecting stripe rust stress information. This is due to the damage to the leaf and the reduction in chlorophyll content caused by the development of mycelium inside the leaf [45]; disruption of chloroplasts or other organelles alters the rate of photosynthesis, causing variations in SIFtot that characterize the component of physiological information. In the early stage of disease stress, although the damage caused by bacteria was not obvious, there was no significant disease on the leaves [58]. However, the parasitic relationship established between the pathogen and the host caused certain variations in the metabolism of the parasitic site and had a significant impact on the internal cells and pigment content, moisture, and the intercellular spaces of the host [59]. Thus, the SIFtot component can detect variations in crop photosynthesis in time and sensitively reflect disease stress information.
The contribution of SIFtot to SIFcanopy variation became progressively greater with increasing disease severity, and although the main factor driving SIFcanopy variation in the mild disease state was the canopy structure of the crop, the correlation between SIFtot and SIFcanopy also reached a highly significant correlation at this point (p < 0.001), confirming the contribution of physiological signals to SIFcanopy. In the moderate disease state, due to the accumulation of physiological variations over time, many branching hyphae were produced during the infection of stripe rust; as the mycelium developed, a pustule bed became established from which a uredinium developed [45], and the growth of spores broke through the epidermis and destroyed a large amount of chlorophyll, causing symptoms such as chlorosis and yellowing of wheat leaves [60]. At the same time, the crop canopy structure varied to a certain extent, and the concentration information of plant biochemical components and the photosynthetic physiological state underwent obvious variations. The crop physiological state coupled with the canopy structure to a large extent [61], Causing NIRVP contribution to SIFcanopy variation to be attenuated relative to mild period. The variation in SIFcanopy at this stage was mainly due to the variation in leaf physiology, but for the disease, the detection accuracy of SIFcanopy for wheat stripe rust was better than that of the NIRVP and SIFtot components. This is because physiological information and canopy structure affect the variations in SIFcanopy at the same time in a moderate disease state, and the variations in canopy structure and leaf physiological signals are coupled with SIFcanopy and SL under disease stress. Therefore, the correlation of SIFcanopy–SL was better than that between NIRVP and SL and between SIFtot and SL.
In the severe disease state, the continuous proliferation of the hyphae of wheat stripe rust accelerated the rupture of the leaf epidermis and cuticle, and the outbreak of stripe rust changed the characteristics of the wheat. At this time, the internal tissue of the wheat leaves was damaged, and the severely infected plants showed wilting symptoms in the later stage [45,62]. Finally, the biochemical components and external color of the leaves varied; the leaves infected by wheat stripe rust basically turned yellow, and the internal structure of the leaves was seriously damaged. Therefore, in the severe disease state, the variation in SIFcanopy mainly comes from the variation in leaf physiology. In addition, the contribution of NIRVP to the variation in SIFcanopy was stronger than that in the moderate period, because when the crops were subjected to continuous disease stress, not only did their cell activities and biochemical components vary, but so did the leaf morphology, leaf inclination angle distribution, and canopy structure. However, in the severe incidence stage of wheat stripe rust, SIFtot is not as accurate as SIFcanopy and NIRVP in detecting the disease. This is because stripe rust uses the water and nutrients of the host plant to weaken the plant. Depending on the resistance level and temperature of the plant, there will be varying degrees of yellowing or necrosis [61]. By this time, necrotic streaks had formed on the leaves and the SIFtot response to SL was no longer dominant. At the same time, as the disease broke out, the growth of the canopy varied dramatically, and so did the NIRVP–SL correlation. The disease stress caused constant variations in canopy structure and chlorophyll content, which affected the multiple scattering and reabsorption of SIFcanopy received by the sensor within the canopy, increasing the NIRVP–SIFcanopy correlation.
In this study, we quantified SIFcanopy-derived SIFtot and NIRVP, demonstrating their capability in crop disease monitoring studies. Our results addressed the unique contribution of SIFcanopy to the remote sensing of crops and showed the potential of SIFtot for early stress quantification in wheat stripe rust.
In the early stage of wheat infection by stripe rust fungi, although it is difficult to be directly detected by the naked eye [63], pathogenic bacteria have a significant impact on the host internal cells and pigment content, water, and intercellular space [40]. When encountering a suitable temperature and humidity, the disease rapidly multiplies and spreads, resulting in serious loss of wheat yield. If the disease information can be detected in the early stage of wheat infection by stripe rust and timely drug control can be initiated, a widespread epidemic of the disease can be effectively avoided, and the yield and quality of wheat can be improved.
By comparing the responses of SIFcanopy and SL to canopy structure and plant physiological indicators under mild-to-moderate wheat stripe rust infection, we found that the SIFtot component, which characterizes the physiological effects of leaves, is more sensitive to early information of wheat stripe rust and has a great advantage in detecting early disease.

5. Conclusions

In this study, the SIFcanopy detected by the sensor was decomposed into NIRVP, which can characterize the canopy structure, and SIFtot, which can sensitively reflect the physiological status of crops, and the main factors of the variation in SIFcanopy under different disease severities was analyzed. Additionally, the response characteristics of SIFcanopy, NIRVP, and SIFtot to SL under stripe rust stress were clarified, and how canopy structural factors and leaf physiological signals affect the response of SIFcanopy to disease stress in wheat crops was investigated.
The results showed that the SIFcanopy was mainly affected by variations in the canopy structure when the incidence of wheat stripe rust was mild (0% < SL ≤ 20%). After the influence of canopy structure was eliminated, the SIFtot signal, a component of leaf physiological signals, was more sensitive to early stress of stripe rust. This is because wheat stripe rust will cause leaf damage and reduce chlorophyll content in the early stage of its onset. The destruction of chloroplasts or other organelles changes the photosynthetic rate, which can be detected by SIFtot in time.
When the disease severity of wheat stripe rust was in a moderate state (20% < SL ≤ 45%), the variations of canopy SIF were mainly driven by the physiological signals of leaves. The leaves infected by wheat stripe rust are basically withered and yellow, and the internal structure of leaves has been seriously damaged. SIFtot and NIRVP simultaneously affect the variations of SIFcanopy, coupling the relationship between SIFcanopy-SL and making the SIFcanopy more advantageous in detecting wheat stripe rust under moderate disease conditions.
In the severe disease state (SL ≥ 45%), disease stress leads to the continuous change of canopy structure and chlorophyll content, which affects the multiple scattering and reabsorption of SIF received by the sensor in the canopy and improves the correlation between NIRVP and SL. Therefore, NIRVP, the component characterizing the canopy structure can better monitor the change trend of wheat under severe disease stress.
The results of this study demonstrated that variations in SIFcanopy under different disease severities are driven by different factors, and the sensitivity of canopy structure and leaf physiological components to the disease is also different. By decomposing the canopy structure and physiological response signals to analyze the variations in SIFcanopy, additional information about plant physiology can be effectively obtained. This approach will allow for earlier and more accurate detection of crop pathological changes caused by disease stress and facilitate research advances in crop disease monitoring.

Author Contributions

Data curation, Q.Y. and K.D.; Formal analysis, J.Y.; Methodology, Q.Z.; Writing—original draft, B.L.; Writing—review & editing, X.J. All authors have read and agreed to the published version of the manuscript.

Funding

This research was funded by National Natural Science Foundation of China, grant number 42171394; 41601467; 52079103.

Data Availability Statement

Due to the nature of this research, participants of this study did not agree for their data to be shared publicly, so supporting data is not available.

Conflicts of Interest

The authors declare no conflict of interest.

References

  1. Zhang, Z.; Wang, S.; Qiu, B.; Song, L.; Zhang, Y. Retrieval of sun-induced chlorophyll fluorescence and advancements in carbon cycle application. J. Remote Sens. 2019, 23, 16. [Google Scholar]
  2. Porcar-Castell, A.; Tyystjärvi, E.; Atherton, J.; Van der Tol, C.; Flexas, J.; Pfündel, E.E.; Moreno, J.; Frankenberg, C.; Berry, J.A. Linking chlorophyll a fluorescence to photosynthesis for remote sensing applications: Mechanisms and challenges. J. Exp. Bot. 2014, 65, 4065–4095. [Google Scholar] [CrossRef]
  3. Yang, P.; Liu, Z.; Ni, Z.; Wang, Q. Remote Sensing of Chlorophyll Fluorescence at Airborne Level Based on Unmanned Airship Platform and Hyperspectral Sensor. Spectrosc. Spectr. Anal. 2013, 33, 3101–3105. [Google Scholar] [CrossRef]
  4. Huang, C.; Zhang, L.; Wang, S.; Qiao, N. Automated observation of diurnal solar-induced chlorophyll fluorescence for better understanding of crop photosynthesis. In Proceedings of the Agu Fall Meeting Abstracts, San Francisco, CA, USA, 12–16 December 2016; p. B51B-0406. [Google Scholar]
  5. Somkuti, P.; Bsch, H.; Liang, F.; Palmer, P.I.; Quaife, T. A new space-borne perspective of crop productivity variations over the US Corn Belt. Agric. For. Meteorol. 2020, 281, 107826. [Google Scholar] [CrossRef]
  6. Zhao, Y.; Jing, X.; Huang, W.; Dong, Y.; Li, C. Comparison of Sun-Induced Chlorophyll Fluorescence and Reflectance Data on Estimating Severity of Wheat Stripe Rust. Spectrosc. Spectr. Anal. 2019, 39, 2739. [Google Scholar]
  7. Jing, X.; Lv, X.; Zhang, C.; BAI, Z.-F. Early Detection of Winter Wheat Stripe Rust Based on SIF-PLS Model. Trans. Chin. Soc. Agric. Mach. 2020, 51, 191–197. [Google Scholar] [CrossRef]
  8. Hernandez-Clemente; North, P.R.J.; Hornero, A.; Zarco-Tejada, P.J. Assessing the effects of forest health on sun-induced chlorophyll fluorescence using the FluorFLIGHT 3-D radiative transfer model to account for forest structure. Remote Sens. Environ. 2017, 193, 165–179. [Google Scholar] [CrossRef] [Green Version]
  9. Saleem, M.; Atta, B.M.; Ali, Z.; Bilal, M. Laser induced Fluorescence spectroscopy for early disease detection in grapefruit plants. Photochem. Photobiol. Sci. 2020, 19, 713–721. [Google Scholar] [CrossRef]
  10. Song, Y.; Wang, J.; Wang, L.J.R.S. Satellite solar-induced chlorophyll fluorescence reveals heat stress impacts on wheat yield in India. Remote Sens. 2020, 12, 3277. [Google Scholar] [CrossRef]
  11. Xian, C.; He, L.; He, Z.; Xue, D.; Li, Z. Assessing the Response of Satellite Solar-Induced Chlorophyll Fluorescence and NDVI to Impacts of Heat Waves on Winter Wheat in the North China Plain. Adv. Meteorol. 2020, 2020, 1–14. [Google Scholar] [CrossRef]
  12. Sun, Y.; Fu, R.; Dickinson, R.; Joiner, J.; Frankenberg, C.; Gu, L.; Xia, Y.; Fernando, N. Drought onset mechanisms revealed by satellite solar-induced chlorophyll fluorescence: Insights from two contrasting extreme events. J. Geophys. Res. Biogeosci. 2016, 120, 2427–2440. [Google Scholar] [CrossRef]
  13. Xu, S.; Atherton, J.; Riikonen, A.; Zhang, C.; Oivukkamäki, J.; MacArthur, A.; Honkavaara, E.; Hakala, T.; Koivumäki, N.; Liu, Z.; et al. Structural and photosynthetic dynamics mediate the response of SIF to water stress in a potato crop. Remote Sens. Environ. 2021, 263, 112555. [Google Scholar] [CrossRef]
  14. Zhang, Y.; Xiao, X.; Wolf, S.; Wu, J.; Wu, X.; Gioli, B.; Wohlfahrt, G.; Cescatti, A.; Christiaan, V.; Zhou, S. Spatio-Temporal Convergence of Maximum Daily Light-Use Efficiency Based on Radiation Absorption by Canopy Chlorophyll. Geophys. Res. Lett. 2018, 45, 3508–3519. [Google Scholar] [CrossRef]
  15. Van der Tol, C.; Berry, J.A.; Campbell, P.; Rascher, U. Models of fluorescence and photosynthesis for interpreting measurements of solar-induced chlorophyll fluorescence. J. Geophys. Res.-Biogeosci. 2014, 119, 2312–2327. [Google Scholar] [CrossRef] [PubMed] [Green Version]
  16. Yang, P.; Christiaan, V. Linking canopy scattering of far-red sun-induced chlorophyll fluorescence with reflectance. Remote Sens. Environ. 2018, 209, 456–467. [Google Scholar] [CrossRef]
  17. Köhler, P.; Guanter, L.; Kobayashi, H.; Walther, S.; Yang, W. Assessing the potential of sun-induced fluorescence and the canopy scattering coefficient to track large-scale vegetation dynamics in Amazon forests. Remote Sens. Environ. 2018, 204, 769–785. [Google Scholar] [CrossRef] [Green Version]
  18. Liu, X.; Luis, G.; Liu, L.; Alexander, D.; Zbyněk, M.; Uwe, R.; Peng, D.; Du, S.; Jean-Philippe, G.E. Downscaling of solar-induced chlorophyll fluorescence from canopy level to photosystem level using a random forest model. Remote Sens. Environ. 2018, 231, 110772. [Google Scholar] [CrossRef]
  19. Zeng, Y.; Chen, M.; Hao, D.; Damm, A.; Badgley, G.; Rascher, U.; Johnson, J.E.; Dechant, B.; Siegmann, B.; Ryu, Y. Combining near-infrared radiance of vegetation and fluorescence spectroscopy to detect effects of abiotic changes and stresses. Remote Sens. Environ. 2022, 270, 112856. [Google Scholar] [CrossRef]
  20. Zeng, Y.; Badgl Ey, G.; Dechant, B.; Ryu, Y.; Berry, J.A. A practical approach for estimating the escape ratio of near-infrared solar-induced chlorophyll fluorescence. Remote Sens. Environ. 2019, 232, 111209. [Google Scholar] [CrossRef] [Green Version]
  21. Guanter, L.; Zhang, Y.; Jung, M.; Joiner, J.; Voigt, M.; Berry, J.A.; Frankenberg, C.; Huete, A.R.; Zarco-Tejada, P.; Lee, J.-E.; et al. Global and time-resolved monitoring of crop photosynthesis with chlorophyll fluorescence. Proc. Natl. Acad. Sci. USA 2014, 111, E1327–E1333. [Google Scholar] [CrossRef] [Green Version]
  22. Dechant, B.; Ryu, Y.; Badgley, G.; Zeng, Y.; Moya, I. Canopy structure explains the relationship between photosynthesis and sun-induced chlorophyll fluorescence in crops. Remote Sens. Environ. 2020, 241, 111733. [Google Scholar] [CrossRef] [Green Version]
  23. Wang, C.; Guan, K.; Peng, B.; Chen, M.; Miao, G. Satellite footprint data from OCO-2 and TROPOMI reveal significant spatio-temporal and inter-vegetation type variabilities of solar-induced fluorescence yield in the U.S. Midwest. Remote Sens. Environ. 2020, 241, 111728. [Google Scholar] [CrossRef]
  24. Zhang, J.; Pu, R.; Huang, W.; Yuan, L.; Luo, J.; Wang, J. Using in-situ hyperspectral data for detecting and discriminating yellow rust disease from nutrient stresses. Field Crops Res. 2012, 134, 165–174. [Google Scholar] [CrossRef]
  25. Huang, W.; Shi, Y.; Dong, Y.; Ye, H.; Wu, M.; Cui, B.; Liu, L. Progress and prospects of crop diseases and pests monitoring by remote sensing. Smart Agric. 2019, 1, 1–11. [Google Scholar] [CrossRef]
  26. Jing, X.; Zou, Q.; Bai, Z.-F.; Huang, W.-J. Research progress of crop diseases monitoring based on reflectance and chlorophyll fluorescence data. Acta Agron. Sin. 2021, 47, 2067–2079. [Google Scholar] [CrossRef]
  27. General Administration of Quality Supervision, Inspection and Quarantine of the People’s Republic of China; China National Standardization Management Committee. Technical Specifications for Forecasting Wheat Stripe Rust. 2011. Available online: https://kns.cnki.net/kcms/detail/detail.aspx?FileName=SCSF00036649&DbName=SCSF (accessed on 29 September 2011).
  28. Yuan, L.; Zhang, J.; Nie, C.; Wei, L.; Yang, G.; Wang, J. Selection of Spectral Channels for Satellite Sensors in Monitoring Yellow Rust Disease of Winter Wheat. Intell. Autom. Soft Comput. 2013, 19, 501–511. [Google Scholar] [CrossRef]
  29. Maier, S.W.; Günther, K.; Stellmes, M. Sun-Induced Fluorescence: A New Tool for Precision Farming. Digit. Imaging Spectr. Tech. Appl. Precis. Agric. Crop Physiol. 2004, 66, 207–222. [Google Scholar] [CrossRef]
  30. Liu, X.; Liu, L. Improving Chlorophyll Fluorescence Retrieval Using Reflectance Reconstruction Based on Principal Components Analysis. IEEE Geosci. Remote Sens. Lett. 2015, 12, 1645–1649. [Google Scholar] [CrossRef]
  31. Liu, X.; Liu, L. Assessing Band Sensitivity to Atmospheric Radiation Transferfor Space-Based Retrieval of Solar-Induced Chlorophyll Fluorescence. Remote Sens. 2014, 6, 10656–10675. [Google Scholar] [CrossRef] [Green Version]
  32. Gitelson, A.A. Wide Dynamic Range Vegetation Index for Remote Quantification of Biophysical Characteristics of Vegetation. J. Plant Physiol. 2004, 161, 165–173. [Google Scholar] [CrossRef] [Green Version]
  33. Viña, A.; Gitelson, A.A. New developments in the remote estimation of the fraction of absorbed photosynthetically active radiation in crops. Geophys. Res. Lett. 2005, 32, 17. [Google Scholar] [CrossRef] [Green Version]
  34. Gitelson, A.A. Remote estimation of fraction of radiation absorbed by photosynthetically active vegetation: Generic algorithm for maize and soybean. Remote Sens. Lett. 2019, 10, 283–291. [Google Scholar] [CrossRef]
  35. Kimm, H.; Guan, K.; Burroughs, C.H.; Peng, B.; Wu, G. Quantifying high-temperature stress on soybean canopy photosynthesis: The unique role of sun-induced chlorophyll fluorescence. Glob. Change Biol. 2021, 27, 2403–2415. [Google Scholar] [CrossRef] [PubMed]
  36. Dechant, B.; Ryu, Y.; Badgley, G.; Khler, P.; Berry, J. NIRvP: A robust structural proxy for sun-induced chlorophyll fluorescence and photosynthesis across scales. Remote Sens. Environ. 2022, 268, 112763. [Google Scholar] [CrossRef]
  37. Shi, Y.; Huang, W.; Luo, J.; Huang, L.; Zhou, X. Detection and discrimination of pests and diseases in winter wheat based on spectral indices and kernel discriminant analysis. Comput. Electron. Agric. 2017, 141, 171–180. [Google Scholar] [CrossRef]
  38. Chang, C.Y.; Wen, J.; Han, J.; Kira, O.; LeVonne, J.; Melkonian, J.; Sun, Y. Unpacking the drivers of diurnal dynamics of sun-induced chlorophyll fluorescence (SIF): Canopy structure, plant physiology, instrument configuration and retrieval methods. Remote Sens. Environ. 2021, 265, 112672. [Google Scholar] [CrossRef]
  39. Mahlein, A.K.; Steiner, U.; Hillnhütter, C.; Dehne, H.W.; Oerke, E.C. Hyperspectral imaging for small-scale analysis of symptoms caused by different sugar beet diseases. Plant Methods 2012, 8, 3. [Google Scholar] [CrossRef] [Green Version]
  40. Martinelli, F.; Scalenghe, R.; Davino, S.; Panno, S.; Scuderi, G.; Ruisi, P.; Villa, P.; Stroppiana, D.; Boschetti, M.; Goulart, L.R. Advanced methods of plant disease detection. A review. Agron. Sustain. Dev. 2015, 35, 1–25. [Google Scholar] [CrossRef] [Green Version]
  41. Calderón, R.; Navas-Cortés, J.; Lucena, C.; Zarco-Tejada, P.J. High-resolution airborne hyperspectral and thermal imagery for early detection of Verticillium wilt of olive using fluorescence, temperature and narrow-band spectral indices. Remote Sens. Environ. 2013, 139, 231–245. [Google Scholar] [CrossRef]
  42. Wang, L.; Liu, J.; Yang, F.; Yang, L.; Yao, B.; Gao, J. Winter wheat stripe rust remote sensing monitoring based on GF-1/WFV data. Trans. Chin. Soc. Agric. Eng. 2017, 33, 153–160. [Google Scholar] [CrossRef]
  43. Esmail, S.M.; Omara, R.I.; Abdelaal, K.; Hafez, Y.M. Histological and biochemical aspects of compatible and incompatible wheat-Puccinia striiformis interactions. Physiol. Mol. Plant Pathol. 2018, 106, 120–128. [Google Scholar] [CrossRef]
  44. Zhang, J. Methods for Information Extraction of Wheat Disease Based on Multi-Source Remote Sensing Data. Ph.D. Thesis, ZheJiang University, Hangzhou, China, 2012. [Google Scholar]
  45. Chen, W.; Wellings, C.; Chen, X.; Kang, Z.; Liu, T. Wheat stripe (yellow) rust caused by Puccinia striiformis f. sp.tritici. Mol. Plant Pathol 2014, 15, 433–446. [Google Scholar] [CrossRef] [PubMed]
  46. Miao, G.; Guan, K.; Suyker, A.E.; Yang, X.; Arkebauer, T.J.; Walter-Shea, E.A.; Kimm, H.; Hmimina, G.Y.; Gamon, J.A.; Franz, T.E. Varying Contributions of Drivers to the Relationship Between Canopy Photosynthesis and Far-Red Sun-Induced Fluorescence for Two Maize Sites at Different Temporal Scales. J. Geophys. Res. Biogeosci. 2020, 125, e2019JG005051. [Google Scholar] [CrossRef] [Green Version]
  47. Yang, K.; Ryu, Y.; Dechant, B.; Berry, J.A.; Hwang, Y.; Jiang, C.; Kang, M.; Kim, J.; Kimm, H.; Kornfeld, A.; et al. Sun-induced chlorophyll fluorescence is more strongly related to absorbed light than to photosynthesis at half-hourly resolution in a rice paddy. Remote Sens. Environ. 2018, 216, 658–673. [Google Scholar] [CrossRef]
  48. Shanshan, D.; Liangyun, L.; Xinjie, L.; Jiaochan, H. Response of Canopy Solar-Induced Chlorophyll Fluorescence to the Absorbed Photosynthetically Active Radiation Absorbed by Chlorophyll. Remote Sens. 2017, 9, 911. [Google Scholar] [CrossRef] [Green Version]
  49. Zhang, X.; Hou, X.; Wang, M.; Wang, L.; Liu, F. Study on Relationship Between Photosynthetic Rate and Hyperspectral Indexes of Wheat Under Stripe Rust Stress. Spectrosc. Spectr. Anal. 2022, 42, 940–946. [Google Scholar]
  50. Ashraf, M.; Harris, P. Photosynthesis under stressful environments: An overview. Photosynthetica 2013, 51, 163–190. [Google Scholar] [CrossRef]
  51. Christiaan, V.; Rossini, M.; Cogliati, S.; Verhoef, W.; Colombo, R.; Rascher, U.; Mohammed, G. A model and measurement comparison of diurnal cycles of sun-induced chlorophyll fluorescence of crops. Remote Sens. Environ. 2016, 186, 663–677. [Google Scholar] [CrossRef]
  52. Micol, R.; Michele, M.; Marco, C.; Sergio, C.; Tommaso, J.; Cinzia, P.; Uwe, R.; Christiaan, V.D.T.; Roberto, C. Analysis of Red and Far-Red Sun-Induced Chlorophyll Fluorescence and Their Ratio in Different Canopies Based on Observed and Modeled Data. Remote Sens. 2016, 8, 412. [Google Scholar] [CrossRef] [Green Version]
  53. Atherton, J.; Nichol, C.J.; Porcar-Castell, A. Using spectral chlorophyll fluorescence and the photochemical reflectance index to predict physiological dynamics. Remote Sens. Environ. 2016, 176, 17–30. [Google Scholar] [CrossRef]
  54. Liu, L.; Liu, X.; Wang, Z.; Zhang, B. Measurement and Analysis of Bidirectional SIF Emissions in Wheat Canopies. IEEE Trans. Geosci. Remote Sens. 2016, 54, 2640–2651. [Google Scholar] [CrossRef]
  55. Fournier, A.; Goulas, Y.; Daumard, F.; Ounis, A.; Champagne, S.; Moya, I. Effects of vegetation directional reflectance on sun-induced fluorescence retrieval in the oxygen absorption bands. In Proceedings of the 5th International Workshop on Remote Sensing of Vegetation Fluorescence, Paris, France, 22–24 April 2014. [Google Scholar]
  56. Damm, A.; Guanter, L.; Verhoef, W.; Schläpfer, D.; Garbari, S.; Schaepman, M.E. Impact of varying irradiance on vegetation indices and chlorophyll fluorescence derived from spectroscopy data. Remote Sens. Environ. 2015, 156, 202–215. [Google Scholar] [CrossRef]
  57. Cartwright, D.; Russell, G. Development of Puccinia striiformis in a susceptible winter wheat variety. Trans. Br. Mycol. Soc. 1981, 76, 197–204. [Google Scholar] [CrossRef]
  58. Bushnell, W.R. Structural and Physiological Alterations in Susceptible Host Tissue. Cereal Rusts 1984, 1, 477–507. [Google Scholar]
  59. Liu, Q. Remote Sensing Monitoring and Duplex Real-Time PCR Quantitative Determination of Wheat Stripe Rust in Latent Period; China Agricultural University: Beijing, China, 2016. [Google Scholar]
  60. Chang, Q.; Liu, J.; Wang, Q.; Han, L.; Liu, J.; Li, M.; Huang, L.; Yang, J.; Kang, Z. The effect of Puccinia striiformis f. sp. tritici on the levels of water-soluble carbohydrates and the photosynthetic rate in wheat leaves. Physiol. Mol. Plant Pathol. 2013, 84, 131–137. [Google Scholar] [CrossRef]
  61. Kimm, H.; Guan, K.; Jiang, C. A physiological signal derived from sun-induced chlorophyll fluorescence quantifies crop physiological response to environmental stresses in the U.S. Corn Belt. Environ. Res. Lett. 2021, 16, 124051. [Google Scholar] [CrossRef]
  62. Zhang, J.; Huang, Y.; Pu, R.; Gonzalez-Moreno, P.; Yuan, L.; Wu, K.; Huang, W. Monitoring plant diseases and pests through remote sensing technology: A review. Comput. Electron. Agric. 2019, 165, 104943. [Google Scholar] [CrossRef]
  63. Ma, Z. Epidemiology of Plant Diseases; Science Press: Beijing, China, 2010. [Google Scholar]
Figure 1. Overview map of the study area.
Remotesensing 14 03427 g001
Figure 2. Overview of the relationships between SIFcanopy and SIFcanopy-related variables in the mild stage of disease onset (n = 104).
Remotesensing 14 03427 g002
Figure 3. Overview of the relationships between SIFcanopy and SIFcanopy-related variables in the moderate stage of disease onset (n = 99).
Remotesensing 14 03427 g003
Figure 4. Overview of the relationships between SIFcanopy and SIFcanopy-related variables in the severe stage of disease onset (n = 29).
Remotesensing 14 03427 g004
Figure 5. Overview of the relationships between the severity level (SL) of disease and SIFcanopy-related variables at a mild stage of disease onset (n = 104). Where ** indicates extremely significance at p < 0.001 level, * indicates extremely significance at p < 0.05 level.
Remotesensing 14 03427 g005
Figure 6. Overview of the relationships between the severity level (SL) and SIFcanopy-related variables at a moderate stage of disease onset (n = 99). Where ** indicates extremely significance at p < 0.001 level, * indicates extremely significance at p < 0.05 level.
Remotesensing 14 03427 g006
Figure 7. Overview of the relationships between the severity level (SL) and SIFcanopy-related variables at a severe stage of disease onset (n = 29). Where ** indicates extremely significance at p < 0.001 level.
Remotesensing 14 03427 g007
Figure 8. Optimal monitoring model of wheat stripe rust under different disease severity. (a) Mild disease stage with SIFtot as independent variable, (b) intermediate disease stage with SIFcanopy as an independent variable, and (c) severe disease stage with NIRVP as independent variable. Solid line represents 1:1 and dotted line represents the regression line between measured and predicted SL.
Remotesensing 14 03427 g008
Figure 9. The relationship between SIFcanopy and APARgreen at different stages of onset of wheat stripe rust. (a) Mild disease stage (n = 104), (b) intermediate disease stage (n = 99), and (c) severe disease stage (n = 29).
Remotesensing 14 03427 g009
Table 1. Model accuracy test under different disease severity.
Variable NameMild Condition
(n = 72)
Moderate Condition
(n = 69)
Severe Condition
(n = 20)
R2RMSER2RMSER2RMSE
SIFcanopy0.500.0370.46 *0.0460.340.101
SIFtot0.53 *0.0360.310.0510.280.109
NIRVP0.280.0440.230.0550.59 *0.068
Note: * indicate significance levels of p < 0.001 level.
Publisher’s Note: MDPI stays neutral with regard to jurisdictional claims in published maps and institutional affiliations.

