
Validation and Analysis of MISR and POLDER Aerosol Products over China
by
Sunxin Jiao
1,2, 
Mingyang Li
1,2,
Meng Fan
1,*,
Zhongbin Li
1,
Benben Xu
1,
Jinhua Tao
1 and
Liangfu Chen
1,2 1
State Key Laboratory of Remote Sensing Science, Aerospace Information Research Institute, Chinese Academy of Sciences, Beijing 100101, China
2
University of Chinese Academy of Sciences, Beijing 100049, China
*
Author to whom correspondence should be addressed.
Remote Sens. 2022, 14(15), 3697; https://0-doi-org.brum.beds.ac.uk/10.3390/rs14153697
Submission received: 7 May 2022
/
Revised: 19 July 2022
/
Accepted: 27 July 2022
/
Published: 2 August 2022
(This article belongs to the Special Issue Quantitative Remote Sensing Product and Validation Technology)
Abstract
:Multi-angle polarization measurement is an important technical means of satellite remote sensing applied to aerosol monitoring. By adding angle information and polarization measurements, aerosol optical and microphysical properties can be more comprehensively and accurately retrieved. The accuracy of aerosol retrieval can reflect the advantages and specific accuracy improvement of multi-angle polarization. In this study, the Multi-angle Imaging SpectroRadiometer (MISR) V23 aerosol products and the Polarization and Directionality of the Earth’s Reflectance (POLDER) GRASP “high-precision” archive were evaluated with the Aerosol Robotic Network (AERONET) observations over China. Validation of aerosol optical depth (AOD), absorbing aerosol optical depth (AAOD), and the Ångström exponent (AE) properties was conducted. Our results show that the AOD inversion accuracy of POLDER-3/GRASP is higher with the correlation coefficient (R) of 0.902, slope of 0.896, root mean square error (RMSE) of 0.264, mean absolute error (MAE) of 0.190, and about 40.71% of retrievals within the expected error (EE, ) lines. For AAOD, the performance of two products is poor, with better results for POLDER-3/GRASP data. POLDER-3/GRASP AE also has higher R of 0.661 compared with that of MISR AE (0.334). According to the validation results, spatiotemporal distribution, and comparison with other traditional scalar satellite data, the performance of multi-angle polarization observations is better and is suitable for the retrieval of aerosol properties.
1. Introduction
Atmospheric aerosol is a system composed of atmospheric medium and suspended solid or liquid particles, which can generate severe effects by interacting with cloud and atmosphere [1,2,3]. While affecting the radiation energy balance of the earth and the atmosphere, atmospheric aerosols also cause great harm to human health and threaten sustainable development [4,5,6]. The direct radiative forcing caused by anthropogenic aerosols and the indirect radiative forcing of aerosols in the process of cloud forming can lead to large uncertainties in the climate forcing calculation on a regional or global scale. In particular, complex physical and chemical properties of aerosols further increase the above uncertainties [7,8,9].
There have been many means of monitoring aerosol from various scales with different accuracies. Satellite measurements make it possible to obtain regional and global space observations, which make up for the lack of spatial representativeness in ground-based station monitoring [10,11]. Compared to the traditional non-polarized sensors, the multi-angle polarization instruments provide new possibilities for aerosol detection [12]. The Multi-angle Imaging SpectroRadiometer (MISR) is a multi-angle imaging spectrometer, and nine CCD cameras are used to carry out multi-angle observations on four channels [13]. By using multi-band and multi-angle observations, aerosol optical depth (AOD) and other optical properties can be retrieved. The Polarization and Directionality of the Earth’s Reflectance (POLDER), as a multi-angle polarization imager aboard the ADEOS-1, ADEOS-2, and PARASOL satellites, can observe the same ground target from up to 16 different view angles [14]. Because the polarization information observed is useful for the decoupling of atmosphere and surface, POLDER makes it possible to retrieve more aerosol parameters and carry out further research to study the microphysical properties of aerosols.
The multi-angle polarization ability of POLDER-3 sensor makes it possible to obtain more aerosol parameters [15,16,17]. Research showed that polarization is more sensitive to aerosol characters than surface [18]. Compared with the polarization effect of atmosphere, the proportion of surface is quite small. So, the combination of polarization observations, multi-band, and multi-angle can provide more information on aerosol observations besides radiant intensity. It is a very important polarization data source in the field of aerosol monitoring [19,20].
Based on various satellite data, different aerosol retrieval algorithms were developed, especially, for AOD, which can directly reflect the atmospheric aerosol loading condition. The Dark Target (DT), Deep Blue (DB), and Multi-Angle Implementation of Atmospheric Correction (MAIAC) algorithms are three AOD retrieval algorithms designed for MODerate Image Spectrometer (MODIS) [21,22,23]. The DT algorithm developed by Kaufman et al. [24] has been widely used and was further improved from then on. Jin et al. [25] applied DT to the advanced Medium-Resolution Spectral Imager (MERSI II), and their results showed that the performance of AOD was close to the ground measurements. However, in the face of severe air pollution, Nichol et al. [26] validated the newly developed MODIS DT Collection 6 algorithm over Asia; the results showed that the uncertainty came from underestimation of surface reflectance. The DB algorithm was proposed with a focus on AOD retrieval over bright surface [27,28]. Wei et al. [29] evaluated the MODIS DB Collection 6.1 algorithm and found great performance in Europe and North America. MAIAC algorithm decouples aerosol and surface by using time series data to retrieve AOD [30,31,32]. Zhang et al. [33] examined the performance of MAIAC AOD product and found good agreement with ground observations. Additionally, several other methods based on polarization observations were proposed or improved. Hou et al. [34] explored microphysical aerosol properties retrieval over vegetated land using near-infrared observations; they showed that adding near-infrared information may further acquire one to three parameters without obvious uncertainty decrease. Waquet et al. [35] proposed an approach to retrieve aerosol properties that estimates the surface reflectance using longer wavelength measurements.
The Generalized Retrieval of Atmosphere and Surface Properties (GRASP) algorithm is a newly developed algorithm based on POLDER instrument and AERONET retrieval algorithm [36,37]. The core of the GRASP is the optimal estimation inversion architecture. The GRASP algorithm can retrieval aerosol and surface properties at the same time [36]. The iterative inversion method is based on the optimal estimation theory without establishing a huge look-up table. In the inversion process, the Jacobian matrix of the observation of inversion parameters can be obtained synchronously by the forward radiative transfer calculation. The prior knowledge and observation errors are integrated into the cost function of the inversion, and the inversion results are obtained through continuous iterative solution. Many previous studies conducted a series of experiments concerning validating the accuracy of GRASP. Tan et al. [38] evaluated seven aerosol optical properties and concluded that POLDER-3/GRASP aerosol products are in good agreement with ground measurements. Wei et al. [39] compared POLDER-3/GRASP “Models” and “high-precision” products with Sun-Sky Radiometer Observation Network (SONET) products; the statistical analysis showed that POLDER-3/GRASP products are suitable for characterizing fine mode fraction. Chen et al. [19] validated three archives of GRASP aerosol products against AERONET observations globally, including five parameters. Therefore, compared with single-viewing sensors, multi-angle polarization measurements can be used to obtain reliable AODs and more aerosol optical and microphysical parameters.
This study aims to evaluate MISR V23 and POLDER-3/GRASP aerosol products over China against AERONET aerosol measurements, respectively. Section 2 describes three aerosol product datasets used in this paper. The key method and statistical factors are also explained. Section 3 shows the validation results of two satellite aerosol products. The analysis of temporal and spatial variation is presented in Section 4. Section 5 is the conclusion.
2. Data and Methods
2.1. Data
2.1.1. MISR V23 Aerosol Products
MISR instrument was launched in 1999, aboard the NASA Earth Observing System’s Terra satellite. In comparison with other former sensors, it is better in spatial resolution, along-track view angles, and calibration accuracy [13,40]. The high spatial resolution at 275 m or 1.1 km is beneficial for aerosol retrievals. MISR instrument takes nine identical cameras which have the ability of providing nine different viewing angles (0 at nadir, 26.1, 45.6, 60 and 70.5). There are four spectral bands, ranging from visible spectral to near-infrared spectral (446, 558, 672, and 866 nm). The detailed information and comparison methodology of MISR aerosol products used are listed in Table 1.
In recent years, the MISR retrieval algorithm was gradually improved to enhance our understanding of aerosol. The latest version 23 (V23) AOD products were released with a much higher resolution of 4.4 km compared to the version 22 AOD products of 17.6 km resolution. Moreover, the geolocation information and pixel-level uncertainty are added in V23 products [13]. Both V23 and V22 algorithms have the same retrieval principle based on a look-up table pre-calculated with 74 aerosol mixtures. These aerosol particles are different in size, shape, and absorbing/scattering properties. According to these above differences, the algorithm divides them into the following three types: spherical non-absorbing, spherical absorbing, and non-spherical absorbing aerosols [41]. The nine-angle observations provide more information on aerosol and surface. The empirical orthogonal function (EOF) is applied to realize the separation of atmosphere and surface for retrieving AOD and other parameters. Here, the latest MISR V23 aerosol products from March 2000 to August 2020 were obtained at website (https://asdc.larc.nasa.gov/project/MISR, accessed on 10 December 2021).
2.1.2. POLDER-3/GRASP Aerosol Products
The POLDER-3 on PARASOL was designed by CNRS in France and launched in December 2004. As the first multi-angle polarization imager, POLDER-3, with up to 16 different perspectives, contains three polarization channels of 443 nm, 670 nm, and 865 nm [14]. PARASOL satellite was a part of the A-train plan, which provided stable observations in 2005. However, PARASOL gradually left the A-train orbit in 2009, and its science mission came to an end in October 2013.
There are four archives of POLDER data processed by GRASP. In comparison with other products, a more accurate radiative transfer calculation is used in the generation of the POLDER-3/GRASP “high-precision” v1.2 Level 3 archive of POLDER-3/PARASOL product. Therefore, this POLDER-3/GRASP aerosol product was obtained from the GRASP website (https://www.grasp-open.com, accessed on 10 December 2021), covering the period from March 2005 to October 2013. The detailed information and comparison methodology of POLDER-3/GRASP aerosol products used are listed in Table 2.
2.1.3. AERONET Measurements
The Aerosol Robotic Network (AERONET) is a global scale aerosol monitoring network [42]. Through measuring direct sun radiance, AERONET observations are characterized with high quality, and are widely used to validate satellite measurements as “true” values [43,44]. Three levels of AERONET aerosol products (level 1.0: unscreened, level 1.5: cloud-screened, level 2.0: cloud-screened and quality-assured) can be found at https://aeronet.gsfc.nasa.gov/, accessed on 10 December 2021.
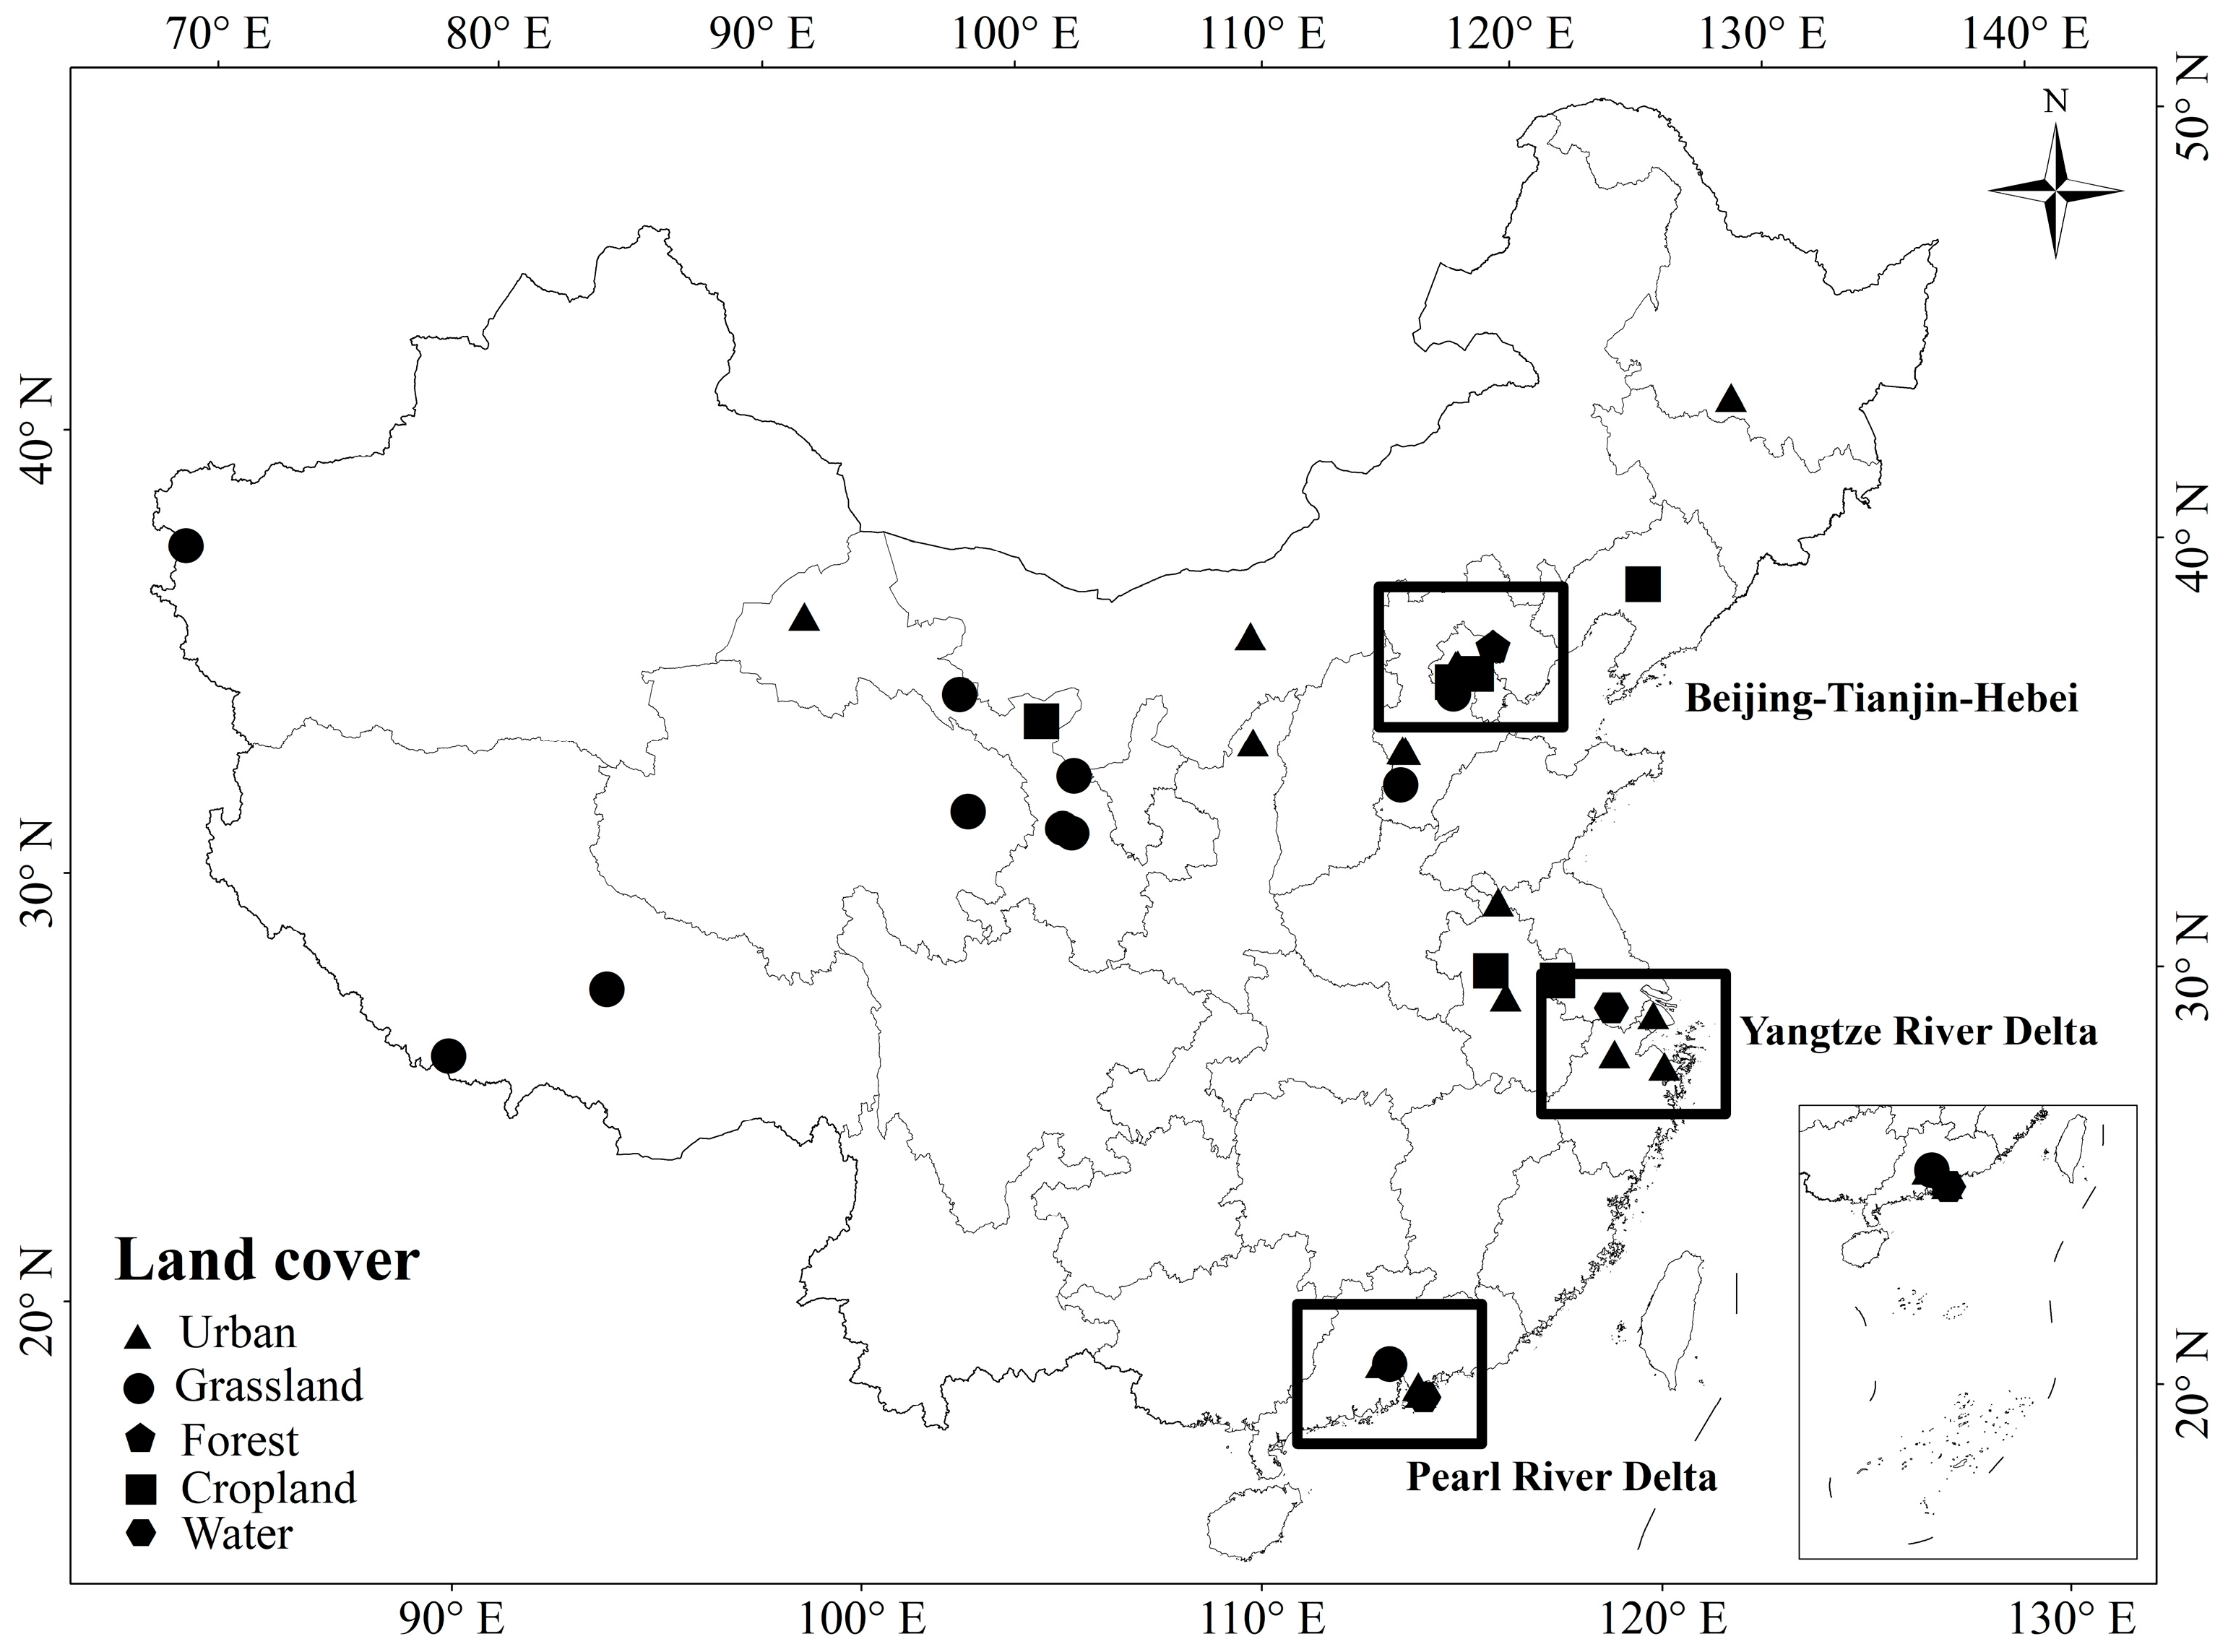
In this study, the AERONET AEROSOL OPTICAL DEPTH (V3)-SOLAR and AEROSOL_INVERSIONS (V3) products of 40 AERONET stations (Figure 1 and Table 3) from 2000 to 2020 over China were used for evaluating MISR V23 and POLDER-3/GRASP aerosol products. Due to the limitation of the number of level 2.0 data, both level 2.0 and level 1.5 products were selected to match more data pairs. To analyze the accuracy of satellite aerosol products over different surface types, MODIS MCD12Q1 data in the resolution of 500 m were employed to distinguish the surface type of each AERONET site. Then, 40 AERONET sites were divided into 5 land cover groups: urban, grasslands, water, croplands, and forest. The AERONET AEROSOL OPTICAL DEPTH (V3)-SOLAR data include AOD at 440 nm, 675 nm, 870 nm, and 1020 nm, respectively, and AE of wavelength 440–870 nm. The AERONET AEROSOL_INVERSIONS (V3) data includes the AAOD at 440 nm, 675 nm, 870 nm, and 1020 nm, respectively. Here, we only focused on validating the accuracy of aerosol products at 558 nm/565 nm, but the wavelengths provided by the AERONET are not completely consistent with them. In order to compare AOD/AAOD between satellite aerosol products and ground-based measurements at the same wavelength, the AERONET AOD/AAOD was interpolated into 558 nm and 565 nm by using the AE/AAE, respectively. For the AE, we compared AERONET data with MISR V23 and POLDER-3/GRASP aerosol products in the closest wavelength (i.e., MISR AE at 550–860 nm vs. AERONET AE at 500–870 nm, POLDER-3/GRASP AE at 443–865 nm vs. AERONET AE at 440–870 nm).
2.2. Matching Methods
2.2.1. Temporal and Spatial Windows
Due to the difference of the acquired time and spatial resolution between satellite observations and AERONET measurements, temporal and spatial windows were necessarily chosen to obtain matched data pairs for the validation. In terms of temporal windows, satellite observations were available only at the satellite overpass time while AERONET measurements provide abundant information with high temporal resolution. In this study, a temporal window with 30 min centered at the MISR or POLDER-3 observation time was used for averaging AERONET AOD and AE measurements. The temporal window of AAOD was set within 180 min because of a lower sampling frequency for AERONET AAOD. Considering the limitation of the number and spatial distribution of ground-based sites, a 50 km 50 km spatial window was selected to ensure the number of matched data pairs and precision.
2.2.2. Statistical Indicators
To evaluate the accuracy of MISR V23 aerosol products and POLDER-3/GRASP aerosol products, several statistical indicators were used in this paper, including the total number of matched data pairs (N), the correlation coefficient ®, slope and offset of the fitting line, root mean square error (RMSE), mean absolute error (MAE), and expected error (EE). R, RMSE, MAE, and EE for AOD/AE are defined in Equations (1)–(5), respectively.
Here, N is the number of matched data pairs; and are the AERONET and MISR V23 (or POLDER-3/GRASP) observations, respectively. and are the mean value of the AERONET and MISR V23 (or POLDER-3/GRASP) observations, respectively.
3. Results
3.1. MISR V23 Aerosol Properties
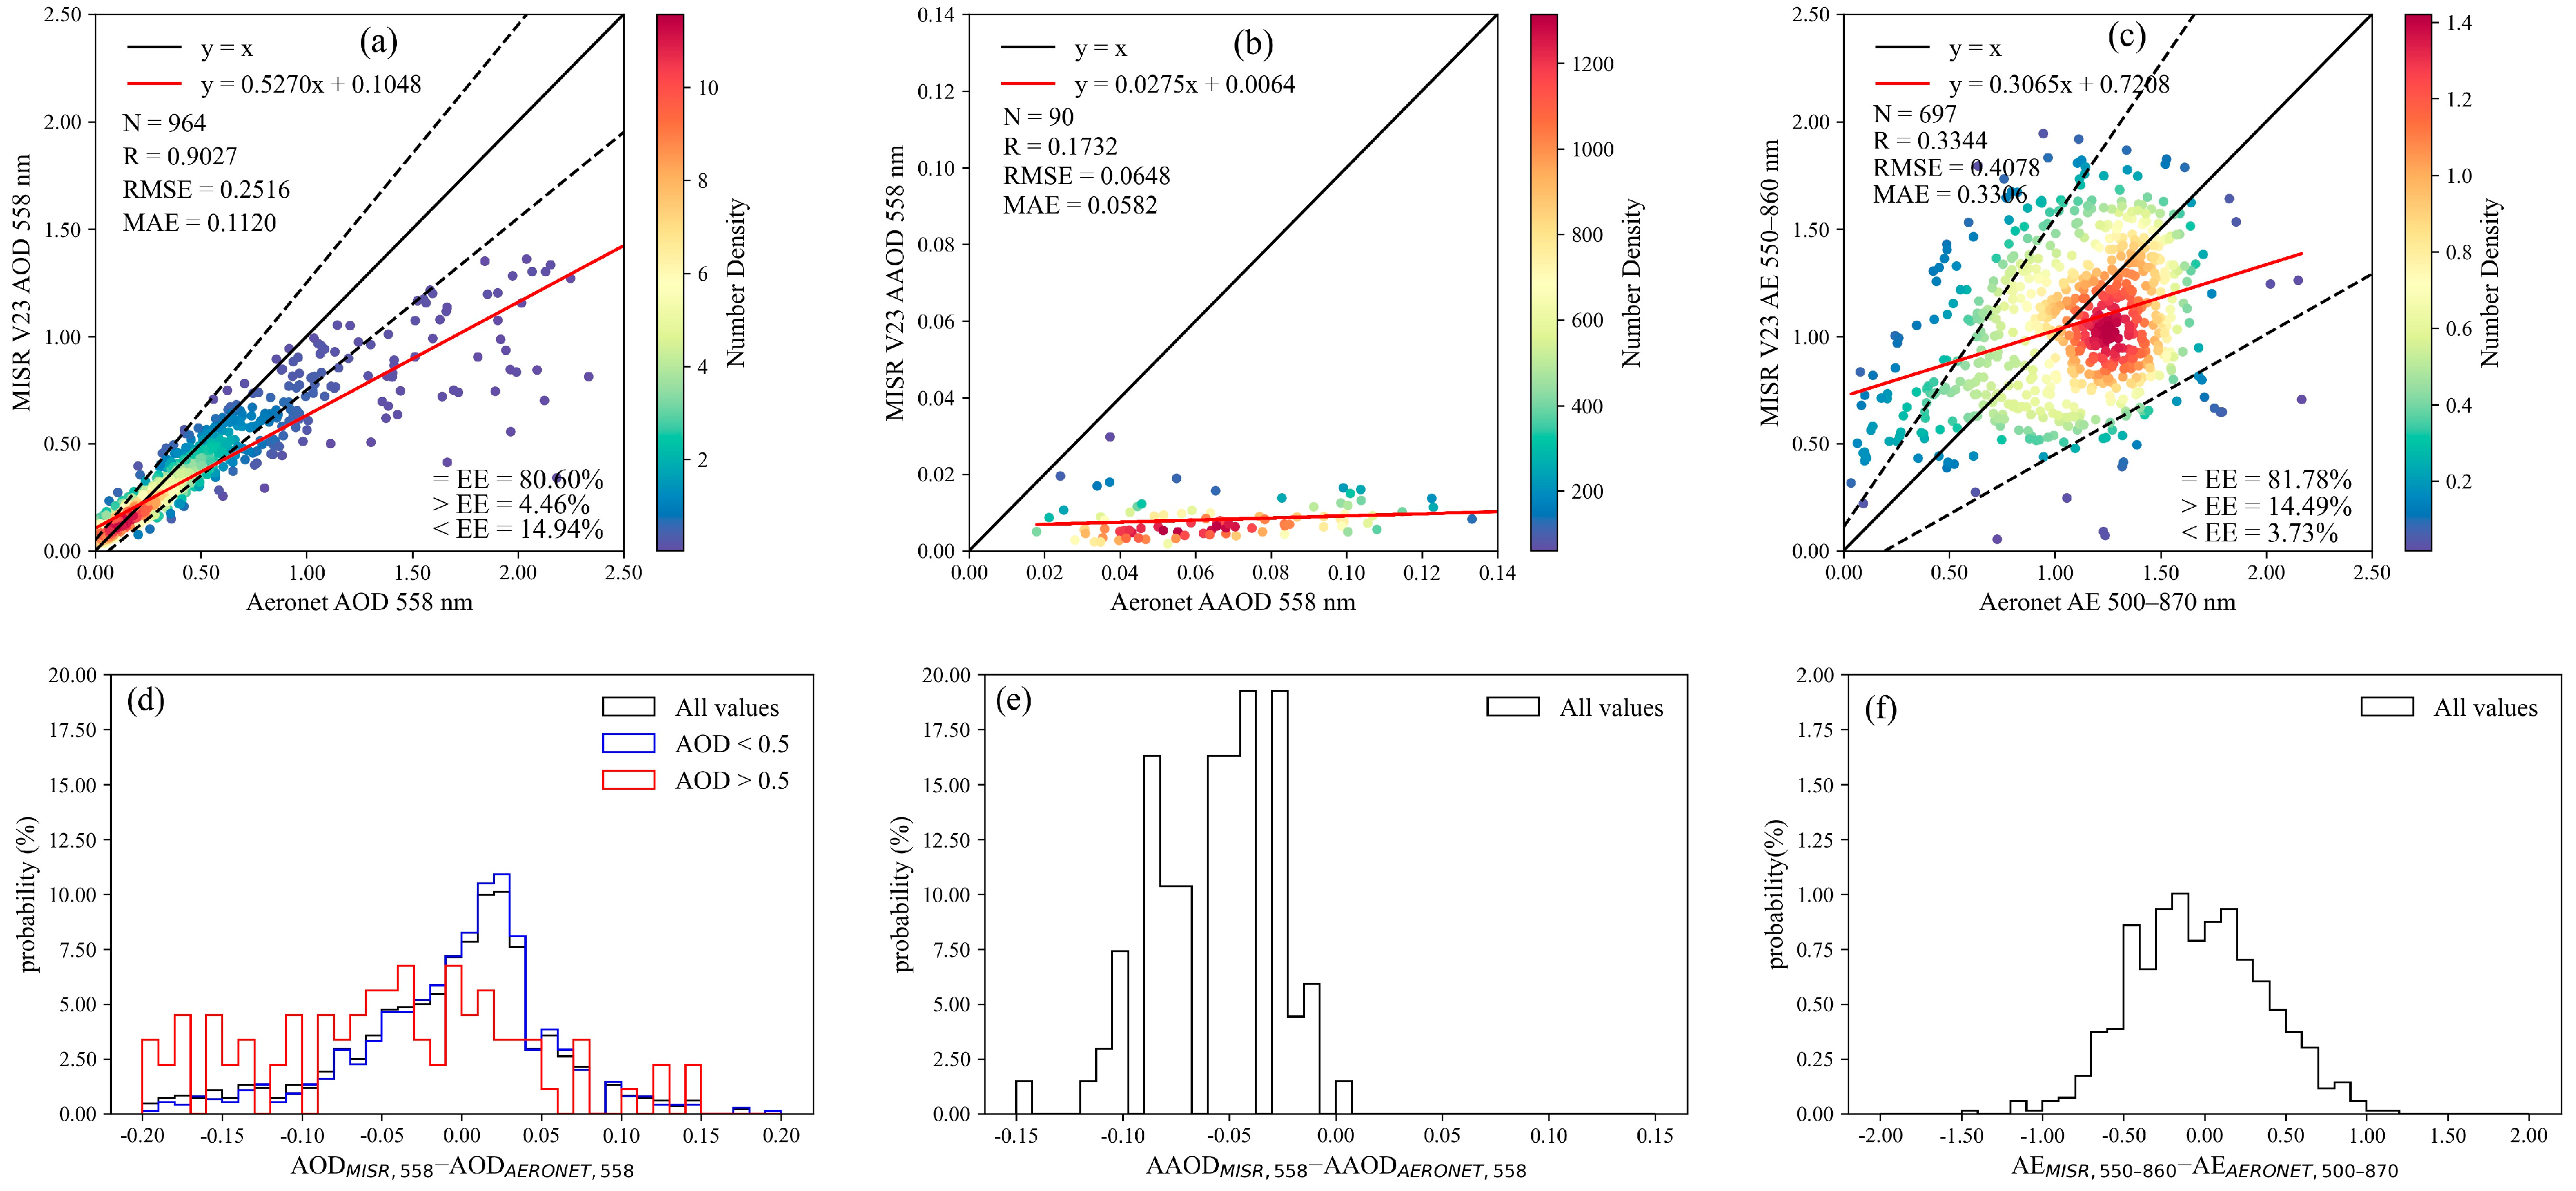
As an important indicator in characterizing air pollution, satellite-retrieved AOD is critical. Figure 2a shows the validation results between MISR V23 and AERONET AOD products. Although MISR aerosol products cover almost 20 years, the number of matched pairs is still small due to the limitation of the total valid MISR observation data. R and RMSE of the total 964 matchups are 0.903 and 0.252, respectively. About 80.60% matchups are within EE lines, meaning there is a good agreement between MISR and ground-based AODs. However, MISR AODs are underestimated with ~14.94% figures below EE lines, especially for heavy aerosol loadings. As shown in Figure 2d, the probability densities functions (PDFs) of the difference (AODMISR,558-AODAERONET,558) between MISR-retrieved AOD values and AERONET observations also indicate that the performance of MISR AOD products is obviously better at low AOD level than at high AOD level. According to the validation results of MISR V23 AOD products over different land cover (Table 4), most matched pairs are centered on urban area (R = 0.915) and croplands (R = 0.881). Compared with overall validation results, MISR V23 AOD products over forest and water show a better performance with a higher R and a greater percentage of matchups within the EE lines.
Aerosol types can be divided into absorbing and scattering aerosols according to their optical properties. Absorbing aerosols have the strong ability of absorbing solar radiation, heating and stabling the atmosphere, affecting the formation of cloud, and destroying earth’s radiation budget. AAOD is an important parameter which indicates the absorbing properties of aerosols, helping one to study the radiative forcing affected by aerosols. The calculation of AAOD is related to AOD and single scattering albedo (SSA). For MISR V23 AAOD products (Figure 2b), matchup number is only 90, which is far smaller than that of AOD products. The main reasons are that AERONET 2.0 inversion of AAOD at level 2.0 requires moderate-high aerosol loading (AOD440 > 0.4) for reliable results, and the observation frequency of AERONET AAOD is lower than that of AOD. Both of them limit the available number of AERONET AAOD. The linear regression shows a weak relevance between MISR V23 and AERONET AAOD data. MISR V23 AAODs are underestimated significantly, as shown in Figure 2b,e.
AE generally ranges from 0 to 2, and can reflect the size of aerosol particles to some extent. A smaller value shows that aerosol particles with larger size are the main composition, while a larger value represents that aerosol particles are composed of smaller size. Based on the validation results of MISR V23 AE products shown in Figure 2c, R and RMSE are only 0.334 and 0.408, respectively. About 81.78% pairs are within EE lines, and 14.49% of them are above EE lines. The relevance between satellite products and ground-based measurements is poor. MISR V23 AE products are underestimated in low value while overestimated in high value. The distribution of matched pairs shows the diversity of the size composition of aerosol particles. The results in the PDF figure indicate that most matched pairs have a slight difference with AERONET stations, but most of them are overestimated, the same as in the scatter figure. As shown in Table 4, validation results over different land cover reflect the difference of the performance of MISR V23 AE products. Overall, MISR V23 AE products perform better over urban (R of 0.342) and water (R of 0.610) areas than over other land cover areas. The performance of MISR V23 AE products over grasslands is the worst among these five land cover types, according to its lowest R and highest RMSE.
3.2. POLDER-3/GRASP Aerosol Properties
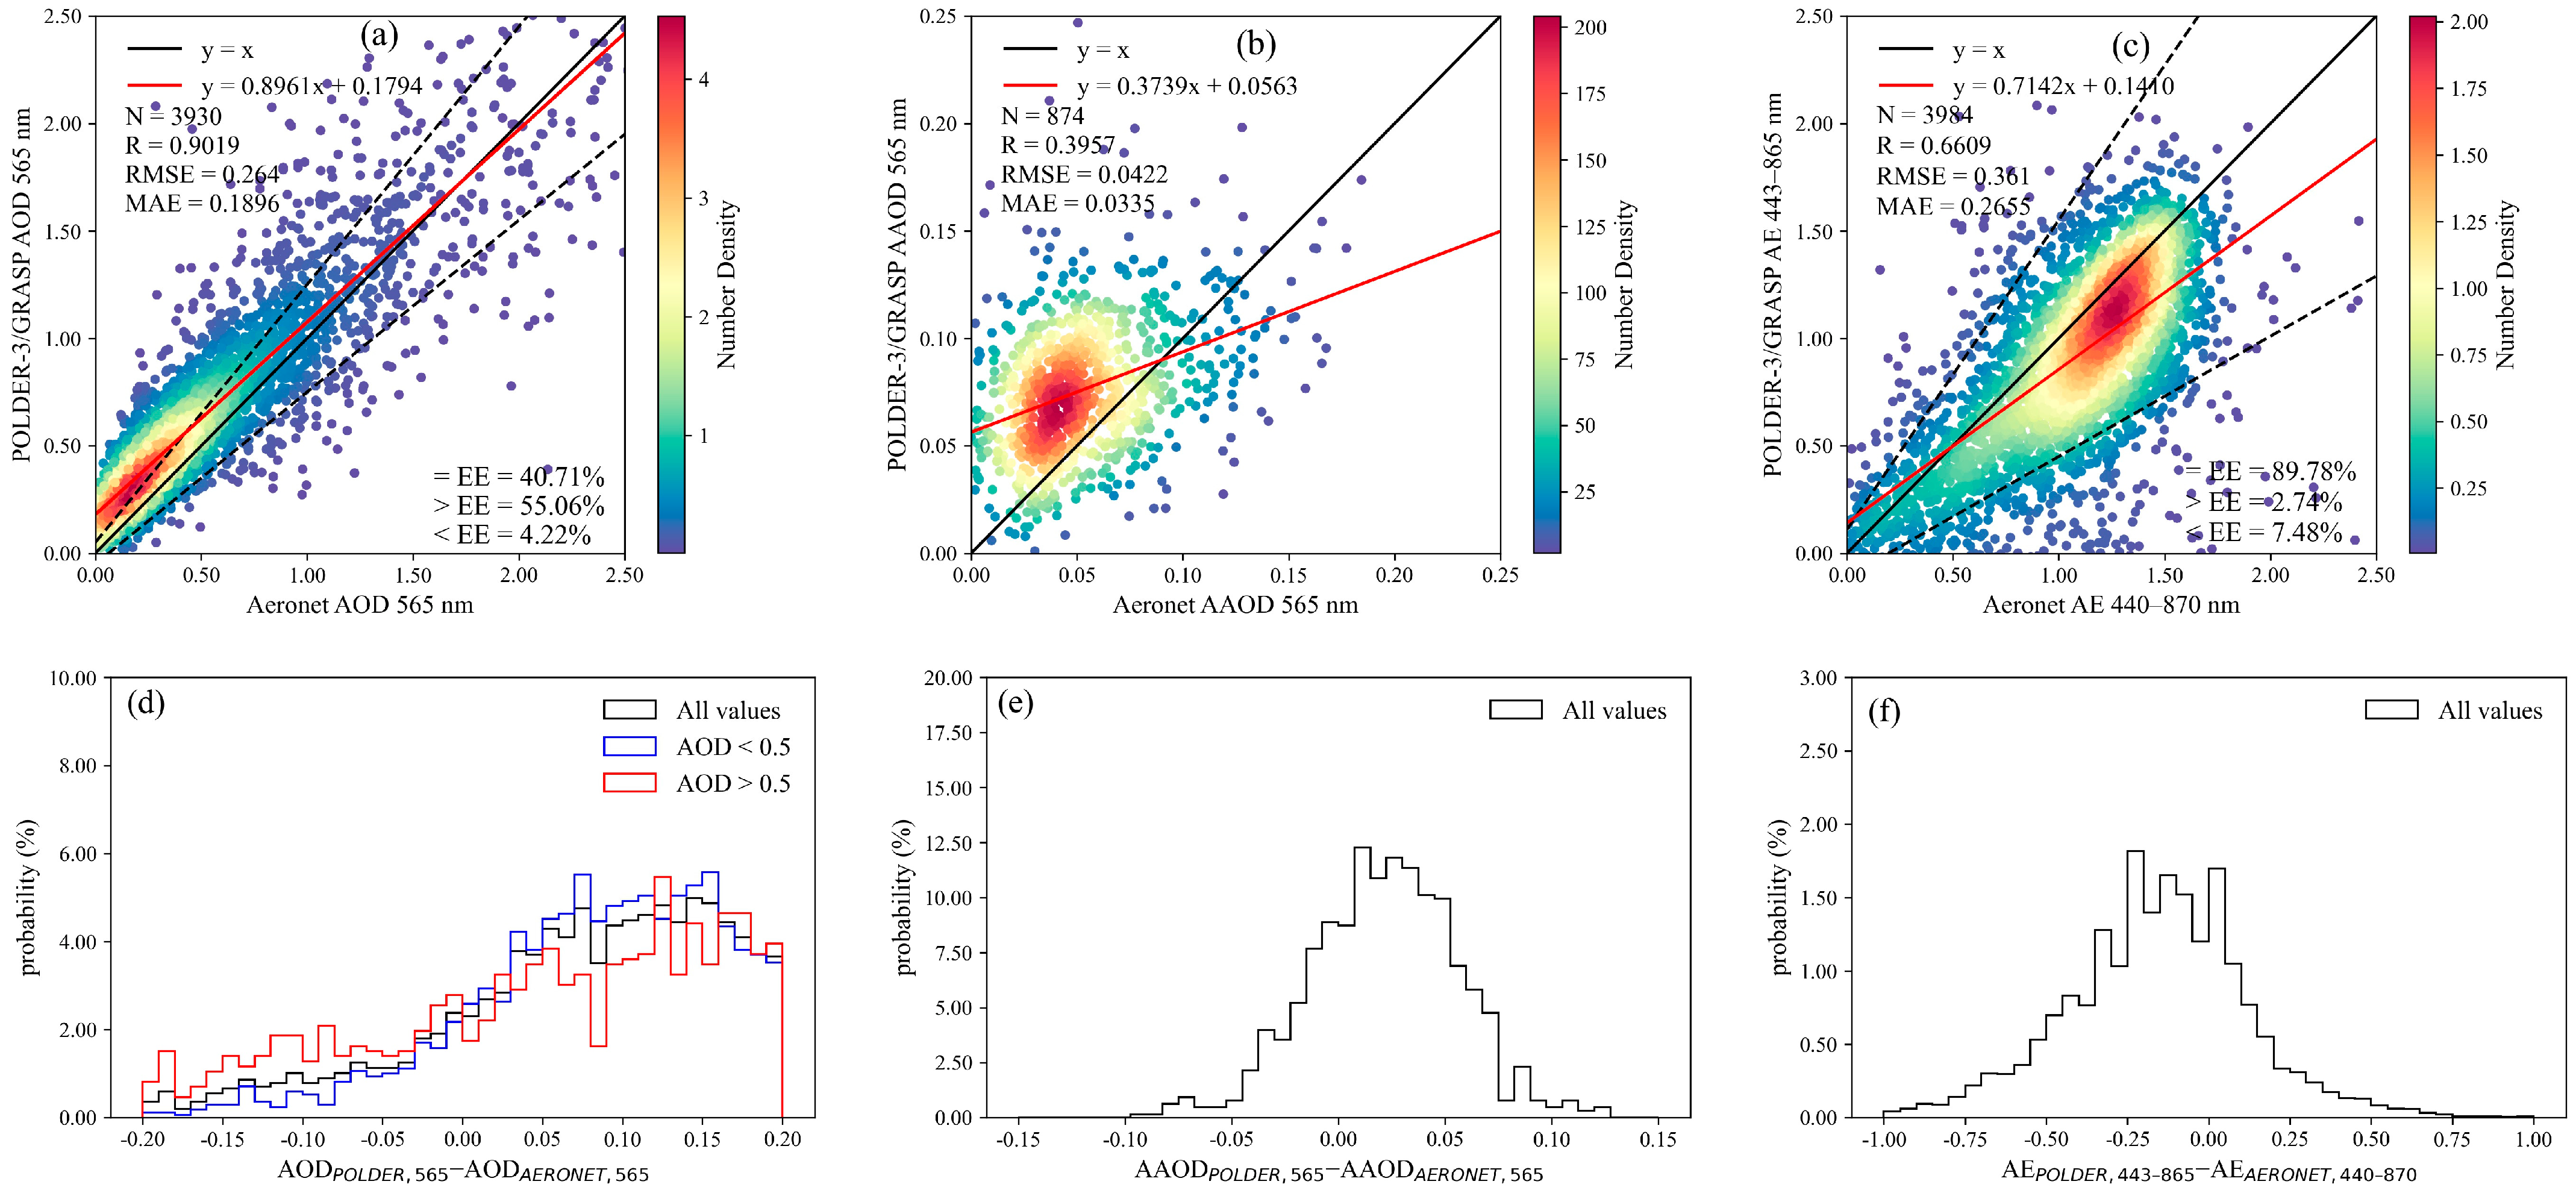
POLDER-3/GRASP aerosol products were validated against measurements from 34 AERONET sites (Figure 3). A high AOD R of 0.902 (Figure 3a) means that POLDER-3/GRASP performs well in retrieving AOD compared with ground-based observations. However, there are only about 40.71% pairs within the EE lines and 55.06% of them above the EE lines. POLDER-3/GRASP AODs are overestimated when AODs are low, while underestimation occurs when they are high. This means that there are potential uncertainties existing in the POLDER-3/GRASP AOD product when AODs are retrieved under a condition of low aerosol loading. PDF results of the AOD difference (AODPOLDER,565-AODAERONET,565) between POLDER-3/GRASP and AERONET data are shown in Figure 3d. It is obvious that underestimation of AODs mostly exists in high aerosol loadings while overestimation of AODs happens in low aerosol loadings, the same as the result shown in the corresponding scatter figure. For different land cover regions, POLDER-3/GRASP performs well over urban area and grasslands with RMSEs of 0.249 and 0.202, respectively (Table 5). Although AOD Rs are relatively high for all the surface types, AOD values are all overestimated, with more than half of them above the EE lines.
Similar to MISR data, the matched pair number of AAOD between POLDER-3/GRASP and AERONET products is still small, and R of 0.396 is relatively low (Figure 3b). The result shows that the AAOD retrieval of the “high-precision” approach is also not as good as that of AOD. There is a significant overestimation at low AAOD levels where most matchups are centered. As shown in the PDFs of the difference (AAODPOLDER,565-AAODAERONET,565) between POLDER-3/GRASP and AERONET AAOD retrievals, most values are slightly overestimated and a few of them are underestimated, which is consistent with the result of the scatter figure.
Figure 3c depicts the validation result of AE retrievals. R of AE between POLDER-3/GRASP and AERONET aerosol data reaches 0.661, and most AE values are centered on the range of 1~1.5. The slope of the linear regression shows that AE is underestimated. Based on PDFs of the difference (AEPOLDER,443–865-AEAERONET,440–870) between POLDER-3/GRASP and AERONET observations, a small part of POLDER-3/GRASP AEs is slightly underestimated, with other values being distributed evenly. The validation result of POLDER-3/GRASP AE retrievals over different land cover regions in Table 5 indicates that the performance of POLDER-3/GRASP AE products is better over urban area and croplands than other land cover. In total, ~95% matchups are within the EE lines, and Rs of them are higher compared to others.
4. Discussion
4.1. Comparison with Other Aerosol Products
The performance of different AOD products in China or on a global scale is listed in Table 6. For MODIS products, MODIS DT and DTB AOD products perform better than MODIS DB with higher R and lower RMSE. There are about 65.32% of MODIS DTB AODs falling in the EE lines (±0.05 ± 0.2 × AOD), showing that the algorithm has good adaptability in aerosol retrieval in China [45]. For the Advanced Very-High-Resolution Radiometer (AVHRR) AOD product, RMSE is a little higher and there are 51.21% of AODs falling in the EE lines (±0.05 ± 0.25 × AOD), appearing as a slight underestimation of aerosol retrieval in China [46]. For the Visible Infrared Imaging Radiometer Suite (VIIRS) AOD product, R and RMSE are 0.92 and 0.17, respectively. With 80.32% of AODs falling in the EE lines (±0.05 ± 0.2 × AOD), the algorithm shows a good performance over both dark and bright surfaces [47]. For the Multi-Angle Implementation of Atmospheric Correction (MAIAC) AOD product, the R is the same as that of VIIRS AOD product while RMSE is higher than VIIRS AOD product [33], with less AOD falling in the EE lines (±0.05 ± 0.2 × AOD). For the Advanced Himawari Imager (AHI) AOD product, R and RMSE are 0.82 and 0.30, respectively [48]. There is about 55% of AOD within the EE lines (±0.05 ± 0.2 × AOD). On a global scale, it is obvious that the accuracy is higher over different land cover compared with that in China comprehensively. In the current research, both of the MISR V23 AOD products and the POLDER-3/GRASP AOD product perform well, since the R of all of them is about 0.90. However, there is about 80.60% and 40.71% of AOD within the EE lines (±0.05 ± 0.2 × AOD), respectively. It appears that although the correlation coefficient is high, there is little AOD falling in the EE lines. As shown in Figure 3a, POLDER-3/GRASP AOD product overestimates or underestimates AOD under different aerosol loadings. Compared with other aerosol products, it is obvious that the correlation coefficient between multi-angle/multi-angle polarization measurements and ground-based observations is high, which means that multi-angle polarization plays an important role in improving the inversion accuracy of aerosol optical parameters. The increase of observation information increases the number of aerosol parameters retrieved through satellite observation. More observations have more constraints on the inversion results, which is helpful for the improvement of the inversion accuracy. However, it can be seen from the proportion falling in the EE lines that there are still some deviations in the inversion of multi-angle polarization observations, which are related to the settings of angles or polarization bands and radiometric calibration accuracy [49]
4.2. Temporal Variation
4.2.1. Interannual Variation Characteristics
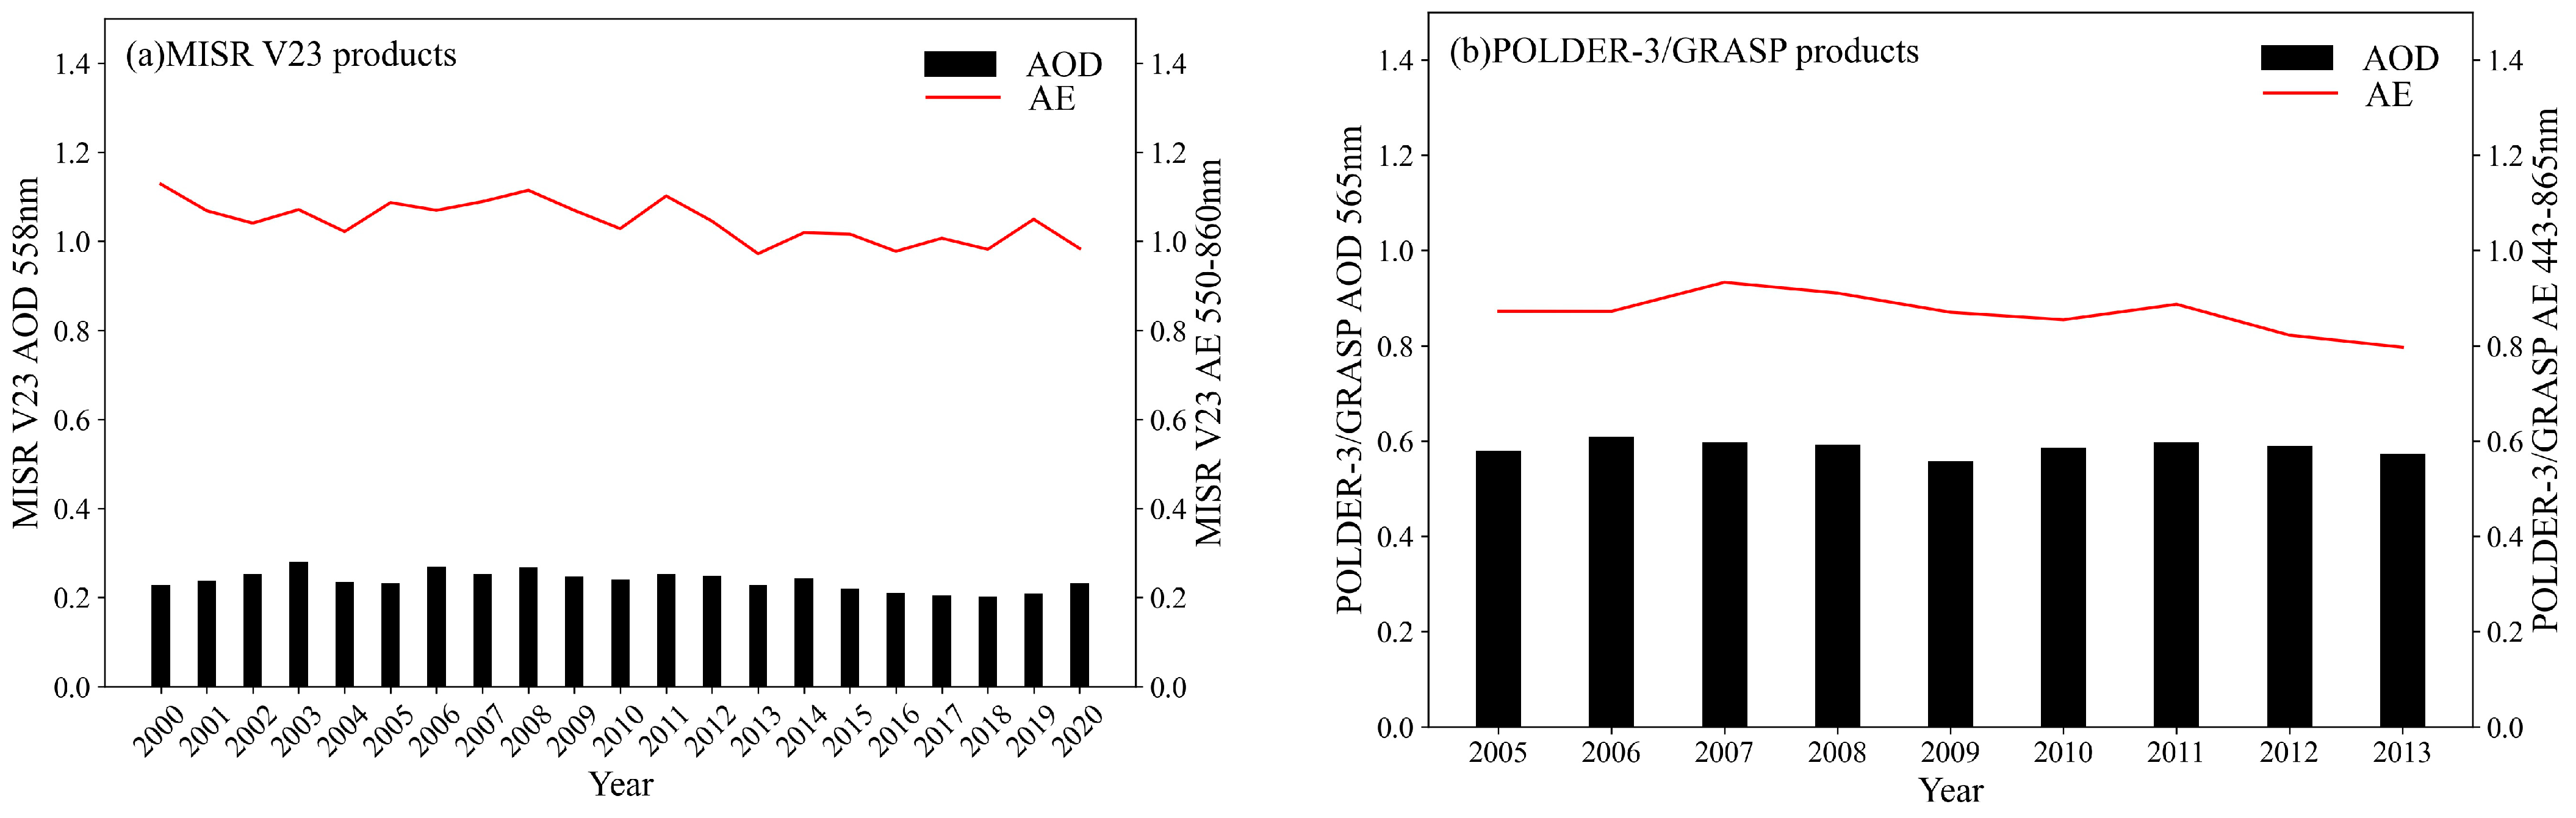
Figure 4 shows the variation of annual mean AOD and AE products from MISR V23 (Figure 4a; 558 nm for AOD; 550–860 nm for AE) and POLDER-3/GRASP products (Figure 4b; 565 nm for AOD; 443–865 nm for AE). Overall, although the difference of value between two products is obvious, the variation trend of AOD is similar. Considering the time series of MISR V23 products is longer than POLDER-3/GRASP, variation analysis of AOD and AE are based on MISR V23 products. In terms of AAOD, POLDER-3/GRASP product is selected for its correlation coefficient (0.396), which is much higher than that of MISR V23 product (0.173).
The national mean AOD was 0.238 from 2000 to 2020. From comparison of two products with AERONET observations discussed in Section 3, the value of MISR V23 AOD product is small, while the distribution of POLDER-3/GRASP is mean. This shows that there were obvious peaks and troughs during these years. Among them, the highest average AOD (0.280) appeared in 2003, while the lowest one (0.202) existed in 2018. From 2014 to 2019, the variation trend of annual mean AOD presented a drop year by year. This may be attributed to a series of measures taken by the state to prevent and control air pollution after the issue of “Ten measures to prevent and control air pollution”. The variation of the size of controlling aerosol particles is presented in the AE line plot, and the overall variation was relatively stable, ranging from 0.97 to 1.12. The national mean AE was 1.04 from 2000 to 2020, and the highest average AE (1.12) was in 2000, and the lowest one (0.97) appeared in 2013.
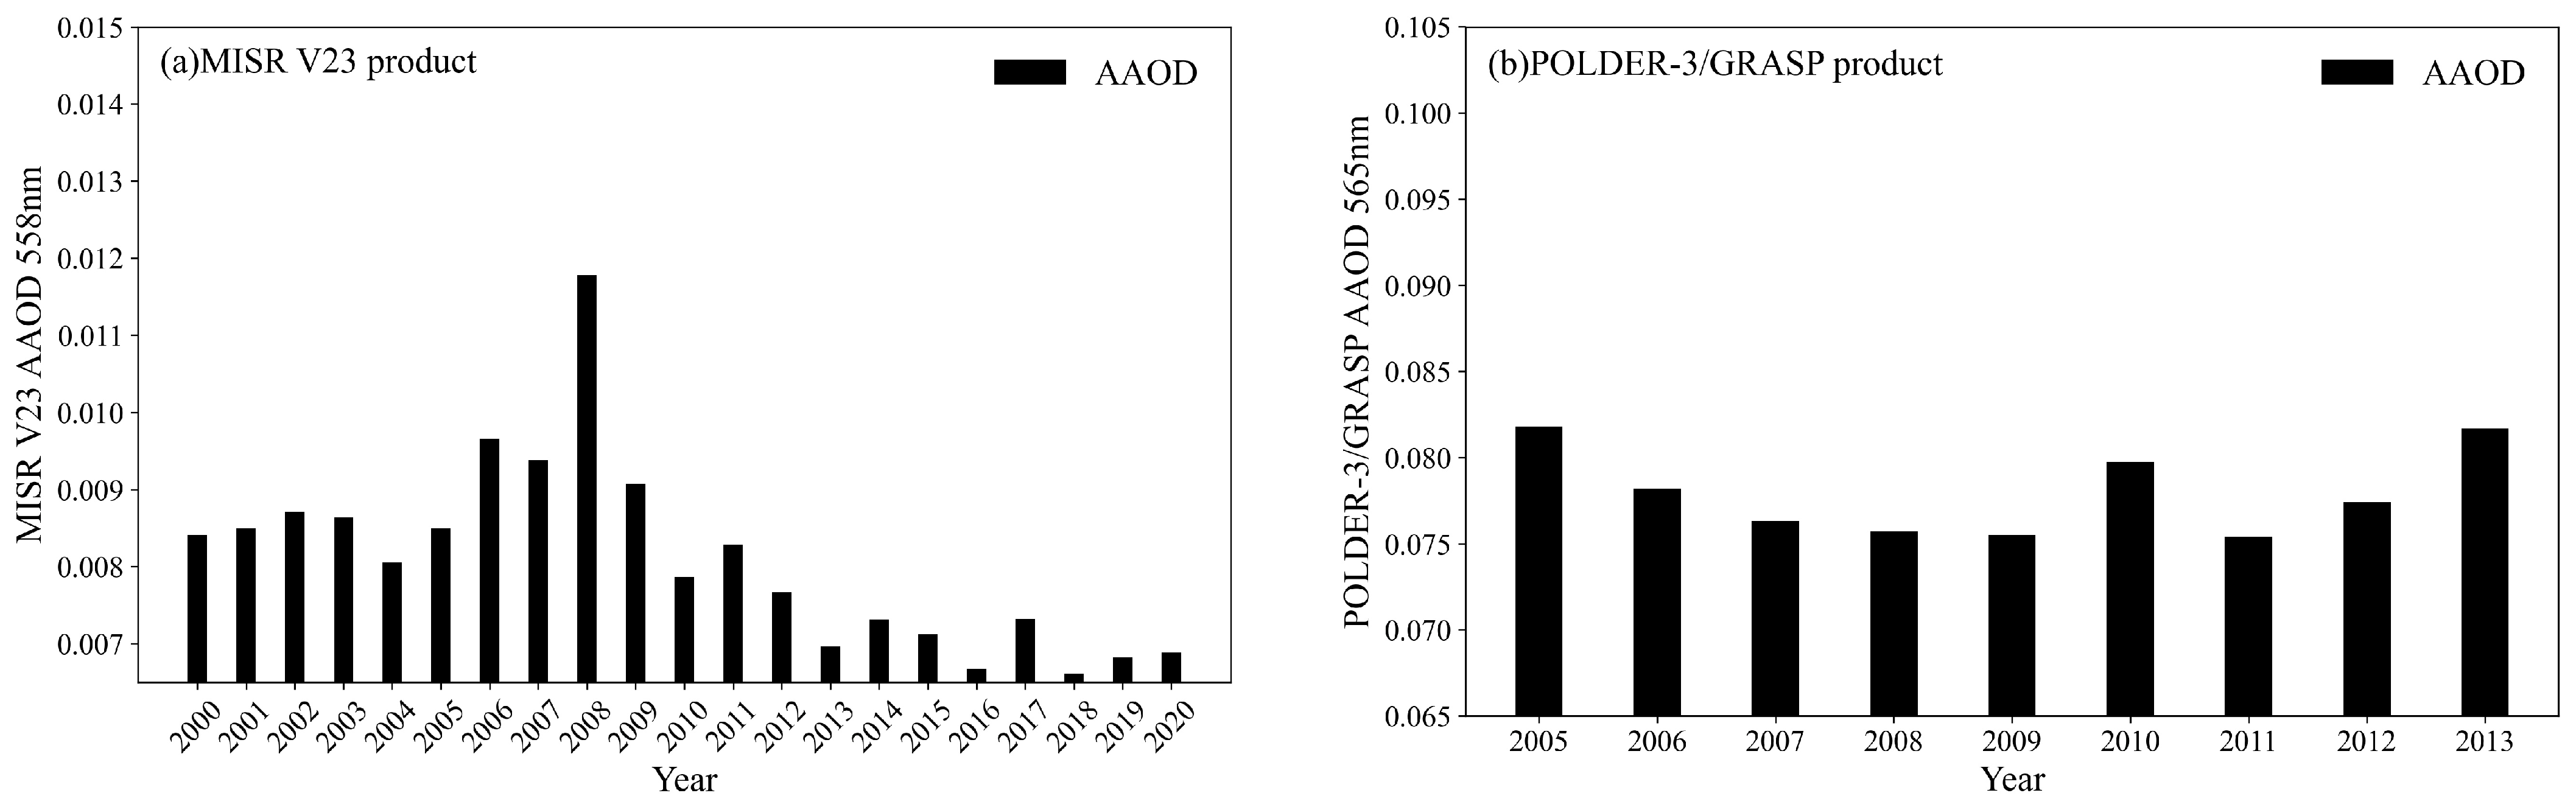
The variation trend of annual mean AAOD from MISR V23 and POLDER-3/GRASP products is shown in Figure 5. It is worth noting that the accuracy of MISR AAOD product is low and AAOD is severely underestimated; the following analysis is mainly based on POLDER-3/GRASP product. The highest and lowest AAOD from 2005 to 2013 are 0.082 and 0.076 in 2005 and 2009, respectively. The average AAOD was 0.078, with higher value in 2005, 2010, and 2013 than other years. Generally, absorbing aerosols affect the radiation budget balance by absorbing solar radiance, which can be divided into two categories: carbonaceous aerosol and dust aerosol. Furthermore, carbonaceous aerosols can be divided into black carbon aerosols and organic carbon aerosols. Among them, black carbon aerosols are mainly caused by fossil fuel and biomass combustion, indicating that aerosols produced by humans are the main source of absorbing aerosols. As a result, AAOD was reduced to a great extent after the measures of limiting the emission of fossil fuel and biomass burning during the Beijing Olympic Games. In a word, the variation of AAOD is closely connected to human activities and its trend varies with the burning of fossil fuel and biomass, which contributes to the variation of AOD.
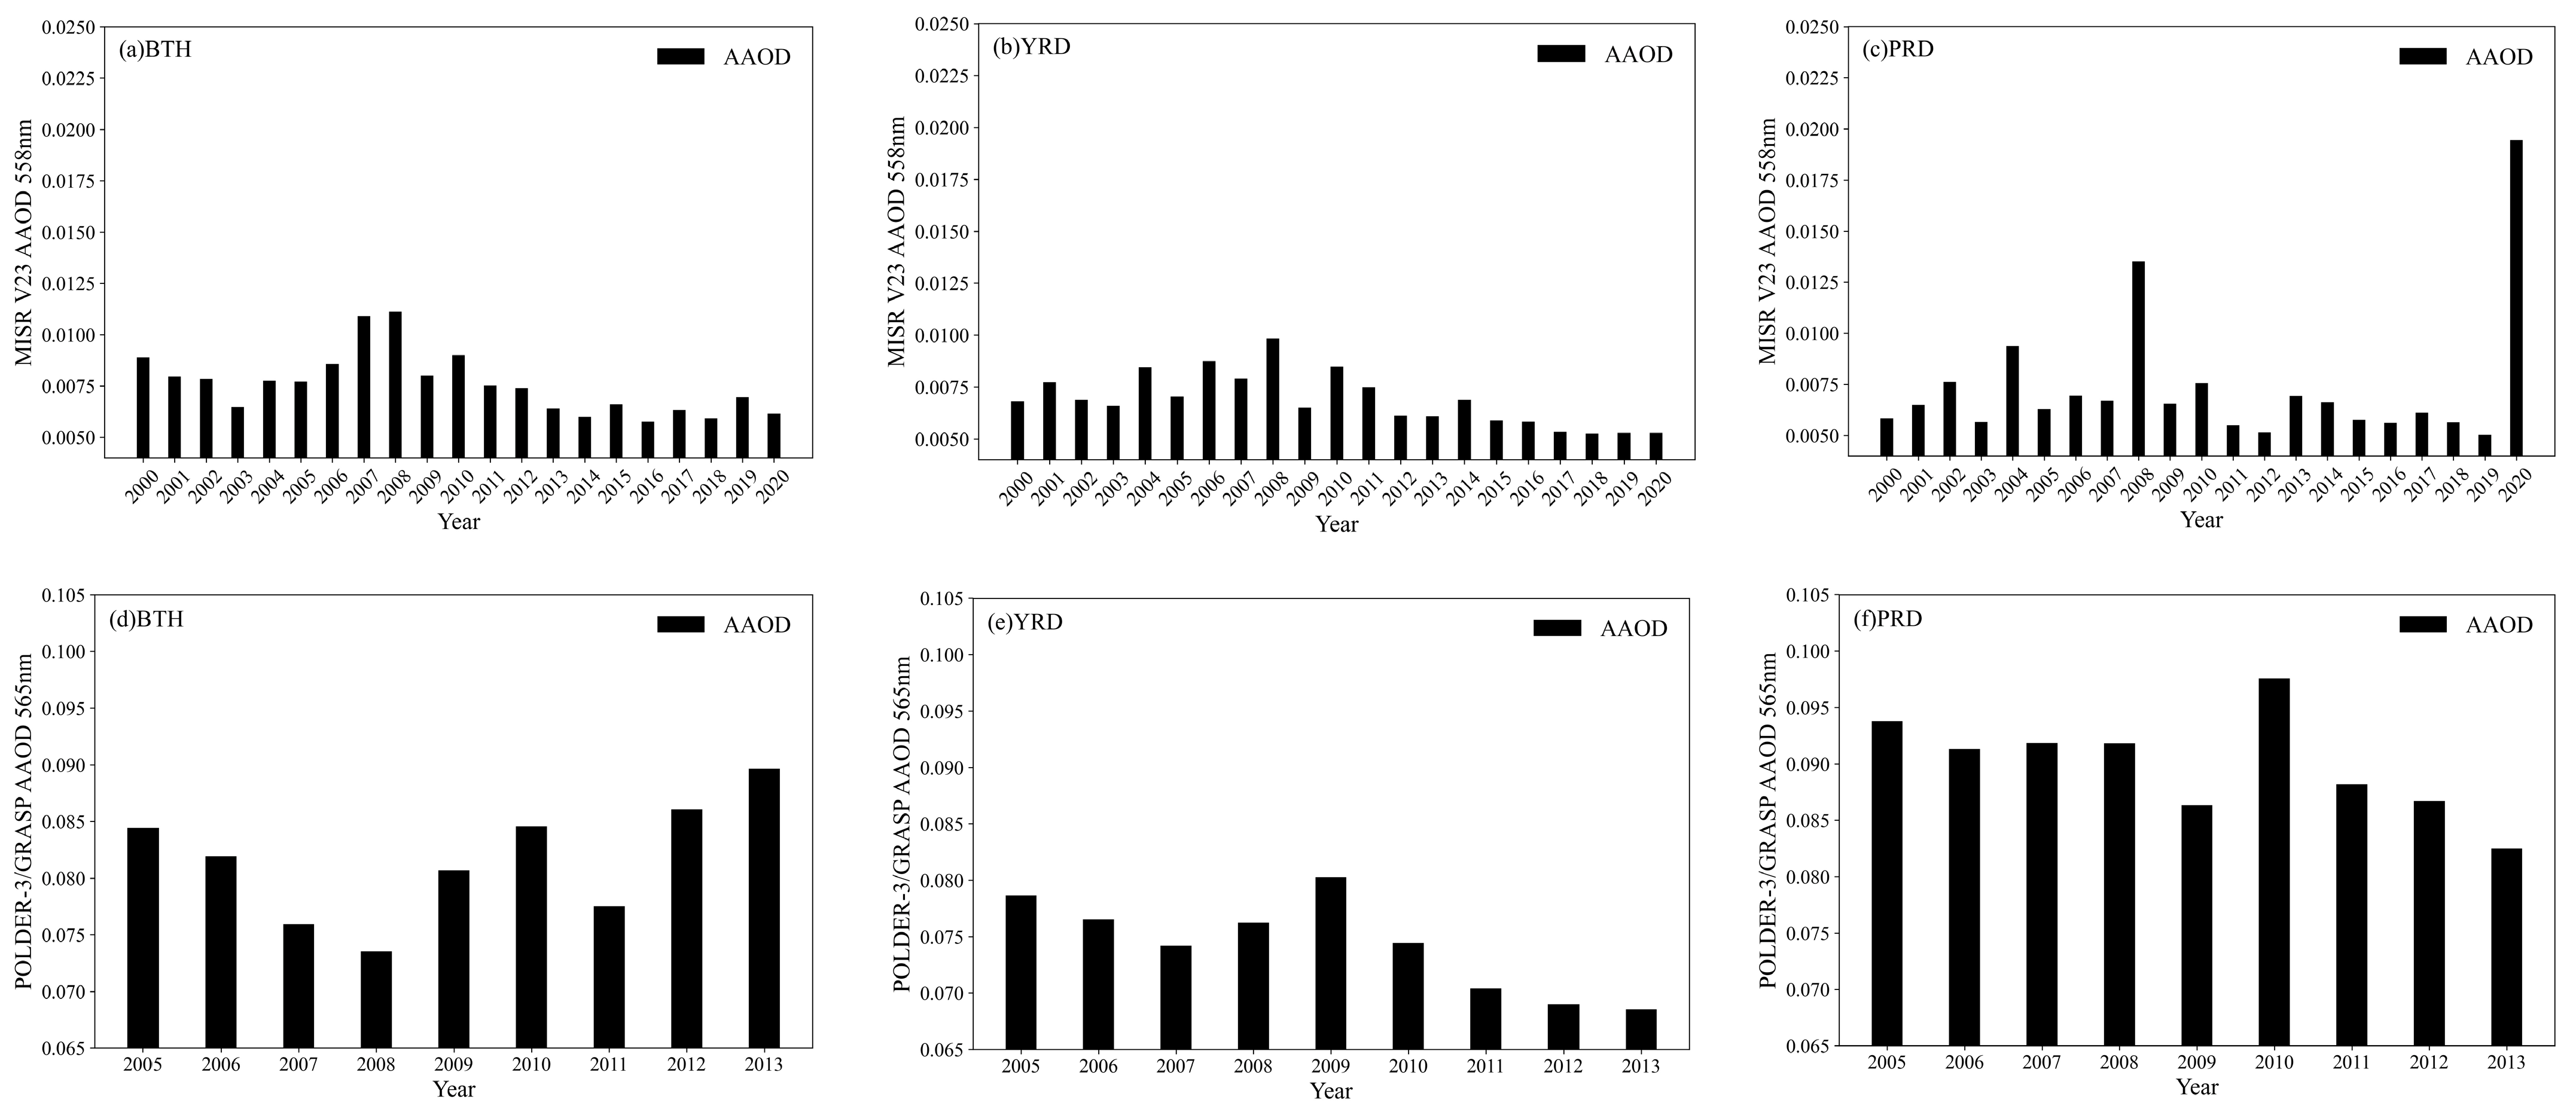
Figure 6 and Figure 7 show the variation figures of annual mean AOD, AE, and AAOD from MISR V23 products and POLDER-3/GRASP products at three key areas: Beijing-Tianjin-Hebei region (BTH), Yangtze River Delta (YRD), and Pearl River Delta regions (PRD).
BTH region is located in the North China Plain, in the mid latitude and on the East bank of the East Asian continent. The climate is controlled by the Mongolian high pressure. Therefore, it has the characteristics of typical warm temperate semi-humid continental monsoon climate. It has four distinct seasons, hot and rainy in summer, sunny and mild in autumn, cold and dry in winter, and short in spring and autumn. Compared with the range and trend of national AOD value, the AOD value in BTH region (Figure 6a) was at a high level, with an average annual value of 0.292. The minimum value (0.258) and maximum value (0.423) appeared in 2004 and 2003, respectively. The AE value in this area was generally high, indicating that BTH region was dominated by fine-mode particles. In the urban area, the particles in the air are mainly fine particles, which are affected by human life. The main controlling mode of aerosol was relatively stable. The aerosol mode of cities is significantly affected by industrialization, urbanization, and daily human activities, and the transport of sand and dust in arid areas of northwest China. Comparing the chart of AAOD value between China and BTH region (Figure 7d), the two trends are relatively consistent. The AAOD value decreased year by year from 2005 to 2008, and it reached the minimum value (0.074) in 2008, showing that the absorbing aerosols decreased significantly after limiting anthropogenic emission and burning. The AAOD value increased in 2009 and 2010, and showed an upward trend year by year after a slight decrease in 2011.
YRD region is located in the eastern monsoon region, belonging to the typical subtropical monsoon climate. Its most prominent feature is that the average temperature of the coldest month in winter is above 0 °C. In summer, the temperature is high and there are many rainy days. The climate is more suitable for planting than other regions, and the development of industry and agriculture is very good, so the overall economy of YRD is very strong. As shown in Figure 6b, the change of AOD in YRD fluctuates slightly, ranging from 0.313 to 0.511 in twenty-one years, with an average value of 0.410. There are some differences compared with the variation trend of national AOD value. The minimum value (0.313) was in 2018 and the maximum value (0.511) was in 2011. There was a significant downward trend after 2014, but it was at a high level as a whole, which was related to industrial production and intensive personnel flow in YRD. The change trend of AE was close to the national change trend, with an average value of 1.139. According to the AE range, it can be assumed that aerosols in YRD were urban industrial aerosols, and the aerosols produced by industrial production were the main source. Comparing the AAOD change figures of China and YRD (Figure 7e), it can be seen that the variation trend of these two was quite different. Compared with the national change range, the AAOD value in YRD was at a low level, which also shows that the change of the regional pollution situation is complex, and targeted analysis needs to be carried out in combination with local geography, economy, and human activities. As far as YRD is concerned, the minimum value of AAOD (0.069) was in 2013 and the maximum value (0.080) was in 2009. Although the variation range was small, subtle fluctuations can still be seen. From 2005 to 2009, it showed a slow decline and then an upward trend, and AAOD began to decline sharply after 2009.
PRD region is located in low-latitude areas, surrounded by mountains on three sides and facing the sea on one side. It belongs to the typical high-temperature and high-humidity climate area. Affected by a variety of local circulation types such as mountain valley wind, urban heat island, and sea land wind, the structure of the atmospheric boundary layer is relatively complex. The change charts of AOD, AE, and AAOD in PRD are shown in Figure 6c and Figure 7f, respectively. Comparing the change range and trend of AOD values between China and PRD, the average value of AOD in PRD was 0.391, which was higher than the national average. The minimum value (0.270) was in 2019 while the maximum value (0.490) was in 2013, and the overall trend was relatively stable. It can be seen from the broken line diagram of AE change that the overall AE value in PRD was above 1.0; the minimum value (1.001) was in 2014 while the maximum value (1.256) was in 2015. The average value was 1.102, which was higher than the national average, close to the AE value in YRD. Both PRD and YRD region belong to areas with developed industrial production activities. The proportion of man-made aerosols was relatively high, belonging to urban industrial aerosols. According to the change chart of AAOD value, AAOD in PRD was much higher compared with the other two areas from 2005 to 2013, with the minimum value (0.083) in 2013 and the maximum value (0.098) in 2010.
4.2.2. Seasonal Variation Characteristics
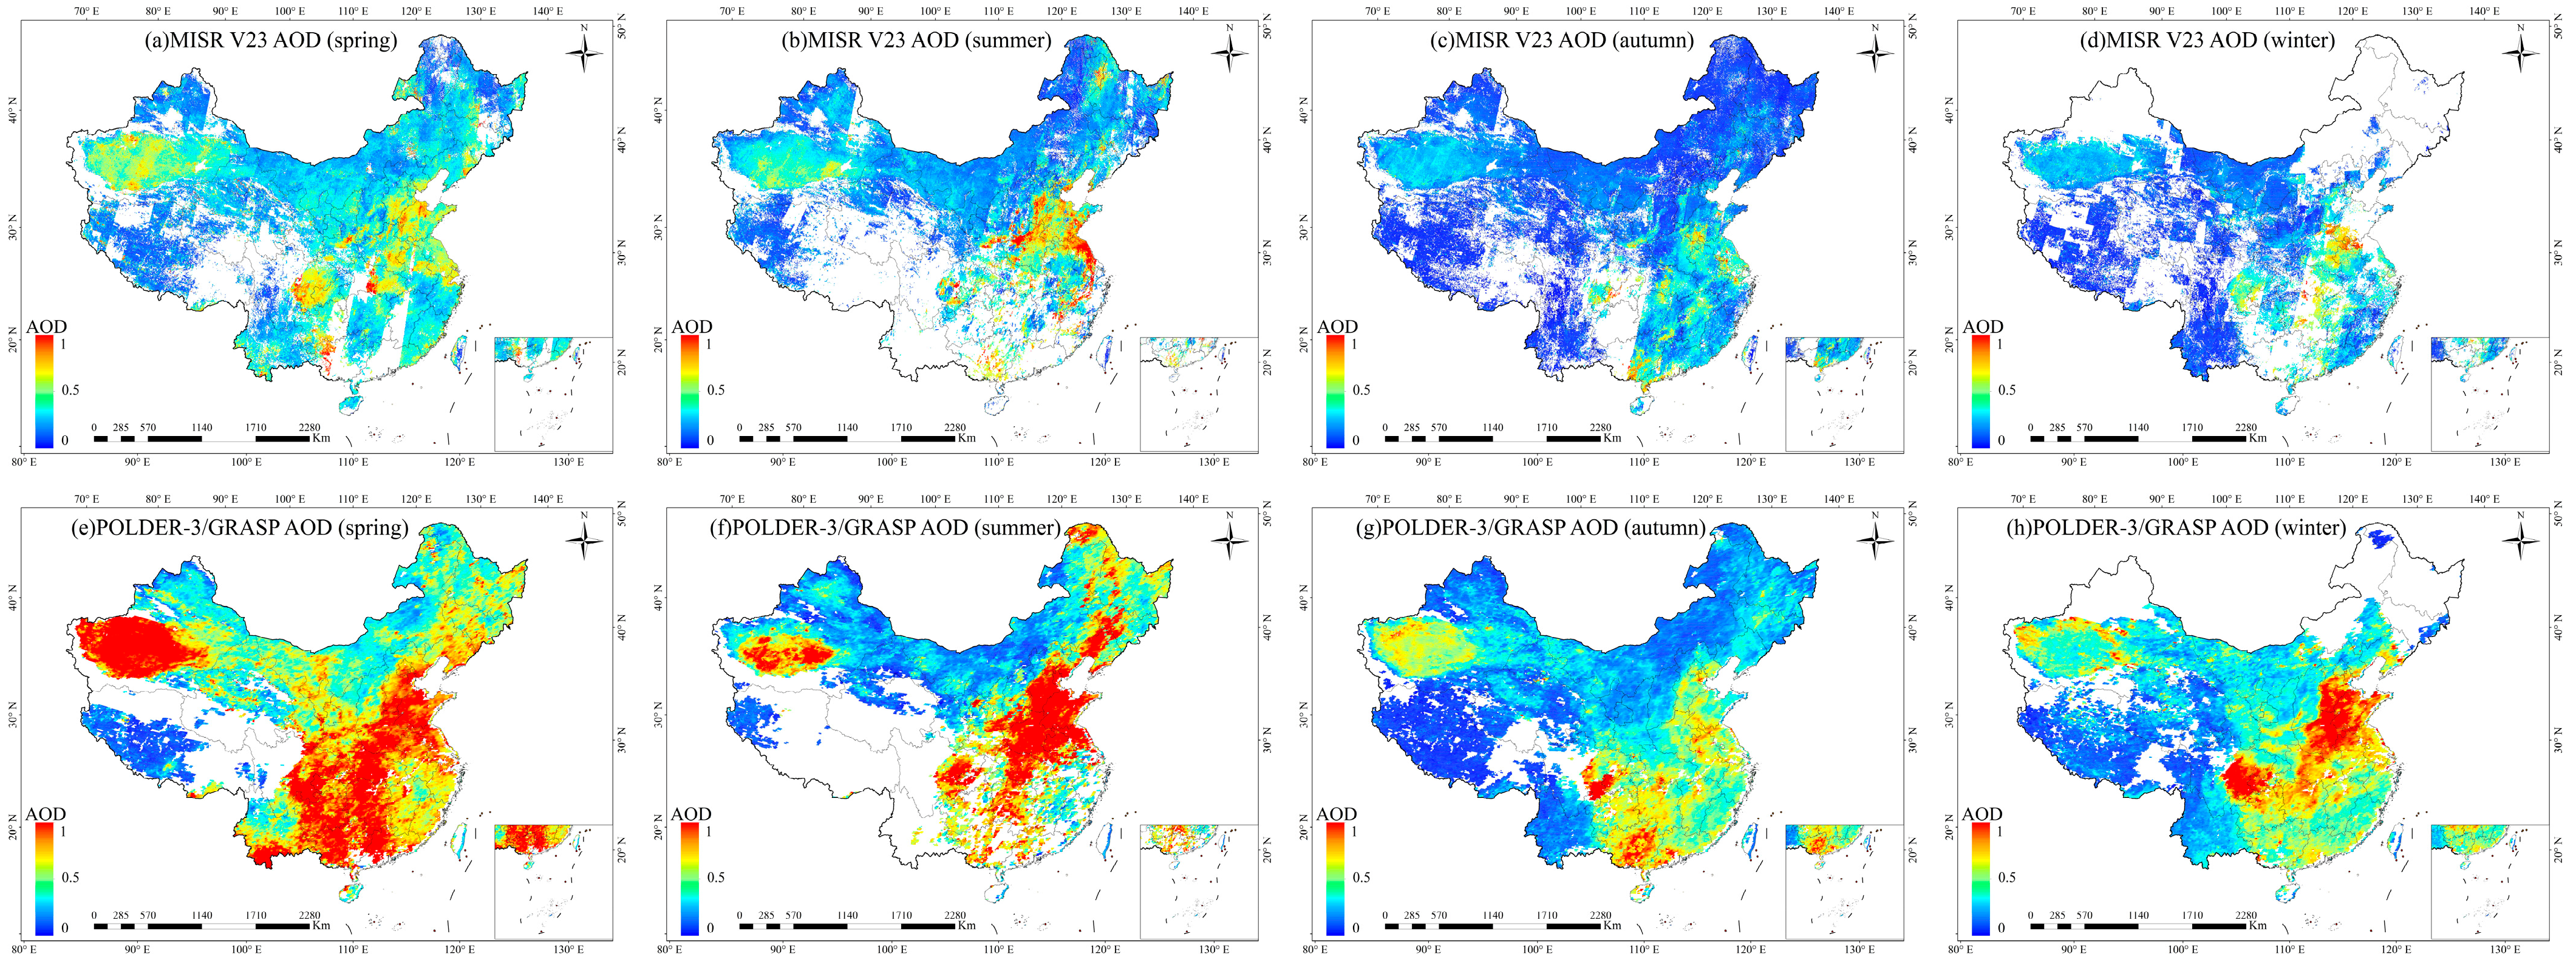
Figure 8 shows the average seasonal distribution of MISR V23 (Figure 8a–d; at 558 nm) and POLDER-3/GRASP (Figure 8e–h; at 565 nm) AOD in 2012. The four seasons are divided as follows: spring from March to May, summer from June to August, autumn from September to November, and winter from December to February of the following year. Comparing the variation and distribution of the two aerosol products, it is obvious that both two products are missed in a certain scale and the trend is similar. POLDER-3/GRASP AOD varies more evidently in the four seasons. On the whole, the difference of AOD value and distribution among the four seasons was very large. The AOD values in spring and summer are obviously higher than those in autumn and winter. AOD in spring is the largest, it gradually decreases from summer to winter, and the increase is very obvious from winter to the next spring.
In spring, the AOD value was on a high level among the four seasons in most parts of China. The high AOD value areas were mainly centered in the Tarim Basin, Sichuan Basin, the Middle East, and southern coastal areas, and the AOD is higher than 0.5, close to 1. This was mainly due to the influence of strong wind in spring. There are obvious and frequent dust phenomena in the Tarim Basin, resulting in the rapid increase of AOD value. Sichuan Basin was also a high-value area, which was mainly affected by topography. At the same time, the long-distance dust transport in Northwest China makes aerosols accumulate in the basin; the aerosols cannot diffuse outward. Due to the rare rainfall in spring, coupled with the influence of strong wind, sand, dust weather, and human activities, the AOD in the Middle East and coastal areas was also very high.
In summer, the scope of AOD high-value areas was narrowed, and the high value also decreased a lot, mainly centered in the Tarim Basin, Sichuan Basin, North China, and the Yangtze River Delta. Among them, the high value of AOD in Sichuan Basin decreased, mainly due to abundant precipitation in summer, which greatly shortened the aerosol life cycle due to rain erosion. However, recent studies have shown that there was a significant increase of temperature in Sichuan in summer, and the decrease of precipitation still led to the high AOD in summer [53]. Different from spring, the AOD value in North China and the Yangtze River Delta increased significantly, and the range of high-value areas was large, which was related to the continuous growth of man-made emissions. Both of the two regions belong to economically developed and densely populated areas, with large emissions from industry and transportation, which directly lead to the increase of aerosols. At the same time, the rainfall increases in summer with the high humidity. The moisture absorption of aerosol particles increases, so the backscattering coefficient increases, resulting in the increase of total extinction coefficient and the increase of AOD value. However, the observation and research show that the East Asian summer monsoon has weakened significantly in recent years, resulting in the decrease of summer precipitation. The lack of rainfall causes the aerosol to increase instead of decrease, and the increase of aerosols may lead to indirect aerosol effect, causing the decrease of precipitation [54]. Under the interaction, the trend of the high AOD value in four seasons has gradually shifted from spring to summer.
In autumn and winter, nationwide aerosols decreased obviously, and the high-value areas were centered in the southeast. The AOD value was significantly lower than the high value in spring and summer, and the range distribution was significantly narrowed. In autumn and winter, aerosols were in a relatively stable state. In winter, affected by the northern winter wind, the air flows from the low-value area in the northwest to the high-value area in the southeast, so that aerosols can diffuse and transmit. The high value of AOD in the southeast was influenced by northern heating in winter, and the combustion of fossil fuels increased the content of aerosols.
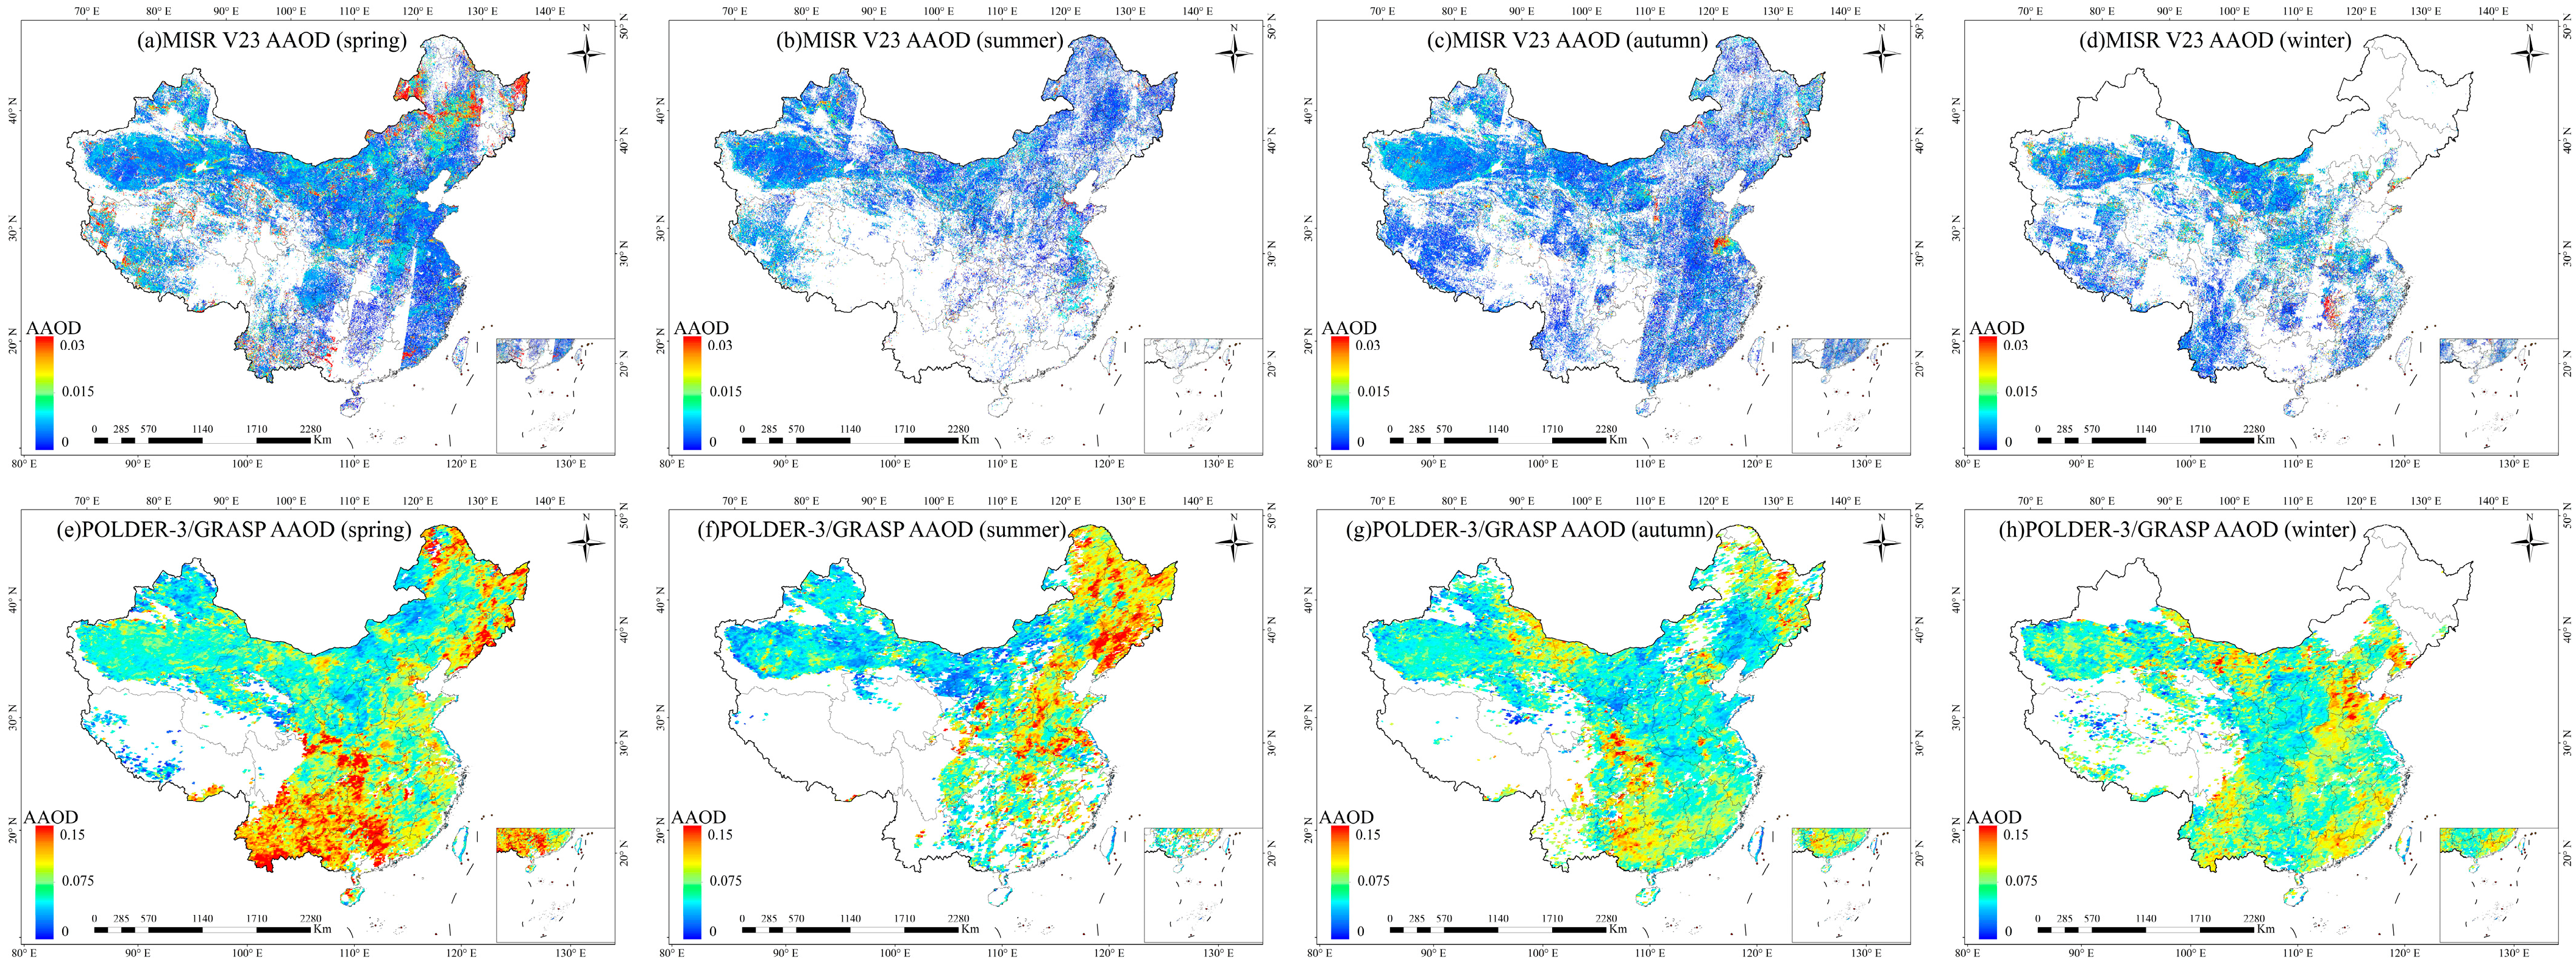
Figure 9 shows the average seasonal distribution of MISR V23 (Figure 9a–d; at 558 nm) and POLDER-3/GRASP (Figure 9e–h; at 565 nm) AAOD in 2012. The scale of valid value is much smaller than that of AOD, and the distribution is more scattered. AAOD refers to the attenuation of solar radiation caused by the absorption aerosols. In all, the variation trend of AAOD in four seasons in China was close to that of AOD. The high value in spring and summer was higher than that in autumn and winter. The high-value and low-value areas were mainly bounded by the Hu line, and were distributed to the east and west of the Hu line, respectively. In spring, the high-value areas were centered in the southern coastal areas and Northeast China, and were mainly related to the long-distance transportation of sand and dust. The high value in summer decreased and the range was narrowed. The AAOD in North China and YRD increased, which was mainly related to the burning of straw during the summer harvest and therefore generated black carbon aerosols [55]. At the same time, YRD was in the plum rain season, and the meteorological conditions led to poor diffusion [56], increasing the AAOD. AAOD was at a low level in autumn and winter, with a slight increase in winter, which was mainly related to factors such as coal combustion.
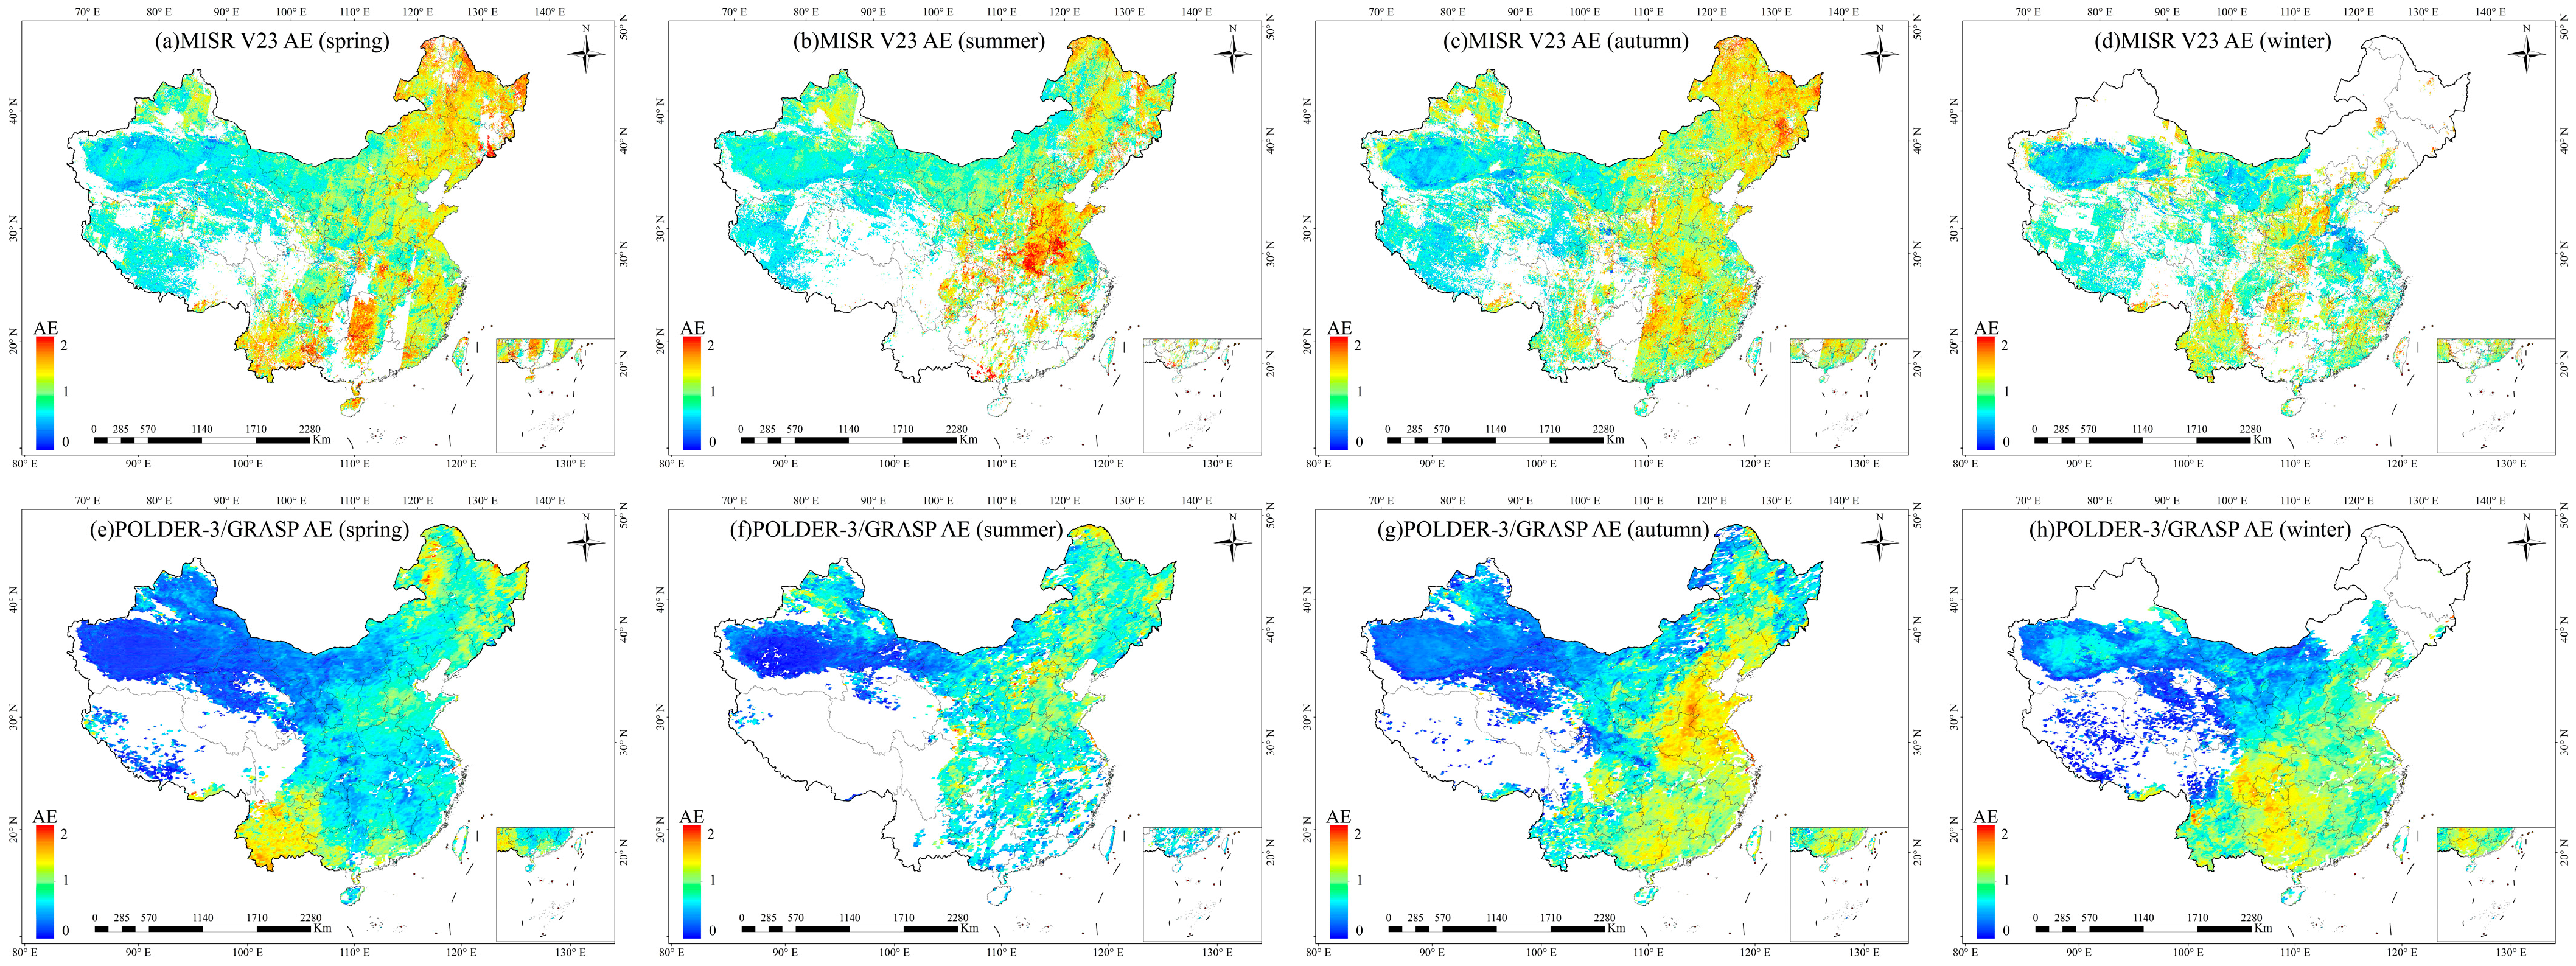
Figure 10 shows the average seasonal distribution of MISR V23 (Figure 10a–d; at 550–860 nm) and POLDER-3/GRASP (Figure 10e–h; at 443–865 nm) AE in 2012. The mean AE of MISR V23 product was at a high level compared with POLDER-3/GRASP AE. Overall, the aerosol size in China was also bounded by the Hu line, the particle size of aerosols in the east of the Hu line was small, and aerosols with large particle size were mainly in the west. Affected by sand and dust in spring and summer, large-size aerosols were mainly located in Tarim Basin, while fine-grained aerosols produced by human activities were mainly located in eastern China. In autumn and winter, fine aerosols were the controlling aerosols in Southeast China, which was affected by coal-fired heating and other factors.
4.2.3. Heavy Pollution Event in Beijing-Tianjin-Hebei Region
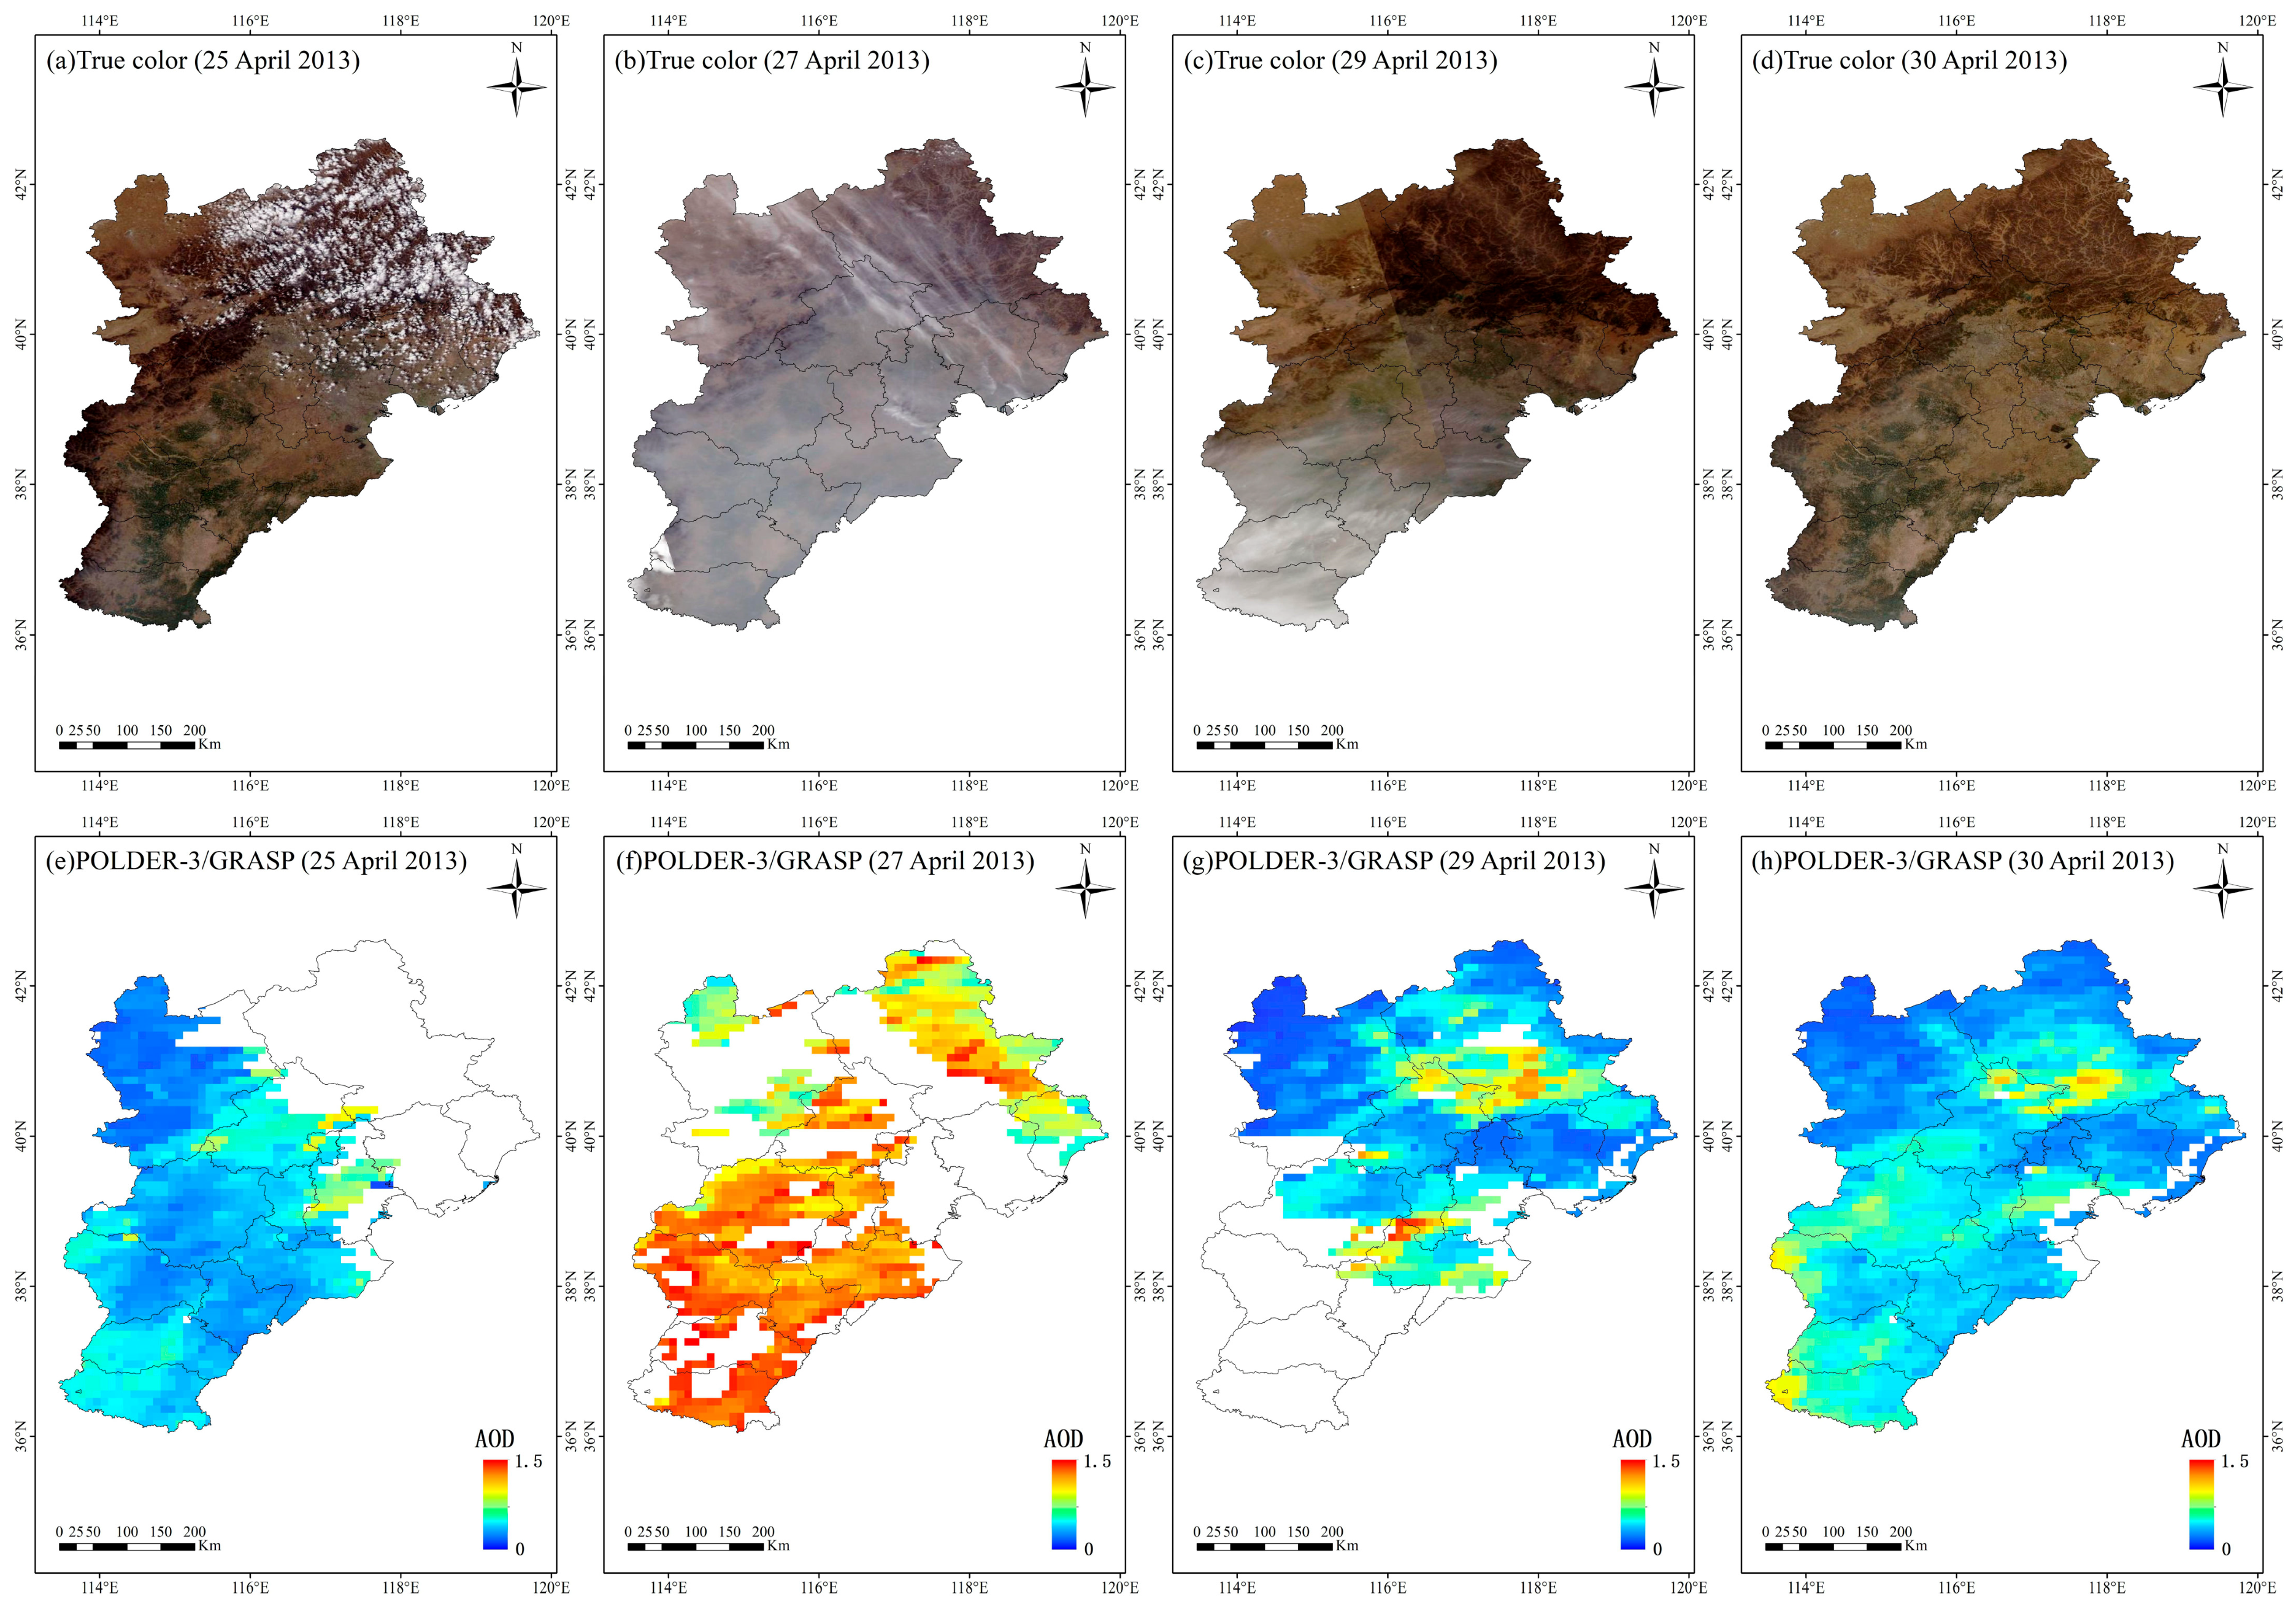
Figure 11 shows the spatial distribution of a serious pollution process that happened in BTH region from April 25 to April 30 in 2013. True color figures are presented for comparison (Figure 11a–d). Since satellites cannot obtain effective data under cloudy weather conditions, only the four-day POLDER-3/GRASP AOD (at 565 nm) inversion results on April 25 (Figure 11e), April 27 (Figure 11f), April 29 (Figure 11g), and April 30 (Figure 11h) were selected (the white blank area could not be inverted due to the influence of clouds). The higher AOD value means the pollution is more serious [57,58]. As shown in Figure 11, BTH region experienced an obvious aerosol pollution process from April 25 to April 30 in 2013. Figure 11a,e show the spatial distribution on April 25. The high AOD value areas on that day were centered in the east of Beijing and the middle of Tianjin. The figure shows yellow or light blue, but the concentration is relatively low, between 0.6 and 0.7. Figure 11b,f, the spatial distribution figure on April 27, show that serious pollution occurred in BTH region on that day. Compared with April 25, the scope of AOD high-value areas was significantly expanded, and the concentration in the whole BTH region was at a high level. Specifically, high-value areas were centered in the northwest of Beijing and most areas in the south of Hebei. The figure shows a large area of red or orange, with a high concentration of more than 1.0, indicating that serious pollution occurred in BTH region on April 27. From the perspective of pollution trend, although the high-value areas had expanded, the centered areas were still near the high-value areas on April 25. It can be seen that the pollution in the high-value areas is the result of superposition, diffusion, and transmission under the condition of certain pollution. As discussed in Section 4.2.2, the north is likely to experience dust weather in spring, and therefore, the possibility of heavy pollution is added. Figure 11c,g show that the pollution situation was significantly weakened on April 29; a large area of red no longer appears. The scope of high-value areas was significantly reduced; they were centered in the north of Beijing and the west of Tianjin. The figure is yellow, the concentration was between 0.8 and 0.9, and some high-value concentrations exceeded 1.0. The pollution had been reduced, but the pollution process had not completely ended. Figure 11d,h show that the range of high-value areas was further reduced and the peak value decreased. The high-value areas were centered in the northeast of Beijing and the southwest of Hebei. The figures are light yellow, the peak concentration was between 0.8 and 0.9, and there was no area exceeding 1.0. It can be seen that the pollution process had ended and returned to the normal level. The spatial distribution was basically the same as that on April 25.
4.3. Spatial Variation
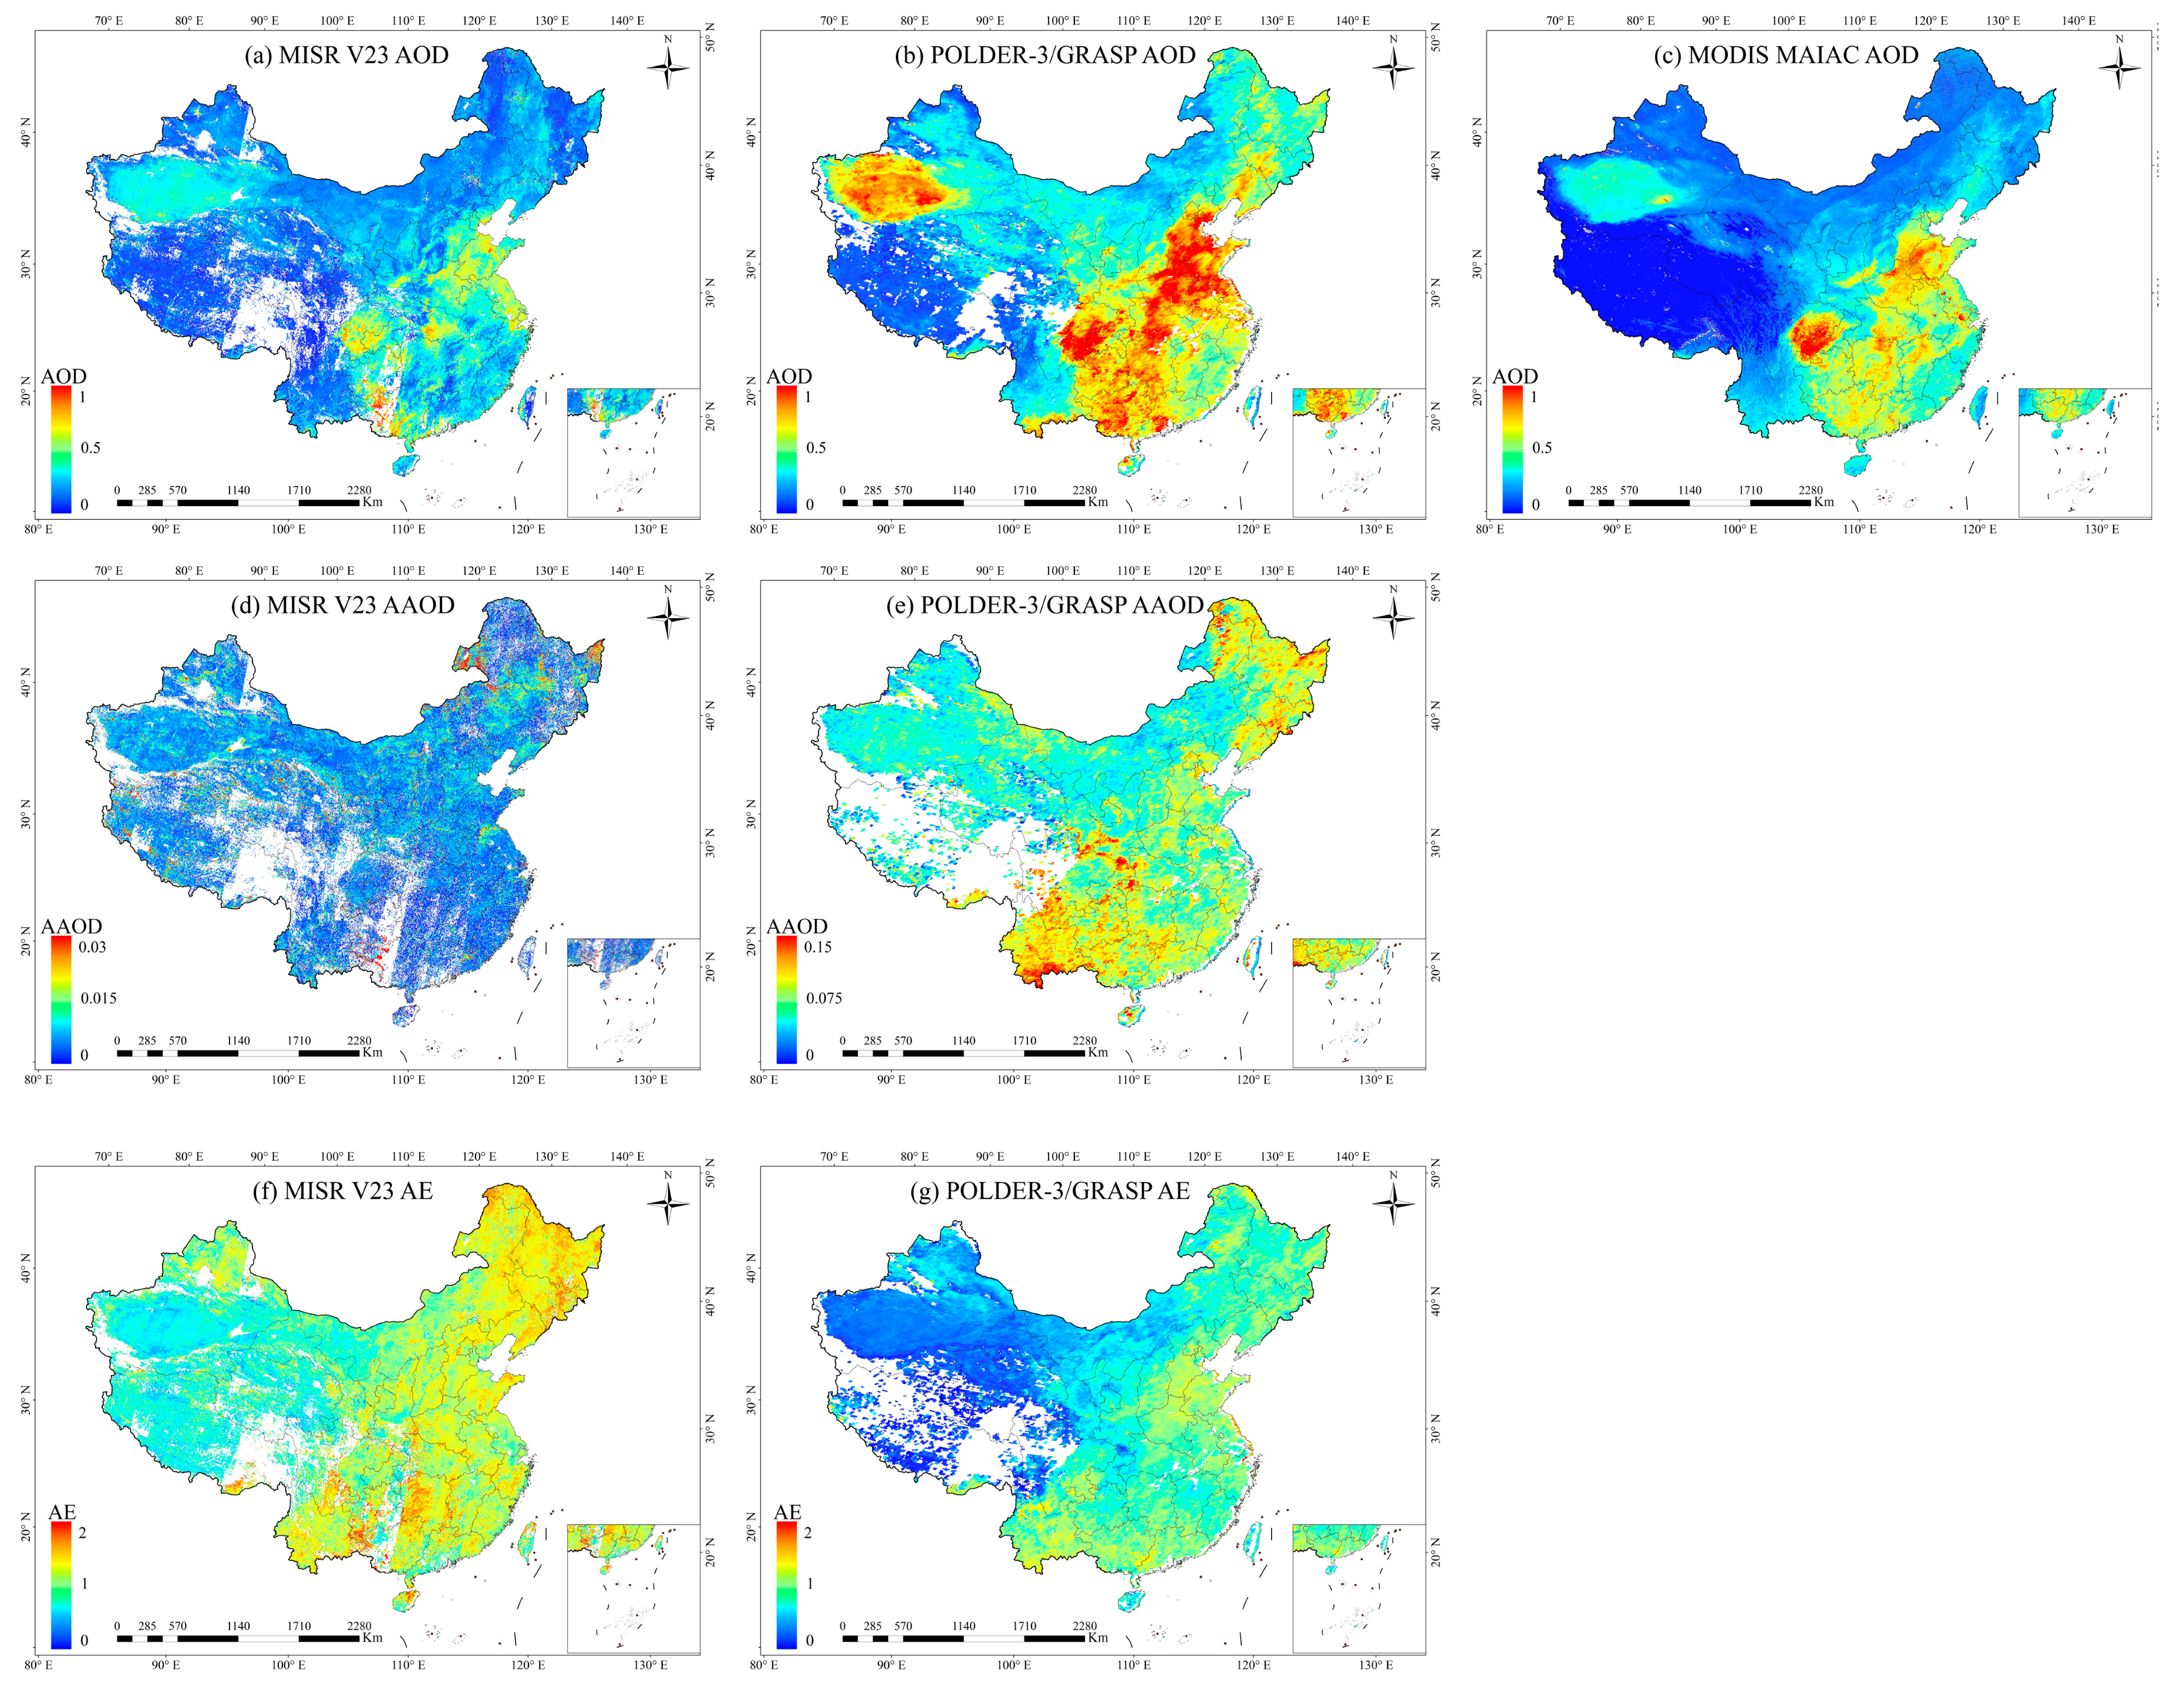
Figure 12 shows the mean spatial distribution of MISR V23 (558 nm for AOD (Figure 12a) and AAOD (Figure 12d); 550–860 nm for AE (Figure 12f)) and POLDER-3/GRASP (565 nm for AOD (Figure 12b) and AAOD (Figure 12e); 443–865 nm for AE (Figure 12g)) AOD, AAOD, and AE retrieval in 2012 over China. MODIS MAIAC AOD (Figure 12c; at 550 nm) product is also presented for comparison. Overall, high-value areas are similar among three products while the scale of value is different. It is obvious that high AOD value areas are centered in the Tarim Basin, the northwest of China, Sichuan Basin, and southeast of China. The Tarim Basin in the northwest of China is affected by dust all year round, and it is the main source of natural aerosols in China. Thus, the mean AOD value is higher than other places. It can be seen from the figures that AOD over desert in western China is underestimated in MISR V23 and MODIS MAIAC products [59]. In eastern China, the similarity of distribution between POLDER-3/GRASP AOD and MODIS MAIAC AOD is more obvious than MISR V23 AOD product, showing that POLDER-3/GRASP products do better in retrieving AOD. The mean AOD value in Sichuan Basin was relatively high because the topography of Sichuan Basin is not conducive to the diffusion of pollutants, and the low wind speed leads to the accumulation of polluting gases in the basin all year round. In terms of AAOD, the performance of POLDER-3/GRASP product is more valid, as discussed above. The mean AAOD value is uniformly distributed in China, where the AAODs in the northeast and southeast of China are a little higher than those in other places. With the rapid development of China’s economy and the continuous promotion of industrialization, the problem of regional air pollution had become more and more serious before 2013, especially in economically and industrially developed urban agglomerations, such as BTH, YRD, PRD, and other regions. The mean AE distribution is shown in the last line of Figure 12; it indicates that the high-value areas and low-value areas are split exactly. Aerosols in the eastern regions were mainly smaller ones because aerosols in these places were formed from polluting gases generated by human activities. On the contrary, major aerosols in the western areas were bigger ones, especially in the Tarim Basin, where large-size dust is very common.
5. Conclusions
In this paper, MISR V23 aerosol products and POLDER-3/GRASP aerosol products (AOD, AAOD, and AE) were evaluated with AERONET observations. The main conclusions are as follows:
- The AOD inversion accuracy of MISR V23 product and POLDER-3/GRASP is high; their correlation coefficient values are 0.903 and 0.902, respectively. The numbers of matched pairs within EE lines are 80.60% and 40.71%, respectively. MISR V23 AOD is obviously underestimated in high aerosol loadings, with a certain deviation. POLDER-3/GRASP AOD is overestimated in low aerosol loadings, but it is closer to the 1:1 line as a whole. For AAOD, since the calculation is related to AOD and SSA, the possibility of error is greater. The accuracy of two products is poor; their correlation coefficient values are 0.173 and 0.396, the slope of the linear regression is 0.028 and 0.374, respectively. The correlation of POLDER-3/GRASP AAOD is higher, indicating that there is still great uncertainty in the inversion of AAOD. In terms of the inversion accuracy of AE products, POLDER-3/GRASP AE also has a higher correlation coefficient of 0.661 compared with that of MISR V23 AE (0.334). At the same time, AOD and AE were evaluated for different land cover types. The results show that the inversion results of the two AOD products are good in the five land cover types. Specifically, MISR V23 products perform better under forest and water types while POLDER-3/GRASP products have higher inversion accuracy under urban and croplands types.
- AOD spatiotemporal distribution figures and annual line figures of three aerosol parameters were drawn for two products. The variation of AOD and AE from 2000–2020 was 0.202–0.280 and 0.972–1.128, respectively. The average values of AOD, AAOD, and AE were 0.238, 0.078, and 1.045, respectively. Under the influence of natural change and emission controlling measures, three aerosol parameters fluctuated in some years. AOD changed significantly in four seasons. Due to factors such as climate and economic development, there were great differences in AOD trends in different regions, and the proportion of human factors had gradually become higher, showing the great contribution of human activities to aerosols.
- Compared with the inversion results of other traditional scalar satellite data, the results show that the accuracy of multi-angle polarization data is high. Multi-angle polarization observations increase observation information and help to decouple surface and atmosphere. However, there are some uncertainties in polarization bands setting and radiometric calibration accuracy, which have a certain impact on the inversion accuracy.
In the future, more and more multi-angular polarized sensors (e.g., Multi-View Multi-Channel Multi-Polarization (3MI), Multi-Angle Imager for Aerosol (MAIA), SPEXone) will be launched and run. Multi-angular polarized remote sensing is also the trend for aerosol retrieval; it will play an important role in increasing the number of inversion parameters and improving inversion accuracy.
Author Contributions
S.J. conducted the validation and wrote the paper. M.L. gave guidance and advice through the whole experiment. M.F. offered suggestions on the whole structure organization of the paper and revised the paper. Z.L. provided AERONET data and gave advice on the validation. B.X. offered suggestions on data processing. J.T. and L.C. gave advice on writing the paper and analyzing the results. All authors have read and agreed to the published version of the manuscript.
Funding
This research is supported by National Natural Science Foundation of China (Grant No. 41830109 and No. 41871254).
Data Availability Statement
Not applicable.
Acknowledgments
The authors are grateful to the MISR project (https://asdc.larc.nasa.gov/project/MISR, accessed on 10 December 2021) for the support of data usage. The authors would like to acknowledge the use of POLDER data, POLDER/PARASOL Level-1 data originally provided by CNES (http://www.icare.univ-lille1.fr/, accessed on 10 December 2021), processed at AERIS/ICARE Data and Services Center with GRASP software (https://www.grasp-open.com, accessed on 10 December 2021). We also thank the AERONET team (https://aeronet.gsfc.nasa.gov/, accessed on 10 December 2021) and all PIs for their efforts in maintaining instruments and providing data.
Conflicts of Interest
The authors declare no conflict of interest. The funders had no role in the design of the study; in the collection, analyses, or interpretation of data; in the writing of the manuscript, or in the decision to publish the results.
References
- Ramanathan, V.; Crutzen, P.J.; Kiehl, J.T.; Rosenfeld, D. Aerosols, Climate, and the Hydrological Cycle. Science 2001, 294, 2119–2124. [Google Scholar] [CrossRef] [PubMed] [Green Version]
- Prather, K.A.; Hatch, C.D.; Grassian, V.H. Analysis of Atmospheric Aerosols. Annu. Rev. Anal. Chem. 2008, 1, 485–514. [Google Scholar] [CrossRef] [PubMed]
- Mahowald, N.; Ward, D.S.; Kloster, S.; Flanner, M.G.; Heald, C.L.; Heavens, N.G.; Hess, P.G.; Lamarque, J.-F.; Chuang, P.Y. Aerosol Impacts on Climate and Biogeochemistry. Annu. Rev. Environ. Resour. 2011, 36, 45–74. [Google Scholar] [CrossRef] [Green Version]
- Dubovik, O.; Holben, B.; Eck, T.F.; Smirnov, A.; Kaufman, Y.J.; King, M.D.; Tanre, D.; Slutsker, I. Variability of Absorption and Optical Properties of Key Aerosol Types Observed in Worldwide Locations. J. Atmos. Sci. 2002, 59, 590–608. [Google Scholar] [CrossRef]
- Ravindra, K.; Sokhi, R.; Van Grieken, R. Atmospheric Polycyclic Aromatic Hydrocarbons: Source Attribution, Emission Factors and Regulation. Atmos. Environ. 2008, 42, 2895–2921. [Google Scholar] [CrossRef] [Green Version]
- Rosenfeld, D.; Lohmann, U.; Raga, G.B.; O’Dowd, C.D.; Kulmala, M.; Fuzzi, S.; Reissell, A.; Andreae, M.O. Flood or Drought: How Do Aerosols Affect Precipitation? Science 2008, 321, 1309–1313. [Google Scholar] [CrossRef] [Green Version]
- Tuck, A. The Role of Atmospheric Aerosols in the Origin of Life. Surv. Geophys. 2002, 23, 379–409. [Google Scholar] [CrossRef]
- Alves, C. Atmospheric aerosols: Historical perspective, sources, chemical formation processes and organic composition. Quim. Nova 2005, 28, 859–870. [Google Scholar] [CrossRef]
- Kanakidou, M.; Myriokefalitakis, S.; Tsigaridis, K. Aerosols in Atmospheric Chemistry and Biogeochemical Cycles of Nutrients. Environ. Res. Lett. 2018, 13, 063004. [Google Scholar] [CrossRef]
- Li, Z.; Zhao, X.; Kahn, R.; Mishchenko, M.; Remer, L.; Lee, K.-H.; Wang, M.; Laszlo, I.; Nakajima, T.; Maring, H. Uncertainties in Satellite Remote Sensing of Aerosols and Impact on Monitoring Its Long-Term Trend: A Review and Perspective. Ann. Geophys. 2009, 27, 2755–2770. [Google Scholar] [CrossRef]
- Wen, J.; Wu, X.; Wang, J.; Tang, R.; Ma, D.; Zeng, Q.; Gong, B.; Xiao, Q. Characterizing the Effect of Spatial Heterogeneity and the Deployment of Sampled Plots on the Uncertainty of Ground “Truth” on a Coarse Grid Scale: Case Study for Near-Infrared (NIR) Surface Reflectance. JGR Atmos. 2022, 127. [Google Scholar] [CrossRef]
- Hong, G.; Xing-fa, G.; Dong-hai, X.; Tao, Y.; Qing-yan, M. A Review of Atmospheric Aerosol Research by Using Polarization Remote Sensing. Spectrosc. Spectr. Anal. 2014, 34, 1873–1880. [Google Scholar] [CrossRef]
- Garay, M.J.; Witek, M.L.; Kahn, R.A.; Seidel, F.C.; Limbacher, J.A.; Bull, M.A.; Diner, D.J.; Hansen, E.G.; Kalashnikova, O.V.; Lee, H.; et al. Introducing the 4.4 Km Spatial Resolution Multi-Angle Imaging SpectroRadiometer (MISR) Aerosol Product. Atmos. Meas. Tech. 2020, 13, 593–628. [Google Scholar] [CrossRef] [Green Version]
- Tanré, D.; Bréon, F.M.; Deuzé, J.L.; Dubovik, O.; Ducos, F.; François, P.; Goloub, P.; Herman, M.; Lifermann, A.; Waquet, F. Remote Sensing of Aerosols by Using Polarized, Directional and Spectral Measurements within the A-Train: The PARASOL Mission. Atmos. Meas. Tech. 2011, 4, 1383–1395. [Google Scholar] [CrossRef] [Green Version]
- Fan, X.; Chen, H.; Lin, L.; Han, Z.; Goloub, P. Retrieval of Aerosol Optical Properties over the Beijing Area Using POLDER/PARASOL Satellite Polarization Measurements. Adv. Atmos. Sci. 2009, 26, 1099–1107. [Google Scholar] [CrossRef]
- Ge, B.Y.; Li, Z.Q.; Hou, W.Z.; Zhang, Y.; Li, K.T. Validation And Comparison Of Fine-Mode Aerosol Optical Depth Products Between Modis And Polder. Int. Arch. Photogramm. Remote Sens. Spatial Inf. Sci. 2019, XLII-3/W9, 51–56. [Google Scholar] [CrossRef] [Green Version]
- Torres, B.; Fuertes, D. Characterization of Aerosol Size Properties from Measurements of Spectral Optical Depth: A Global Validation of the GRASP-AOD Code Using Long-Term AERONET Data. Atmos. Meas. Tech. 2021, 14, 4471–4506. [Google Scholar] [CrossRef]
- Hasekamp, O.P.; Landgraf, J. Retrieval of Aerosol Properties over Land Surfaces: Capabilities of Multiple-Viewing-Angle Intensity and Polarization Measurements. Appl. Optics 2007, 46, 3332–3344. [Google Scholar] [CrossRef]
- Chen, C.; Dubovik, O.; Fuertes, D.; Litvinov, P.; Lapyonok, T.; Lopatin, A.; Ducos, F.; Derimian, Y.; Herman, M.; Tanré, D.; et al. Validation of GRASP Algorithm Product from POLDER/PARASOL Data and Assessment of Multi-Angular Polarimetry Potential for Aerosol Monitoring. Earth Syst. Sci. Data 2020, 12, 3573–3620. [Google Scholar] [CrossRef]
- Ge, B.; Mei, X.; Li, Z.; Hou, W.; Xie, Y.; Zhang, Y.; Xu, H.; Li, K.; Wei, Y. An Improved Algorithm for Retrieving High Resolution Fine-Mode Aerosol Based on Polarized Satellite Data: Application and Validation for POLDER-3. Remote Sens. Environ. 2020, 247, 111894. [Google Scholar] [CrossRef]
- He, Q.; Zhang, M.; Huang, B.; Tong, X. MODIS 3 Km and 10 Km Aerosol Optical Depth for China: Evaluation and Comparison. Atmos. Environ. 2017, 153, 150–162. [Google Scholar] [CrossRef]
- Eibedingil, I.G.; Gill, T.E.; Van Pelt, R.S.; Tong, D.Q. Comparison of Aerosol Optical Depth from MODIS Product Collection 6.1 and AERONET in the Western United States. Remote Sens. 2021, 13, 2316. [Google Scholar] [CrossRef]
- Qin, W.; Fang, H.; Wang, L.; Wei, J.; Zhang, M.; Su, X.; Bilal, M.; Liang, X. MODIS High-Resolution MAIAC Aerosol Product: Global Validation and Analysis. Atmos. Environ. 2021, 264, 118684. [Google Scholar] [CrossRef]
- Kaufman, Y.J.; Tanré, D.; Remer, L.A.; Vermote, E.F.; Chu, A.; Holben, B.N. Operational Remote Sensing of Tropospheric Aerosol over Land from EOS Moderate Resolution Imaging Spectroradiometer. J. Geophys. Res. 1997, 102, 17051–17067. [Google Scholar] [CrossRef]
- Jin, S.; Zhang, M.; Ma, Y.; Gong, W.; Chen, C.; Yang, L.; Hu, X.; Liu, B.; Chen, N.; Du, B.; et al. Adapting the Dark Target Algorithm to Advanced MERSI Sensor on the FengYun-3-D Satellite: Retrieval and Validation of Aerosol Optical Depth Over Land. IEEE Trans. Geosci. Remote Sens. 2021, 59, 8781–8797. [Google Scholar] [CrossRef]
- Nichol, J.; Bilal, M. Validation of MODIS 3 Km Resolution Aerosol Optical Depth Retrievals Over Asia. Remote Sens. 2016, 8, 328. [Google Scholar] [CrossRef] [Green Version]
- Hsu, N.C.; Tsay, S.C.; King, M.D.; Herman, J.R. Aerosol Properties over Bright-Reflecting Source Regions. IEEE Trans. Geosci. Remote Sens. 2004, 42, 557–569. [Google Scholar] [CrossRef]
- Hsu, N.C.; Tsay, S.-C.; King, M.D.; Herman, J.R. Deep Blue Retrievals of Asian Aerosol Properties During ACE-Asia. IEEE Trans. Geosci. Remote Sens. 2006, 44, 3180–3195. [Google Scholar] [CrossRef]
- Wei, J.; Li, Z.; Peng, Y.; Sun, L. MODIS Collection 6.1 Aerosol Optical Depth Products over Land and Ocean: Validation and Comparison. Atmos. Environ. 2019, 201, 428–440. [Google Scholar] [CrossRef]
- Lyapustin, A.; Martonchik, J.; Wang, Y.; Laszlo, I.; Korkin, S. Multiangle Implementation of Atmospheric Correction (MAIAC): 1. Radiative Transfer Basis and Look-up Tables. J. Geophys. Res. Atmos. 2011, 116. [Google Scholar] [CrossRef]
- Lyapustin, A.; Wang, Y.; Laszlo, I.; Kahn, R.; Korkin, S.; Remer, L.; Levy, R.; Reid, J.S. Multiangle Implementation of Atmospheric Correction (MAIAC): 2. Aerosol Algorithm. J. Geophys. Res. Atmos. 2011, 116. [Google Scholar] [CrossRef]
- Lyapustin, A.I.; Wang, Y.; Laszlo, I.; Hilker, T.; Hall, F.G.; Sellers, P.J.; Tucker, C.J.; Korkin, S.V. Multi-Angle Implementation of Atmospheric Correction for MODIS (MAIAC): 3. Atmospheric Correction. Remote Sens. Environ. 2012, 127, 385–393. [Google Scholar] [CrossRef]
- Zhang, Z.; Wu, W.; Fan, M.; Wei, J.; Tan, Y.; Wang, Q. Evaluation of MAIAC Aerosol Retrievals over China. Atmos. Environ. 2019, 202, 8–16. [Google Scholar] [CrossRef]
- Hou, W.; Li, Z.; Wang, J.; Xu, X.; Goloub, P.; Qie, L. Improving Remote Sensing of Aerosol Microphysical Properties by Near-Infrared Polarimetric Measurements Over Vegetated Land: Information Content Analysis. J. Geophys. Res. Atmos. 2018, 123, 2215–2243. [Google Scholar] [CrossRef]
- Waquet, F.; Cairns, B.; Knobelspiesse, K.; Chowdhary, J.; Travis, L.D.; Schmid, B.; Mishchenko, M.I. Polarimetric Remote Sensing of Aerosols over Land. J. Geophys. Res. 2009, 114. [Google Scholar] [CrossRef]
- Dubovik, O.; King, M.D. A Flexible Inversion Algorithm for Retrieval of Aerosol Optical Properties from Sun and Sky Radiance Measurements. J. Geophys. Res. 2000, 105, 20673–20696. [Google Scholar] [CrossRef] [Green Version]
- Dubovik, O.; Herman, M.; Holdak, A.; Lapyonok, T.; Tanré, D.; Deuzé, J.L.; Ducos, F.; Sinyuk, A.; Lopatin, A. Statistically Optimized Inversion Algorithm for Enhanced Retrieval of Aerosol Properties from Spectral Multi-Angle Polarimetric Satellite Observations. Atmos. Meas. Tech. 2011, 4, 975–1018. [Google Scholar] [CrossRef] [Green Version]
- Tan, Y.; Li, E.; Zhang, Z.; Lin, X.; Chi, Y.; Zhou, L.; Wu, C.; Wang, Q. Validation of POLDER-3/GRASP Aerosol Products Using AERONET Measurements over China. Atmos. Environ. 2019, 215, 116893. [Google Scholar] [CrossRef]
- Wei, Y.; Li, Z.; Zhang, Y.; Chen, C.; Dubovik, O.; Zhang, Y.; Xu, H.; Li, K.; Chen, J.; Wang, H.; et al. Validation of POLDER GRASP Aerosol Optical Retrieval over China Using SONET Observations. J. Quant. Spectrosc. Radiat. Transf. 2020, 246, 106931. [Google Scholar] [CrossRef]
- Tao, M.; Wang, J.; Li, R.; Chen, L.; Xu, X.; Wang, L.; Tao, J.; Wang, Z.; Xiang, J. Characterization of Aerosol Type Over East Asia by 4.4 Km MISR Product: First Insight and General Performance. J. Geophys. Res. Atmos. 2020, 125. [Google Scholar] [CrossRef]
- Kahn, R.A.; Gaitley, B.J. An Analysis of Global Aerosol Type as Retrieved by MISR: MISR Aerosol Type. J. Geophys. Res. Atmos. 2015, 120, 4248–4281. [Google Scholar] [CrossRef]
- Holben, B.N.; Eck, T.F.; Slutsker, I.; Tanre, D.; Buis, J.P.; Setzer, A.; Vermote, E.; Reagan, J.A.; Kaufman, Y.J.; Nakajima, T.; et al. AERONET—A Federated Instrument Network and Data Archive for Aerosol Characterization; Elsevier: Amsterdam, The Netherlands, 1998. [Google Scholar]
- Dubovik, O.; Smirnov, A.; Holben, B.N.; King, M.D.; Kaufman, Y.J.; Eck, T.F.; Slutsker, I. Accuracy Assessments of Aerosol Optical Properties Retrieved from Aerosol Robotic Network (AERONET) Sun and Sky Radiance Measurements. J. Geophys. Res.-Atmos. 2000, 105, 9791–9806. [Google Scholar] [CrossRef] [Green Version]
- Holben, B.N.; Tanre, D.; Smirnov, A.; Eck, T.F.; Slutsker, I.; Abuhassan, N.; Newcomb, W.W.; Schafer, J.S.; Chatenet, B.; Lavenu, F.; et al. An Emerging Ground-Based Aerosol Climatology: Aerosol Optical Depth from AERONET. J. Geophys. Res.-Atmos. 2001, 106, 12067–12097. [Google Scholar] [CrossRef]
- Li, Y.; Shi, G.; Sun, Z. Evaluation and Improvement of MODIS Aerosol Optical Depth Products over China. Atmos. Environ. 2020, 223, 117251. [Google Scholar] [CrossRef]
- Che, Y.; Xue, Y.; Guang, J.; She, L.; Guo, J. Evaluation of the AVHRR DeepBlue Aerosol Optical Depth Dataset over Mainland China. ISPRS J. Photogramm. Remote Sens. 2018, 146, 74–90. [Google Scholar] [CrossRef]
- He, L.; Wang, L.; Li, Z.; Jiang, D.; Sun, L.; Liu, D.; Liu, L.; Yao, R.; Zhou, Z.; Wei, J. VIIRS Environmental Data Record and Deep Blue Aerosol Products: Validation, Comparison, and Spatiotemporal Variations from 2013 to 2018 in China. Atmos. Environ. 2021, 250, 118265. [Google Scholar] [CrossRef]
- Zhang, Z.; Wu, W.; Fan, M.; Tao, M.; Wei, J.; Jin, J.; Tan, Y.; Wang, Q. Validation of Himawari-8 Aerosol Optical Depth Retrievals over China. Atmos. Environ. 2019, 199, 32–44. [Google Scholar] [CrossRef]
- Fougnie, B. Improvement of the PARASOL Radiometric In-Flight Calibration Based on Synergy Between Various Methods Using Natural Targets. IEEE Trans. Geosci. Remote Sens. 2016, 54, 2140–2152. [Google Scholar] [CrossRef]
- Gupta, P.; Remer, L.A.; Levy, R.C.; Mattoo, S. Validation of MODIS 3 Km Land Aerosol Optical Depth from NASA’s EOS Terra and Aqua Missions. Atmos. Meas. Tech. 2018, 11, 3145–3159. [Google Scholar] [CrossRef] [Green Version]
- Wei, J.; Li, Z.; Sun, L.; Peng, Y.; Liu, L.; He, L.; Qin, W.; Cribb, M. MODIS Collection 6.1 3 Km Resolution Aerosol Optical Depth Product: Global Evaluation and Uncertainty Analysis. Atmos. Environ. 2020, 240, 117768. [Google Scholar] [CrossRef]
- Choi, M.; Lim, H.; Kim, J.; Lee, S.; Eck, T.F.; Holben, B.N.; Garay, M.J.; Hyer, E.J.; Saide, P.E.; Liu, H. Validation, Comparison, and Integration of GOCI, AHI, MODIS, MISR, and VIIRS Aerosol Optical Depth over East Asia during the 2016 KORUS-AQ Campaign. Atmos. Meas. Tech. 2019, 12, 4619–4641. [Google Scholar] [CrossRef] [Green Version]
- Wu, J.; Guo, J.; Zhao, D. Characteristics of Aerosol Transport and Distribution in East Asia. Atmos. Res. 2013, 132, 185–198. [Google Scholar] [CrossRef]
- Thompson, A.J.; Skinner, C.B.; Poulsen, C.J.; Zhu, J. Modulation of Mid-Holocene African Rainfall by Dust Aerosol Direct and Indirect Effects. Geophys. Res. Lett. 2019, 46, 3917–3926. [Google Scholar] [CrossRef]
- Zhao, N.; Cao, F.; Tian, Q.; Chen, Y.; Liu, Q.; Huang, Y.; Wang, Y. Spatial-Temporal Distribution of Absorptive Aerosols in the Yangtze River Delta. Environ. Sci. 2019, 40, 3898–3907. [Google Scholar] [CrossRef]
- Dai, Z.X.; Zhang, Y.Z.; Hu, Y.F.; Yu, D. Spatial-Temporal Characteristics of PM2.5 in Yangtze River Delta (YRD) Region Based on the Ground Monitoring Data from 2013 to 2015. Res. Environ. Sci. 2022, 35, 813–821. [Google Scholar] [CrossRef]
- Che, Y.; Zhang, J.; Zhao, C.; Fang, W.; Xue, W.; Yang, W.; Ji, D.; Dang, J.; Duan, J.; Sun, J.; et al. A Study on the Characteristics of Ice Nucleating Particles Concentration and Aerosols and Their Relationship in Spring in Beijing. Atmos. Res. 2021, 247, 105196. [Google Scholar] [CrossRef]
- Ren, H.; Li, A.; Xie, P.; Hu, Z.; Xu, J.; Huang, Y.; Li, X.; Zhong, H.; Zhang, H.; Tian, X.; et al. The Characterization of Haze and Dust Processes Using MAX-DOAS in Beijing, China. Remote Sens. 2021, 13, 5133. [Google Scholar] [CrossRef]
- Tao, M.; Wang, J.; Li, R.; Wang, L.; Wang, L.; Wang, Z.; Tao, J.; Che, H.; Chen, L. Performance of MODIS High-Resolution MAIAC Aerosol Algorithm in China: Characterization and Limitation. Atmos. Environ. 2019, 213, 159–169. [Google Scholar] [CrossRef]
Figure 1.
Distributions of AERONET sites in China.

Figure 2.
Validation of MISR V23 aerosol products in 0.5° × 0.5° resolution with 36 AERONET stations in China: (a) AOD; (b) AAOD; (c) AE. The probability density functions of differences are present in the same order as in the lower panel ((d) AOD; (e) AAOD; (f) AE). The black, blue, and red solid lines indicate AOD conditions: in all values, AOD < 0.5 and AOD > 0.5, respectively.

Figure 3.
Validation of POLDER-3/GRASP aerosol products in 0.5° × 0.5° resolution with 34 AERONET stations in China: (a) AOD; (b) AAOD; (c) AE. The probability density functions of differences are present in the same order as in the lower panel ((d) AOD; (e) AAOD; (f) AE). The black, blue, and red solid lines indicate AOD conditions: all values, AOD < 0.5 and AOD > 0.5, respectively.

Figure 4.
Variation figures of annual mean AOD and AE: (a) MISR V23 products; (b) POLDER-3/GRASP products.
Figure 4.
Variation figures of annual mean AOD and AE: (a) MISR V23 products; (b) POLDER-3/GRASP products.

Figure 5.
Variation figures of annual mean AAOD: (a) MISR V23 product; (b) POLDER-3/GRASP product.

Figure 6.
Variation figures of annual mean AOD and AE at BTH, YRD, and PRD. MISR V23 products are present in the first panel (a–c); POLDER-3/GRASP products are present in the same order as in the second panel (d–f).
Figure 6.
Variation figures of annual mean AOD and AE at BTH, YRD, and PRD. MISR V23 products are present in the first panel (a–c); POLDER-3/GRASP products are present in the same order as in the second panel (d–f).

Figure 7.
Variation figures of annual mean AAOD at BTH, YRD, and PRD. MISR V23 products are present in the first panel (a–c); POLDER-3/GRASP products are present in the same order as in the second panel (d–f).
Figure 7.
Variation figures of annual mean AAOD at BTH, YRD, and PRD. MISR V23 products are present in the first panel (a–c); POLDER-3/GRASP products are present in the same order as in the second panel (d–f).

Figure 8.
Distributions of seasonal mean AOD in 2012 from MISR V23 at 558 nm ((a) spring; (b) summer; (c) autumn; (d) winter) and POLDER-3/GRASP at 565 nm ((e) spring; (f) summer; (g) autumn; (h) winter).
Figure 8.
Distributions of seasonal mean AOD in 2012 from MISR V23 at 558 nm ((a) spring; (b) summer; (c) autumn; (d) winter) and POLDER-3/GRASP at 565 nm ((e) spring; (f) summer; (g) autumn; (h) winter).

Figure 9.
Distributions of seasonal mean AAOD in 2012 from MISR V23 at 558 nm ((a) spring; (b) summer; (c) autumn; (d) winter) and POLDER-3/GRASP at 565 nm ((e) spring; (f) summer; (g) autumn; (h) winter).
Figure 9.
Distributions of seasonal mean AAOD in 2012 from MISR V23 at 558 nm ((a) spring; (b) summer; (c) autumn; (d) winter) and POLDER-3/GRASP at 565 nm ((e) spring; (f) summer; (g) autumn; (h) winter).

Figure 10.
Distributions of seasonal mean AE in 2012 from MISR V23 at 500–860 nm ((a) spring; (b) summer; (c) autumn; (d) winter) and POLDER-3/GRASP at 443–865 nm ((e) spring; (f) summer; (g) autumn; (h) winter).
Figure 10.
Distributions of seasonal mean AE in 2012 from MISR V23 at 500–860 nm ((a) spring; (b) summer; (c) autumn; (d) winter) and POLDER-3/GRASP at 443–865 nm ((e) spring; (f) summer; (g) autumn; (h) winter).

Figure 11.
Distributions of one heavy pollution process in Beijing-Tianjin-Hebei region: (a) true color (25 April 2013); (b) true color (27 April 2013); (c) true color (29 April 2013); (d) true color (30 April 2013); (e) POLDER-3/GRASP (25 April 2013); (f) POLDER-3/GRASP (27 April 2013); (g) POLDER-3/GRASP (29 April 2013); (h) POLDER-3/GRASP (30 April 2013) (true color figures are from Aqua MODIS; POLDER-3/GRASP products are AOD at 565 nm).

Figure 12.
Distributions of annual mean value from MISR V23 products ((a) AOD at 558 nm; (d) AAOD at 558 nm; (f) AE at 550–860 nm), POLDER-3/GRASP products ((b) AOD at 558 nm; (e) AAOD at 558 nm; (g) AE at 550–860 nm), and MODIS MAIAC product ((c) AOD at 550 nm) in 2012.
Figure 12.
Distributions of annual mean value from MISR V23 products ((a) AOD at 558 nm; (d) AAOD at 558 nm; (f) AE at 550–860 nm), POLDER-3/GRASP products ((b) AOD at 558 nm; (e) AAOD at 558 nm; (g) AE at 550–860 nm), and MODIS MAIAC product ((c) AOD at 550 nm) in 2012.


Table 1.
The detailed information and comparison methodology of MISR V23 aerosol products used in this paper.
Table 1.
The detailed information and comparison methodology of MISR V23 aerosol products used in this paper.
| Parameters | Value/Comparison Methodology |
|---|---|
| Wavelength | AOD/AAOD at 558 nm; AE at 550–860 nm |
| Spatial Resolution | 4.4 km × 4.4 km |
| Aerosol optical depth (AOD) | Interpolated AERONET AOD at 558 nm by using AE |
| Absorbing aerosol optical depth (AAOD) | Interpolated AERONET AAOD at 558 nm by using AAE |
| Ångström exponent (AE) | Compared with AERONET AE at 500–870 nm |
Table 2.
The detailed information and comparison methodology of POLDER-3/GRASP aerosol products used in this paper.
Table 2.
The detailed information and comparison methodology of POLDER-3/GRASP aerosol products used in this paper.
| Parameters | Value/Comparison Methodology |
|---|---|
| Wavelength | AOD/AAOD at 565 nm; AE at 443–865 nm |
| Spatial Resolution | 10 km × 10 km |
| AOD | Interpolated AERONET AOD at 565 nm by using AE |
| AAOD | Interpolated AERONET AAOD at 565 nm by using AAE |
| AE | Compared with AERONET AE at 440–870 nm |
Table 3.
Details of AERONET sites in China.
| Land Cover Type | Number | Site Name | Longitude (°) | Latitude (°) | Period | Data Level |
|---|---|---|---|---|---|---|
| Urban | 1 | AOE_Baotou | 109.629 | 40.852 | 2013/01~2020/08 | Level 2.0 |
| 2 | Beijing * | 116.381 | 39.977 | 2001/01~2020/08 | Level 2.0 | |
| 3 | Beijing-CAMS * | 116.317 | 39.933 | 2012/01~2020/08 | Level 2.0 | |
| 4 | Beijing_RADI * | 116.379 | 40.005 | 2010/01~2020/08 | Level 2.0 | |
| 5 | Yulin | 109.717 | 38.283 | 2001/01~2002/12 | Level 2.0 | |
| 6 | Hong_Kong_PolyU * | 114.180 | 22.303 | 2005/01~2020/08 | Level 2.0 | |
| 7 | Hong_Kong_Sheung * | 114.117 | 22.483 | 2012/01~2020/08 | Level 2.0 | |
| 8 | Beijing_PKU | 116.310 | 39.992 | 2016/01~2020/08 | Level 1.5 | |
| 9 | City_GZ | 113.158 | 23.081 | 2006/01~2006/12 | Level 2.0 | |
| 10 | Dunhuang_LZU * | 94.955 | 40.492 | 2012/01~2012/12 | Level 2.0 | |
| 11 | Hangzhou_City | 120.157 | 30.290 | 2008/01~2009/12 | Level 1.5 | |
| 12 | Hefei | 117.162 | 31.905 | 2005/01~2008/12 | Level 1.5 | |
| 13 | Ningbo | 121.547 | 29.860 | 2007/01~2008/12 | Level 1.5 | |
| 14 | Shanghi_Minhang | 121.397 | 31.130 | 2008/01~2009/12 | Level 1.5 | |
| 15 | Shijiazhuang-CHEY | 114.550 | 38.000 | 2013/01~2014/12 | Level 1.5 | |
| 16 | Shijiazhuang-SZF | 114.458 | 38.017 | 2013/01~2014/12 | Level 1.5 | |
| 17 | SONET_Harbin | 126.614 | 45.705 | 2016/01~2016/12 | Level 1.5 | |
| 18 | XuZhou-CUMT | 117.142 | 34.217 | 2013/01~2019/12 | Level 1.5 | |
| Grasslands | 19 | Jingtai | 104.100 | 37.333 | 2008/01~2008/12 | Level 2.0 |
| 20 | Lanzhou_City * | 103.853 | 36.048 | 2009/01~2010/12 | Level 2.0 | |
| 21 | QOMS_CAS * | 86.948 | 28.365 | 2009/01~2020/08 | Level 2.0 | |
| 22 | SACOL * | 104.137 | 35.946 | 2006/01~2013/12 | Level 2.0 | |
| 23 | Mt_WLG | 100.896 | 36.283 | 2009/01~2013/12 | Level 1.5 | |
| 24 | Muztagh_Ata | 75.039 | 38.408 | 2011/01~2011/12 | Level 2.0 | |
| 25 | NAM_CO | 90.962 | 30.773 | 2006/01~2020/08 | Level 2.0 | |
| 26 | SONET_Xingtai | 114.360 | 37.182 | 2016/01~2016/12 | Level 1.5 | |
| 27 | Yufa_PEK | 116.184 | 39.309 | 2006/01~2006/12 | Level 2.0 | |
| 28 | Zhangye | 100.276 | 39.079 | 2008/01~2008/12 | Level 2.0 | |
| 29 | Zhongshan_Univ | 113.390 | 23.060 | 2011/01~2012/12 | Level 2.0 | |
| Water | 30 | Hong_Kong_Hok_Tsui * | 114.258 | 22.210 | 2007/01~2010/12 | Level 2.0 |
| 31 | Taihu * | 120.215 | 31.421 | 2005/01~2018/12 | Level 2.0 | |
| Croplands | 32 | Shouxian * | 116.782 | 32.558 | 2008/01~2008/12 | Level 2.0 |
| 33 | XiangHe * | 116.962 | 39.754 | 2001/01~2020/08 | Level 2.0 | |
| 34 | Liangning | 122.701 | 41.512 | 2005/01~2005/12 | Level 2.0 | |
| 35 | Minqin | 102.959 | 38.607 | 2010/01~2010/12 | Level 2.0 | |
| 36 | NUIST | 118.717 | 32.206 | 2007/01~2010/12 | Level 2.0 | |
| 37 | PKU_PEK | 116.184 | 39.593 | 2006/01~2008/12 | Level 2.0 | |
| Forest | 38 | Xinglong * | 117.578 | 40.396 | 2006/01~2014/12 | Level 2.0 |
| 39 | Hangzhou-ZFU | 119.727 | 30.257 | 2007/01~2009/12 | Level 2.0 | |
| 40 | Qiandaohu | 119.053 | 29.556 | 2007/01~2009/12 | Level 1.5 |
* Sites for which both AERONET AEROSOL OPTICAL DEPTH (V3)-SOLAR and AEROSOL_INVERSIONS (V3) data are available; for the rest of the sites, only AERONET AEROSOL OPTICAL DEPTH (V3) -SOLAR data are available.
Table 4.
Validation of MISR V23 AOD and AE in 0.5° × 0.5° resolution over different land covers in China.
Table 4.
Validation of MISR V23 AOD and AE in 0.5° × 0.5° resolution over different land covers in China.
| Land Cover | N | R | RMSE | MAE | =EE (%) | <EE (%) | >EE (%) | |
|---|---|---|---|---|---|---|---|---|
| AOD | Urban | 518 | 0.915 | 0.232 | 0.108 | 83.98 | 15.06 | 0.97 |
| Grasslands | 108 | 0.921 | 0.096 | 0.070 | 67.59 | 6.48 | 25.93 | |
| Croplands | 238 | 0.881 | 0.360 | 0.165 | 75.21 | 23.11 | 1.68 | |
| Forest | 60 | 0.918 | 0.053 | 0.037 | 88.33 | 1.67 | 10.00 | |
| Water | 40 | 0.957 | 0.158 | 0.083 | 92.50 | 0.00 | 7.50 | |
| AE | Urban | 323 | 0.342 | 0.388 | 0.314 | 81.42 | 1.86 | 16.72 |
| Grasslands | 86 | 0.041 | 0.498 | 0.405 | 68.60 | 11.63 | 19.77 | |
| Croplands | 239 | 0.276 | 0.414 | 0.343 | 84.52 | 4.18 | 11.30 | |
| Forest | 9 | 0.448 | 0.436 | 0.322 | 66.67 | 0 | 33.33 | |
| Water | 40 | 0.610 | 0.288 | 0.234 | 100.00 | 0 | 0 |
Table 5.
Validation of POLDER-3/GRASP AOD and AE in 0.5° × 0.5° resolution over different land covers in China.
Table 5.
Validation of POLDER-3/GRASP AOD and AE in 0.5° × 0.5° resolution over different land covers in China.
| Land Cover | N | R | RMSE | MAE | =EE (%) | <EE (%) | >EE (%) | |
|---|---|---|---|---|---|---|---|---|
| AOD | Urban | 1231 | 0.910 | 0.249 | 0.184 | 47.28 | 5.77 | 46.95 |
| Grasslands | 938 | 0.815 | 0.202 | 0.158 | 34.54 | 5.33 | 60.13 | |
| Croplands | 893 | 0.917 | 0.292 | 0.192 | 51.18 | 3.25 | 45.58 | |
| Forest | 476 | 0.878 | 0.270 | 0.218 | 13.03 | 0.42 | 86.55 | |
| Water | 392 | 0.820 | 0.353 | 0.244 | 44.64 | 3.57 | 51.79 | |
| AE | Urban | 1259 | 0.631 | 0.302 | 0.225 | 95.55 | 2.62 | 1.83 |
| Grasslands | 951 | 0.510 | 0.471 | 0.342 | 75.18 | 20.19 | 4.63 | |
| Croplands | 906 | 0.584 | 0.304 | 0.231 | 94.92 | 1.88 | 3.20 | |
| Forest | 476 | 0.601 | 0.381 | 0.303 | 89.92 | 8.61 | 1.47 | |
| Water | 392 | 0.600 | 0.320 | 0.245 | 94.64 | 3.83 | 1.53 |
Table 6.
The performance of aerosol products for AOD.
| Products | R | RMSE | Expected Error Line | Within the EE Lines (%) | Region | Reference |
|---|---|---|---|---|---|---|
| MODIS DT | 0.85 | 0.15 | ±0.05 ± 0.2 × AOD | 56.47 | China | [45] |
| MODIS DB | 0.84 | 0.22 | 60.30 | |||
| MODIS DTB | 0.89 | 0.17 | 65.32 | |||
| AVHRR DB | 0.30 | ±0.05 ± 0.25 × AOD | 51.21 | [46] | ||
| VIIRS DB | 0.92 | 0.17 | ±0.05 ± 0.2 × AOD | 80.32 | [47] | |
| MAIAC | 0.92 | 0.19 | ±0.05 ± 0.2 × AOD | 72.00 | [33] | |
| AHI | 0.82 | 0.30 | ±0.05 ± 0.2 × AOD | 55.00 | [48] | |
| MISR V23 | 0.90 | 0.25 | ±0.05 ± 0.2 × AOD | 80.60 | This paper | |
| POLDER-3/GRASP | 0.90 | 0.26 | ±0.05 ± 0.2 × AOD | 40.71 | This paper | |
| Terra MODIS DT C6.0 | 0.87 | 0.15 | ±0.05 ± 0.2 × AOD | 62.47 | Global | [50] |
| Aqua MODIS DT C6.0 | 0.87 | 0.13 | ±0.05 ± 0.2 × AOD | 68.36 | ||
| Terra MODIS DT C6.1 | 0.91 | 0.14 | ±0.05 ± 0.15 × AOD | 43.65 | [51] | |
| MAIAC | 0.93 | 0.15 | ±0.05 ± 0.15 × AOD | 68.00 | [52] |
Publisher’s Note: MDPI stays neutral with regard to jurisdictional claims in published maps and institutional affiliations. |
© 2022 by the authors. Licensee MDPI, Basel, Switzerland. This article is an open access article distributed under the terms and conditions of the Creative Commons Attribution (CC BY) license (https://creativecommons.org/licenses/by/4.0/).
Share and Cite
MDPI and ACS Style
Jiao, S.; Li, M.; Fan, M.; Li, Z.; Xu, B.; Tao, J.; Chen, L. Validation and Analysis of MISR and POLDER Aerosol Products over China. Remote Sens. 2022, 14, 3697. https://0-doi-org.brum.beds.ac.uk/10.3390/rs14153697
AMA Style
Jiao S, Li M, Fan M, Li Z, Xu B, Tao J, Chen L. Validation and Analysis of MISR and POLDER Aerosol Products over China. Remote Sensing. 2022; 14(15):3697. https://0-doi-org.brum.beds.ac.uk/10.3390/rs14153697
Chicago/Turabian StyleJiao, Sunxin, Mingyang Li, Meng Fan, Zhongbin Li, Benben Xu, Jinhua Tao, and Liangfu Chen. 2022. "Validation and Analysis of MISR and POLDER Aerosol Products over China" Remote Sensing 14, no. 15: 3697. https://0-doi-org.brum.beds.ac.uk/10.3390/rs14153697
Note that from the first issue of 2016, this journal uses article numbers instead of page numbers. See further details here.