
Tree Species Classification of Backpack Laser Scanning Data Using the PointNet++ Point Cloud Deep Learning Method


1
Research Center of Forest Management Engineering of State Forestry and Grassland Administration, Beijing Forestry University, Beijing 100083, China
2
Institute of Forest Resource Information Techniques, Chinese Academy of Forestry, Beijing 100091, China
*
Author to whom correspondence should be addressed.
Remote Sens. 2022, 14(15), 3809; https://0-doi-org.brum.beds.ac.uk/10.3390/rs14153809
Submission received: 29 June 2022
/
Revised: 4 August 2022
/
Accepted: 5 August 2022
/
Published: 7 August 2022
(This article belongs to the Special Issue Quantitative Remote Sensing Product and Validation Technology)
Abstract
:To investigate forest resources, it is necessary to identify the tree species. However, it is a challenge to identify tree species using 3D point clouds of trees collected by light detection and ranging (LiDAR). PointNet++, a point cloud deep learning network, can effectively classify 3D objects. It is important to establish high-quality individual tree point cloud datasets when applying PointNet++ to identifying tree species. However, there are different data processing methods to produce sample datasets, and the processes are tedious. In this study, we suggest how to select the appropriate method by designing comparative experiments. We used the backpack laser scanning (BLS) system to collect point cloud data for a total of eight tree species in three regions. We explored the effect of tree height on the classification accuracy of tree species by using different point cloud normalization methods and analyzed the effect of leaf point clouds on classification accuracy by separating the leaves and wood of individual tree point clouds. Five downsampling methods were used: farthest point sampling (FPS), K-means, random, grid average sampling, and nonuniform grid sampling (NGS). Data with different sampling points were designed for the experiments. The results show that the tree height feature is unimportant when using point cloud deep learning methods for tree species classification. For data collected in a single season, the leaf point cloud has little effect on the classification accuracy. The two suitable point cloud downsampling methods we screened were FPS and NGS, and the deep learning network could provide the most accurate tree species classification when the number of individual tree point clouds was in the range of 2048–5120. Our study further illustrates that point-based end-to-end deep learning methods can be used to classify tree species and identify individual tree point clouds. Combined with the low-cost and high-efficiency BLS system, it can effectively improve the efficiency of forest resource surveys.
1. Introduction
Forest resource surveys are the basic work of forestry, and tree species identification is one of the important tasks. A timely and accurate understanding of the status and structure of forests and the composition of tree species is essential for developing policies and strategies for the sustainable management of forest resources [1]. In traditional field surveys, tree species identification mainly relies on experts to make visual judgments, which limits the efficiency of field surveys [2]. In the last four decades, advances in remote sensing technology have made it possible to use data from various remote sensing sensors for tree species classification [1]. Unlike satellite and airborne remote sensing images, which can only obtain macroscale tree species distribution maps, light detection and ranging (LiDAR), as an emerging active remote sensing technology, has unique advantages in extracting three-dimensional (3D) structural information of vegetation, and its application in the field of forest resource surveys and research is gaining increasing attention.
LiDAR has a strong penetration capability, and the laser beam can penetrate vegetation gaps and generate a dense 3D point cloud, which can provide a fine 3D structure of trees. Using different data acquisition platforms, laser scanning systems include airborne laser scanning (ALS), terrestrial laser scanning (TLS), and mobile laser scanning (MLS). Usually, ALS point clouds suffer from low density and uneven distribution; TLS point cloud data acquisition is labor-intensive and costly. Backpack laser scanning (BLS) is a type of MLS system. The continuous development of LiDAR software and hardware technology has made acquiring ground point cloud data through backpack LiDAR more convenient and quicker [3], and the cost is significantly reduced. The different leaf distribution and branching patterns of tree species lead to different structures, providing the possibility of fine classification of tree species.
LiDAR has been widely used to acquire point clouds of trees, and many studies have been conducted to classify tree species from individual tree point clouds. Support vector machine (SVM) [4,5,6,7], random forest (RF) [5,8,9,10], and other machine learning methods have been widely applied in classifying and identifying tree species. In the past decade, deep learning techniques have made rapid progress in the field of image recognition. Deep learning techniques have become attractive due to their superior performance in learning hierarchical features from high-dimensional unlabeled data. By learning multilevel feature representations, deep learning models have proven to be an effective tool for fast object-oriented classification [11].
Deep learning of point clouds has attracted increasing attention [12], especially in the last 5 years. Guan et al. [11] extracted the waveform information of the point cloud at 150 angles in the z-axis direction and calculated 134 features of the trees after completing the individual tree segmentation of the onboard LiDAR point cloud. Then, the high-level feature abstraction of waveforms and features was extracted using a deep Boltzmann machine (DBM). Lastly, SVM was used to classify 10 tree species, and the overall classification accuracy reached 86.1%. However, the study by Li et al. [13], which also used 134 features for tree classification, had an overall classification accuracy of only 77.5% because the study did not use the DBM method. Zou et al. [14] used eight tree species data from the experiments of [11] to voxelize an individual tree point cloud and projected it onto a two-dimensional plane along the z-axis, and the obtained projection image represented the low-level features of the trees. Then, a deep belief network (DBN) was introduced to generate high-level features, and a SoftMax classifier was used for classification. The overall classification accuracy was 95.6%. This shows that the projection image of the tree, as the bottom-level feature, contains more original information about the tree, and it is easier to learn from the deep model than the waveform feature in [11]. Sun et al. [15] converted ALS data into heightmaps as the input source for a deep learning neural network to segment the tree crown of a forest point cloud using three advanced generative adversarial networks (GANs), and they showed that the method yielded 3.9% accuracy over traditional watershed methods.
In 2017, PointNet [16] and PointNet++ [17] were proposed. These techniques have improved the processing techniques of deep learning methods for the classification, detection, and segmentation of 3D point cloud data. However, because deep learning methods require a large amount of training data and the publicly available point cloud datasets are limited to a small amount of ground-based data, there are relatively few studies on tree species classification. Briechle et al. [18] first used PointNet++ to semantically annotate ALS point clouds, and the experimental results showed 90% and 91% classification accuracy for coniferous and deciduous trees, respectively. Subsequently, Briechle et al. [19] also used the PointNet++ network combined with ALS-based data and multispectral imagery to classify three different tree species and dead tree canopies. Ultimately, an overall correct rate of 90.2% was achieved, significantly outperforming the random forest classifier and manual feature-based classification methods (OA = 85.3%). The study demonstrates the great potential of point-based deep learning networks for accurately classifying tree species.
Xi et al. [20] used the PointNet++ method to classify individual tree point clouds of nine tree species obtained by TLS. PointNet++ was the most accurate and stable classifier. The input to the deep learning model of this study was the 3D coordinates of wood points after leaf–wood separation. However, other existing studies have used the original point clouds of the individual tree, and no scholars have accounted for the effect of using leaf-on or leaf-off data in the point cloud deep learning process on the classification accuracy. Liu et al. [21] proposed a tree-structured deep neural network called LayerNet, which can learn the global and local features of point clouds. This study used ALS data to classify two tree species, which was a 2.1% improvement over the PointNet method. The study analyzed the effect of different sampling points of the samples on the accuracy of the model and concluded that the classification performance of the network is saturated when the number of points exceeds approximately 2000. Seidel et al. [22] also used the PointNet method to identify individual tree point clouds for seven tree species. However, the overall classification accuracy was low. The authors attributed the low classification accuracy to the small number of samples. Chen et al. [23] proposed a point cloud tree species classification network (PCTSCN) to classify white birch and larch. The individual tree point clouds were downsampled using a modified farthest point sampling method. This method is similar to the PointNet classification method in that both learn the global features of point clouds for classification. Lv et al. [24] proposed a convex packet-based feature descriptor that was combined with the 3D coordinates of an individual tree point cloud (sampled as 2048 points) acquired by ALS and jointly input into a PointNet++ model to classify four tree species. This feature descriptor expanded the input features of the sample point cloud and improved the classification accuracy of the model from 72.7% to 86.6%. Briechle et al. [25] introduced a convolutional neural network (CNN)-based approach called Silvi-Net to fuse airborne LiDAR data and multispectral (MS) images for tree species classification. The classification accuracies were improved by 11.3% and 2.2%, respectively, over those of the PointNet++ method. This improvement was due to the significant time investment in the data preprocessing process.
Overall, good results were achieved for tree species classification of individual trees from LiDAR point clouds, and the classification accuracy of deep learning methods was overall higher than that of machine learning methods [20]. Although the multiview projection approach also achieves good classification accuracy, it cannot maximize the 3D structure information of the point cloud and still has limitations in terms of point cloud classification and understanding. Considering the total time overhead of 3D data preprocessing and feature extraction, deep learning classifiers are generally more time-efficient. Deep learning frameworks based directly on 3D data have important research implications. An increasing number of scholars have started using point-based deep learning models for tree species classification of individual tree point clouds and validated PointNet++ as a promising network.
However, all current studies using PointNet++ have normalized the 3D coordinates of individual tree point clouds to within a unit sphere of radius 1, thus depriving the data of height characteristics. There is no relevant study considering the effect of tree height on the classification accuracy of tree species. It is of interest that most studies of the PointNet++ model input the number of points of the individual tree point cloud as 1024 or 2048. Each sample needs to have the same number of points to meet the model input requirements, but no study has specified the value of the number of points in the sample point cloud to obtain the optimal classification accuracy of tree species. To obtain a fixed number of points for a sample, the original point cloud needs to be downsampled. The default method used in PointNet++ is the farthest point sampling. Xi et al. [20] used 2048 points representing each individual tree obtained by clustering with the K-means method. Chen et al. [23] used a modified farthest point sampling method for the original point cloud. Which downsampling method should be used for point cloud data of trees remains to be explored. When using PointNet++ networks for tree species classification of individual tree point clouds, there is uncertainty about the impact of point cloud normalization, the choice of the downsampling method, the number of points included in the sample, and whether the leaf point cloud needs to be removed on the classification accuracy of the model. It is important to clarify the answers to these questions to a obtain higher classification accuracy.
To address the problems and shortcomings of the current studies, a series of comparative trials were designed in this study. The effect of tree height on the classification accuracy of the model was explored using two standardized methods. Leaf–wood separation of individual tree point clouds was performed to analyze the effect of leaves on the classification accuracy of tree species. The effects of five point cloud downsampling methods on the classification accuracy of the model were compared and analyzed, and a downsampling method applicable to the study of tree species classification in individual tree point clouds was selected. A comparison test with different sampling points of individual tree point cloud samples was also designed to obtain a suitable number of points to meet the model input of PointNet++. The solution to all of the above problems is an important guideline for research related to tree species classification using point cloud deep learning methods.
2. Materials
2.1. Study Area
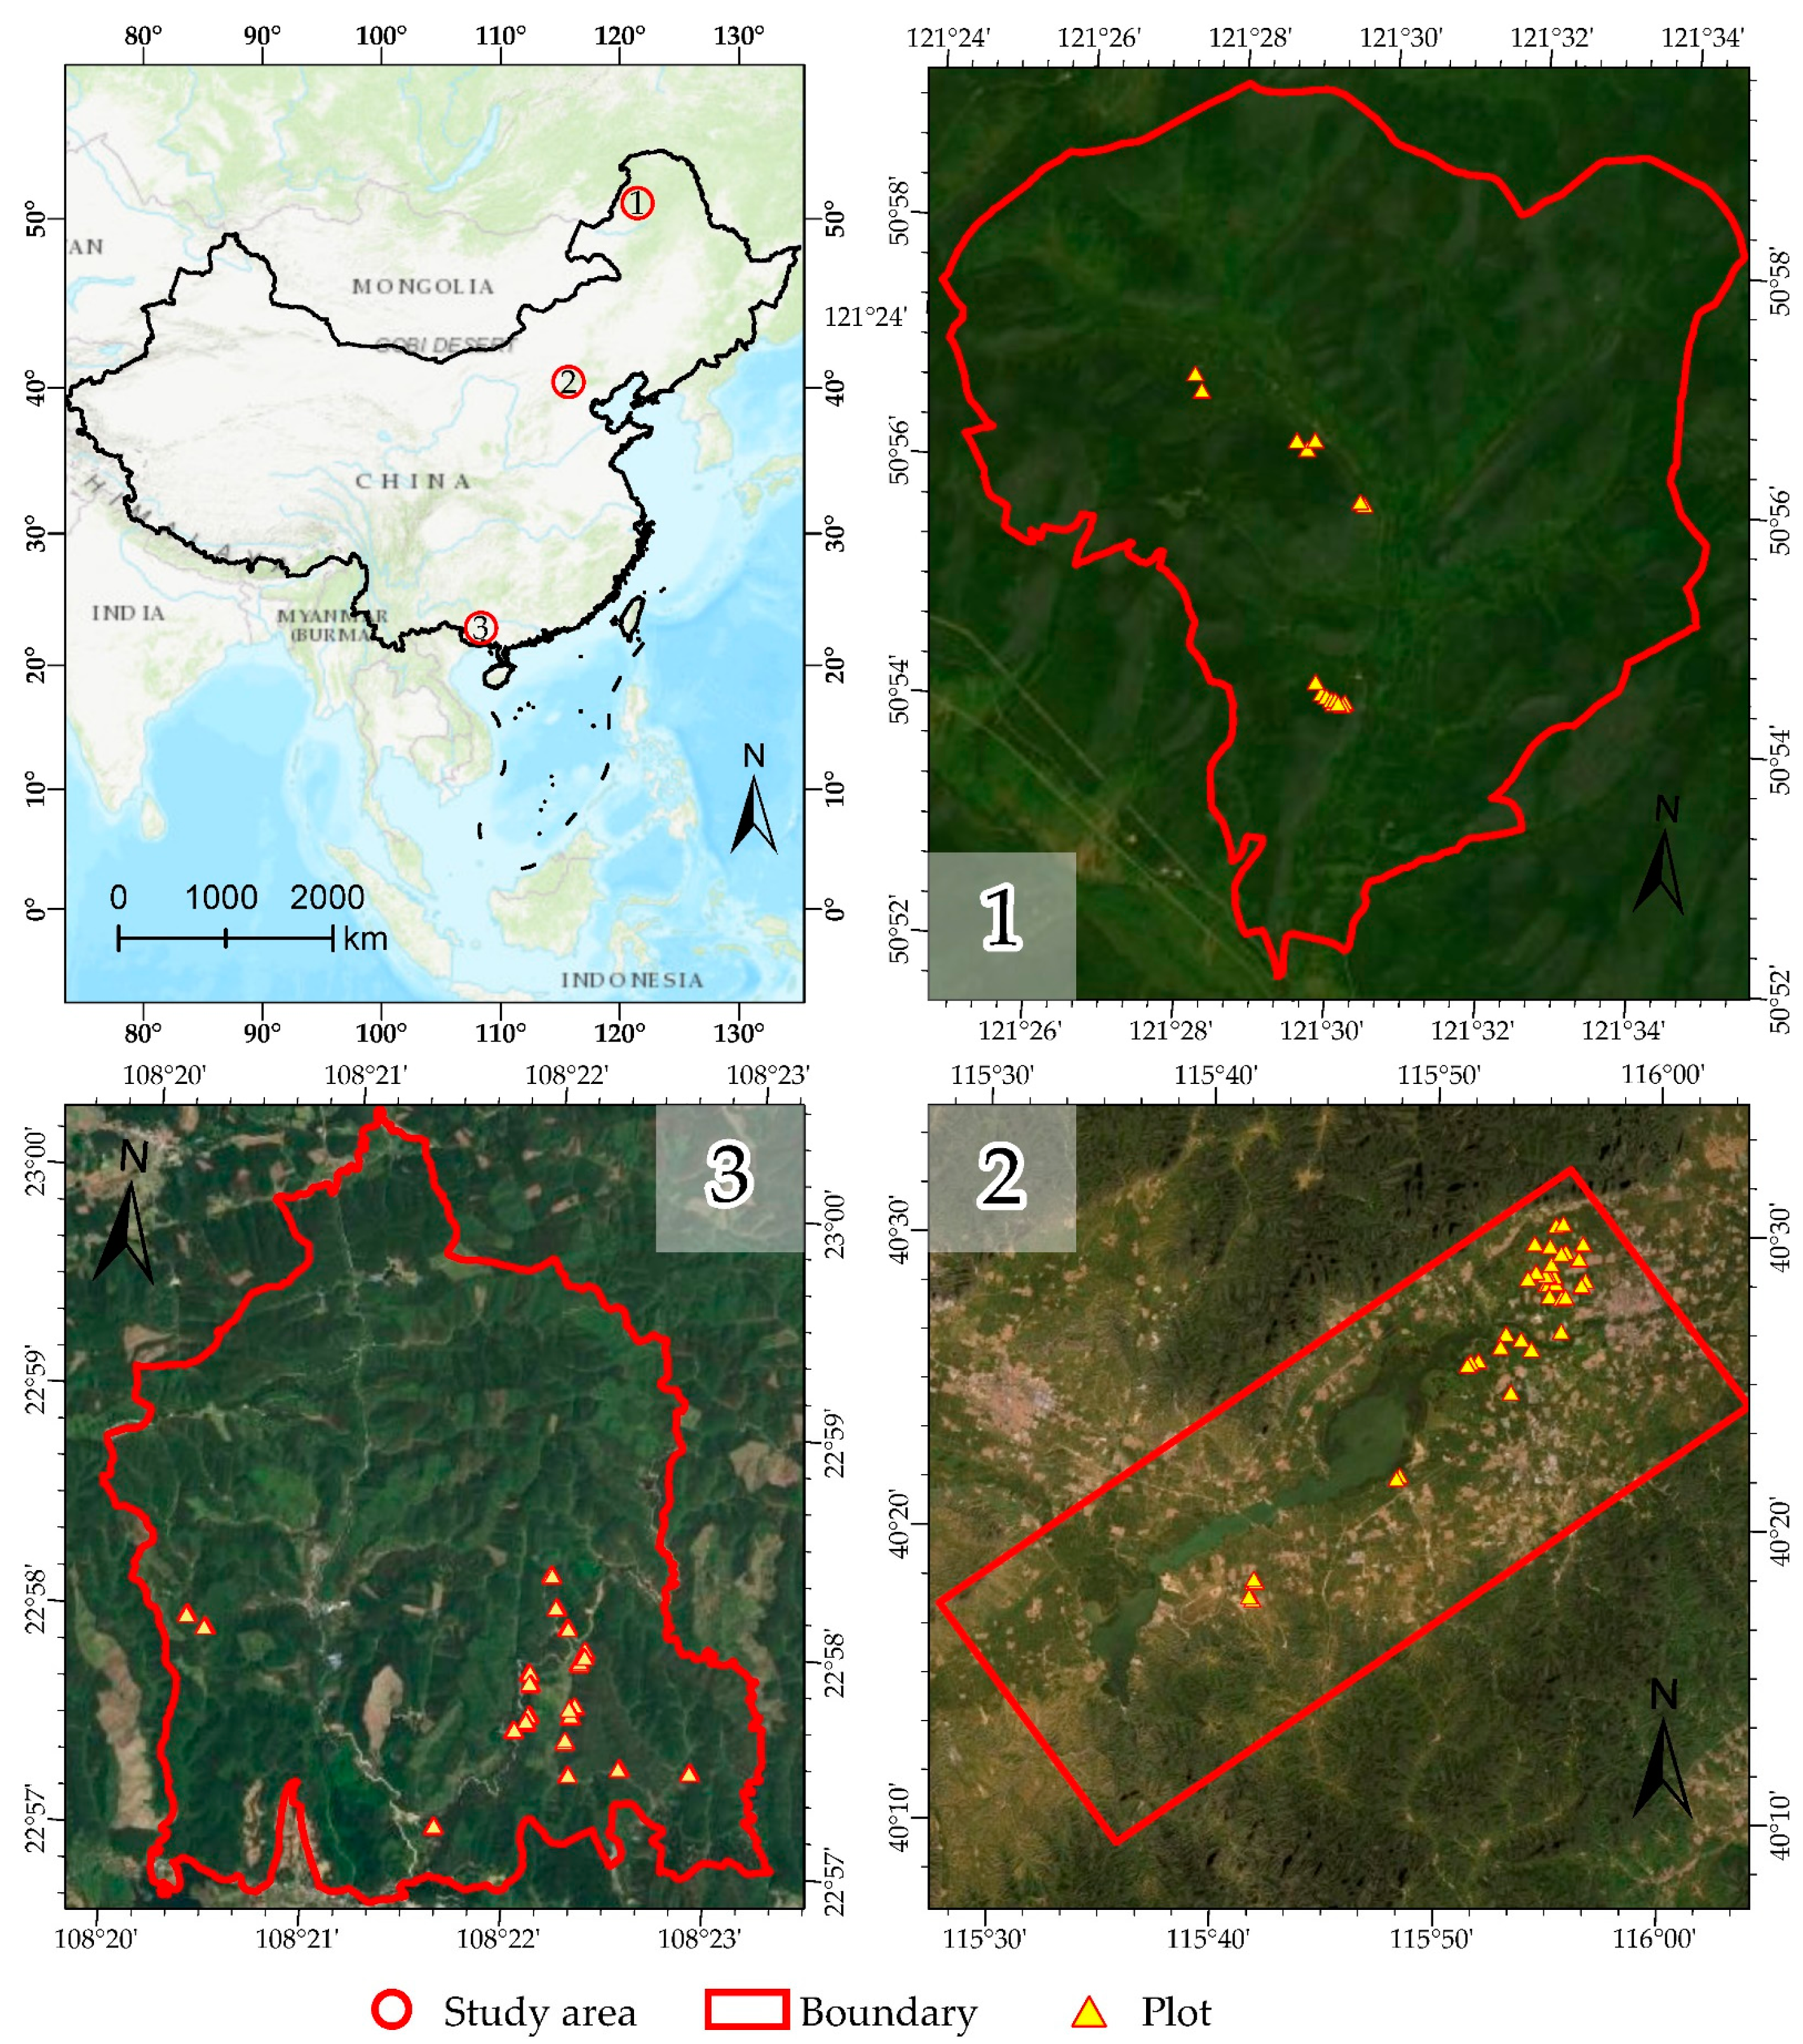
In this research, three study areas in China were selected for BLS data collection, the Greater Khingan Station, the Huailai Remote Sensing Comprehensive Experimental Station, and the Gaofeng forest farm, located in northeast, north, and south China, respectively (Figure 1).
(1) The Greater Khingan Station belongs to the Chinese Forest Ecosystem Research Network (CFERN) and the China National Ecosystem Observation and Research Network (CNEN), located on the northwest slope of the Daxing’an Mountains, Genhe forestry reserve (120°12′ to 122°55′ E, 50°20′ to 52°30′ N), Inner Mongolia. The forest here is a natural forest. The tree species in the Genhe forestry reserve are mainly white birch (Betula platyphylla Suk.) and larch (Larix gmelinii Rupr.).
(2) The Huailai Remote Sensing Comprehensive Experimental Station is located in Huailai, Hebei Province (115°47′ E, 40°20′ N). The station is part of the special environment network of the Chinese Academy of Sciences. All the forests here are planted. The main tree species near the experimental station are locust (Sophora japonica), willow (Salix babylonica), poplar (Populus), and elm (Ulmus pumila).
(3) The Gaofeng forest farm (108°20′ to 108°32′ E, 22°56′ to 23°4′ N) is located in Nanning city, Guangxi, and is the largest state-owned forest farm in Guangxi. The experimental area is the Jiepai subfield in the Gaofeng forest farm. All the plots here are semi-natural forests. The major species with relatively taller trees are eucalyptus (Eucalyptus robusta) and Chinese fir (Cunninghamia lanceolate).
2.2. Backpack Laser Scanning Data Collection
BLS data for the three study areas of the Greater Khingan Station, the Huailai Remote Sensing Comprehensive Experimental Station, and the Gaofeng forest farm were acquired using the LiBackpack DGC50 backpack LiDAR 3D scanning system in September, July, and April 2021, respectively. Table 1 displays the key parameters of the LiBackpack DGC50 backpack LiDAR 3D scanning system produced by Beijing GreenValley Technology Co., Ltd. (China). We fully scanned the trees within the sample plots during LiDAR point cloud data acquisition, ensuring that the sensors were scanned at all angles of each tree.
At the Greater Khingan Station, we collected BLS data from eight 25 m × 25 m larch forest sample plots, two 25 m × 25 m mixed larch and birch forest sample plots, and seven irregular-sized birch forests. Near the Huailai Remote Sensing Comprehensive Experimental Station, we established 41 square sample plots of 20 m width and collected BLS data. In study area (2) we selected the four most abundant tree species to participate in this experiment. In the Gaofeng forest farm, we collected BLS data from eight eucalyptus and eight Chinese fir forest sample plots of 20 m width. Tree species, diameter at breast height (DBH), and tree height (TH) within the square sample plots of all study areas were surveyed manually in the field and information collected.
3. Methods
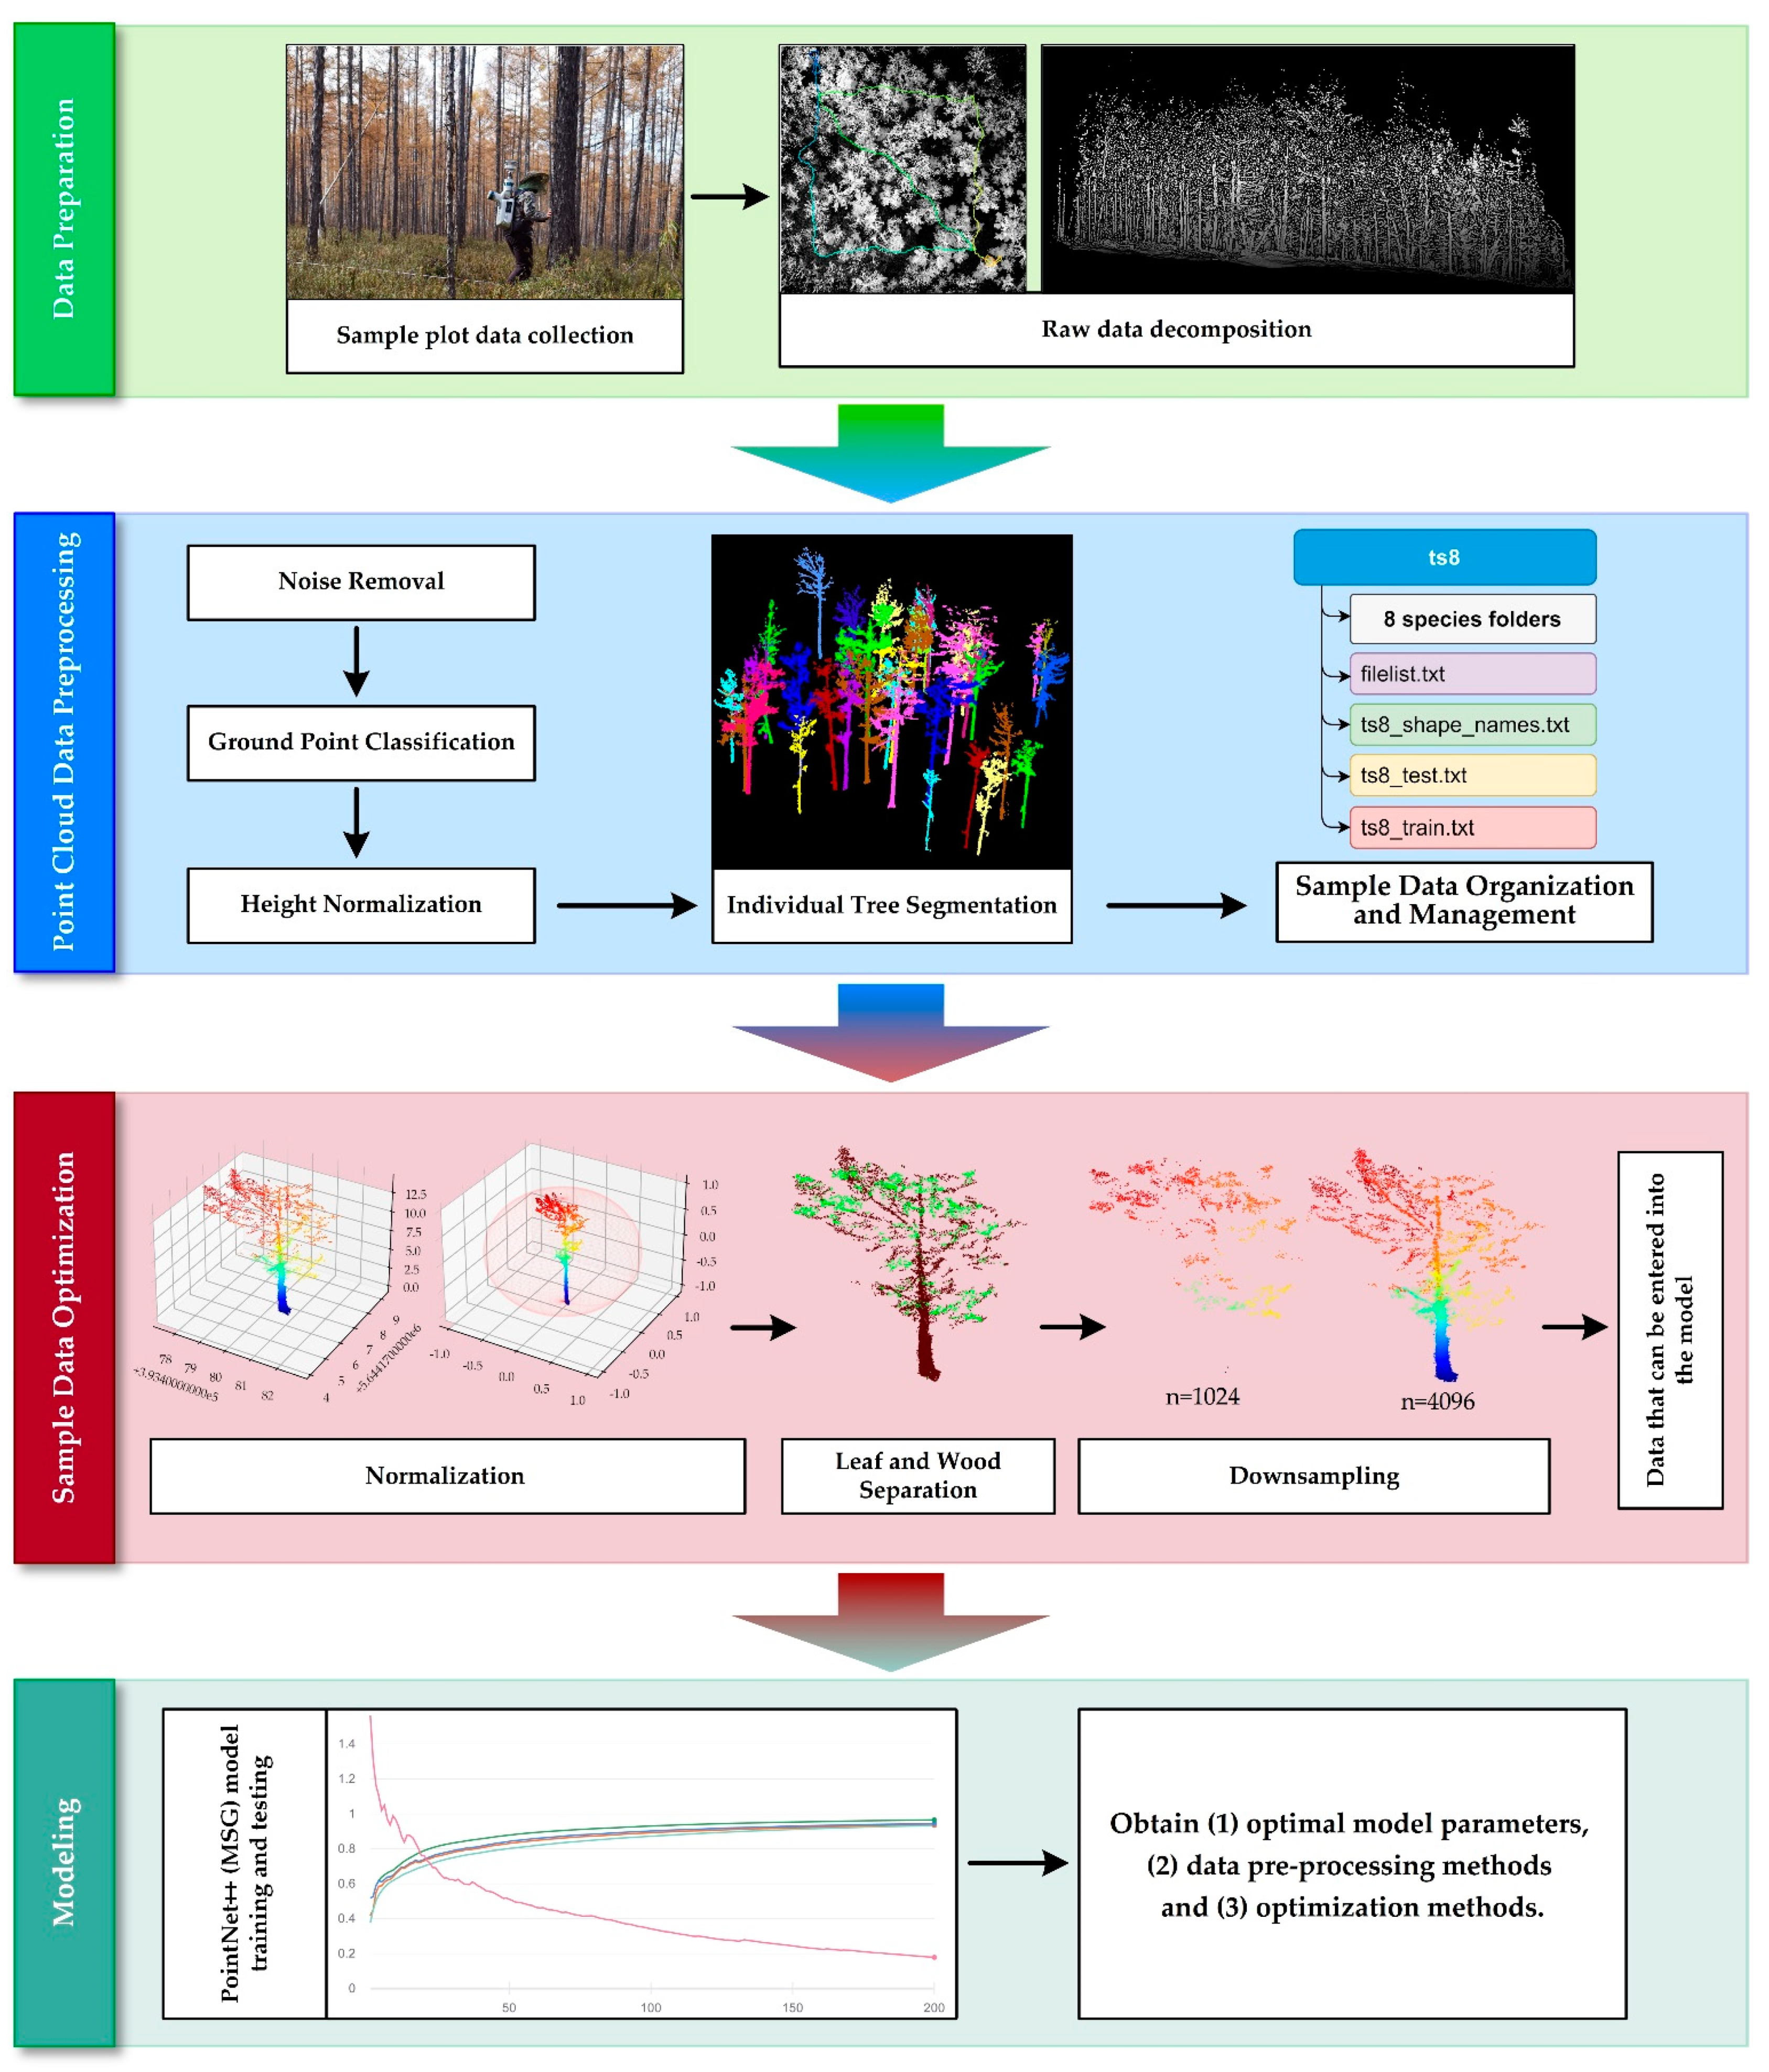
The entire experimental process, consisting of data preparation, point cloud data preprocessing, sample data optimization, and model training, is summarized in Figure 2.
3.1. Data Preprocessing
The raw point clouds collected using the LiDAR sensors need to be preprocessed as necessary to obtain point clouds of individual trees that satisfy the input conditions of the PointNet++ model. The preprocessing process includes the following steps: (1) obtain vegetation point clouds by denoising and ground point separation; (2) segment the point clouds to obtain the point clouds of individual trees; (3) create sample datasets to organize the sample data.
3.1.1. Noise Removal
The main noise points in the raw data collected by the experiment were (1) air points significantly higher than the ground, (2) points significantly lower than the ground, and (3) isolated points in the data. To eliminate the noise created by (1) and (2), the height thresholding method was used. To eliminate the noise created by (3), a spatial-distribution-based algorithm was used. The basic principle is to calculate the number of points within a given search radius centered at each point; if the number of points in that neighborhood is less than a certain threshold, that center point is considered a noise point.
3.1.2. Ground Point Classification
The individual tree point cloud is the input data for the PointNet++ model. As a prerequisite for point cloud normalization and individual tree segmentation, ground points must be classified. Therefore, ground points need to be extracted and separated. In complex forest scenes, high-precision ground point cloud classification results can be obtained using the improved progressive TIN densification (IPTD) [26] algorithm. The initial TIN was constructed using the initial seed point and then iteratively densifying the TIN. The parameters of iteration angle and iteration distance were set to 8 and 1.4, respectively.
3.1.3. Height Normalization
Normalization based on ground points or DEM removes the effect of terrain undulations on the elevation values of the point cloud data. After ground points were classified, they were exported and interpolated using the kriging method to generate a DEM. The elevation value of the vegetation point cloud was subtracted from the image element value of the corresponding DEM in the vertical direction to obtain the normalized point cloud height value relative to the ground surface.
3.1.4. Individual Tree Segmentation
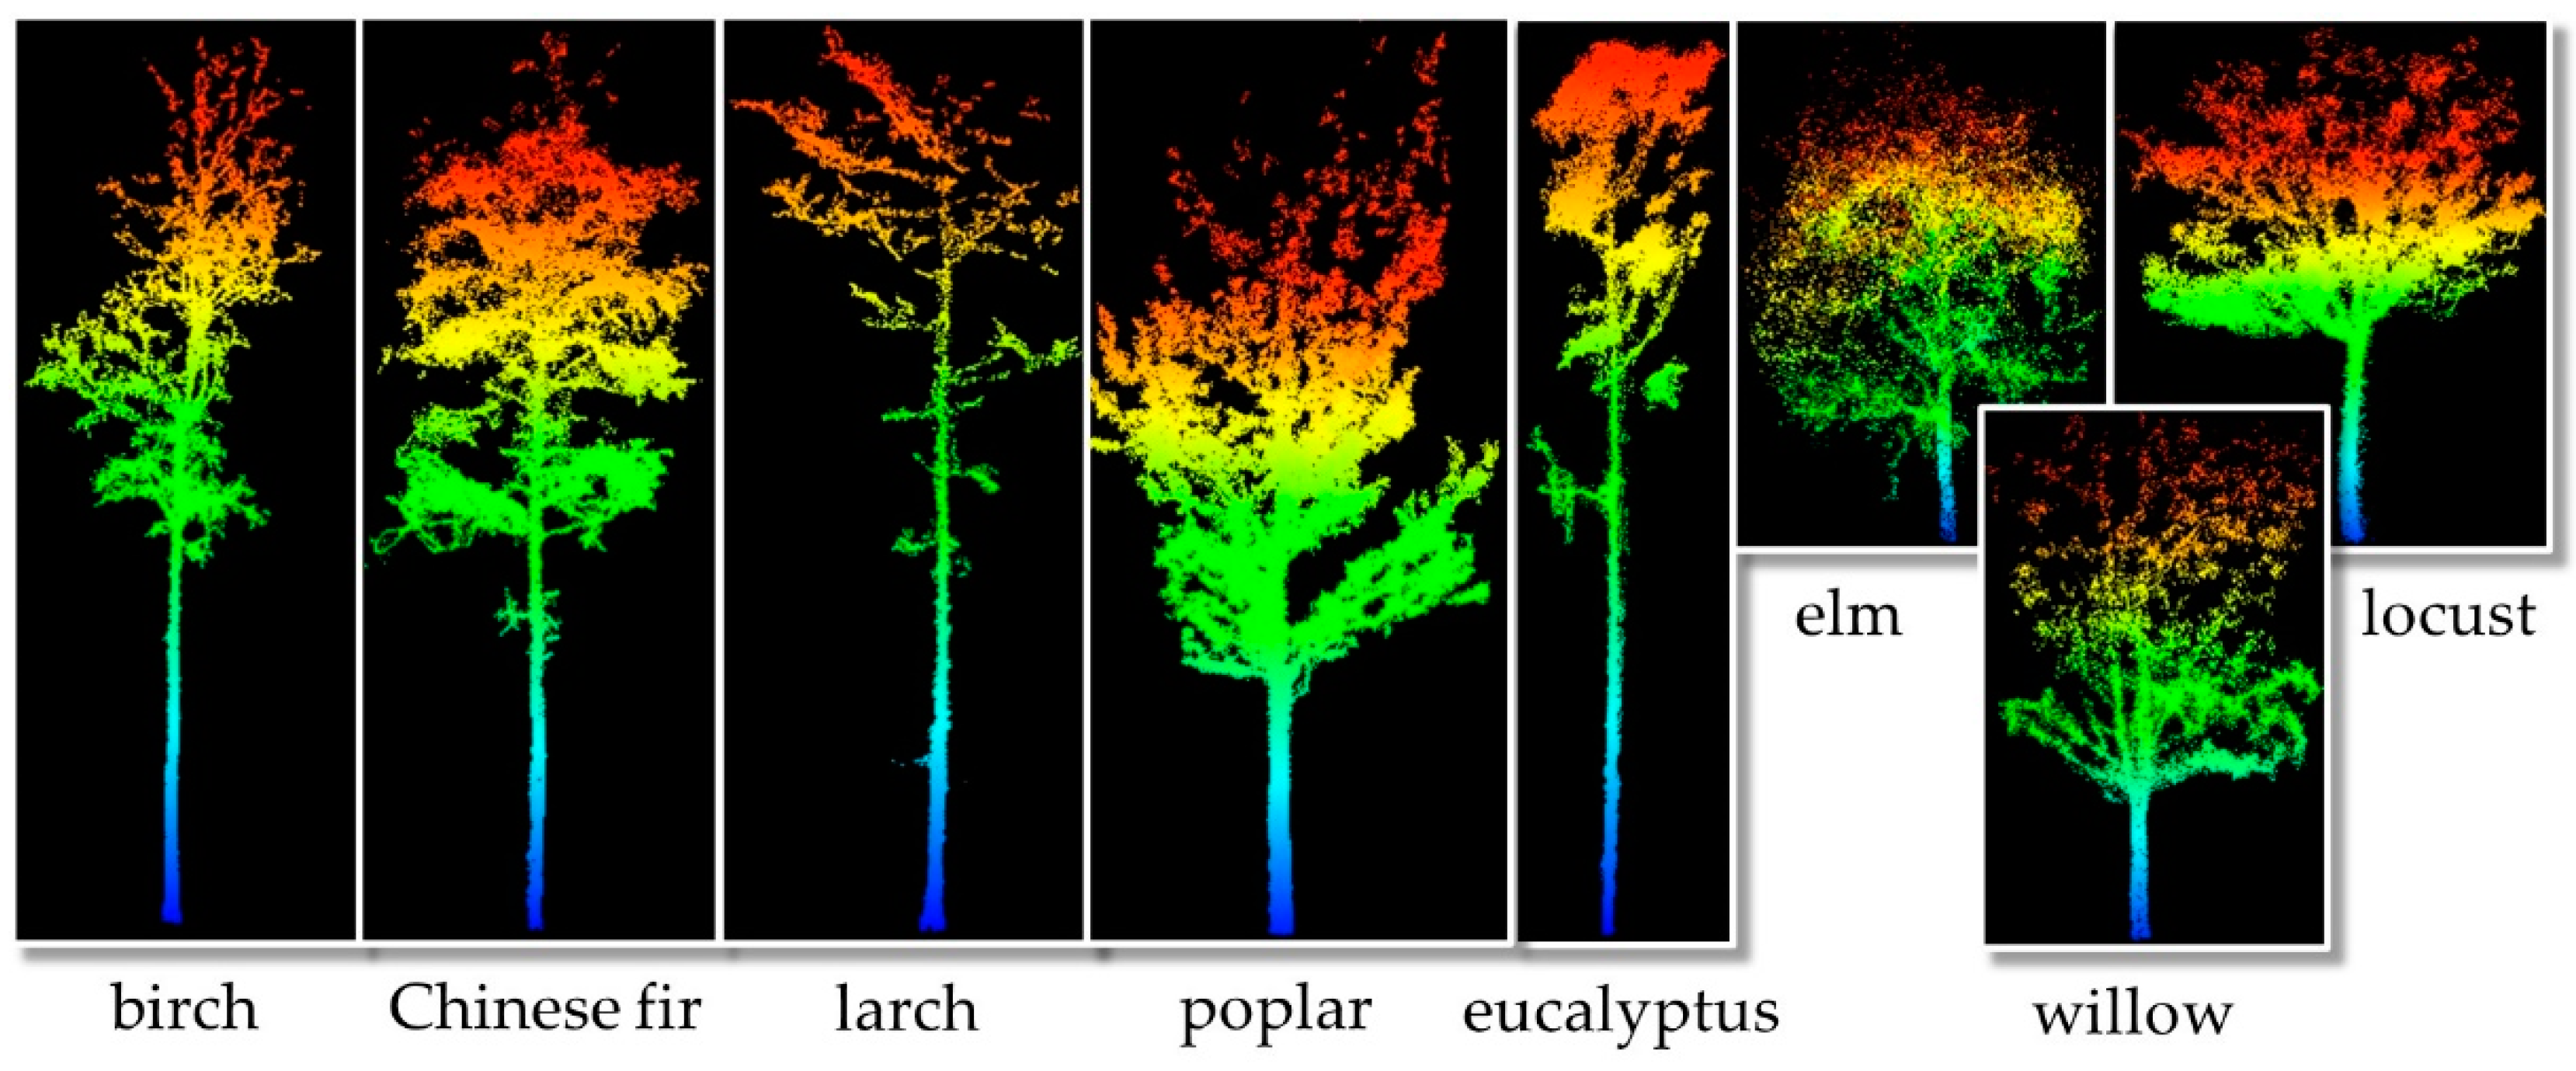
Inspired by the ecological basis and classical metabolic ecological theory, Tao et al. [27] proposed an algorithm called the comparative shortest path (CSP) to segment individual trees for TLS and MLS data. The CSP algorithm uses a bottom-up approach to identify single trees, and, after the trunk is detected, the point cloud of the crown is segmented. When we processed the data indoors, we removed all points outside the sample area in order to ensure that each tree had a complete point cloud. We considered that the method of CSP was developed for TLS and MLS data and achieved a high accuracy (0.83–0.93) in the study of Tao et al. [27]. Therefore, we preferentially used this method to segment our experimental data in this study. In our experiments, in order to obtain the most accurate individual tree segmentation results as possible, we meticulously manually edited the original point cloud before individual tree segmentation to remove a large number of invalid points (including uncensored noise points, ground points, and other vegetation on the ground). We also tried to set different segmentation parameters of CSP for the forest point cloud data of different sample sites. After obtaining the preliminary results of the individual tree segmentation, we visually inspected all the individual tree point clouds and manually adjusted the over-segmentation and under-segmentation data. Figure 3 shown an individual tree point cloud case of different tree species after segmentation.
3.1.5. Sample Data Organization and Management
After obtaining point clouds of individual trees, we manually labeled each point cloud file with the species name of the tree in conjunction with the records of the field investigation, eventually obtaining 1312 individual tree point cloud samples for eight tree species in three study areas. Table 2 presents the basic information we obtained on tree species, i.e., the number of plants, tree height, the study area, and the number of points for the sample data.
Of the 1312 individual tree point clouds that were finally obtained, 80% were selected for training the classifier for the eight tree species and 20% were selected for testing purposes. An intraspecific hierarchical random sampling strategy was used due to variance in the number of trees among tree species [20], with a final sample size of 1051 for training and 261 for testing. The training and test samples were independent and mutually exclusive in all validations.
Since the PointNet++ model is proposed to handle the shape classification problem for the ModelNet40 dataset [28], we organized and managed the point cloud data for each tree of this experiment according to the file organization form of ModelNet40.
3.2. Normalization Algorithm
When using a point cloud deep learning model for object classification, the sample data are normalized in the process of data loading. Unlike the height normalization in Section 3.1.3, all point sets were normalized to zero mean and within a unit sphere during data loading.
Equations (1) and (2) show how to calculate the coordinate values of the normalized points.
where represents the coordinates of point in the sample, represents the average of the coordinates of all points in the sample, and represents the coordinate value of point . by normalization.
Since in Equation (2) denotes the distance from the center point to the farthest point, the height difference between all samples is eliminated after processing. Trees show differences in appearance at different ages and heights. We wanted to know if the difference in heights between trees affects the classification accuracy of the deep learning model. Considering the specificity of height differences between trees, we designed another normalization method by adjusting the value of in Equation (1) to a fixed value of 20 (since half of the maximum value of the tree height in our experimental data did not exceed 20 m). All point clouds were first panned to the coordinate origin and then divided by a uniform scaling factor of 20, which ensured that the information on the height difference between all samples was retained.
3.3. Leaf and Wood Separation Algorithm
Hamraz et al. [29] used a deep convolutional neural network approach to classify conifers and deciduous trees for two sets of airborne LiDAR data after individual tree segmentation for both leaf-on and leaf-off cases. They found that, when using ALS point clouds for tree species classification, the leaf-off experiments achieved a higher classification accuracy, indicating that leaves provide trivial information. On this basis, Xi et al. [20] designed tree species classification experiments in which the leaves and wood were separated, and only the points of the wood part were retained to participate in the deep learning model, leading to a high classification accuracy. To explore whether leaf and wood separation would have an impact on the classification accuracy of LiDAR point cloud data collected by BLS, we designed a comparison experiment between two sets of data before and after leaf–wood separation.
Krishna Moorthy et al. [30] presented a leaf–wood classification method combining geometrical features defined by radially bounded nearest neighbors at multiple spatial scales in a machine learning model. This method eliminates the need to choose the optimal neighborhood size in the most advanced leaf and wood classification methods, using instead radially bounded nearest neighbors to define local neighborhoods, making the method widely applicable to 3D point cloud data of varying densities and qualities [30]. Three integration-based machine learning classifiers, random forest, lightGBM and XGBoost, were chosen for this method. The eigenvalues and vectors of each point and its neighbors at different spatial scales were calculated by setting different radius sizes. Additionally, the zenith angles of all three feature vectors of each point at different spatial scales were used as features, and a total of 30 features at five spatial scales were used to classify leaves and wood. All point clouds of individual trees in this experiment were processed to separate leaves and wood using the leaf–wood classification algorithm described above.
3.4. Downsampling Algorithm
During each complete training and testing of the PointNet++ model, the number of points for each individual tree of the input model was required to be constant. The ModelNet40 dataset used in the original study where the PointNet++ model [17] was proposed was a uniform set of N points sampled from the surface of the CAD model based on the face area, with each sample object having a uniform sampling density. In our study, the point cloud of objects collected by the LiDAR sensor was nonuniform, and the number of points was different for each tree. The reduction in points may lead to a significant loss of species structural information; hence, it is important to select a downsampling algorithm that can best retain key points. Five different point cloud downsampling methods were tested to obtain a uniform number of points for the sample dataset and to determine the downsampling method applicable to the BLS data that could obtain the highest classification accuracy for PointNet++.
To explore what number of points N in each individual tree of the PointNet++ model input can achieve a high classification accuracy in the tree species classification problem, each downsampling method was designed with nine sets of experiments, with N equal to 1024, 2048, 3072, 4096, 5120, 6144, 7168, 8192, 9216, etc.
3.4.1. Farthest Point Sampling
Farthest point sampling (FPS) is an algorithm for uniform sampling of point clouds. An individual tree is selected, and the entire point set is assumed to be , with a total of n points. The specific sampling steps are as follows:
(1) Randomly select a point as the starting point in the whole point set and insert it into the set , where the set is the set of points we sampled.
(2) Calculate the distances from the remaining n − 1 points to and select the point with the largest distance, assumed to be , and insert this point into the set .
(3) Calculate the distance of the remaining n − 2 points from point in set and choose the smallest distance value, assumed to be , where the point is assumed to be . Then, calculate the distance of the n − 2 points from point in set , and choose the smallest distance value, assumed to be , where the point is assumed to be . Subsequently, choose the larger value of and , assuming . Then, insert into the point set .
(4) Repeat Step (3) until the desired number of sampling points is selected, and finally terminate the run.
The farthest point sampling algorithm can select a series of representative points that characterize the object, which can effectively reduce the number of points and the computational effort of the classification model without changing the overall semantic information of the object. FPS is an effective downsampling method that reduces the computational complexity of the model, speeds up model training, and does not degrade the classification accuracy of the model too much.
3.4.2. K-Means
K-means is a clustering algorithm based on Euclidean distance, and the similarity between points is measured by Euclidean distance. A smaller distance indicates greater similarity. Xi et al. [20] used the K-means clustering algorithm to implement downsampling of the point cloud by randomly assigning 2048 seeds in the point cloud and iteratively moving each seed to a cluster prime around the seed. The 2048 clustered prime points generated were used as the final input to the PointNet++ model.
The basic idea of the K-means algorithm is to cluster K points in the space as the centers and group the objects closest to them. Using the iterative method, the values of each clustering center are updated one by one until the best clustering result is obtained. Assuming that the sample set is to be divided into K categories, the algorithm is described as follows:
(1) Appropriately select the initial centers of the k classes. Initially, these tend to be chosen randomly.
(2) In each iteration, calculate the Euclidean distance to each of the k centers for any sample and assign the sample to the class in which the center with the shortest distance is located.
(3) Update the values of the centers of the k classes using the mean value method.
(4) Repeat Steps (2) and (3) for all k clustering centers. When the shift distance of the class centroids satisfies certain conditions, the iteration ends, and the classification is completed.
3.4.3. Random Sampling
Given a sampling proportion m, the points of that proportion are randomly selected in the sample point set, and the same number of sampling points is obtained by dynamically adjusting the value of each sample m.
Under the condition that the total number of points N within the sample and the fixed number of sampling points K remain constant, the sampling rate m is calculated by the following formula:
3.4.4. Grid Average Sampling
The principle of the grid average downsampling method is as follows: (1) the entire 3D point cloud space is divided into fixed side size grids, (2) points in the same grid are merged into a single point in the output, and (3) a box grid filter is used to return a downsampled point cloud. This method preserves the shape of the point cloud better than the random downsampling method.
The grid average downsampling method does not guarantee that the point cloud is sampled to a specific set value but rather to several point clouds close to the set value. The edge size of the grid is specified by the user; thus, we dynamically adjust the edge size of the grid used for downsampling each sample to obtain a point set whose output points are not smaller than the number of points sampled on demand. Lastly, we use the PFS method used in PointNet++ data input processing to obtain a fixed number of points for the samples.
3.4.5. Nonuniform Grid Sampling
Unlike the average grid downsampling method, the size of each grid in the nonuniform grid sampling method is not uniform. Nonuniform grid sampling is performed by specifying the maximum number of points contained within each grid to construct grids of different sizes. This method selects a random point from each box as the output of the downsampling process. One point in each grid is randomly selected as the output of the downsampling process. We dynamically adjust the value of the maximum number of points contained in the grid points to obtain the set of points whose output is not smaller than the number of points sampled on demand. Lastly, samples containing a fixed number of points are obtained using the FPS method.
3.5. PointNet++ (MSG) Network
PointNet [16], a pioneering work in point cloud deep learning research, is limited in its ability to recognize fine-grained patterns and to generalize complex scenes by its inability to capture the local structure in the point set space. Qi et al. [17] proposed the layered neural network PointNet++, which applies PointNet recursively to the nested partitioning of the input point set and can learn local features over an increasing range of contexts by adaptively combining features from multiple scales using new learning layers and metric spatial distances. PointNet++ can learn deep point set features efficiently and robustly.
PointNet++ addresses two core problems: how to generate partitions of point sets and how to abstract point sets or local features by local feature learners. Each partition of the point set is defined as a neighborhood sphere in the underlying Euclidean space, with parameters including prime location and scale, where the FPS algorithm is used to select the prime points. PointNet can perform feature extraction on unordered point sets and is used as a learner for local feature extraction. A hierarchy consisting of two set abstraction (SA) layers is constructed to achieve the extraction of model hierarchical features. Each SA layer consists of three key layers, a sampling layer, a grouping layer, and a PointNet layer, which can be seen as one feature extraction using the PointNet model.
Since the realistic field attraction clouds obtained using BLS have different densities at different locations, a multiscale grouping (MSG) approach was used for this experiment. Multiscale point neighborhoods were selected to group the layers according to different scale sizes, and PointNet was used to extract features at each scale. Some sample points of the input model were also randomly discarded to enhance the robustness of the model. In a comparison experiment by Qi et al. [17], MSG combined with random point discard obtained the highest classification accuracy.
The deep learning framework used for the experiments was PyTorch (1.10.0 + CUDA 11.3). Windows 10 was used for the experiments, and the computer configuration was as follows: Intel® Core™ i7-10700KF CPU @ 3.80 GHz, 32 GB RAM, and NVIDIA GeForce RTX 3070 (8 GB). Table 3 displays the model hyperparameters and some optimized configuration parameters used in this experiment.
4. Results
In all, 180 experiments (2 normalization × 2 original or wood × 5 downsampling algorithms × 9 sampling points of samples) were designed to explore and select the optimal input parameters for the model and the most efficient data preprocessing method applicable to the BLS tree species classification.
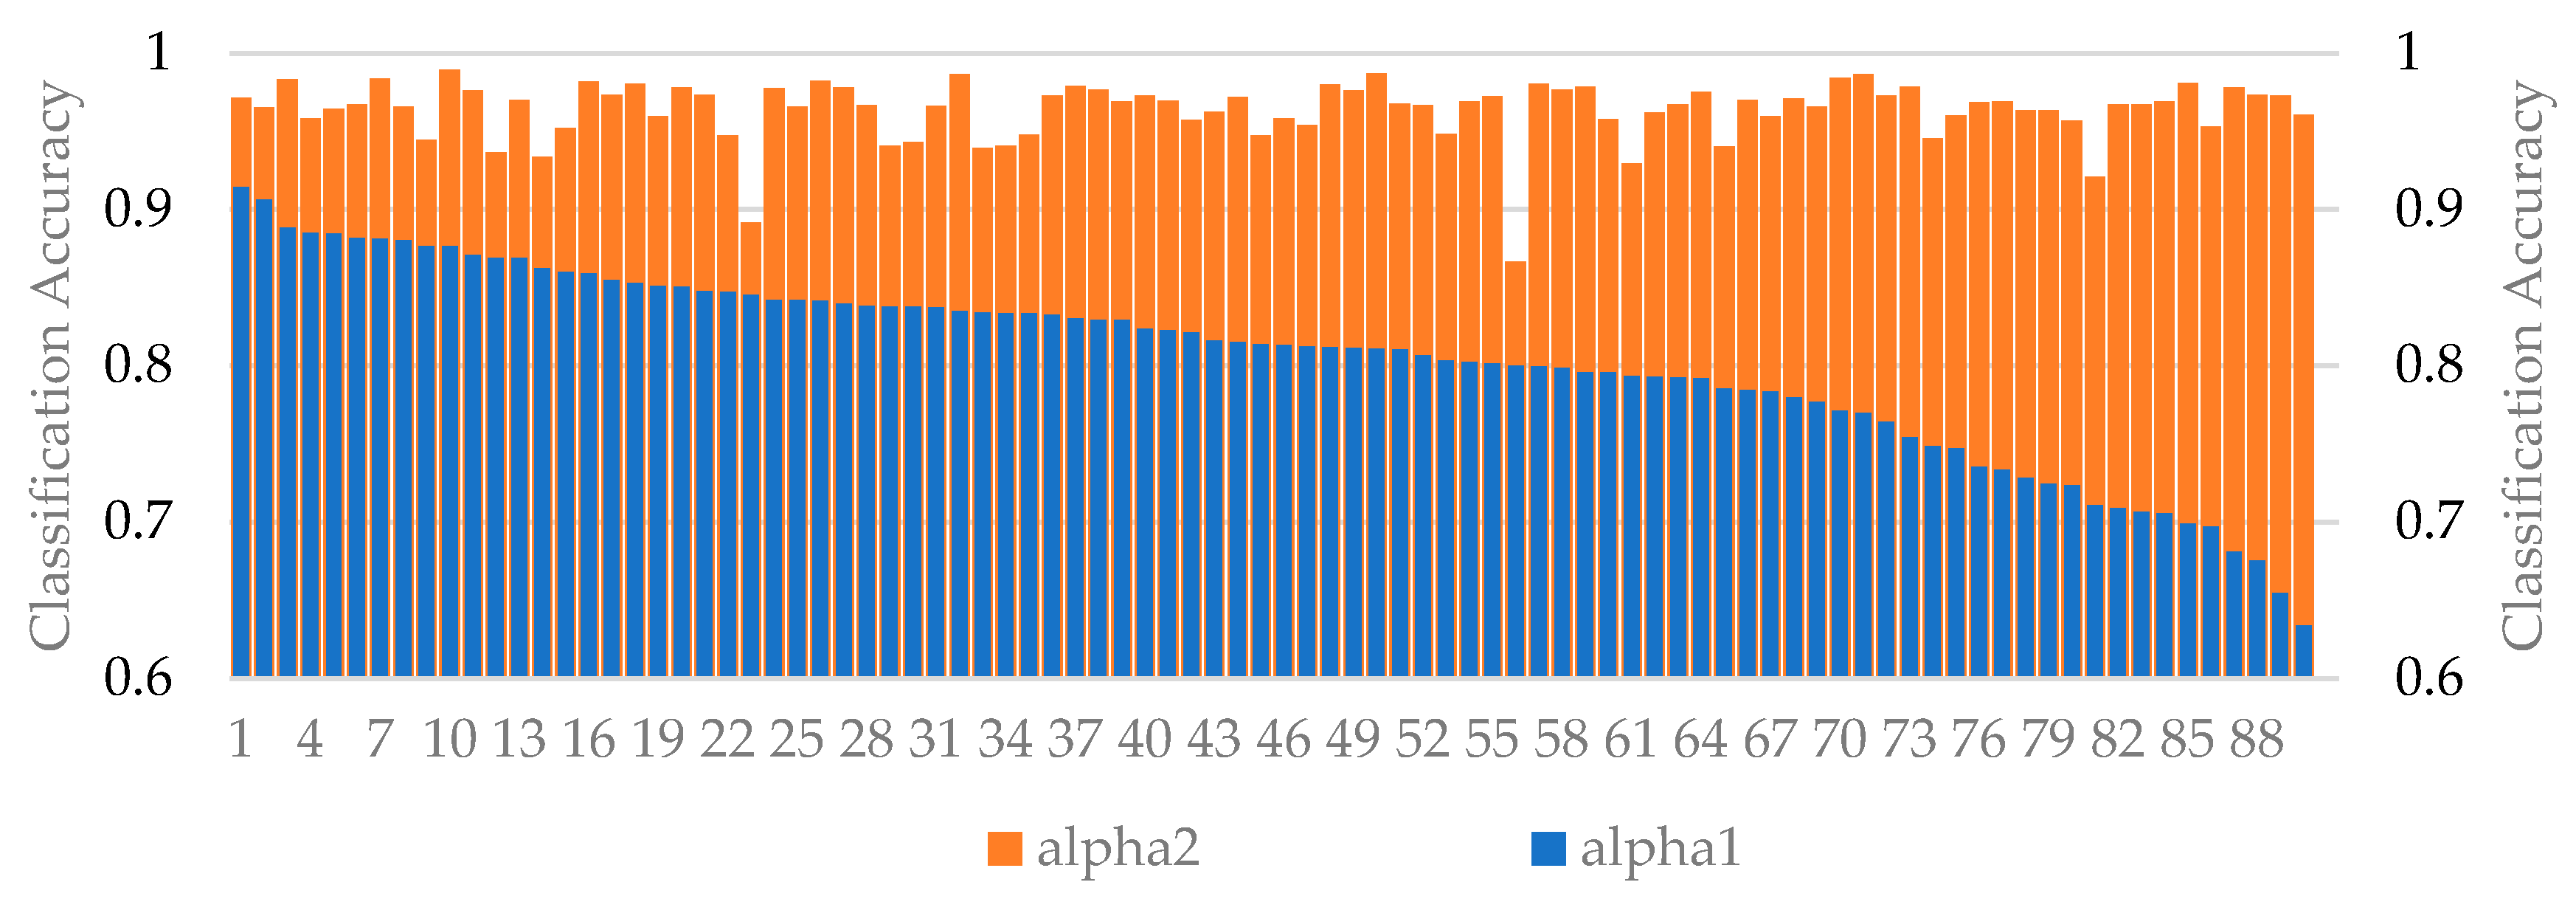
4.1. The Impact of Different Normalization Algorithms on Accuracy
The results of a total of 90 sets of comparison experiments were used to test whether our proposed normalization method, which differs from the original model processing of the point cloud, is reasonable. The results of the experiments are shown in Figure 4. The height of the blue bar in the figure indicates the classification accuracy of the experiment we designed using a fixed normalization scale factor of 20 (alpha1), and the height of the orange bar indicates the classification accuracy of the experiment in which all points are normalized to mean zero and within a unit ball (alpha2). From Figure 4, we can see that the precision of all alpha2 experiments was higher than that of alpha1. The mean value of the classification precision of alpha1 experiments was 0.81, and that of alpha2 experiments was 0.96. As the precision of the alpha1 experiments decreased, the precision of the alpha2 experiments changed little and remained in a high precision range (0.93 ± 0.06).
4.2. The Impact of Leaf and Wood Separation on Results
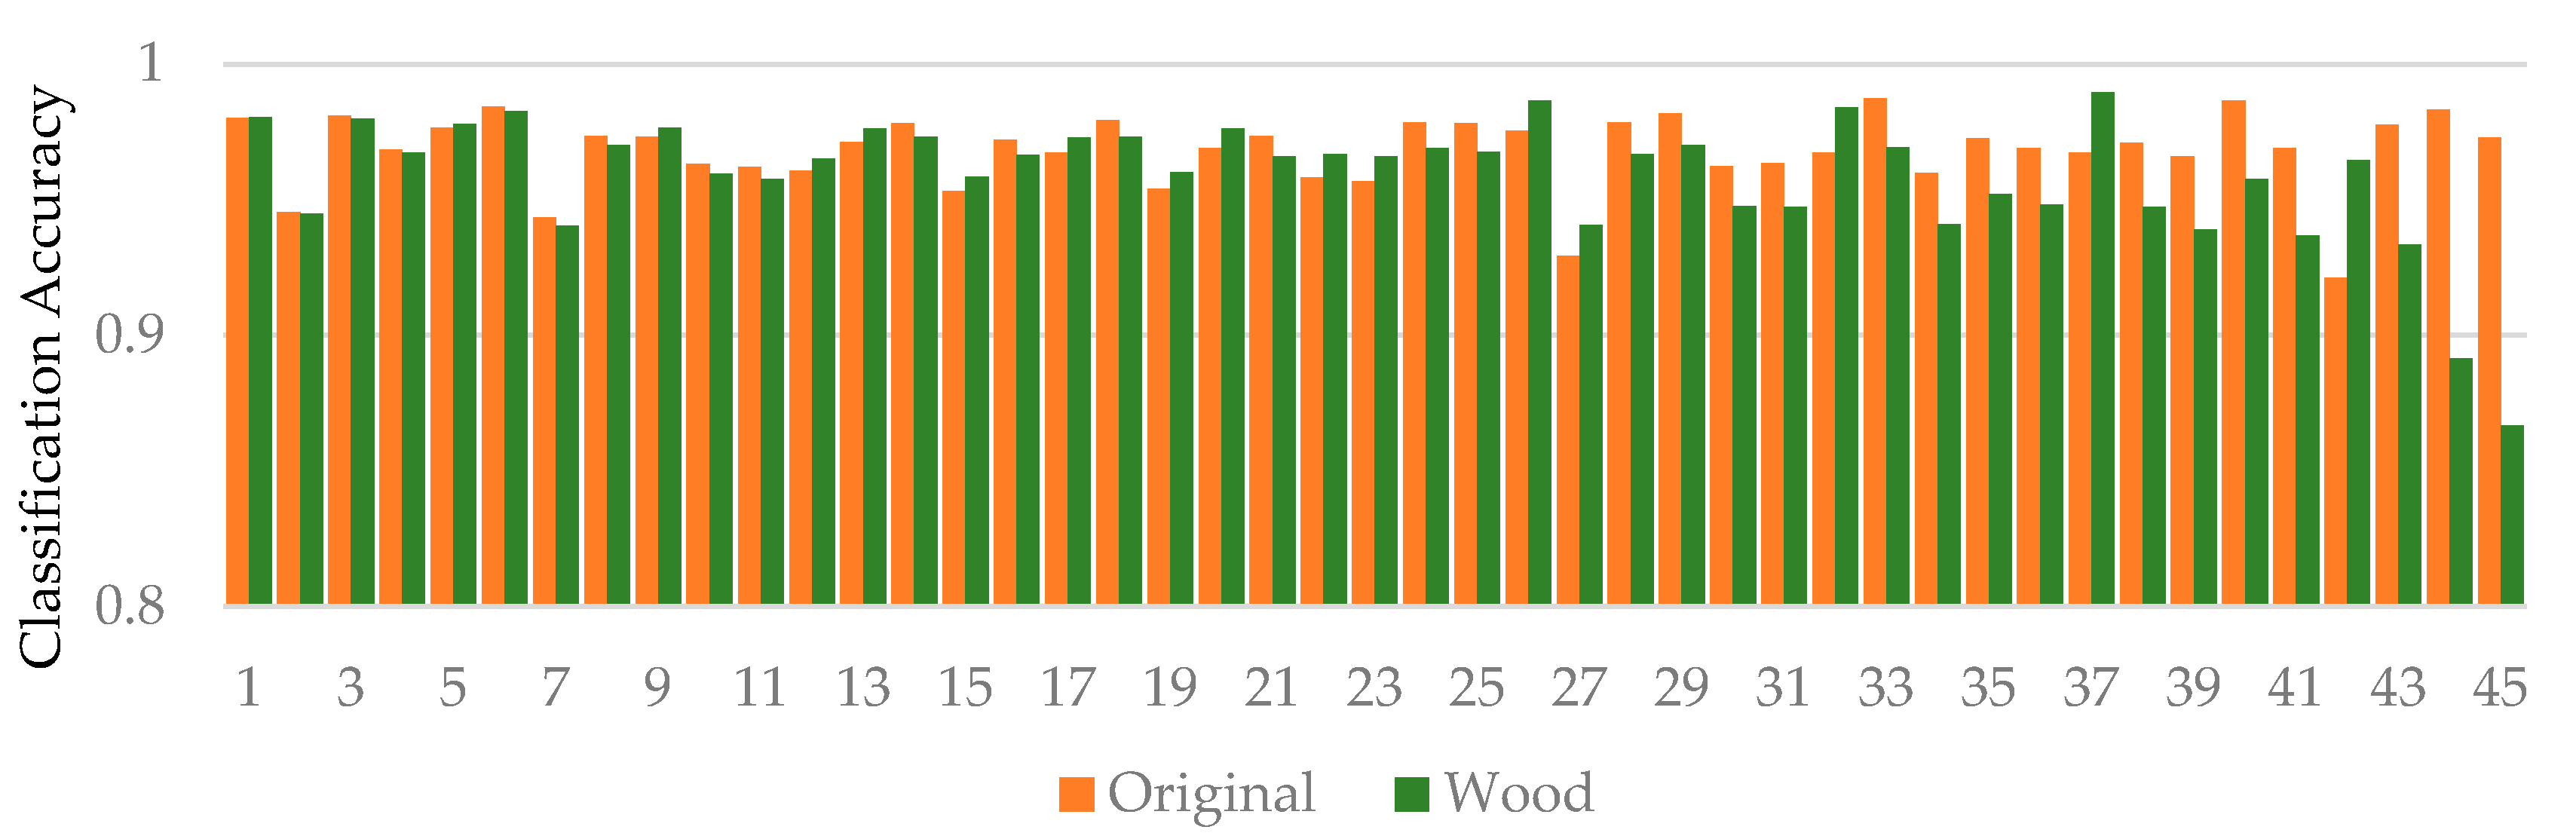
To understand the effect of tree leaves on classification accuracy, we analyzed 45 sets of comparison experiments using the alpha2 normalization method. Figure 5 represents the classification accuracy of the tree species without leaf and wood separation (original) and with only wood point clouds (wood) participating in the experiment. The highest tree species classification accuracy among the 90 experiments was 0.9896, which used W point cloud data. The classification accuracy of tree species in all the experiments was greater than 0.85. The mean values of the classification accuracy of the tree species experimented with using original data and wood data were 0.9681 and 0.9595, respectively. The results of 16 of these comparison experiments showed that the W data had a higher classification accuracy than the original data. Among the 10 experiments with the highest accuracy in tree species classification, four experiments used wood data, and six experiments used original data.
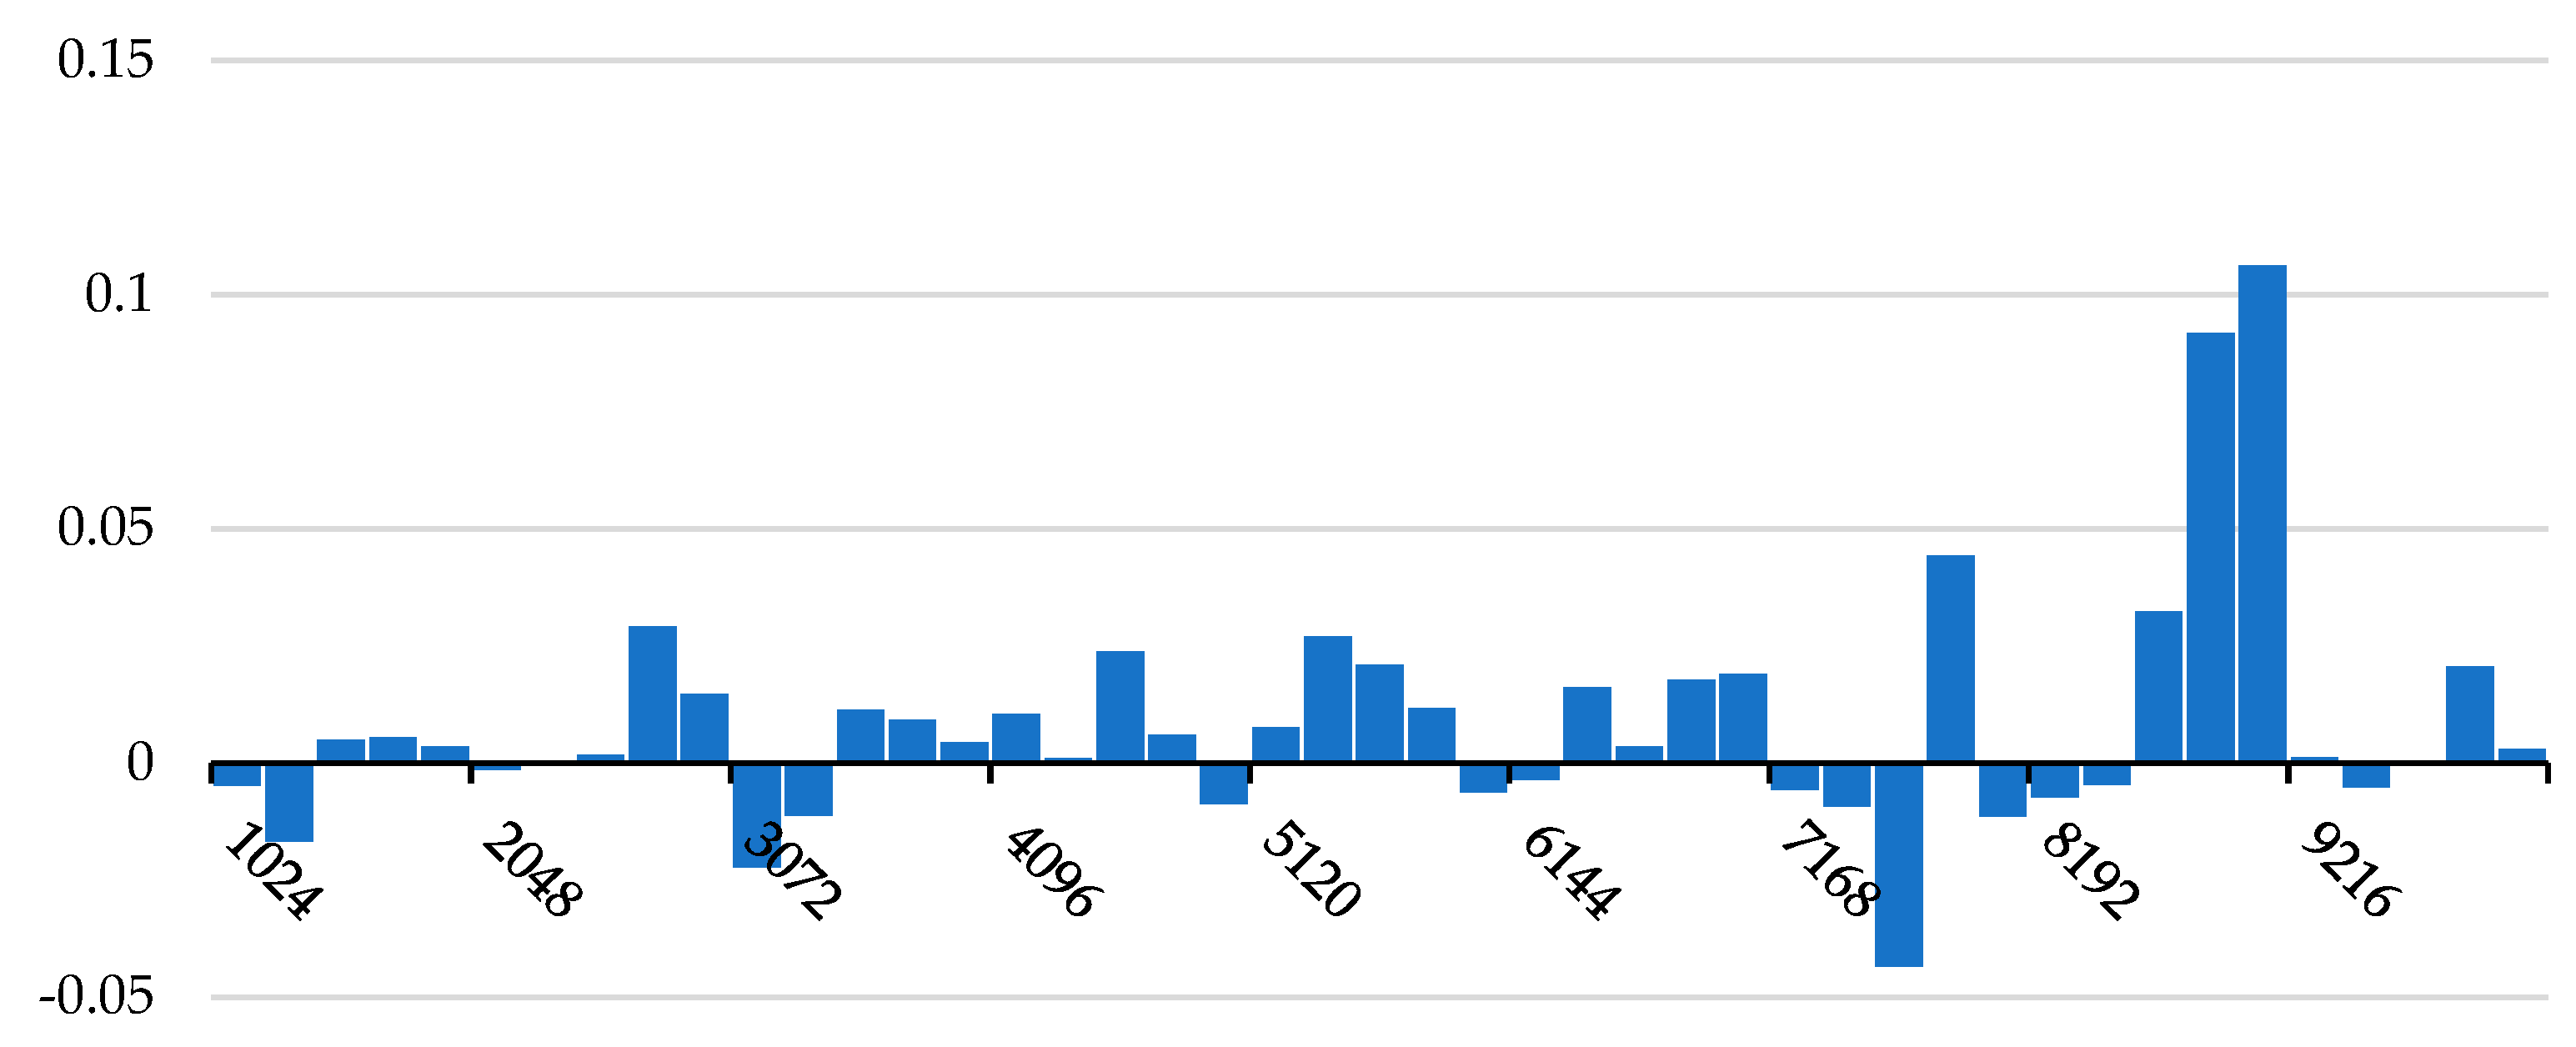
From the point of view of different sampling points (Figure 6), the accuracy values of the tree species classification for the experiments using original data did not vary much. When the number of individual tree sample points was 8192, the difference between the classification accuracy values of the experiments using original data and wood data was relatively large. Figure 6 shows the difference (original vs. wood) in the classification accuracy of tree species in the 45 sets of comparative experiments using original data and wood data. The maximum value of the difference was 0.1063, the absolute value of the difference was greater than 0.01 in 21 groups of experiments, and the absolute value of the difference was less than 0.005 in 15 groups of experiments.
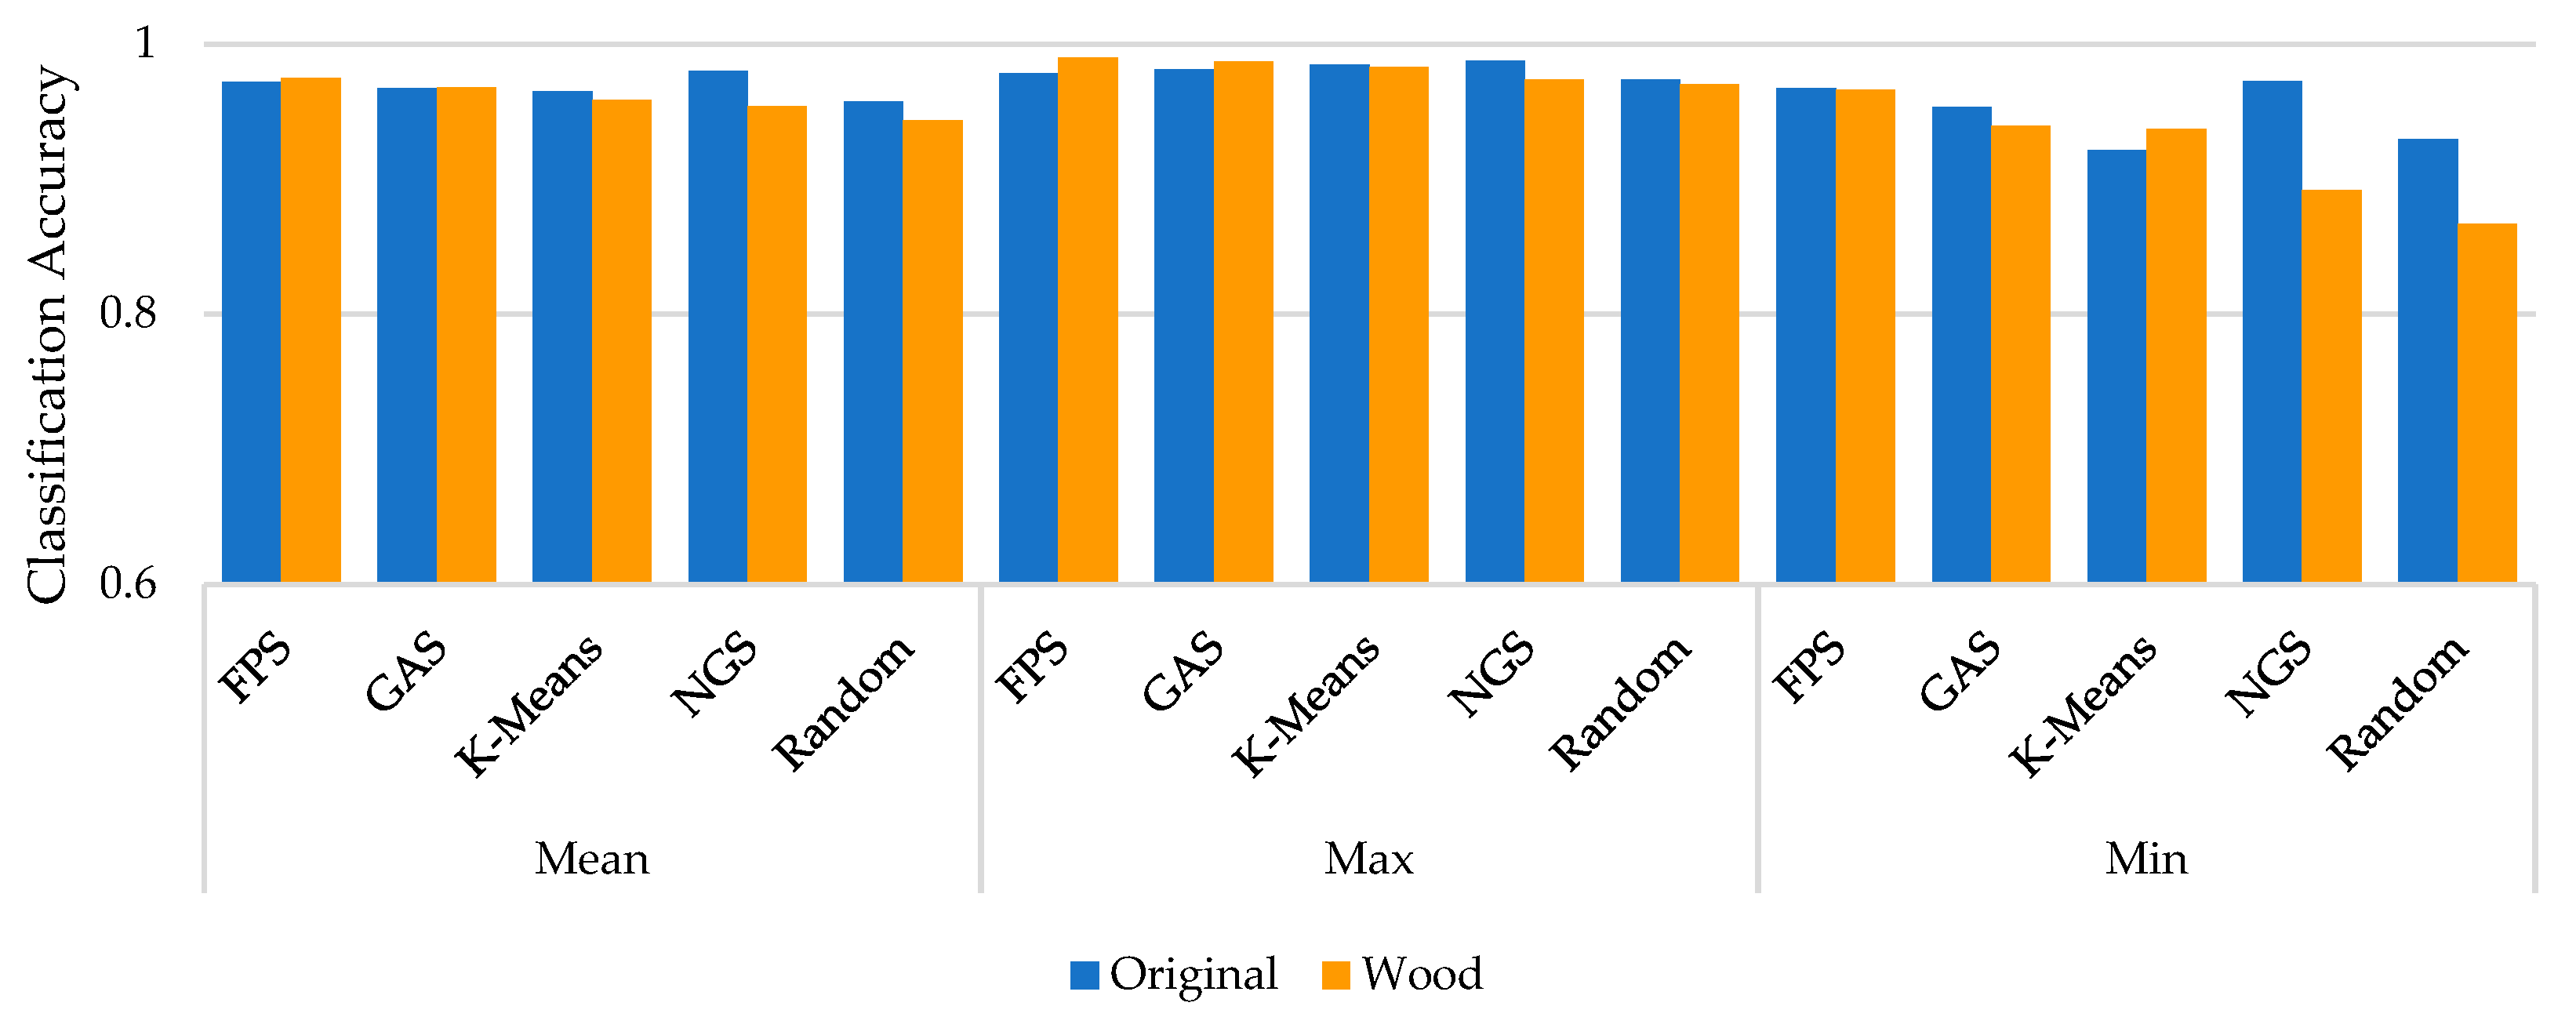
We also analyzed the effect of leaves in the point cloud data obtained by different downsampling methods on the classification accuracy (Figure 7). From the perspective of the mean value, the original and wood data showed the largest difference in the model classification accuracy (of 0.0262) after processing using the NGS method. The difference in the model classification accuracy after processing using the random sampling method was the second highest, and the difference in the accuracy of the experimental results after processing by the other three methods was less than 0.01. The maximum value in Figure 7 indicates the highest classification accuracy in each downsampling method. The maximum differences between the FPS and NGS methods were 0.0114 and 0.0142, respectively. The differences in the accuracy between the other three methods were less than 0.01. The minimum value in Figure 7 indicates the lowest classification accuracy of each downsampling method. The minimum classification result accuracy difference for FPS was the most stable. The differences in the classification accuracy between the GA and K-means methods before and after leaf separation were 0.0141 and 0. 0156, respectively. The differences in the minimum classification accuracy were larger for the NGS and random downsampling methods (0.0806 and 0.0627, respectively).
4.3. The Impact of Different Downsampling Algorithms on Accuracy
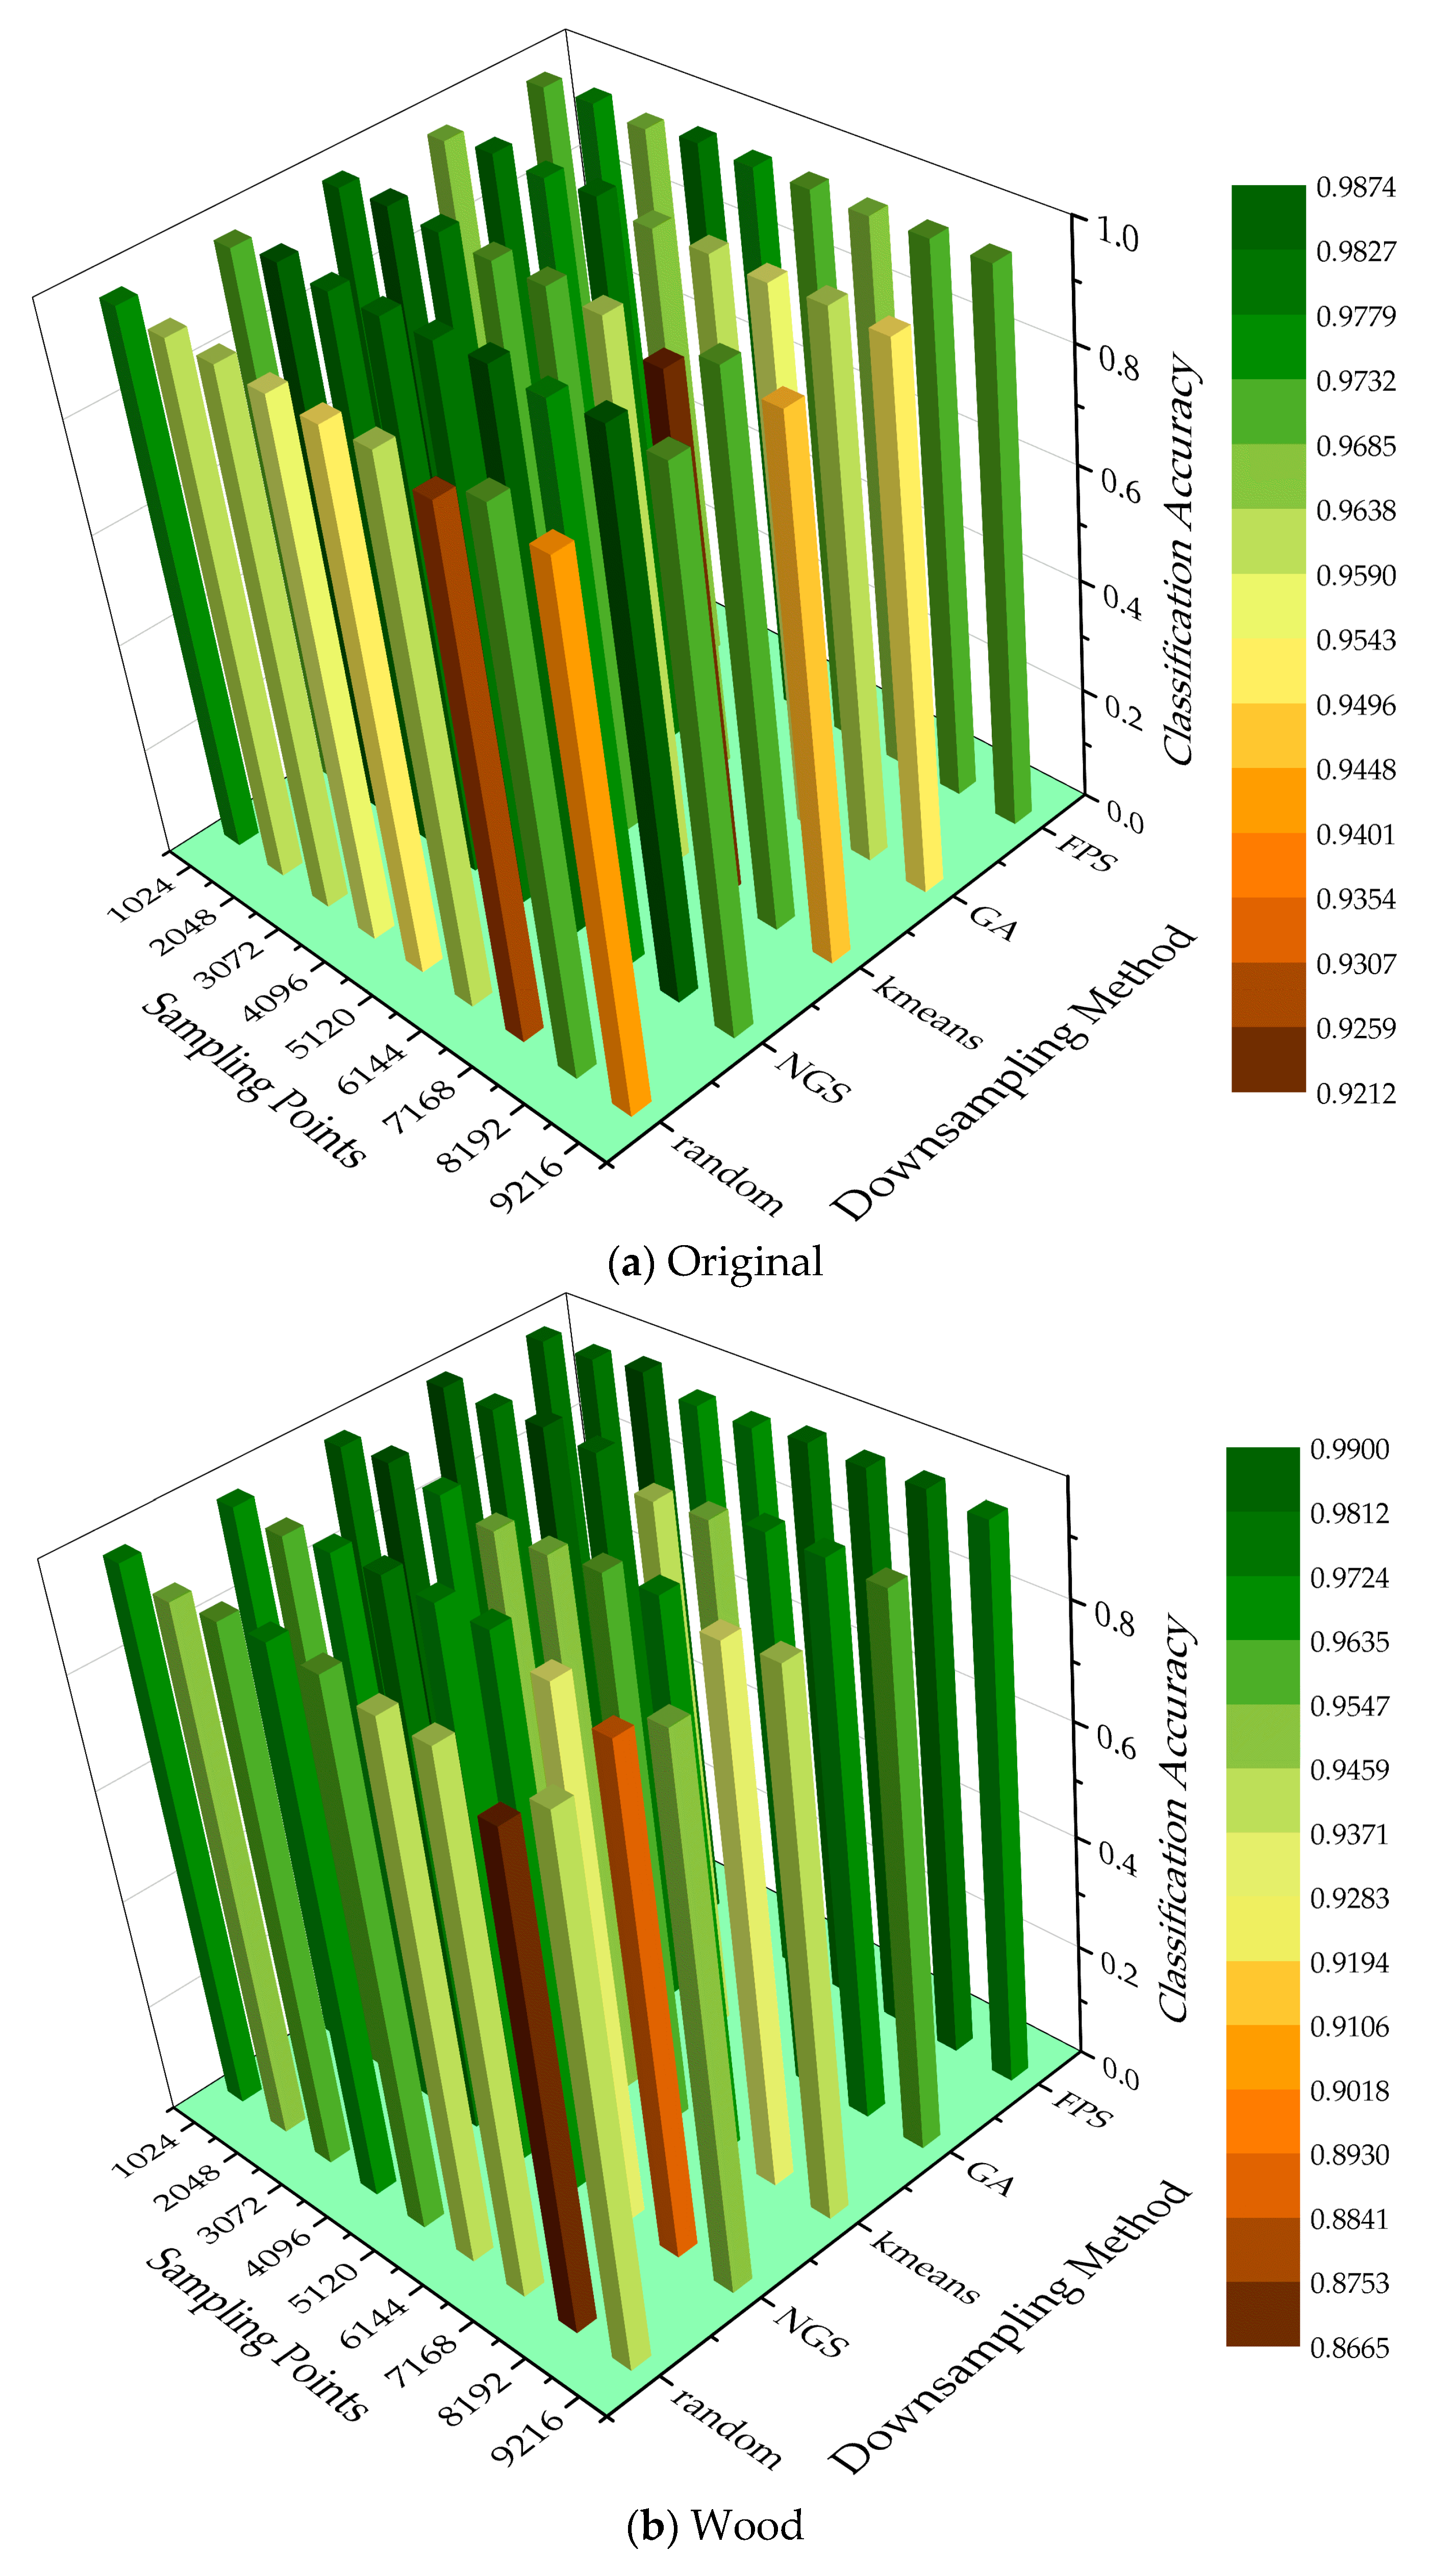
There were differences in the 3D representation of trees from point cloud data obtained using different downsampling methods. The 45 sets of comparison experiments in Section 4.2 were reanalyzed to find a downsampling method that best fit the BLS data. Figure 8 shows the accuracy of the point cloud data before and after leaf–wood separation for tree species classification after using different downsampling methods. For the point clouds without leaf–wood separation, the NGS method had a higher overall classification, and some experiments using random and K-means methods for tree species classification had a lower accuracy. Using wood point cloud data for tree species classification, the FPS method obtained an overall higher accuracy, while some experiments using random, K-means, and NGS methods for tree species classification had a lower accuracy.
4.4. The Effect of Sampling Points of Samples on Classification Accuracy
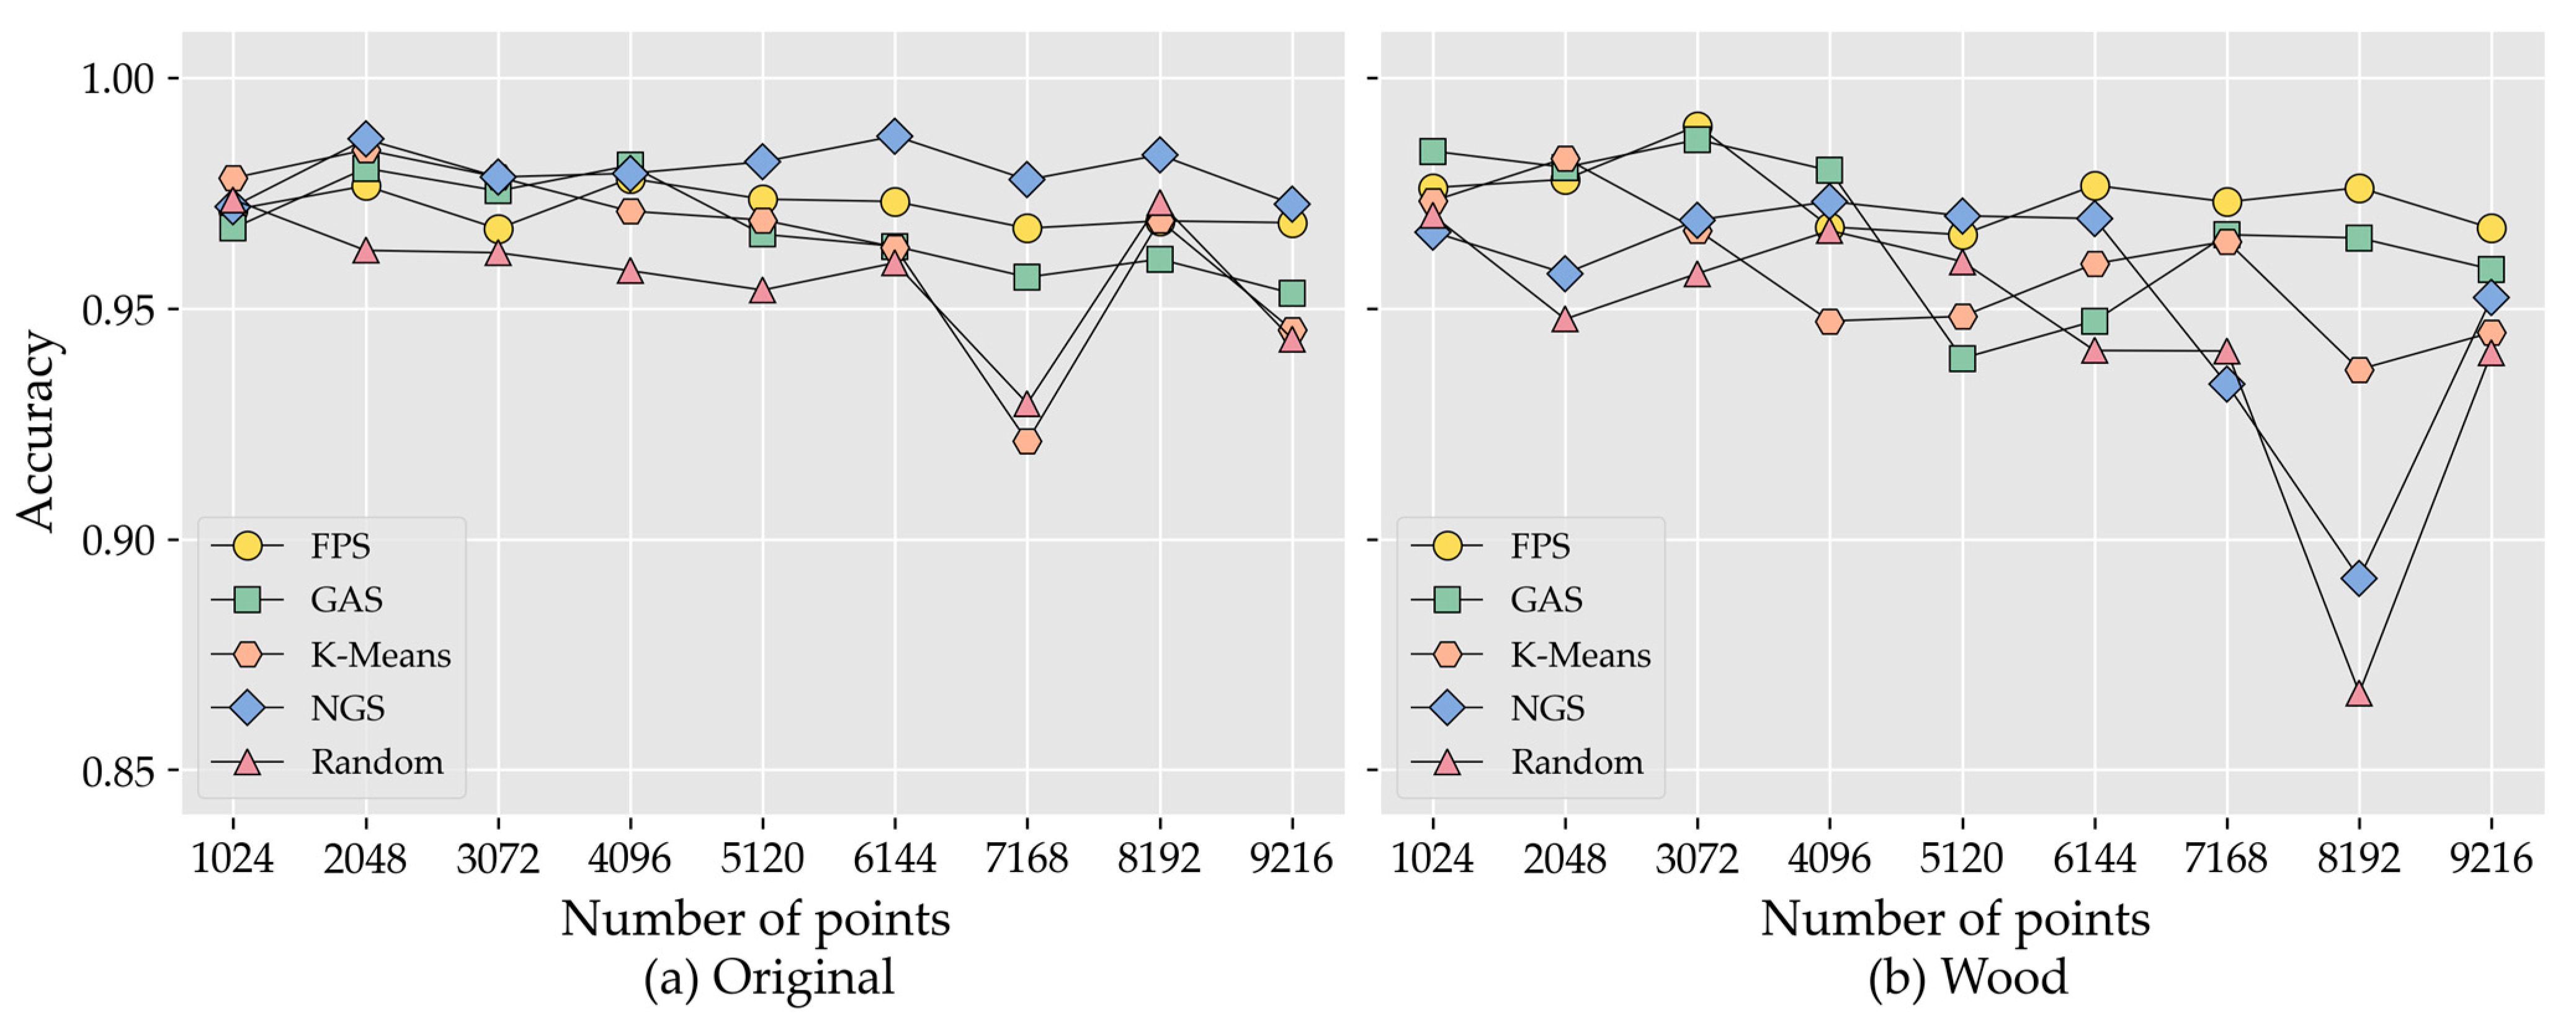
In point cloud deep learning models, the input of different sample points has different effects on the model accuracy. To explore the effect of sample points on the classification accuracy, the classification accuracy curves of each downsampling method at different points were plotted (Figure 9).
The increase in the number of sampling points did not significantly improve the classification accuracy of tree species. Instead, some experiments showed a decrease in the classification accuracy of tree species as the number of sampling points increased. Figure 9a shows that the NGS method had the highest overall accuracy and the second-highest FPS after the original data point cloud processing was downsampled. The classification accuracy of the GAS, random, and K-means methods reached the highest at 4096, 1024, and 2048 points, respectively, after which they all displayed a decreasing trend. All methods showed little variation inaccuracy in the range of sampling points less than or equal to 6144, with varying degrees of oscillation after 6144 points. The accuracy of all downsampling methods was the minimum at 7168 points, and the accuracy value increased at 8192 points, especially for the K-means and random methods, and then the accuracy of all methods started to decrease again. Figure 9b shows that, after downsampling the wood data point cloud, the overall trend of the FPS method was flat and least sensitive to the number of sampling points, and the classification accuracy of the method was the highest when the number of sampling points is 3072. The GAS method also showed a high classification accuracy when the number of samples was less than or equal to 4096. The K-means method starts to decrease in accuracy when the number of sampling points exceeded 2048. Both NGS and random methods had a lower overall accuracy and were sensitive to changes in the number of sampling points, showing a large degree of ups and downs.
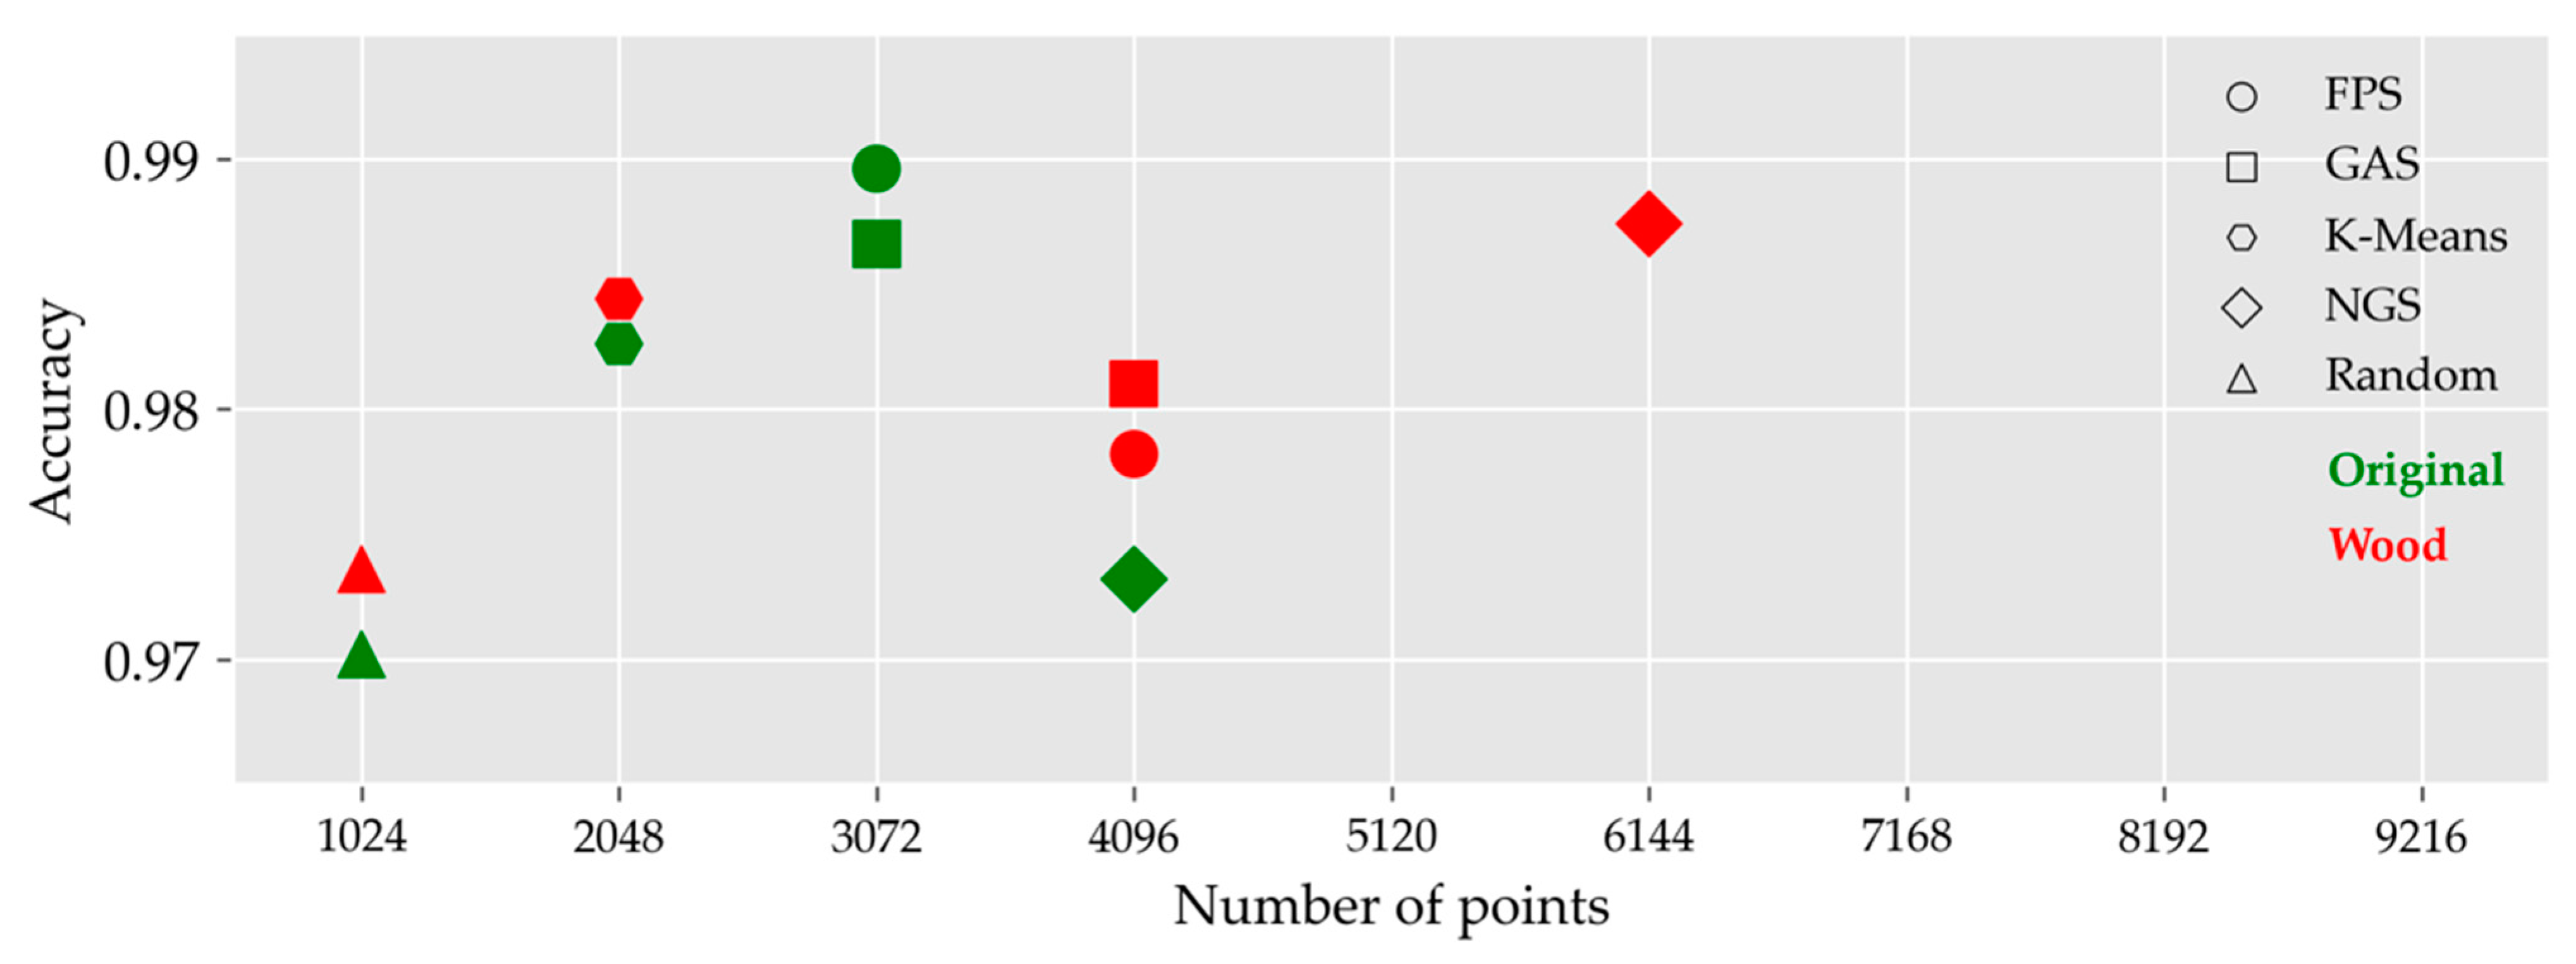
We recorded the experimental results with the highest accuracy after processing original data and wood data separately for each sampling method (Figure 10). The NGS method requires more sampling points to achieve the maximum classification accuracy, while the two downsampling methods, K-means and random, required few points.
4.5. Time Consumed by Fifferent Methods
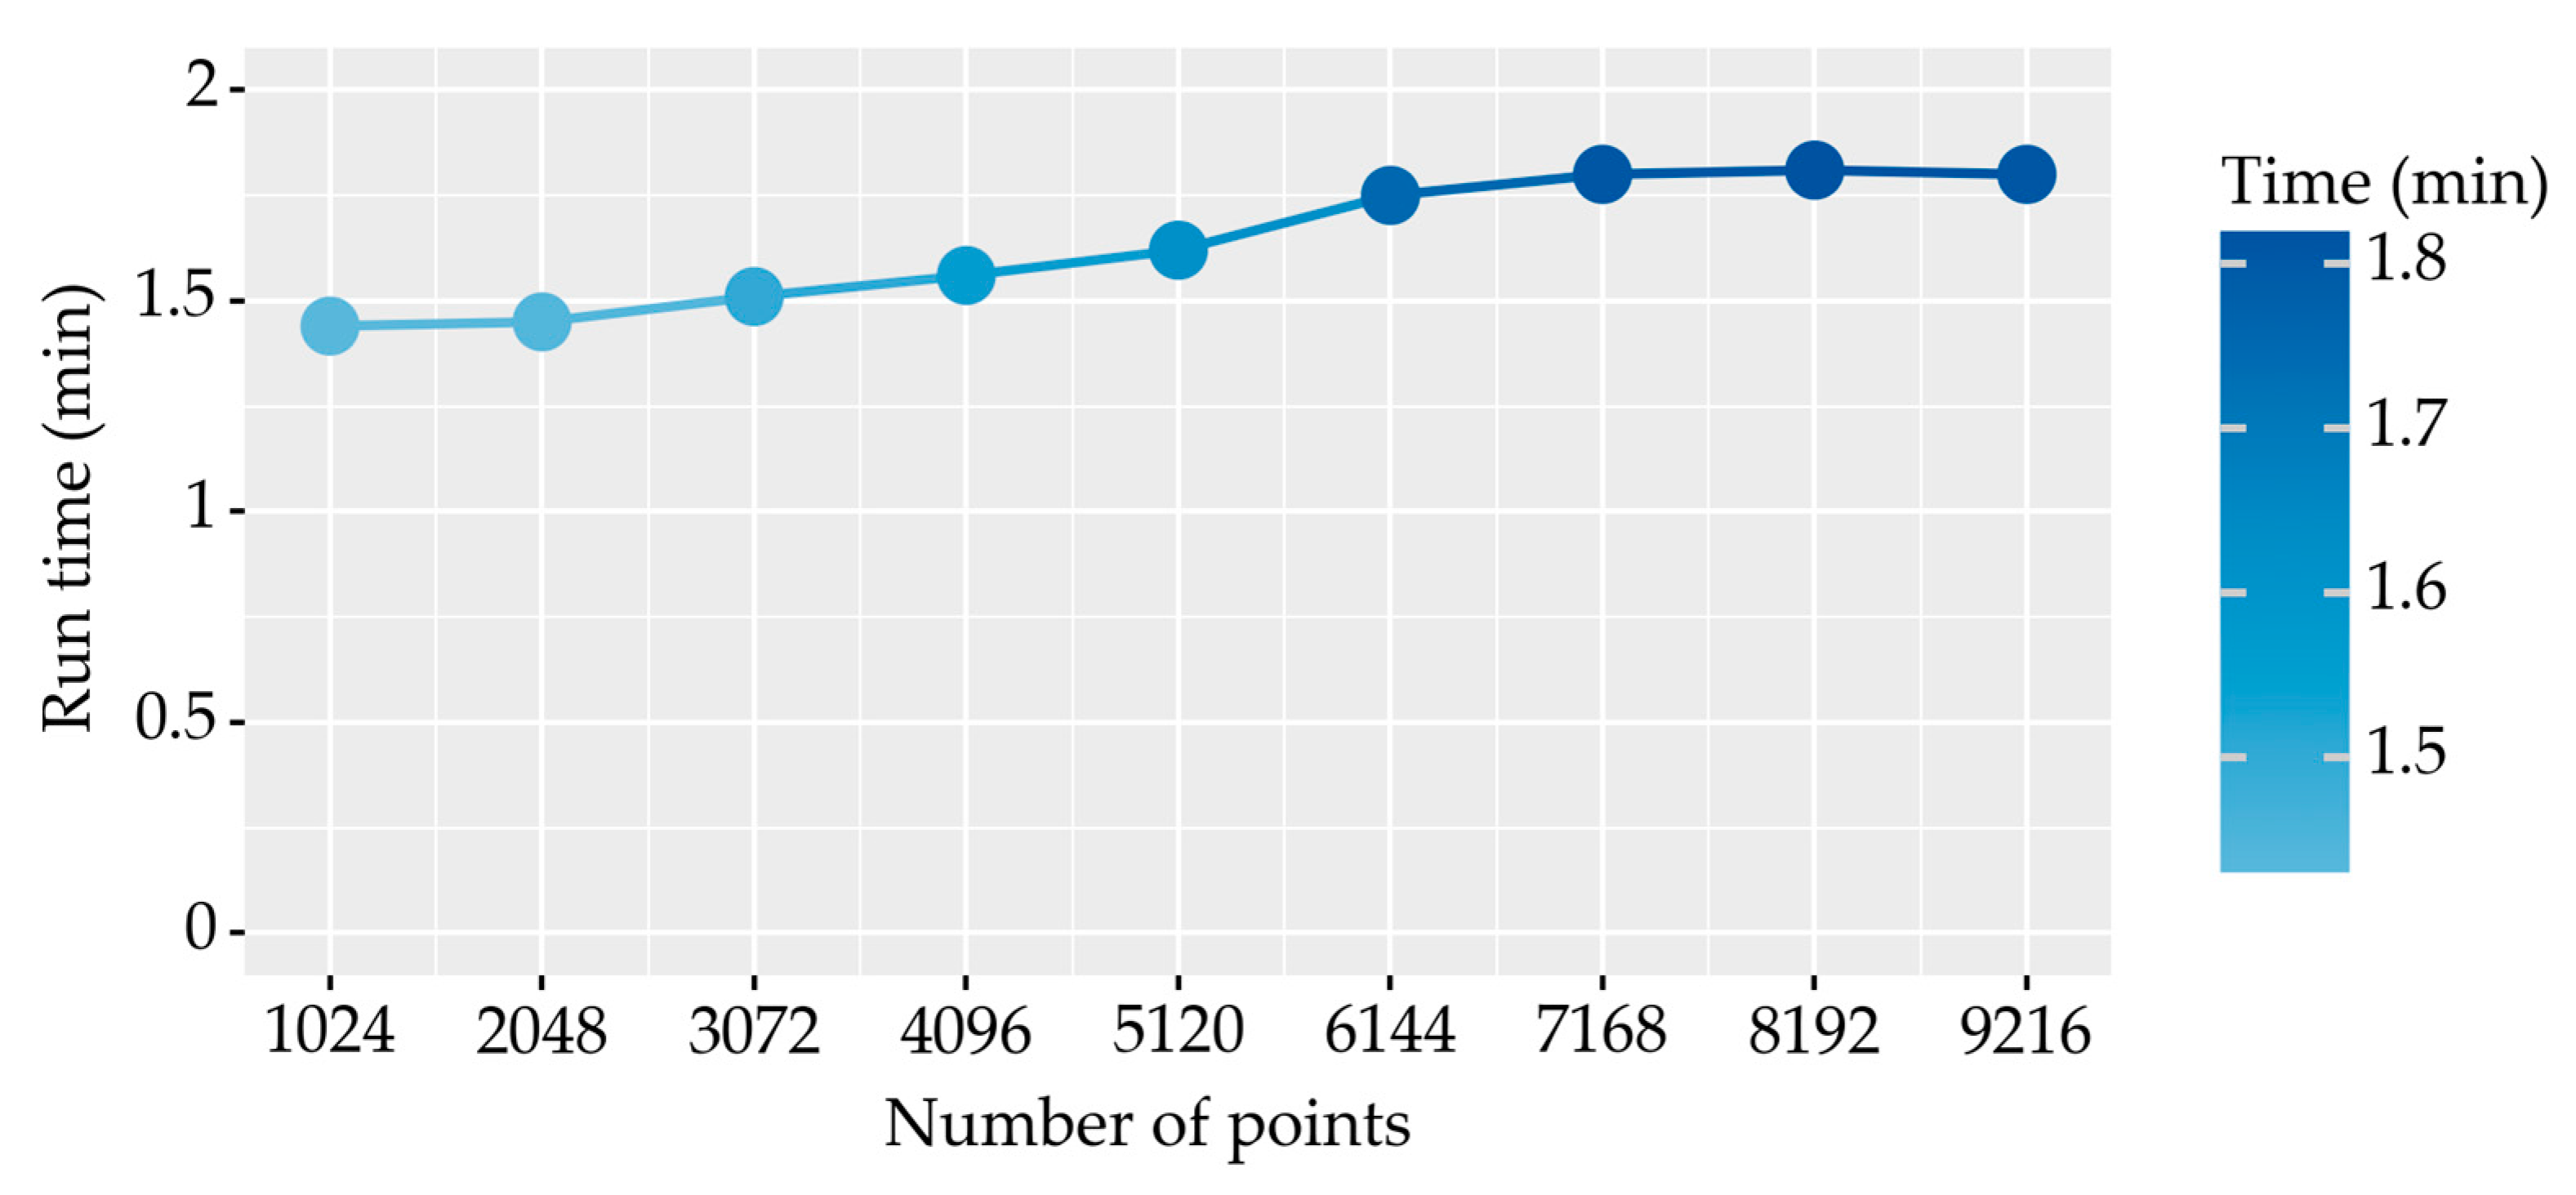
The time to train a point cloud deep learning model is related to the number of samples and the number of points per sample; the more points there are in an individual tree sample, the longer is the time required to train the model.
Taking the nine sets of experiments corresponding to the alpha2_wood_FPS data as an example, Figure 11 shows the average time required for each epoch to train the PointNet++ model with different numbers of samples of sampling points in this experiment. The training time of the deep learning model increased as the number of sample points increased. The model training time flattened once the number of sample points exceeded 6144 because of the decrease in the number of training samples.
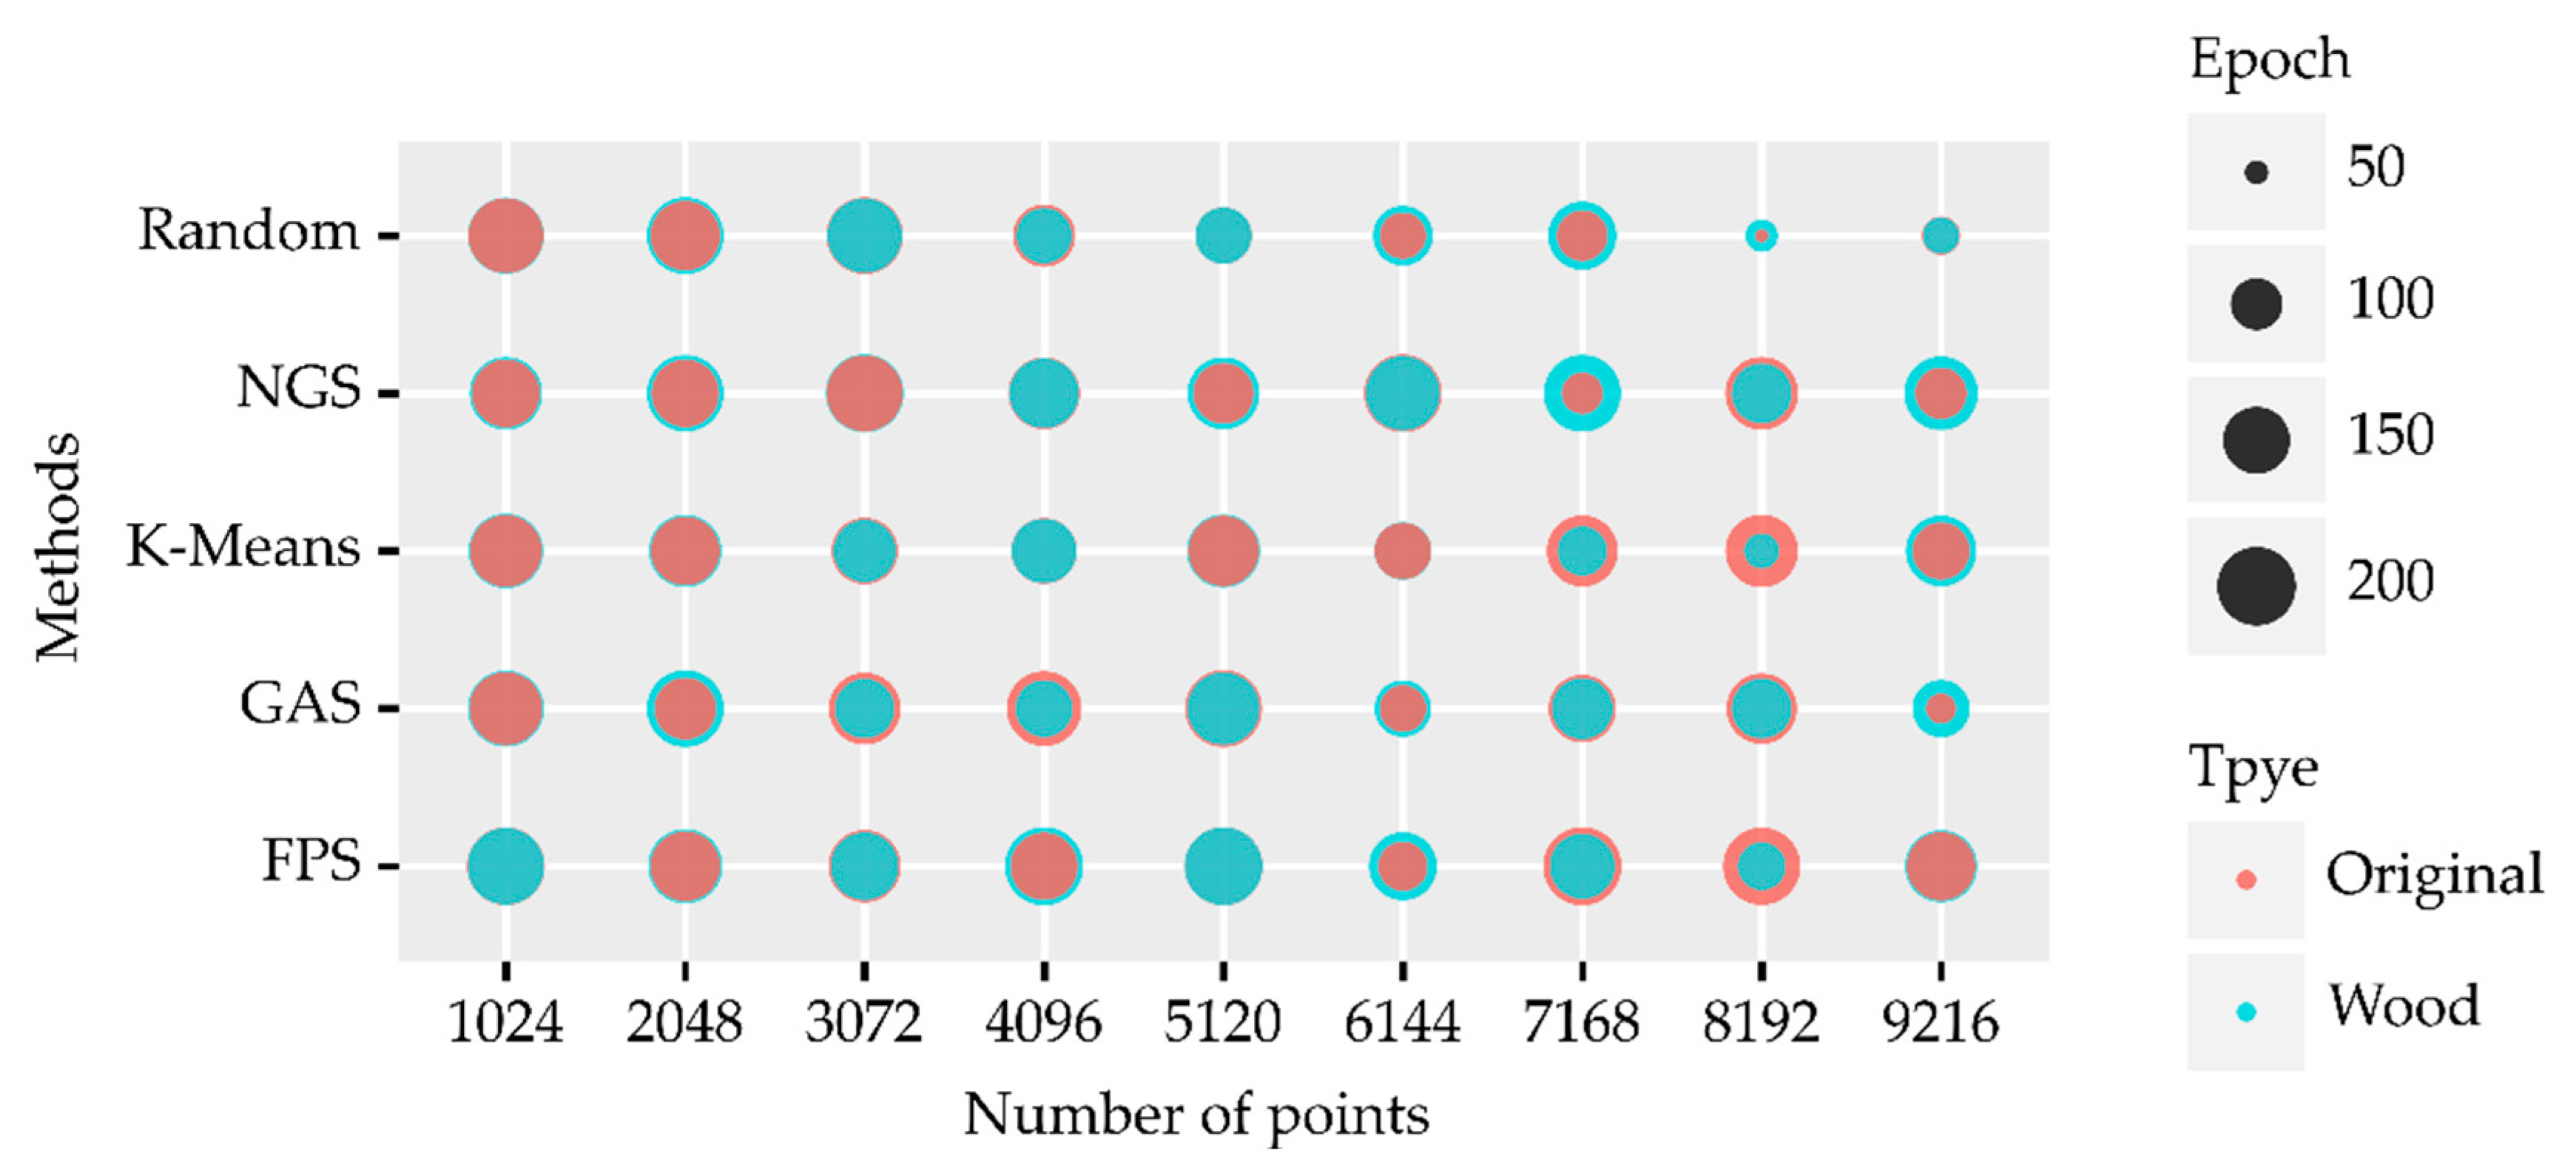
In our experiments, the number of epochs trained for each model was set to 200. The number of epochs in which different models converged to achieve the highest classification accuracy was not identical. Figure 12 shows the epoch values for each model trained to reach the highest classification accuracy in this experiment. When the number of sampling points N was 1024, 2048, 6144, and 9216, the epoch required for model convergence using the original data without leaf–wood separation processing was smaller. When N was less than 6144, the difference in the epoch required for convergence of the model trained using the data before and after leaf–wood separation was smaller.
4.6. Results of Tree Species Classification
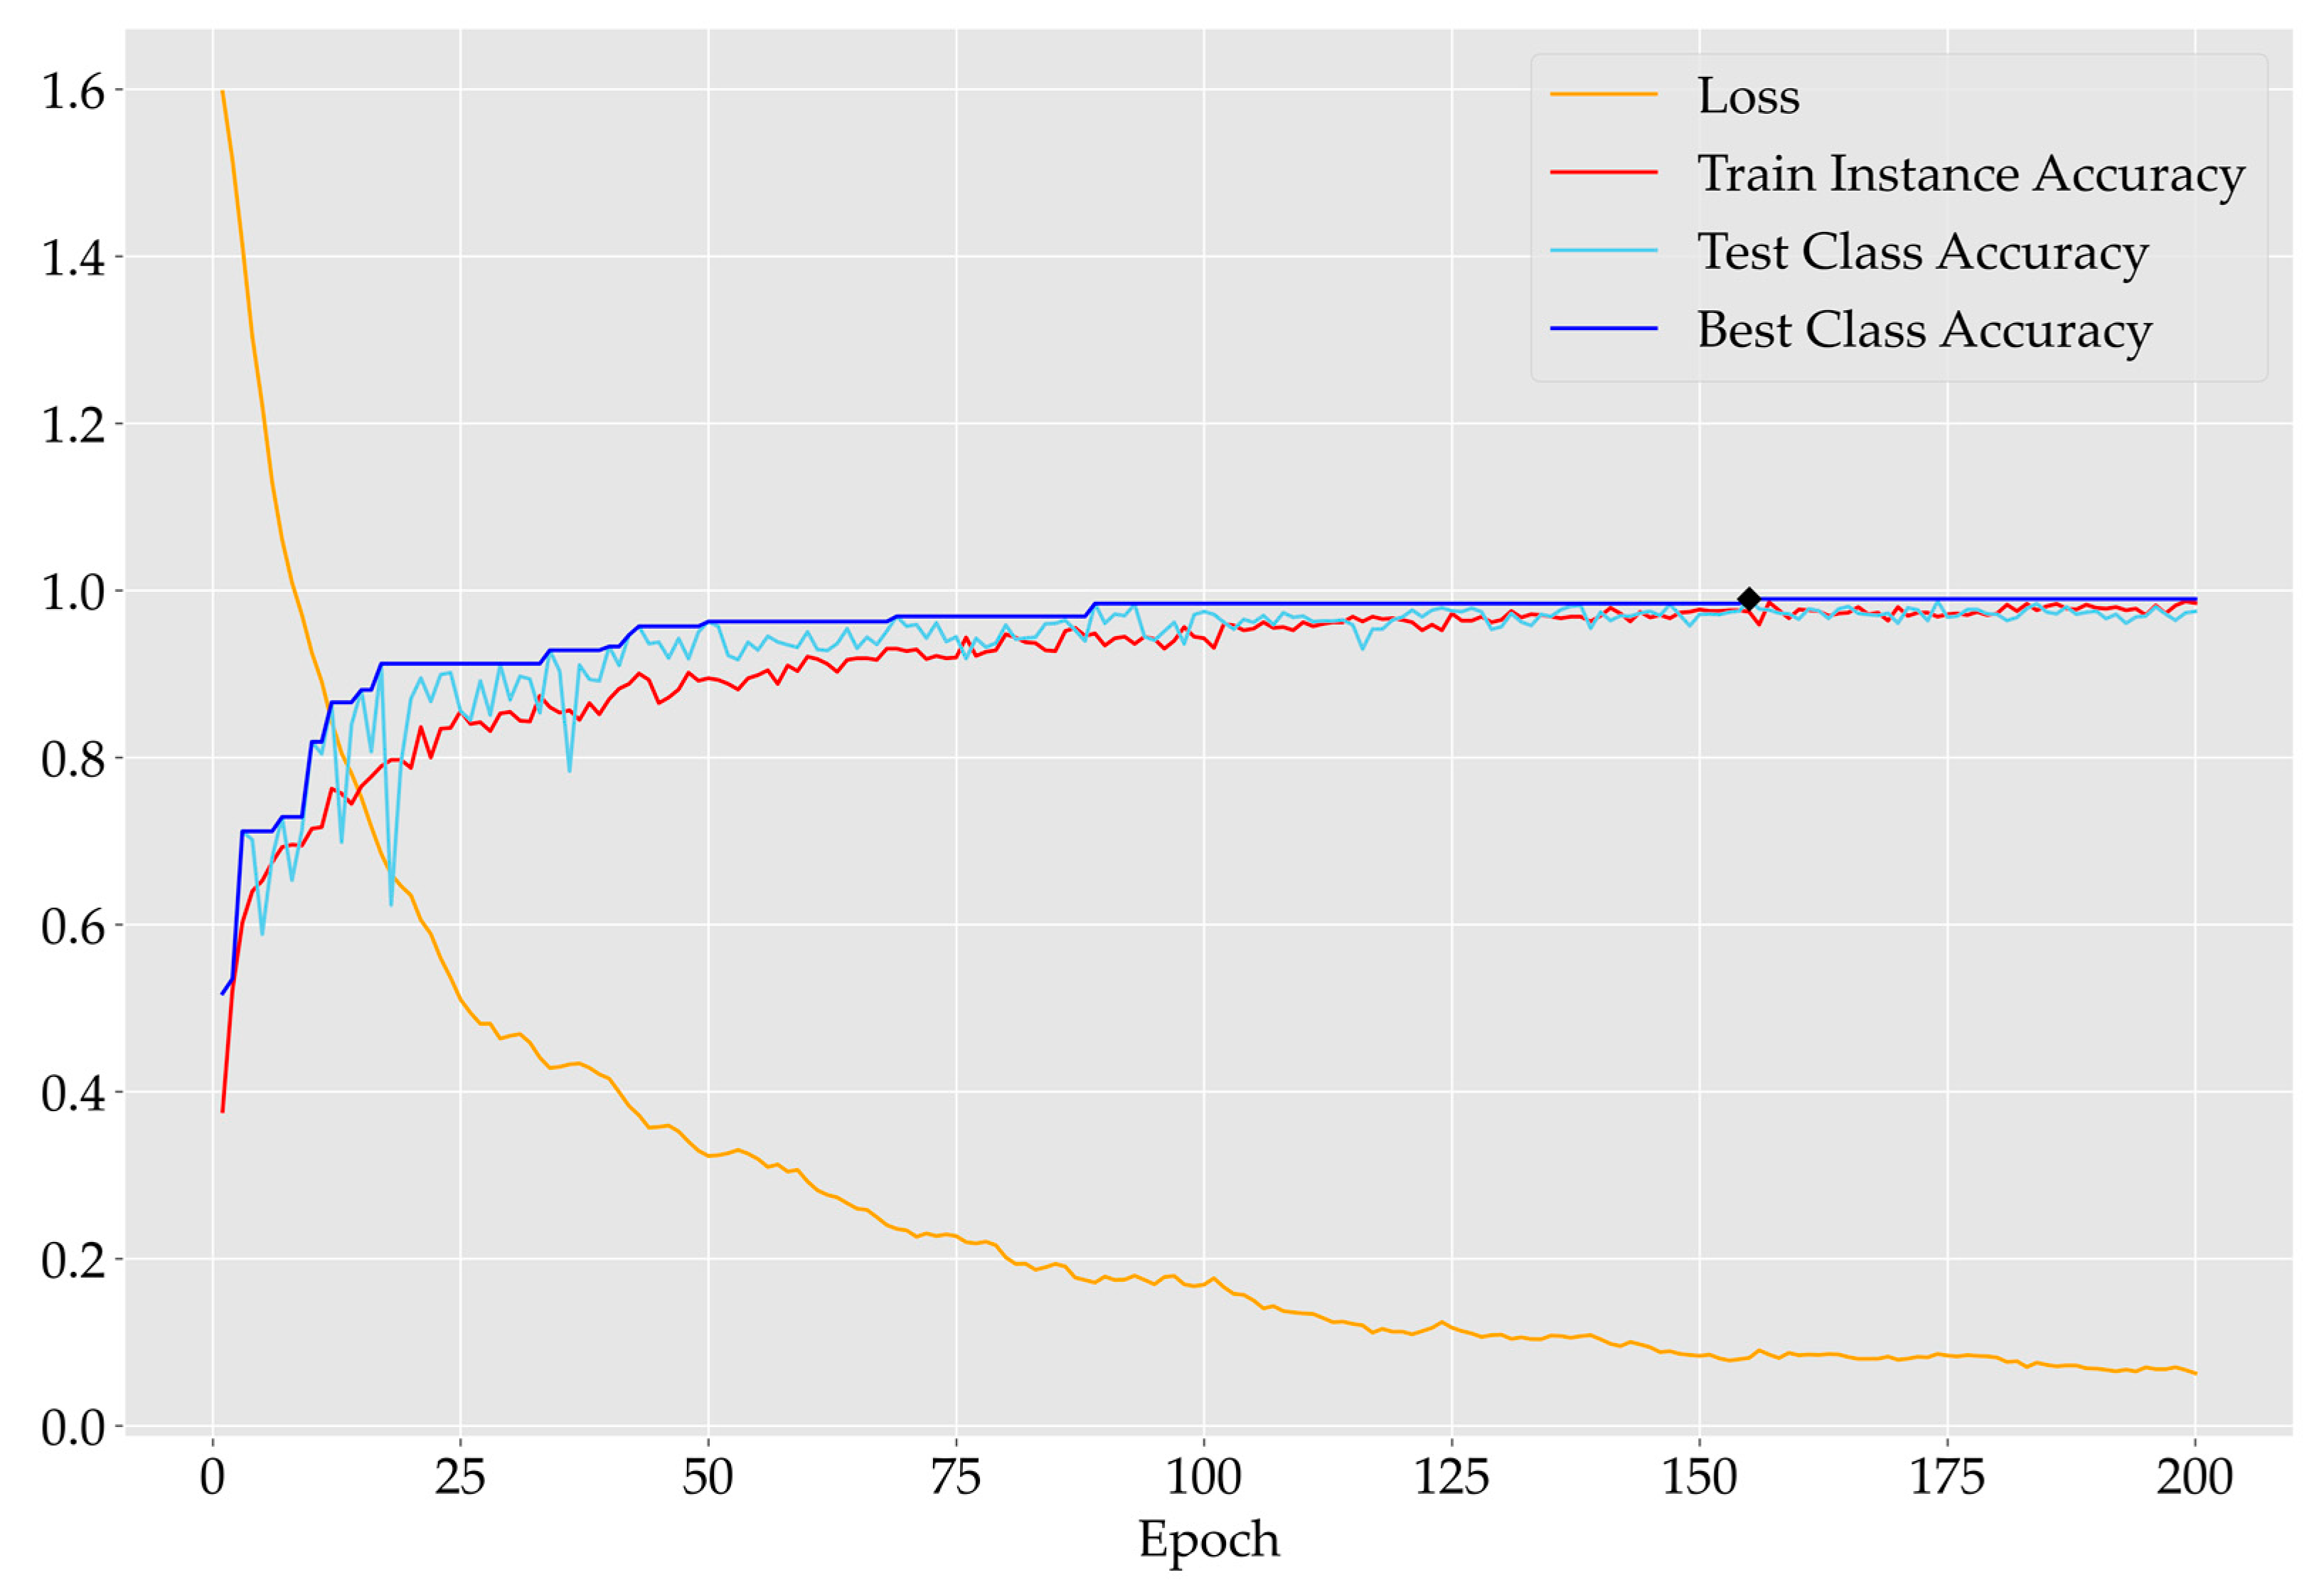
We analyzed the metrics associated with the set of experiments with the highest accuracy of classification of tree species among all the experiments. Among the 180 sets of experiments conducted in this study, the experiment with the highest classification accuracy used wood points normalized to the unit ball (alpha2), the number of points contained in an individual tree was 3072, and the downsampling method used was FPS. Figure 13 shows the change in relevant metrics during deep learning training. As the training epoch increased, the loss function decreased, and the training accuracy and the classification accuracy of the model improved. The rate of increase in training accuracy and classification accuracy tended to be smooth after epoch = 75. The classification accuracy reached the maximum at epoch = 155, i.e., the optimal hyperparameters of the model were obtained from training.
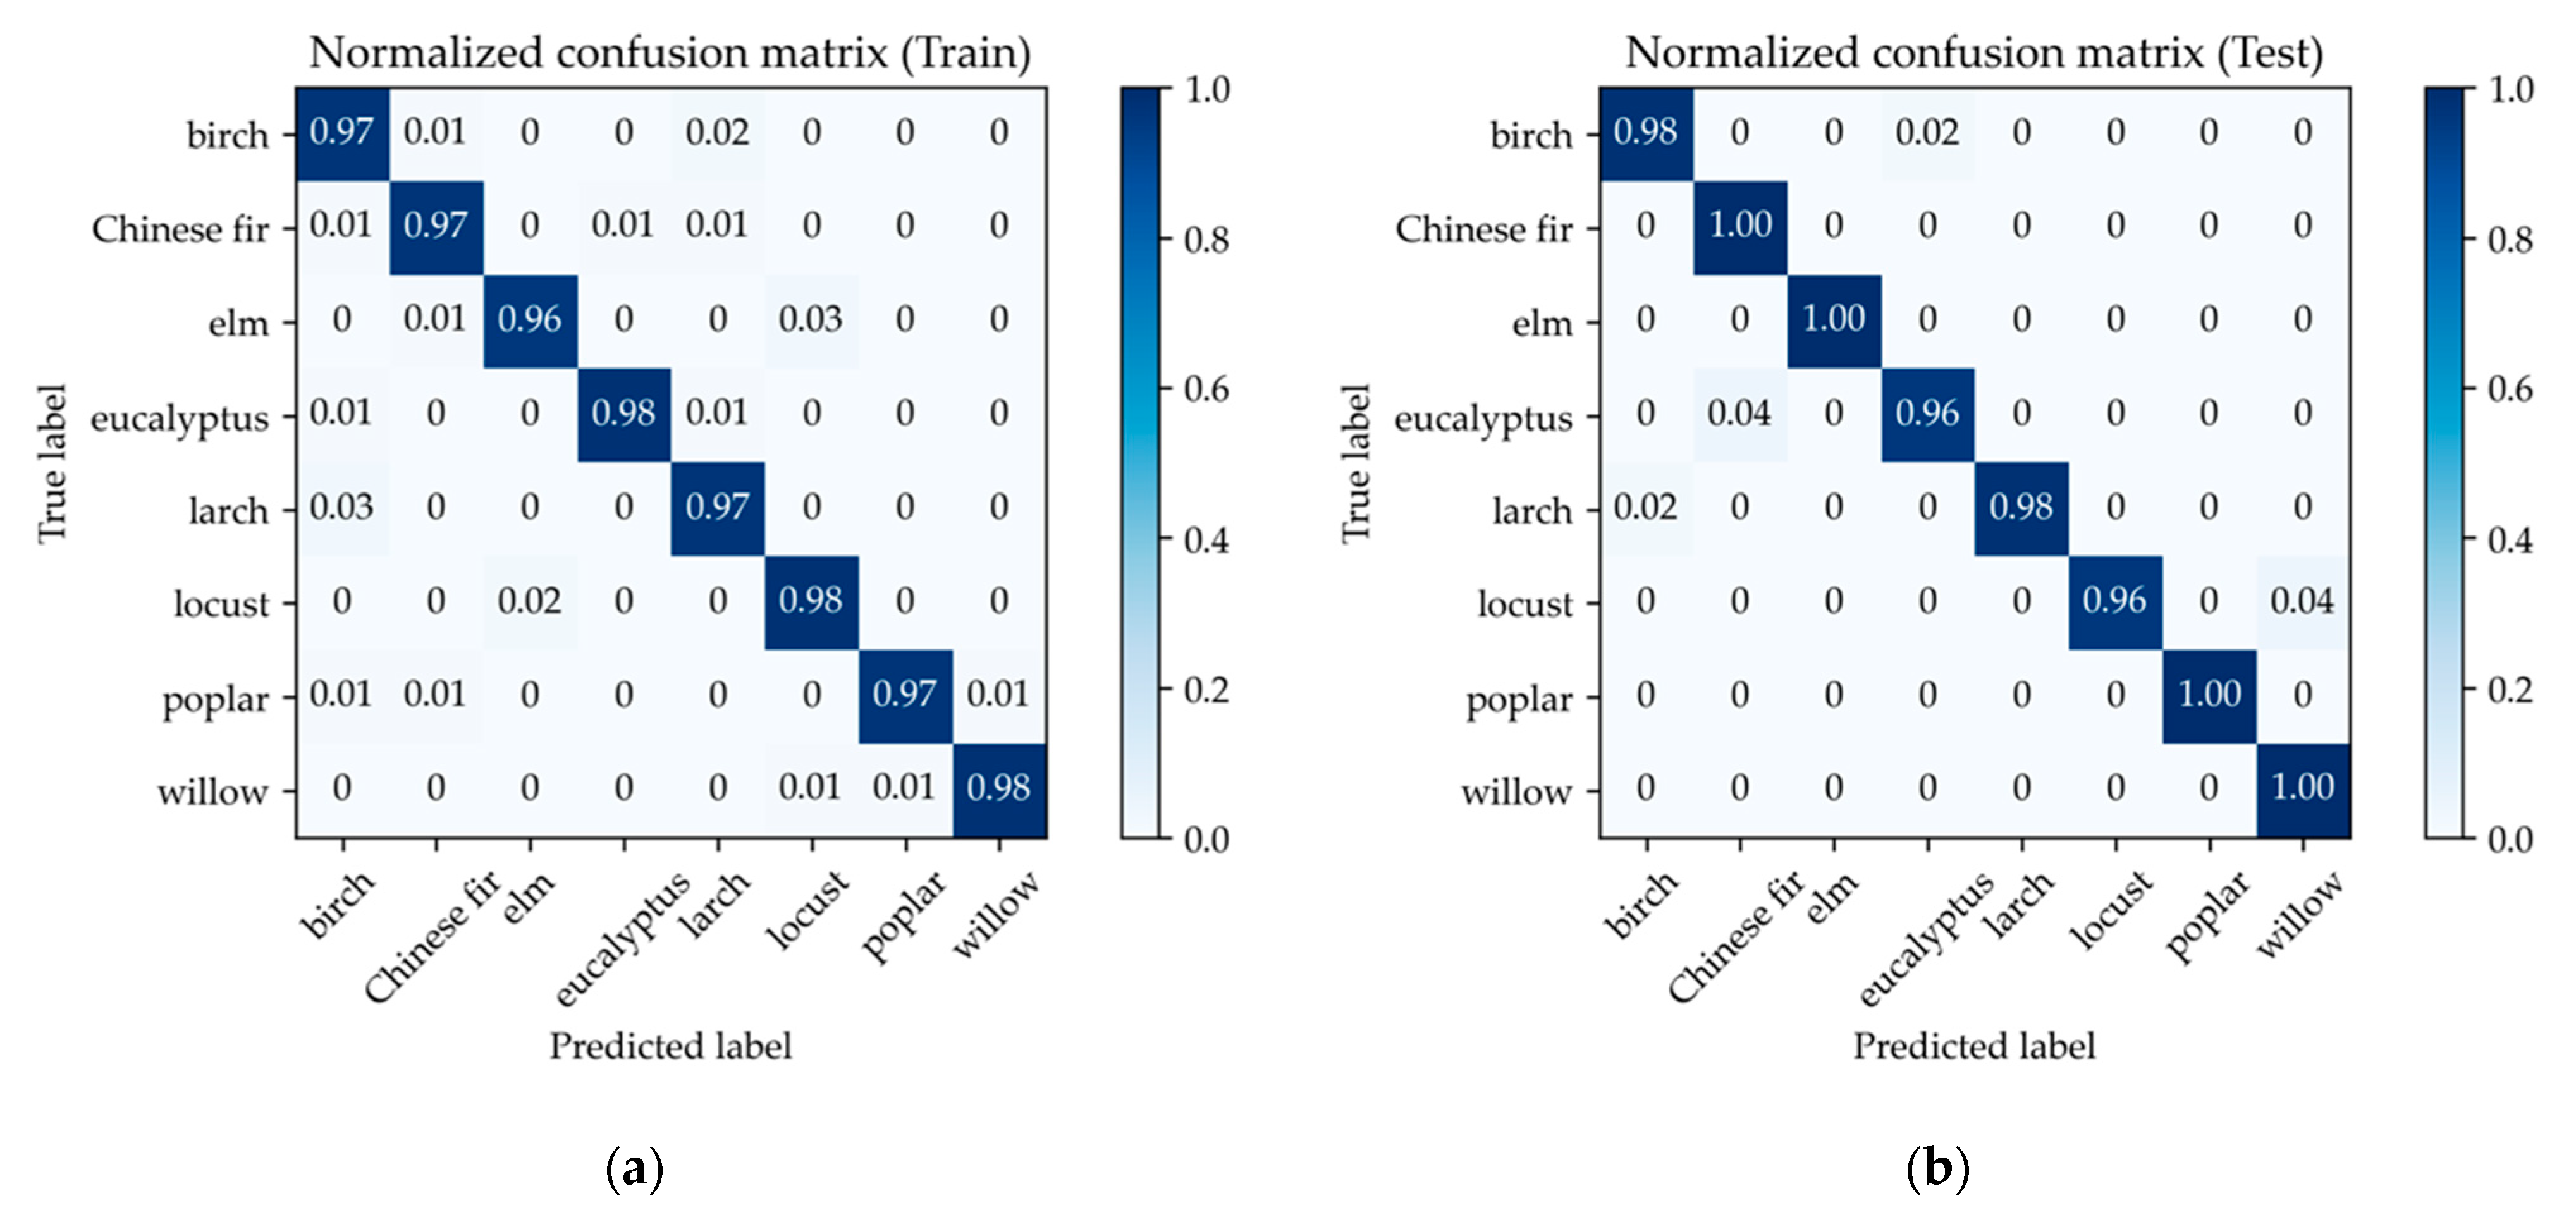
The confusion matrix (Figure 14) shows that the model could accurately classify all tree species. The prediction accuracy of all tree species was higher than 96%.
5. Discussion
This study shows that tree species classification and identification of individual tree point clouds can be performed well using the PointNet++ model. We compared two normalization methods, five downsampling methods, and nine different sample points. The leaf–wood separation process was also performed on the individual tree point cloud, and the final tree species classification accuracy reached over 95%. Although our experimental areas were far apart, we still obtained high classification accuracy as the number of tree species increased. This indicates that it is feasible to use an individual tree point cloud to identify and classify tree species.
Compared with other studies [21,22,23], this study achieved the highest classification accuracy, mainly because we used BLS point cloud data, while other studies mainly used ALS data. ALS cannot effectively detect the structure of trees below the canopy, and the 3D structures of trees are not portrayed finely enough. The study by Xi et al. [20] used TLS data, and the final classification accuracy was 95.8%. Using the same data processing method, we obtained a classification accuracy of 98.26%. This suggests that BLS can also retain enough 3D features of trees to support classification studies.
Our study indicates that the use of tree height features does not improve the classification accuracy of the model. In the field of computer vision, targets are classified using 3D point clouds by normalizing the coordinates of the point cloud to the unit sphere. Such processing allows the classification results to be independent of the geometric structure of the target object, which can lead to the loss of tree height information when classifying tree species. Considering the differences in tree height among different tree species in our study, we designed a normalization method (alpha1) that retains the tree height information but the tree classification accuracy was reduced. This indicates that, in the point-based deep learning approach, the features learned by the model reflect more local details between different objects.
The effect of leaf–wood separation on the classification accuracy of the model was not significant, although the experiments corresponding to the highest classification accuracy used wood data. The average difference in classification accuracy in the comparison experiments using the original and wood data was only 0.0158. Because of the great workload of testing and evaluating the results of leaf–wood separation, this study did not evaluate the results of leaf–wood separation algorithm. The study by Hamraz et al. [29] pointed out that leaves provide insignificant information when tree point clouds are being classified. Xi et al. [20] proposed leaf point clouds before tree species classification, considering that the variation in leaves with the seasons would limit the generality of the classification. According to Xi et al. [20], foliage has a significant effect on the 3D shape of trees with seasonal changes. This would limit the generality of the classification; hence, the leaf point cloud was excluded before the tree species classification. The same results were obtained in our study. However, in our experiments, excluding the leaf point cloud had little effect on the classification accuracy, probably because the same tree species were collected in the same season. Therefore, we suggest that related studies that use point clouds to classify tree species perform leaf–wood separation if LiDAR data of the same species are collected in different seasons; otherwise, they can be omitted.
In the experiments using the FPS method, the classification accuracy was generally higher, especially for wood data. Similar classification accuracy could be obtained using the FPS and NGS methods for original data processing when the number of sampling points was less than 5120. Previous studies [16,17] demonstrated that the FPS approach can reduce the computational complexity of the model without changing the overall semantic information of the object and without reducing the classification accuracy of the model too much. The same results were obtained in our study. The random downsampling method has the worst classification accuracy because the method does not effectively retain key points, which leads to the loss of key features. The grid-based sampling approach, a voxel-based method, is a common method for point cloud downsampling. This method ensures the presence of point clouds in each spatial grid, thus preserving a more complete global characterization of the object. The K-means method used in the study by Xi et al. [20] did not obtain the highest classification accuracy in this experiment. The key points retained by the K-means method do not fully express the 3D structural features of the object. FPS and NGS are the two recommended methods, and both can be chosen in the experiments with original data. However, the FPS method is a better choice in experiments with wood data.
Our study demonstrates that too many sampling points do not significantly improve the classification accuracy of the model and may even reduce the accuracy. As the number of sampling points increases, more time is needed to complete one training of the deep learning network. The classification accuracy of all downsampling methods corresponding to the experiments fluctuated except for that of the FPS method when the number of points in an individual tree sample was greater than 5120. When trained with the default hyperparameters of PointNet++ (MSG), the model further downsampled the input samples to 512 and 128 points. Therefore, even if more points were input, there was no significant improvement in the final accuracy of the model. Therefore, in the related research, rather than retaining an excessive number of points, it is important to choose a downsampling method that can fully retain the details of the point cloud. According to the experimental results of this study, considering both efficiency and accuracy, we suggest that the number of sampling points of the individual tree be kept in the 2048–5120 range.
There are still some shortcomings in the experiment that need to be improved upon in the future. This study acquired data without collecting point clouds of trees in different seasons, which limited our excavation and exploration of the necessity of leaf–wood separation. It is hoped that point cloud data of the same tree species in different seasons can be collected in the future to further explore the effect of leaf point clouds on the classification accuracy of the model. For the data used in this experiment, the age difference of the same tree species was small; hence, there was little difference in the morphology of the same tree species. We hope to identify and classify the point cloud data of the same tree species at different age stages in future studies, which may yield more unexpected results.
Overall, our experiment was successful. We verified all conjectures and gave more accurate data processing opinions for tree species classification studies using the PointNet++ method. PointNet++ is being used as a baseline method in an increasing number of studies. We also provided the settings of the model hyperparameters. The results of this study are detailed and valuable enough to act as a reference for research related to tree species classification using point cloud deep learning.
6. Conclusions
Point cloud deep learning methods can classify tree species with a high degree of accuracy. It is important to improve data processing methods to further improve the classification accuracy. By normalizing the point cloud to the unit sphere, the deep learning model can extract local features of trees more effectively. Tree height information is not important when using individual tree point clouds for tree species identification. Leaf point clouds have less effect on classification accuracy when the collected sample data are not affected by seasonal factors. Using both FPS and NGS downsampling methods, the detailed features of trees can be effectively preserved, which is beneficial for deep learning to extract features. The highest classification accuracy can be obtained when the number of sampling points is in the range of 2048–5120. The quality of the sample data is an important element in the accuracy of deep learning. Our results provide a series of suggestions for sample data processing methods that can improve classification accuracy and provide technical support for the further construction of a complete BLS point cloud tree species classification system. These suggestions have important practical significance and reference value for scholars to conduct related research in the future. In addition, the related recommendations and methods can be extended to the use of other types of point cloud data.
Author Contributions
Conceptualization, X.T.; methodology, B.L.; software, B.L. and S.C.; validation, B.L.; formal analysis, B.L.; investigation, B.L. and S.C.; data curation, B.L.; writing—original draft preparation, B.L.; writing—review and editing, X.T.; visualization, B.L.; supervision, H.H.; project administration, X.T.; funding acquisition, X.T. and H.H. All authors have read and agreed to the published version of the manuscript.
Funding
This research was funded by the National Natural Science Foundation of China (41871279, 41930111, and 42130111), the Fundamental Research Funds of CAF (CAFYBB2021SY006), and the National Science and Technology Major Project of China’s High Resolution Earth Observation System (21-Y20B01-9001-19/22).
Data Availability Statement
Not applicable.
Acknowledgments
We are grateful to Chao Ma, Yong Su, and Qiuyi Ai for their help in field data collection. We thank Yuanshuo Hao and Ying Quan for their suggestions and help in the revision of the manuscript.
Conflicts of Interest
The authors declare no conflict of interest.
References
- Pu, R. Mapping Tree Species Using Advanced Remote Sensing Technologies: A State-of-the-Art Review and Perspective. J. Remote Sens. 2021, 2021, 9812624. [Google Scholar] [CrossRef]
- Zhao, D.; Pang, Y.; Liu, L.; Li, Z. Individual Tree Classification Using Airborne LiDAR and Hyperspectral Data in a Natural Mixed Forest of Northeast China. Forests 2020, 11, 303. [Google Scholar] [CrossRef] [Green Version]
- Su, Y.; Guo, Q.; Jin, S.; Guan, H.; Sun, X.; Ma, Q.; Hu, T.; Wang, R.; Li, Y. The Development and Evaluation of a Backpack LiDAR System for Accurate and Efficient Forest Inventory. IEEE Geosci. Remote Sens. Lett. 2021, 18, 1660–1664. [Google Scholar] [CrossRef]
- Åkerblom, M.; Raumonen, P.; Mäkipää, R.; Kaasalainen, M. Automatic Tree species Recognition with Quantitative Structure Models. Remote Sens. Environ. 2017, 191, 1–12. [Google Scholar] [CrossRef]
- Ba, A.; Laslier, M.; Dufour, S.; Hubert-Moy, L. Riparian Trees Genera Identification Based on Leaf-on/Leaf-off Airborne Laser Scanner Data and Machine Learning Classifiers in Northern France. Int. J. Remote Sens. 2019, 41, 1645–1667. [Google Scholar] [CrossRef]
- Lin, Y.; Herold, M. Tree Species Classification Based on Explicit Tree Structure Feature Parameters Derived from Static Terrestrial Laser Scanning Data. Agric. For. Meteorol. 2016, 216, 105–114. [Google Scholar] [CrossRef]
- Yang, G.; Zhao, Y.; Li, B.; Ma, Y.; Li, R.; Jing, J.; Dian, Y. Tree Species Classification by Employing Multiple Features Acquired from Integrated Sensors. J. Sens. 2019, 2019, 3247946. [Google Scholar] [CrossRef]
- Budei, B.C.; St-Onge, B.; Hopkinson, C.; Audet, F.-A. Identifying the genus or species of individual trees using a three-wavelength airborne lidar system. Remote Sens. Environ. 2018, 204, 632–647. [Google Scholar] [CrossRef]
- Liu, L.; Coops, N.C.; Aven, N.W.; Pang, Y. Mapping urban tree species using integrated airborne hyperspectral and LiDAR remote sensing data. Remote Sens. Environ. 2017, 200, 170–182. [Google Scholar] [CrossRef]
- Yu, X.; Hyyppä, J.; Litkey, P.; Kaartinen, H.; Vastaranta, M.; Holopainen, M. Single-Sensor Solution to Tree Species Classification Using Multispectral Airborne Laser Scanning. Remote Sens. 2017, 9, 108. [Google Scholar] [CrossRef] [Green Version]
- Guan, H.; Yu, Y.; Ji, Z.; Li, J.; Zhang, Q. Deep learning-based tree classification using mobile LiDAR data. Remote Sens. Lett. 2015, 6, 864–873. [Google Scholar] [CrossRef]
- Guo, Y.; Wang, H.; Hu, Q.; Liu, H.; Liu, L.; Bennamoun, M. Deep Learning for 3D Point Clouds: A Survey. IEEE Trans. Pattern. Anal. Mach. Intell. 2021, 43, 4338–4364. [Google Scholar] [CrossRef] [PubMed]
- Li, J.; Hu, B.; Noland, T.L. Classification of tree species based on structural features derived from high density LiDAR data. Agric. For. Meteorol. 2013, 171–172, 104–114. [Google Scholar] [CrossRef]
- Zou, X.; Cheng, M.; Wang, C.; Xia, Y.; Li, J. Tree Classification in Complex Forest Point Clouds Based on Deep Learning. IEEE Geosci. Remote Sens. Lett. 2017, 14, 2360–2364. [Google Scholar] [CrossRef]
- Sun, C.; Huang, C.; Zhang, H.; Chen, B.; An, F.; Wang, L.; Yun, T. Individual Tree Crown Segmentation and Crown Width Extraction from a Heightmap Derived From Aerial Laser Scanning Data Using a Deep Learning Framework. Front. Plant Sci. 2022, 13, 914974. [Google Scholar] [CrossRef] [PubMed]
- Qi, C.R.; Su, H.; Mo, K.; Guibas, L.J. Pointnet: Deep learning on point sets for 3d classification and segmentation. In Proceedings of the IEEE conference on computer vision and pattern recognition, Honolulu, HI, USA, 21–26 July 2017; pp. 652–660. [Google Scholar] [CrossRef] [Green Version]
- Qi, C.R.; Yi, L.; Su, H.; Guibas, L.J. Pointnet++: Deep hierarchical feature learning on point sets in a metric space. Adv. Neural Inf. Process. Syst. 2017, 30, 5105–5114. [Google Scholar]
- Briechle, S.; Krzystek, P.; Vosselman, G. Semantic Labeling of Als Point Clouds for Tree Species Mapping Using the Deep Neural Network Pointnet++. Int. Arch. Photogramm. Remote Sens. Spat. Inf. Sci. 2019, XLII-2/W13, 951–955. [Google Scholar] [CrossRef] [Green Version]
- Briechle, S.; Krzystek, P.; Vosselman, G. Classification of Tree Species and Standing Dead Trees by Fusing Uav-Based Lidar Data and Multispectral Imagery in the 3d Deep Neural Network Pointnet++. ISPRS Ann. Photogramm. Remote Sens. Spat. Inf. Sci. 2020, V-2-2020, 203–210. [Google Scholar] [CrossRef]
- Xi, Z.; Hopkinson, C.; Rood, S.B.; Peddle, D.R. See the forest and the trees: Effective machine and deep learning algorithms for wood filtering and tree species classification from terrestrial laser scanning. ISPRS J. Photogramm. Remote Sens. 2020, 168, 1–16. [Google Scholar] [CrossRef]
- Liu, M.; Han, Z.; Chen, Y.; Liu, Z.; Han, Y. Tree species classification of LiDAR data based on 3D deep learning. Measurement 2021, 177, 109301. [Google Scholar] [CrossRef]
- Seidel, D.; Annighofer, P.; Thielman, A.; Seifert, Q.E.; Thauer, J.H.; Glatthorn, J.; Ehbrecht, M.; Kneib, T.; Ammer, C. Predicting Tree Species From 3D Laser Scanning Point Clouds Using Deep Learning. Front. Plant. Sci. 2021, 12, 635440. [Google Scholar] [CrossRef] [PubMed]
- Chen, J.; Chen, Y.; Liu, Z. Classification of Typical Tree Species in Laser Point Cloud Based on Deep Learning. Remote Sens. 2021, 13, 4750. [Google Scholar] [CrossRef]
- Lv, Y.; Zhang, Y.; Dong, S.; Yang, L.; Zhang, Z.; Li, Z.; Hu, S. A Convex Hull-Based Feature Descriptor for Learning Tree Species Classification from ALS Point Clouds. IEEE Geosci. Remote Sens. Lett. 2022, 19, 1–5. [Google Scholar] [CrossRef]
- Briechle, S.; Krzystek, P.; Vosselman, G. Silvi-Net—A dual-CNN approach for combined classification of tree species and standing dead trees from remote sensing data. Int. J. Appl. Earth Obs. Geoinf. 2021, 98, 102292. [Google Scholar] [CrossRef]
- Zhao, X.; Guo, Q.; Su, Y.; Xue, B. Improved progressive TIN densification filtering algorithm for airborne LiDAR data in forested areas. ISPRS J. Photogramm. Remote Sens. 2016, 117, 79–91. [Google Scholar] [CrossRef] [Green Version]
- Tao, S.; Wu, F.; Guo, Q.; Wang, Y.; Li, W.; Xue, B.; Hu, X.; Li, P.; Tian, D.; Li, C.; et al. Segmenting tree crowns from terrestrial and mobile LiDAR data by exploring ecological theories. ISPRS J. Photogramm. Remote Sens. 2015, 110, 66–76. [Google Scholar] [CrossRef] [Green Version]
- Wu, Z.; Song, S.; Khosla, A.; Yu, F.; Zhang, L.; Tang, X.; Xiao, J. 3D ShapeNets: A deep representation for volumetric shapes. In Proceedings of the 2015 IEEE Conference on Computer Vision and Pattern Recognition (CVPR), Boston, MA, USA, 7–12 June 2015; pp. 1912–1920. [Google Scholar] [CrossRef] [Green Version]
- Hamraz, H.; Jacobs, N.B.; Contreras, M.A.; Clark, C.H. Deep learning for conifer/deciduous classification of airborne LiDAR 3D point clouds representing individual trees. ISPRS J. Photogramm. Remote Sens. 2019, 158, 219–230. [Google Scholar] [CrossRef] [Green Version]
- Krishna Moorthy, S.M.; Calders, K.; Vicari, M.B.; Verbeeck, H. Improved Supervised Learning-Based Approach for Leaf and Wood Classification from LiDAR Point Clouds of Forests. IEEE Trans. Geosci. Remote Sens. 2020, 58, 3057–3070. [Google Scholar] [CrossRef] [Green Version]
Figure 1.
Spatial distribution of the three study areas: (1) the Greater Khingan Station, (2) the Huailai Remote Sensing Comprehensive Experimental Station, and (3) the Gaofeng forest farm.
Figure 1.
Spatial distribution of the three study areas: (1) the Greater Khingan Station, (2) the Huailai Remote Sensing Comprehensive Experimental Station, and (3) the Gaofeng forest farm.

Figure 2.
The complete experimental procedure consisting of four parts.

Figure 3.
A sample of the individual tree point clouds of eight tree species used in this experiment.
Figure 3.
A sample of the individual tree point clouds of eight tree species used in this experiment.

Figure 4.
Comparison of the classification accuracy of the model after two normalization methods.

Figure 5.
The classification accuracy of tree species corresponds to the experiments before and after the separation of leaf and wood.
Figure 5.
The classification accuracy of tree species corresponds to the experiments before and after the separation of leaf and wood.

Figure 6.
Differences in classification accuracy before and after leaf–wood separation correspond to different numbers of sampling points.
Figure 6.
Differences in classification accuracy before and after leaf–wood separation correspond to different numbers of sampling points.

Figure 7.
Statistical parameters of classification accuracy of tree species corresponding to different downsampling methods (original: point cloud data without leaf–wood separation; wood: point cloud data of the wood).
Figure 7.
Statistical parameters of classification accuracy of tree species corresponding to different downsampling methods (original: point cloud data without leaf–wood separation; wood: point cloud data of the wood).

Figure 8.
Accuracy of tree species classification in experiments with different downsampling methods: (a) point cloud data without leaf–wood separation; (b) point cloud data of the wood.
Figure 8.
Accuracy of tree species classification in experiments with different downsampling methods: (a) point cloud data without leaf–wood separation; (b) point cloud data of the wood.

Figure 9.
Accuracy curves of tree species classification for five downsampling methods using different sampling points: (a) point cloud data without leaf and wood separation; (b) point cloud data of the wood.
Figure 9.
Accuracy curves of tree species classification for five downsampling methods using different sampling points: (a) point cloud data without leaf and wood separation; (b) point cloud data of the wood.

Figure 10.
The number of sampling points used for each downsampling method to achieve a maximum classification accuracy of tree species.
Figure 10.
The number of sampling points used for each downsampling method to achieve a maximum classification accuracy of tree species.

Figure 11.
Average time per epoch training for the PointNet++ model.

Figure 12.
Epoch count for deep learning models to obtain optimal convergence parameters.

Figure 13.
Changes in the loss function and accuracy during model training.

Figure 14.
Confusion matrix for tree species classification of (a) training data and (b) test data.


Table 1.
LiBackpack DGC50 1 instrument parameters 2.
| Parts | Indicator | Parameter |
|---|---|---|
| System | System relative accuracy | 3 cm |
| System absolute accuracy | 5–10 cm | |
| LiDAR | LiDAR sensors | 2 |
| Number of channels | 16 | |
| Scan range | 100 m @ 20% reflectance | |
| FOV (°) | Vertical (−90 to 90); horizontal (360) | |
| Scan rate (single return) | 600,000 p/s | |
| GNSS | Accuracy | 1 cm + 1 ppm |
1 LiBackpack DGC50 product information: https://www.greenvalleyintl.com/LiBackpackDGC50/ (accessed on 28 June 2022). 2 Detailed parameters of the equipment: https://www.greenvalleyintl.com/static/upload/file/20210816/1629100784899644.pdf (accessed on 28 June 2022).
Table 2.
Basic point cloud data of tree species.
| Study Area | Tree Species | Number | Tree Height (m) | Number of Points | ||||||
|---|---|---|---|---|---|---|---|---|---|---|
| Total | Train | Test | Min | Max | Mean | Min | Max | Mean | ||
| Genhe | Birch | 215 | 172 | 43 | 6.58 | 20.87 | 15.26 | 3710 | 36,591 | 11,488 |
| Larch | 295 | 236 | 59 | 6.23 | 19.30 | 12.80 | 4166 | 57,878 | 17,263 | |
| Huailai | Locust | 142 | 114 | 28 | 4.91 | 9.79 | 7.60 | 3336 | 114,078 | 37,706 |
| Willow | 174 | 140 | 34 | 6.33 | 12.55 | 9.34 | 5328 | 81,300 | 17,566 | |
| Poplar | 165 | 132 | 33 | 14.39 | 25.04 | 19.06 | 9957 | 186,485 | 33,408 | |
| Elm | 85 | 68 | 17 | 4.37 | 13.48 | 7.71 | 19,315 | 220,095 | 60,470 | |
| Gaofeng | Eucalyptus | 131 | 105 | 26 | 20.34 | 34.66 | 30.52 | 15,359 | 254,628 | 64,929 |
| Chinese fir | 105 | 84 | 21 | 7.51 | 22.64 | 17.42 | 12,265 | 12,513,408 | 412,698 | |
Table 3.
Hyperparameters of the model and parameters of the optimal configuration.
| Hyperparameter | Value | Declaration |
|---|---|---|
| MODEL | pointnet2_cls_msg | PointNet++ MSG |
| BATCH_SIZE | 12 | The number of batches in each epoch |
| NUM_POINT | 1024, 2048, 3072, 4096, 5120, 6144, 7168, 8192, 9216 | The number of points per individual tree sample |
| NUM_CATEGORY | 8 | Th number of categories of objects |
| EPOCH | 200 | The number of training rates |
| OPTIMIZER | Adam | Optimizer algorithm |
| LEARNING_RATE | 0.001 | Learning rate |
| DECAY_RATE | 0.0001 | The decay rate of learning rate |
Publisher’s Note: MDPI stays neutral with regard to jurisdictional claims in published maps and institutional affiliations. |
© 2022 by the authors. Licensee MDPI, Basel, Switzerland. This article is an open access article distributed under the terms and conditions of the Creative Commons Attribution (CC BY) license (https://creativecommons.org/licenses/by/4.0/).
Share and Cite
MDPI and ACS Style
Liu, B.; Chen, S.; Huang, H.; Tian, X. Tree Species Classification of Backpack Laser Scanning Data Using the PointNet++ Point Cloud Deep Learning Method. Remote Sens. 2022, 14, 3809. https://0-doi-org.brum.beds.ac.uk/10.3390/rs14153809
AMA Style
Liu B, Chen S, Huang H, Tian X. Tree Species Classification of Backpack Laser Scanning Data Using the PointNet++ Point Cloud Deep Learning Method. Remote Sensing. 2022; 14(15):3809. https://0-doi-org.brum.beds.ac.uk/10.3390/rs14153809
Chicago/Turabian StyleLiu, Bingjie, Shuxin Chen, Huaguo Huang, and Xin Tian. 2022. "Tree Species Classification of Backpack Laser Scanning Data Using the PointNet++ Point Cloud Deep Learning Method" Remote Sensing 14, no. 15: 3809. https://0-doi-org.brum.beds.ac.uk/10.3390/rs14153809
Note that from the first issue of 2016, this journal uses article numbers instead of page numbers. See further details here.