
SynthWakeSAR: A Synthetic SAR Dataset for Deep Learning Classification of Ships at Sea


1
Energy and Environment Institute, University of Hull, Hull HU6 7RX, UK
2
Visual Information Laboratory, University of Bristol, Bristol BS1 5TE, UK
*
Author to whom correspondence should be addressed.
Remote Sens. 2022, 14(16), 3999; https://0-doi-org.brum.beds.ac.uk/10.3390/rs14163999
Submission received: 2 July 2022
/
Revised: 6 August 2022
/
Accepted: 12 August 2022
/
Published: 17 August 2022
(This article belongs to the Special Issue Ship Detection and Maritime Monitoring Based on SAR Data)
Abstract
:The classification of vessel types in SAR imagery is of crucial importance for maritime applications. However, the ability to use real SAR imagery for deep learning classification is limited, due to the general lack of such data and/or the labor-intensive nature of labeling them. Simulating SAR images can overcome these limitations, allowing the generation of an infinite number of datasets. In this contribution, we present a synthetic SAR imagery dataset with ship wakes, which comprises 46,080 images for ten different real vessel models. The variety of simulation parameters includes 16 ship heading directions, 6 ship velocities, 8 wind directions, 2 wind velocities, and 3 incidence angles. In addition, we extensively investigate the classification performance for noise-free, noisy, and denoised ship wake scenes. We utilize the standard AlexNet architecture and employ training from scratch. To achieve the best classification performance, we conduct Bayesian optimization to determine hyperparameters. Results demonstrate that the classifications of vessel types based on their SAR signatures are highly efficient, with maximum accuracies of 96.16%, 92.7%, and 93.59%, when training using noise-free, noisy, and denoised datasets, respectively. Thus, we conclude that the best strategy in practical applications should be to train convolutional neural networks on denoised SAR datasets. The results show that the versatility of the SAR simulator can open up new horizons in the application of machine learning to a variety of SAR platforms.
1. Introduction
Synthetic aperture radar (SAR) technologies have shown remarkable progress in recent years and the availability of remotely sensed data of the sea surface is continuously growing. Several spaceborne SAR missions (e.g., COSMO-SkyMed, TerraSAR-X, NovaSAR-1, ICEYE) have developed a new generation of satellites exploiting SAR to provide spatial resolutions that were previously unavailable. The corresponding SAR datasets are especially useful for analyzing ship wakes, not only because of the high level of detail available but also because of the lower satellite orbital altitude (e.g., in comparison to Sentinel-1), which decreases the range-to-velocity () ratio—one of the key factors in SAR image degradation.
In addition, the application of artificial intelligence and machine learning (deep learning in particular) has also reached a significant level of maturity, with many methods having been developed in the field of object detection, segmentation, and classification in remote sensing images [1,2]. The main benefit of using SAR images, compared with other remote sensing methods, is that they yield information for wide areas under challenging weather conditions, day or night. Accurate analytics of SAR imagery is not only important in the recognition of ships themselves, but also the detection and characterization of their wakes. Although the visibility of ships is primarily enabled by strong radar signal backscattering, they are not always present in SAR images, especially in images with lower SAR resolution (e.g., Sentinel-1). Instead, the ship wake is the usual indicator of the ship presence, while the ship position is also often shifted to some extent with respect to wake location as a result of the Doppler effect.
Ship wakes provide key information for the surveillance of maritime traffic (e.g., illegal commercial activities) and are also useful in classifying the characteristics of the wake-generating vessel and, hence, estimating the ship heading and velocity [3,4]. A detailed description of the SAR wake imaging mechanism is presented in [5,6,7]. In addition, the availability of automatic identification system (AIS) data enables the integration of such information for machine learning development since it can constitute the ground-truth for ship identification. The main issue is the limited availability of large amounts of both types of data, which are the primary inputs required for building reliable training datasets. The use of synthetic SAR imagery can fill this gap, providing a theoretically infinite set of images for multiple sea conditions, ship models, and SAR platforms. It is important to note that in this case, a priori simulation parameters substitute the need for AIS data. In addition, this simplifies the laborious process of matching SAR images to the AIS data [8].
The earliest applications of deep learning for ship detection [9] and classification [10] in SAR images were proposed only a few years ago. Thereafter, the main efforts of the community have focused on the acquisition of real SAR datasets of ships and few of such datasets have been presented [8,11,12,13,14,15,16,17,18,19]. However, it is important to note that most of these datasets were created for detection tasks (some include segmentation) and only some of them can be used for ship classification [8,12,13,18]. The first studies focusing on the application of deep learning for the detection of ship wakes in SAR were ref. [20], where detected ship wakes were used for ship velocities estimation, and [6], where a real SAR dataset containing ship wakes was proposed. Recently, the concept of using simulated SAR images of marine vehicles with wake patterns for deep learning applications was also mentioned [21].
The main objective of our paper is to draw the attention of the research community to the benefits of using synthetic SAR datasets for classification and detection tasks. The wake system represents a unique signature for each individual ship. Nevertheless, attempting the acquisition of all possible real SAR image variants for each ship would be a gargantuan task, as many factors must be taken into account, such as different ship velocities and different sea states. The use of an available and versatile SAR image simulator [7,22] allows the generation of an unlimited number of different scenarios, overcoming these limitations. Thus, in our work, for the first time, we present and make openly available a synthetic dataset of SAR images containing ship wakes for classification purposes. It includes 46,080 SAR images for ten different ship models. We also analyze for the first time the best algorithm training strategy, by comparing the alternatives of using noise-free, noisy, and denoised images for the ship identification task.
The communication is organized as follows: Section 2 presents the SAR imagery modeling details and structure of the dataset and then describes the parameters of the deep learning network that we employed. In Section 3, the classification results and comparisons between different training strategies are discussed. A conclusion, with future work directions and applications, is outlined in Section 4.
2. Materials and Methods
A complete description of the SAR imagery simulation methodology with all the relevant mathematical details is available in [7], with the corresponding open-source package (MATLAB) available via the University of Bristol Research Data Repository [22].
2.1. Ship Wake Modeling in SAR Imagery
A SAR image of a ship wake consists of two parts: wind- and ship-generated wave components. They form the complete surface elevation model through their superposition as . The first part in turn is modeled based on the linear theory of surface waves and includes a summation of many independent harmonic waves with Rayleigh distributed amplitude A. The amplitude is based on sea wave spectrum and directional spreading function . In this work, we used JONSWAP spectrum [23] with fetch size F = 20 km and Longuet-Higgins et al. cosine type spreading function [24] with parameter S = 8. We utilized two wind velocities as = 3 m/s and = 6 m/s. This choice follows from the fact that the Kelvin wake is best observed in SAR images for a calm sea state ( 3 m/s) and cusp waves can still be observed at relatively high wind velocities (6–10 m/s) [25]. We also selected eight different wind directions: = , = , = , = , = , = , = , = .
The second component of the SAR image, , is modeled as a Kelvin wake and is based on the Michell thin ship theory with its further approximated form of fluid velocity potential described in [4,7]. Based on freely available information at www.marinetraffic.com, we selected ten real ships (cargo, tanker, passenger vessel, high speed craft, fishing vessel) and modeled them using the parameters shown in Table 1. Similar to the approach taken for wind velocity, to account for factors influencing wake visualization, we limited the minimum ship velocity to = 5 m/s for all ship models. This is because a higher ship velocity produces a better radar scattering as the wake signature. In addition, in [26], it was shown that faster ships are more easily detectable in SAR images. In order to provide balanced training samples for each ship, we equally interpolated ship velocities between the minimum velocity and maximum velocity (unique for each ship) providing six velocities per class (Table 1). This also ensures a greater difference between the velocities for different ships and as a result, gives a greater diversity in wake signatures for all data.
One of the most significant parameters influencing the SAR imaging of ship wakes is the ship heading direction relative to the SAR platform flight direction. Indeed, depending on the ship’s heading, waves of the Kelvin system may or may not be observable in the SAR image. Therefore, we used a considerable number of ship heading directions (16 to be precise) to create a greater combination of realistic SAR images of ship wake content. The ship directions are as follows: = , = , = , = , = , = , = , = , = , = , = , = , = , = , = , = .
SAR images were simulated corresponding to normalized radar cross-section (NRCS), with tilt and hydrodynamic modulations, and velocity bunching. The size of each scene 0.96 × 0.96 km is chosen to include enough details of wakes for all modeled vessels but also because it is a convenient size as input into the deep convolutional neural network (CNN). The simulation parameters are as follows (similar to the TerraSAR-X platform):
Frequency → 9.65 (X-band) [GHz];
Wavelength → 0.031 [m];
Incidence angle → 20, 32.5, 45 [deg];
Polarization → HH;
Platform altitude → 514 [km];
Platform velocity → 7600 [m/s];
( = 20, 32.5, 45 [deg]) → 72, 80.2, 95.6 [s];
Azimuth resolution → 3.3 [m];
Range resolution → 3.3 [m].
Finally, all SAR images are scaled within the same intensity range of values by nonlinear normalization [10]:
with
An integral part of a real SAR image is speckle noise, which can significantly suppress the wake details (Figure 1a,b). If we consider real SAR images as a basis for forming the training dataset, the question is: Is it beneficial to use (i) noisy images for training and then noisy images for input to the classification or (ii) denoised images for training and again denoised images for classification? Although we do not use real SAR images in this study, this issue is very important, because synthetic data can potentially be used as a training dataset for classification tasks in real SAR images.
To answer this question and to determine the best strategy for network training we prepared three datasets: (i) noise-free images , (ii) noisy images , and (iii) denoised images . They are all identical, and only differ in a noise component (absent, present, or filtered). For simplicity and without loss of generality, here we chose to employ a K-distributed intensity speckle model [7]. Finally, because it is time-consuming to apply advanced denoisers (e.g., BM3D or Bayesian filters [27,28]) for large datasets, for illustration purposes, we utilized a simple median filter of size . An example of simulated SAR images is presented in Figure 1.
2.2. Dataset Structure
The schematic illustration of the structure of the dataset is shown in Figure 2. The number of the synthetic SAR images per class is based on a combination of simulated parameters as follows: 6 ship velocities × 16 ship heading directions × 2 wind velocities × 8 wind directions × 1 polarization HH × 3 incidence angles . Thus, the overall number of images in the dataset for 10 classes is 46,080 (10 ship models, being 2 models for each of the 5 categories of the ship, Table 1).
2.3. CNN Architecture
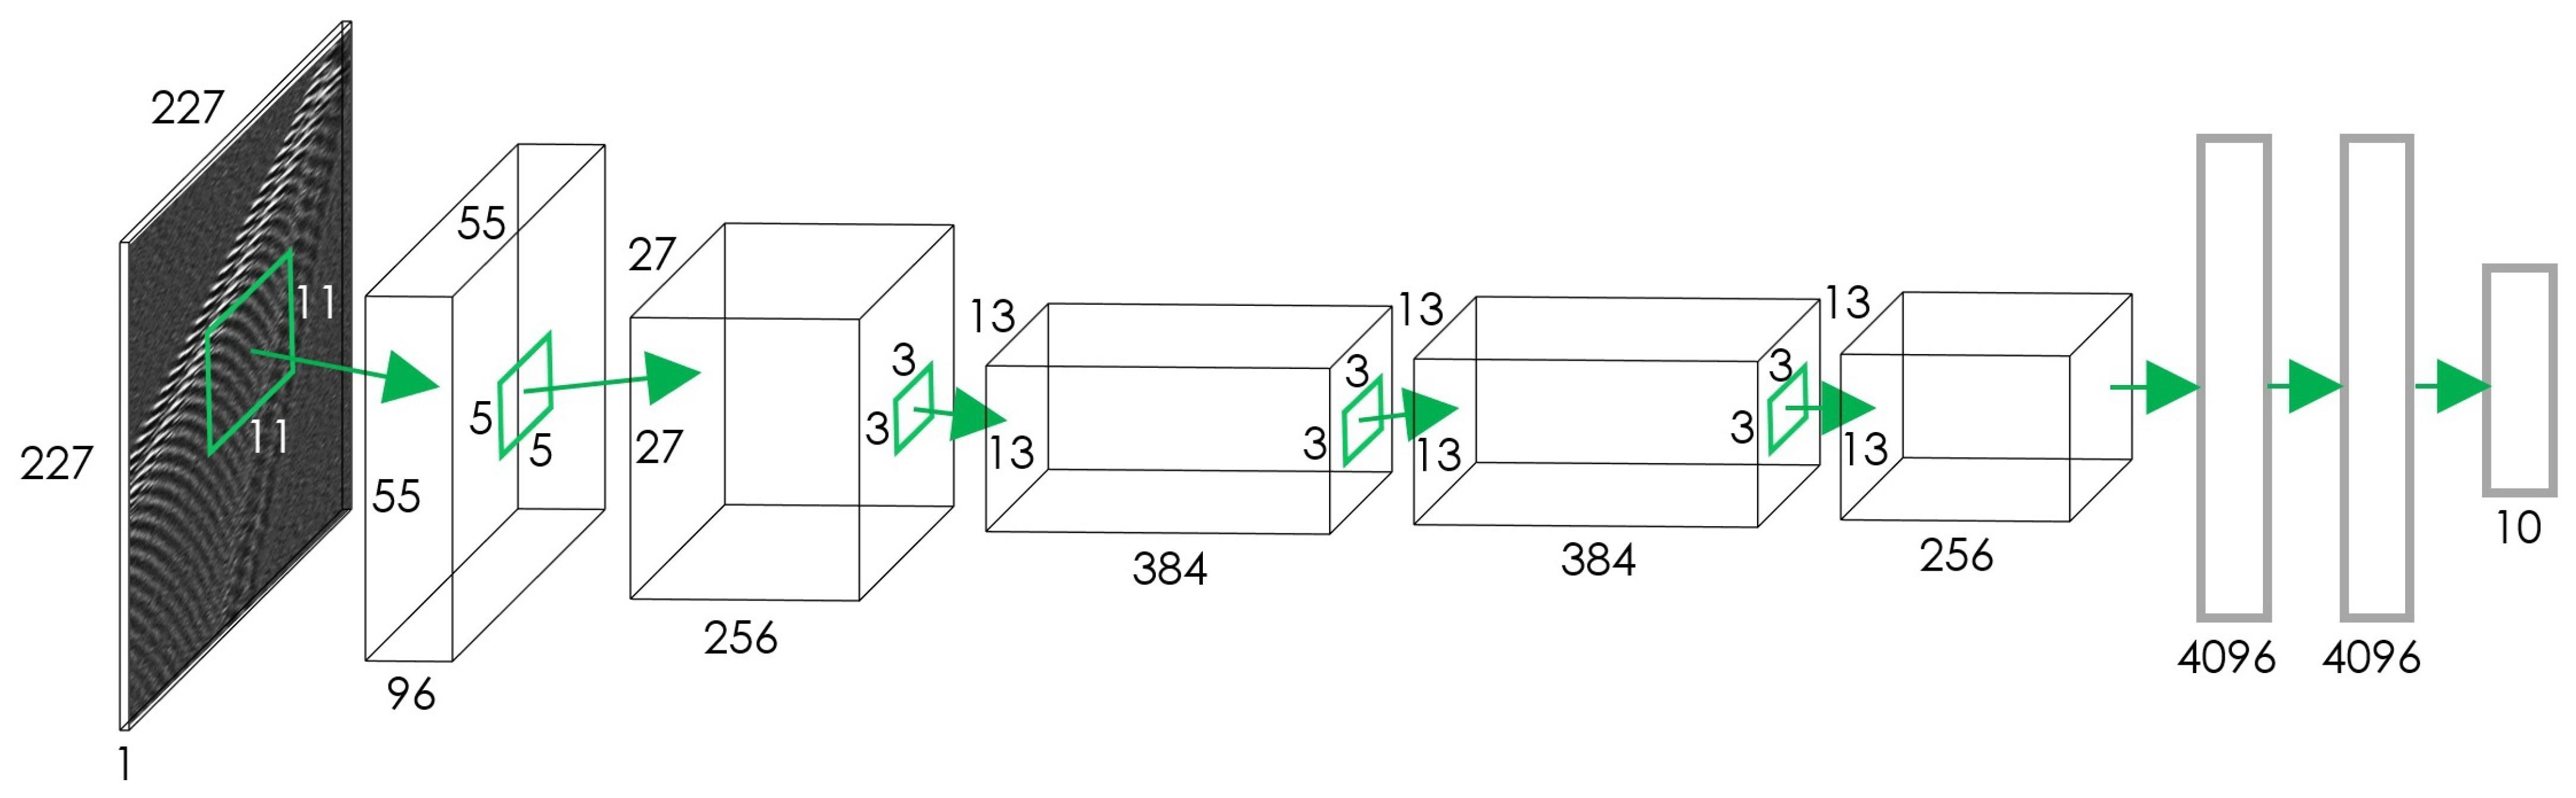
To evaluate the proposed dataset, we employ one of the most well-known neural network architectures, AlexNet [29]. The network is comprised of 8 layers, where the first five are convolutional layers and the last three are fully connected. We slightly modified a couple of parameters in this network, as shown in Figure 3, where we used 1 image channel instead of 3 for the input imagery, and the final layer was updated for 10 output classes instead of 1000. We also further adjusted the size of all images by interpolation to 227 × 227 pixels.
In contrast to the large majority of studies, which use pre-trained AlexNet (transfer learning), we employed the untrained AlexNet architecture (learning from scratch). As the untrained network does not include optimized weights and biases, the hyperparameters must be determined prior to training. Tuning these hyperparameters is a difficult and time-consuming task. The optimal combination of hyperparameters was derived via Bayesian optimization by maximizing the validation accuracy. We specified a range of values for each hyperparameter for all datasets (, , ), and 30 trials per dataset were evaluated. In Table 2, the initial range of values and estimated optimal values for each dataset are provided. For all calculations, we used the stochastic gradient descent with momentum (SGDM) optimizer, a batch size of 256, a maximum number of epochs of 50, and a frequency of network validation of 108.
Additionally, to prevent overfitting, data augmentation was performed as follows: a random translation within the range [−4, 4] pixels on the X and Y axes, and random rotation within a range of [−5, 5] degrees. Three trained networks are presented in this study corresponding to a noise-free dataset (-Net), a noisy dataset (-Net), and a denoised dataset (-Net).
3. Results and Discussion
The proposed dataset was analyzed in two respects: (i) the performance in classifying ship types based on their SAR image signatures, and (ii) for determining the best classification strategy in terms of using either noise-free, noisy, or denoised training datasets.
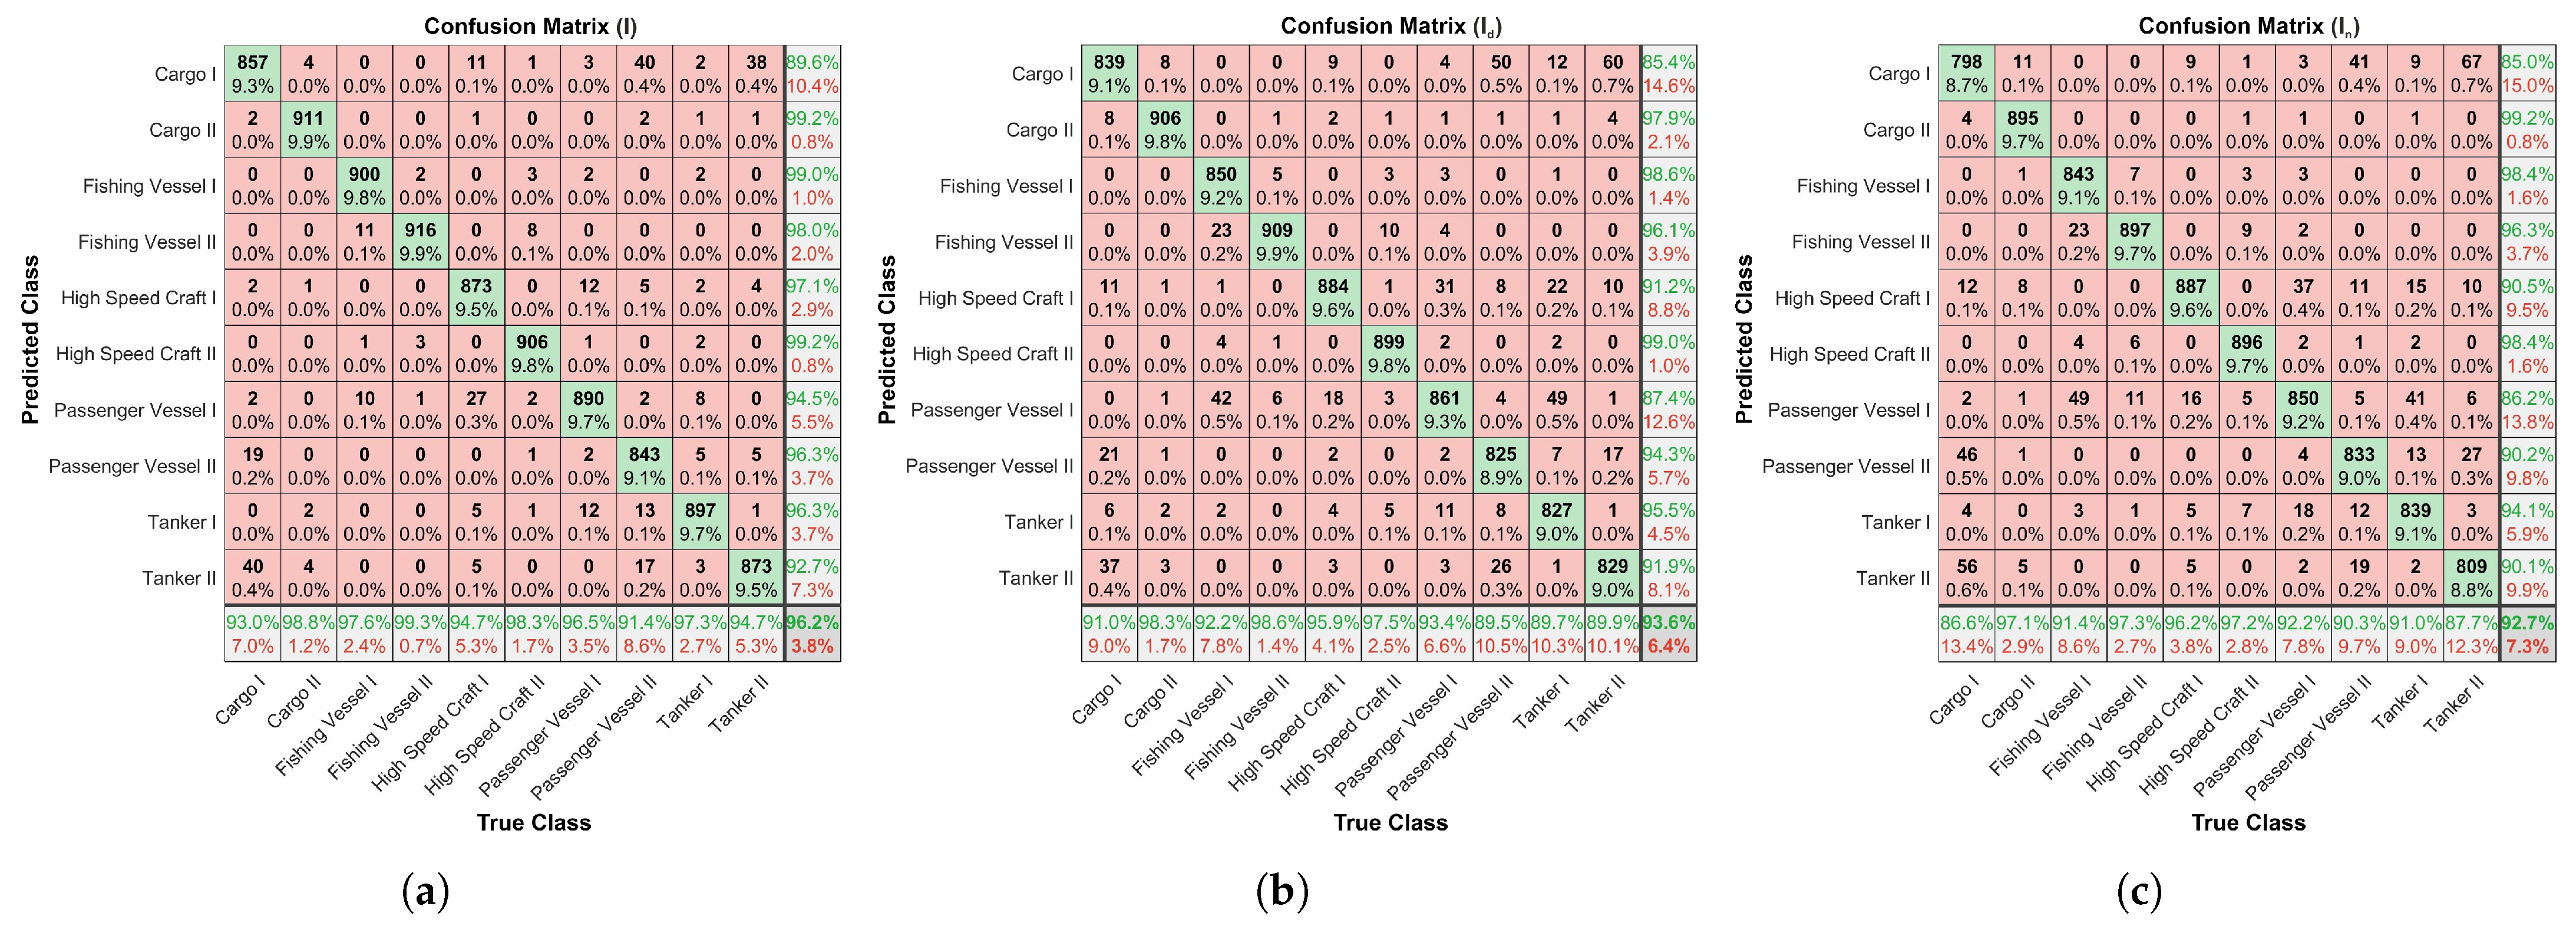
All datasets were randomly partitioned into a training set (60%), validation set (20%), and test set (20%). It is important to note here that in order to cross-validate different datasets, all images within the training, validation, and test sets were the same for all datasets (, , ). For example, this allows the use of the network trained on the noise-free dataset (-Net), and then, by substitution of the noise-free test set with the appropriate test sets from noisy and denoised datasets, the evaluation of the network performance in terms of classification accuracy. Let us start with the overall comparison of trained networks and their performance per class. Figure 4 illustrates confusion matrix graphs calculated for all trained networks applied on relevant pairs (-Net: , -Net: , -Net: ) for the test sets. The accuracy is logical and follows the intuition that “less noise leads to better performance” (-Net—96.16%, -Net—93.59%, -Net—92.7%).
In Table 3, the summary of classification accuracy results for different trained networks is presented. Evaluations were only carried out for combinations potentially applicable to real SAR images. This is due to the fact that real radar images always include speckle noise, and for example, the use of networks trained on noisy and denoised datasets (-Net and -Net) for ship identification in the noise-free dataset is irrelevant. In this sense, the estimation of the accuracy of the network -Net on dataset also seems redundant, but we presented it for an overall comparison of the triad -Net, -Net, and -Net. In summary, the following strategies were investigated: (i) the noise-free-trained network -Net evaluated with noise-free, noisy, and denoised datasets; (ii) -Net and -Net networks applied to the noisy and denoised datasets.
Interestingly, the maximum accuracy was achieved for -Net with the dataset but only for the training set case (99.16%). The minimum accuracy of 48.79% occurred when -Net was used on the dataset (test set), which confirms the significant influence of noise on the classification process. However, the better accuracy is related to -Net when it is cross-utilized on and (75.9% and 73.18%) in comparison to scenarios where -Net was used with (69.93%) and again -Net with (48.79%). Furthermore, in view of judging potential applicability to the case of real SAR images, the best accuracy was achieved for the network -Net with the dataset (93.59%). However, in practice, this could also be dependent on the denoising method, while here a simple median filtering was employed, as previously mentioned (Section 2.1). From this perspective, training straightaway based on a noisy dataset can be considered an alternative approach, since the accuracy for the network -Net with the dataset also achieved a good value of 92.7%. Hence, one can conclude that the two strategies that can be applied when using our synthetic SAR dataset of ship wakes are to train on either (i) the denoised dataset, or (ii) the noisy dataset. The latter has the advantage of reducing the additional image processing time (by excluding denoising). This is possible due to the generation of a large number of synthetic radar images using multiple simulation scenarios.
For visualization purposes, Figure 5 also shows 25 randomly selected test images (-Net: ) with predicted classes and predicted probabilities of these classes. It is readily noticeable that images with less distinguishable ship wake details are less accurately classified.
4. Conclusions
Synthetic aperture radar has been used for over fifty years to image waves on the ocean’s surface. The many theoretical developments achieved in the hydrodynamic modeling of the sea surface and the effects on SAR image formation now allow the generation of very realistic synthetic SAR datasets. This can enable the use of machine learning in the classification of vessels. In this study, we introduced and analyzed the first such dataset to help overcome the well-known limitation of the lack of a sufficient number of labeled real SAR images with ship wakes for deep learning classification. The conceptualization of this work has consisted of two aspects: (i) classification of ship types on the basis of their wake signatures in synthetic SAR images, and (ii) analysis of the classification strategies in terms of using noise-free, noisy, and denoised datasets. In contrast to the usual practice of using pre-trained networks, we employed the untrained CNN AlexNet architecture and performed training from scratch. It is demonstrated that even with a small number of epochs (50), the networks were trained with a high level of accuracy for training sets 98.68%, 97.82%, and 99.16%, and for test sets 96.16%, 92.7%, and 93.59% (noise-free, noisy, and denoised datasets, respectively).
One should keep in mind that the ship velocity affects the amplitude of the wakes and, consequently, their visualization in the radar image. The same applies to wind velocity, but the general principle is that a bigger amplitude for wakes and smaller for ambient sea waves is better for wake visualization. This creates uncertainties in the choice of ship velocity for simulation, as for the same velocity and constant amplitude of ambient sea waves, one ship’s wake will not be visible while another will. This means that the training dataset may contain images where only the sea waves are represented, which may have an impact on classification accuracy. However, it also applies to the concept of a ’boundary condition’ [7], where due to similar size (wavelength) and amplitude of the sea and ship waves, wake signatures can disappear or be less noticeable in the SAR image. This question should therefore be explored further, bearing in mind that with the increase in the number of ship models, the problem becomes more complicated. Another major issue that should be studied is the impact that similar wake signatures, corresponding however to different vessels, have on classification accuracy. Finally, and perhaps most importantly, the application to classify ships in real data should be investigated, either by direct use of the presented trained networks or after some form of transfer learning.
To summarize, we highlight that there are a number of advantages to using synthetic SAR datasets for classifying vessels. Since simulations allow for the generation of the necessary amount of data, it solves the imbalanced data problems often experienced with real data when they have a skewed class distribution. Automation also means that synthetic data generation is much faster than the usual manual processing of real SAR images. Furthermore, the use of known parameters for simulations can replace AIS data, which also considerably simplifies the typical, laborious process of integrating AIS data with SAR images. Ultimately, the versatility of our SAR simulator allows the building of datasets corresponding to different SAR platforms.
Author Contributions
Conceptualization, I.G.R. and A.A.; methodology, I.G.R. and A.A.; writing—original draft preparation, I.G.R.; writing—review and editing, I.G.R. and A.A.; project administration, A.A. All authors have read and agreed to the published version of the manuscript.
Funding
This work was supported in part by the Engineering and Physical Sciences Research Council (EPSRC) under grant EP/R009260/1 (AssenSAR) and in part by a follow-on EPSRC Impact Acceleration Award from the University of Bristol.
Data Availability Statement
The proposed dataset was created in MATLAB and is publicly available via the University of Bristol Research Data Repository [30].
Conflicts of Interest
The authors declare no conflict of interest.
References
- Zhu, X.X.; Montazeri, S.; Ali, M.; Hua, Y.; Wang, Y.; Mou, L.; Shi, Y.; Xu, F.; Bamler, R. Deep learning meets SAR: Concepts, models, pitfalls, and perspectives. IEEE Geosci. Remote Sens. Mag. 2021, 9, 143–172. [Google Scholar] [CrossRef]
- Ma, L.; Liu, Y.; Zhang, X.; Ye, Y.; Yin, G.; Johnson, B.A. Deep learning in remote sensing applications: A meta-analysis and review. ISPRS J. Photogramm. Remote Sens. 2019, 152, 166–177. [Google Scholar] [CrossRef]
- Graziano, M.D.; D’Errico, M.; Rufino, G. Ship heading and velocity analysis by wake detection in SAR images. Acta Astronaut. 2016, 128, 72–82. [Google Scholar] [CrossRef]
- Zilman, G.; Zapolski, A.; Marom, M. On detectability of a ship’s Kelvin wake in simulated SAR images of rough sea surface. IEEE Trans. Geosci. Remote Sens. 2014, 53, 609–619. [Google Scholar] [CrossRef]
- Karakuş, O.; Rizaev, I.; Achim, A. Ship wake detection in SAR images via sparse regularization. IEEE Trans. Geosci. Remote Sens. 2019, 58, 1665–1677. [Google Scholar] [CrossRef]
- Del Prete, R.; Graziano, M.D.; Renga, A. First results on wake detection in SAR images by deep learning. Remote Sens. 2021, 13, 4573. [Google Scholar] [CrossRef]
- Rizaev, I.G.; Karakuş, O.; Hogan, S.J.; Achim, A. Modeling and SAR imaging of the sea surface: A review of the state-of-the-art with simulations. ISPRS J. Photogramm. Remote Sens. 2022, 187, 120–140. [Google Scholar] [CrossRef]
- Hou, X.; Ao, W.; Song, Q.; Lai, J.; Wang, H.; Xu, F. FUSAR-Ship: Building a high-resolution SAR-AIS matchup dataset of Gaofen-3 for ship detection and recognition. Sci. China Inf. Sci. 2020, 63, 1–19. [Google Scholar] [CrossRef]
- Kang, M.; Ji, K.; Leng, X.; Lin, Z. Contextual region-based convolutional neural network with multilayer fusion for SAR ship detection. Remote Sens. 2017, 9, 860. [Google Scholar] [CrossRef]
- Bentes, C.; Velotto, D.; Tings, B. Ship classification in TerraSAR-X images with convolutional neural networks. IEEE J. Ocean. Eng. 2017, 43, 258–266. [Google Scholar] [CrossRef]
- Li, J.; Qu, C.; Shao, J. Ship detection in SAR images based on an improved faster R-CNN. In Proceedings of the 2017 SAR in Big Data Era: Models, Methods and Applications (BIGSARDATA), Beijing, China, 13–14 November 2017; pp. 1–6. [Google Scholar]
- Huang, L.; Liu, B.; Li, B.; Guo, W.; Yu, W.; Zhang, Z.; Yu, W. OpenSARShip: A dataset dedicated to Sentinel-1 ship interpretation. IEEE J. Sel. Top. Appl. Earth Obs. Remote Sens. 2017, 11, 195–208. [Google Scholar] [CrossRef]
- Li, B.; Liu, B.; Huang, L.; Guo, W.; Zhang, Z.; Yu, W. OpenSARShip 2.0: A large-volume dataset for deeper interpretation of ship targets in Sentinel-1 imagery. In Proceedings of the 2017 SAR in Big Data Era: Models, Methods and Applications (BIGSARDATA), Beijing, China, 13–14 November 2017; pp. 1–5. [Google Scholar]
- Wang, Y.; Wang, C.; Zhang, H.; Dong, Y.; Wei, S. A SAR dataset of ship detection for deep learning under complex backgrounds. Remote Sens. 2019, 11, 765. [Google Scholar] [CrossRef]
- Xian, S.; Wang, Z.; Sun, Y.; Diao, W.; Zhang, Y.; Fu, K. AIR-SARShip-1.0: High-resolution SAR ship detection dataset. J. Radars 2019, 8, 852–862. [Google Scholar]
- Wei, S.; Zeng, X.; Qu, Q.; Wang, M.; Su, H.; Shi, J. HRSID: A high-resolution SAR images dataset for ship detection and instance segmentation. IEEE Access 2020, 8, 120234–120254. [Google Scholar] [CrossRef]
- Zhang, T.; Zhang, X.; Ke, X.; Zhan, X.; Shi, J.; Wei, S.; Pan, D.; Li, J.; Su, H.; Zhou, Y.; et al. LS-SSDD-v1.0: A deep learning dataset dedicated to small ship detection from large-scale Sentinel-1 SAR images. Remote Sens. 2020, 12, 2997. [Google Scholar] [CrossRef]
- Zhang, T.; Zhang, X.; Li, J.; Xu, X.; Wang, B.; Zhan, X.; Xu, Y.; Ke, X.; Zeng, T.; Su, H.; et al. SAR ship detection dataset (SSDD): Official release and comprehensive data analysis. Remote Sens. 2021, 13, 3690. [Google Scholar] [CrossRef]
- Lei, S.; Lu, D.; Qiu, X.; Ding, C. SRSDD-v1.0: A high-resolution SAR rotation ship detection dataset. Remote Sens. 2021, 13, 5104. [Google Scholar] [CrossRef]
- Kang, K.m.; Kim, D.j. Ship velocity estimation from ship wakes detected using convolutional neural networks. IEEE J. Sel. Top. Appl. Earth Obs. Remote Sens. 2019, 12, 4379–4388. [Google Scholar] [CrossRef]
- Jones, B.; Ahmadibeni, A.; Shirkhodaie, A. Simulated SAR imagery generation of marine vehicles and associated wakes using electromagnetic modeling and simulation techniques. In Proceedings of the Applications of Machine Learning 2021, San Diego, CA, USA, 1–5 August 2021; Volume 11843, pp. 37–49. [Google Scholar]
- Rizaev, I.; Achim, A. AssenSAR Image Simulator. Available online: https://0-doi-org.brum.beds.ac.uk/10.5523/bris.el0p94vgxjhi2224bx78actb4 (accessed on 25 January 2022).
- Hasselmann, K.; Barnett, T.P.; Bouws, E.; Carlson, H.; Cartwright, D.E.; Enke, K.; Ewing, J.A.; Gienapp, H.; Hasselmann, D.E.; Kruseman, P.; et al. Measurements of wind-wave growth and swell decay during the Joint North Sea Wave Project (JONSWAP). Erganz. Dtsch. Hydrogr. Z. 1973, 12, 1–95. [Google Scholar]
- Holthuijsen, L.H. Waves in Oceanic and Coastal Waters; Cambridge University Press: Cambridge, UK, 2010. [Google Scholar]
- Panico, A.; Graziano, M.D.; Renga, A. SAR-based vessel velocity estimation from partially imaged Kelvin pattern. IEEE Geosci. Remote Sens. Lett. 2017, 14, 2067–2071. [Google Scholar] [CrossRef]
- Tings, B.; Pleskachevsky, A.; Velotto, D.; Jacobsen, S. Extension of ship wake detectability model for non-linear influences of parameters using satellite based x-band synthetic aperture radar. Remote Sens. 2019, 11, 563. [Google Scholar] [CrossRef]
- Achim, A.; Tsakalides, P.; Bezerianos, A. SAR image denoising via Bayesian wavelet shrinkage based on heavy-tailed modeling. IEEE Trans. Geosci. Remote Sens. 2003, 41, 1773–1784. [Google Scholar] [CrossRef]
- Argenti, F.; Lapini, A.; Bianchi, T.; Alparone, L. A tutorial on speckle reduction in synthetic aperture radar images. IEEE Geosci. Remote Sens. Mag. 2013, 1, 6–35. [Google Scholar] [CrossRef]
- Krizhevsky, A.; Sutskever, I.; Hinton, G.E. ImageNet classification with deep convolutional neural networks. In Proceedings of the Advances in Neural Information Processing Systems 25 (NIPS 2012), Lake Tahoe, NV, USA, 3–6 December 2012; Volume 25. [Google Scholar]
- Rizaev, I.; Achim, A. SynthWakeSAR Dataset. Available online: https://0-doi-org.brum.beds.ac.uk/10.5523/bris.30kvuvmatwzij2mz1573zqumfx (accessed on 3 August 2022).
Figure 1.
Simulated SAR images ( = ) of ship wake (Passenger Vessel I) with = 8 m/s, = and = 3 m/s: (a) noise-free ; (b) with noise ; (c) denoised .
Figure 1.
Simulated SAR images ( = ) of ship wake (Passenger Vessel I) with = 8 m/s, = and = 3 m/s: (a) noise-free ; (b) with noise ; (c) denoised .

Figure 2.
The structure of the synthetic SAR dataset for each class (for a single incidence angle ) with a cross combination of ship velocities , the ship heading directions , wind velocities , and wind directions , with 1536 combinations overall. The values are given in Table 1 and in the text.
Figure 2.
The structure of the synthetic SAR dataset for each class (for a single incidence angle ) with a cross combination of ship velocities , the ship heading directions , wind velocities , and wind directions , with 1536 combinations overall. The values are given in Table 1 and in the text.

Figure 3.
The architecture of AlexNet is used for training from scratch. The input SAR image has a size of 227 × 227 × 1 and a fully connected output layer for 10 classes.
Figure 3.
The architecture of AlexNet is used for training from scratch. The input SAR image has a size of 227 × 227 × 1 and a fully connected output layer for 10 classes.

Figure 4.
Confusion matrices for classification performance on test sets by trained CNNs for the paired ‘network-dataset’: (a) -Net: , (b) -Net: , (c) -Net: . Diagonal cells correspond to correctly classified observations.
Figure 4.
Confusion matrices for classification performance on test sets by trained CNNs for the paired ‘network-dataset’: (a) -Net: , (b) -Net: , (c) -Net: . Diagonal cells correspond to correctly classified observations.

Figure 5.
Randomly selected test images (-Net: ) with predicted classes and their predicted probabilities.
Figure 5.
Randomly selected test images (-Net: ) with predicted classes and their predicted probabilities.


Table 1.
Vessel parameters used for simulating ship wakes.
| Ship Type | Length, m | Beam, m | Draft, m | Velocity, m/s | |||||
|---|---|---|---|---|---|---|---|---|---|
| Cargo I | 195 | 26 | 7.1 | 5 | 6.2 | 7.4 | 8.6 | 9.8 | 11 |
| Cargo II | 366 | 51 | 13.6 | 5 | 6.4 | 7.8 | 9.2 | 10.6 | 12 |
| Tanker I | 108 | 17 | 5.6 | 5 | 6 | 7 | 8 | 9 | 10 |
| Tanker II | 228 | 32 | 11 | 5 | 5.8 | 6.6 | 7.4 | 8.2 | 9 |
| Passenger Vessel I | 86 | 18 | 2.5 | 5 | 5.6 | 6.2 | 6.8 | 7.4 | 8 |
| Passenger Vessel II | 186 | 28 | 6.5 | 5 | 6.6 | 8.2 | 9.8 | 11.4 | 13 |
| High Speed Craft I | 100 | 17 | 2.5 | 5 | 7.8 | 10.6 | 13.4 | 16.2 | 19 |
| High Speed Craft II | 31 | 7 | 3.8 | 5 | 8 | 11 | 14 | 17 | 20 |
| Fishing Vessel I | 70 | 16 | 8 | 5 | 5.8 | 6.6 | 7.4 | 8.2 | 9 |
| Fishing Vessel II | 27 | 8 | 5.1 | 5 | 5.4 | 5.8 | 6.2 | 6.6 | 7 |
Table 2.
Estimated hyperparameters via Bayesian optimization.
| Parameter | Range of Values | Optimal Value | ||
|---|---|---|---|---|
| Initial learning rate | [1 × 10, 0.5] | 2.1245 × 10 | 2.5684 × 10 | 1.0122 × 10 |
| Momentum | [0.1, 0.98] | 0.89919 | 0.93352 | 0.97300 |
| L2 regularization | [1 × 10, 1 × 10] | 5.4902 × 10 | 7.8834 × 10 | 2.0062 × 10 |
Table 3.
Accuracies of the trained CNNs for different datasets including training and test sets.
| Network | Training Set | Test Set | ||||
|---|---|---|---|---|---|---|
| -Net | 98.68 | 77.35 | 74.21 | 96.16 | 75.90 | 73.18 |
| -Net | − | 97.82 | 72.24 | − | 92.70 | 69.93 |
| -Net | − | 50.21 | 99.16 | − | 48.79 | 93.59 |
Publisher’s Note: MDPI stays neutral with regard to jurisdictional claims in published maps and institutional affiliations. |
© 2022 by the authors. Licensee MDPI, Basel, Switzerland. This article is an open access article distributed under the terms and conditions of the Creative Commons Attribution (CC BY) license (https://creativecommons.org/licenses/by/4.0/).
Share and Cite
MDPI and ACS Style
Rizaev, I.G.; Achim, A. SynthWakeSAR: A Synthetic SAR Dataset for Deep Learning Classification of Ships at Sea. Remote Sens. 2022, 14, 3999. https://0-doi-org.brum.beds.ac.uk/10.3390/rs14163999
AMA Style
Rizaev IG, Achim A. SynthWakeSAR: A Synthetic SAR Dataset for Deep Learning Classification of Ships at Sea. Remote Sensing. 2022; 14(16):3999. https://0-doi-org.brum.beds.ac.uk/10.3390/rs14163999
Chicago/Turabian StyleRizaev, Igor G., and Alin Achim. 2022. "SynthWakeSAR: A Synthetic SAR Dataset for Deep Learning Classification of Ships at Sea" Remote Sensing 14, no. 16: 3999. https://0-doi-org.brum.beds.ac.uk/10.3390/rs14163999
Note that from the first issue of 2016, this journal uses article numbers instead of page numbers. See further details here.