
ZY-1 02D Hyperspectral Imagery Super-Resolution via Endmember Matrix Constraint Unmixing
by
 and
and
Xintong Zhang
1,2,3, 
Aiwu Zhang
1,2,3,*,
Raechel Portelli
4,
Xizhen Zhang
1,2,3 and
Hongliang Guan
1,2 1
Key Laboratory of 3D Information Acquisition and Application, Ministry of Education, Capital Normal University, Beijing 100048, China
2
Engineering Research Center of Spatial Information Technology, Ministry of Education, Capital Normal University, Beijing 100048, China
3
Center for Geographic Environment Research and Education, College of Resource Environment and Tourism, Capital Normal University, Beijing 100048, China
4
Department of Geography and Geographic Information Science, University of Illinois, 1301 West Green Street, Urbana, IL 61801, USA
*
Author to whom correspondence should be addressed.
Remote Sens. 2022, 14(16), 4034; https://0-doi-org.brum.beds.ac.uk/10.3390/rs14164034
Submission received: 24 June 2022
/
Revised: 10 August 2022
/
Accepted: 11 August 2022
/
Published: 18 August 2022
(This article belongs to the Special Issue Advances in Hyperspectral Remote Sensing: Methods and Applications)
Abstract
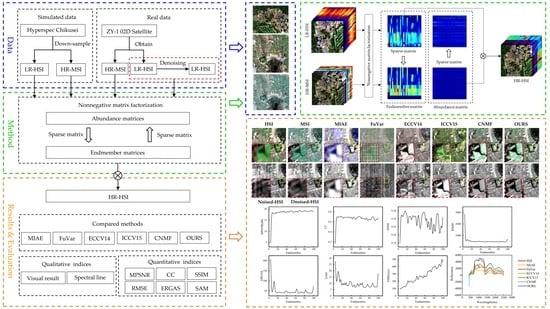
:This paper proposes an endmember matrix constraint unmixing method for ZY-1 02D hyperspectral imagery (HSI) super-resolution reconstruction (SRR) to overcome the low resolution of ZY-1 02D HSI. The proposed method combines spectral unmixing and adds novel smoothing constraints to traditional non-negative matrix factorization to improve details and preserve the spectral information of traditional SRR methods. The full utilization of the endmember spectral matrix and endmember abundance matrix of HSI and multispectral imagery (MSI) reconstructs the high spatial resolution and high spectral fidelity HSI. Furthermore, given the ZY-1 02D HSI infrared bands are seriously corrupted by noise, the influence of denoising on the SRR accuracy is also discussed. Experiments show that the proposed method restores spatial details and spectral information and is robust for noise, preserving more spectral information. Therefore, the proposed method is a ZY-1 02D HSI SRR method with high spatial resolution and high spectral fidelity, which improves the spatial resolution while simultaneously solving spectral mixing and provides the possibility for the data further expansion.
1. Introduction
The ZY-1 02D Satellite, a 5 m optical satellite, is the first Chinese operational civil hyperspectral satellite [1]. It can effectively obtain MSI and HSI concurrently, meeting the needs for natural resource management, ecological monitoring, urban and rural construction, emergency management, and other related applications [2]. However, the current payload scale and development costs limit the high spatial resolution of the ZY-1 02D HSI, leading to spectral mixing and limiting the resolvability and quantitative analysis of complex ground objects. The applicability of ZY-1 02D HSI may be further expanded by enhancing its spatial resolution [3].
Present techniques for improving HSI spatial resolution can be categorized as: hardware-based, software-based, and methods combining hardware and software. Hardware-based methods improve the spatial resolution of HSI by directly reducing the pixel size, increasing the number of pixels per unit area by sensor manufacturing techniques [4], or implementing hardware accelerators in field-programmable gate array (FPGA) devices [5,6,7]. Concerning the high cost and limitations of resolution enhancement through hardware-based techniques [8], scholars have undertaken a great deal of research concerning the combination of hardware and software approaches, which generally enhances the HSI spatial resolution by changing the angle of the Charge Coupled Device (CCD) and joint image processing algorithm [9,10,11]. However, these methods can only be used for specific imagery due to the sensor’s sampling method. Furthermore, the high cost of improving the HSI spatial resolution using hardware has made lower-cost software-based techniques more popular with scholars, among which SRR is widely used [12].
Image SRR is a signal processing technology that reconstructs high-resolution images from low-resolution images suffering from noise, blurring, and aliasing effects [4,13]. Over the past several decades, many SRR methods have been proposed under different frameworks, including component substitution (CS), Bayesian, deep learning (DL), and sparse representation (SR) [14]. CS includes such methods as Gram–Schmidt and principal component analysis (PCA). Although promoting the SRR efficiency, Gram–Schmidt results highly depend on the simulated HSI [15]. PCA-based methods have been popular for spectral transformation because the first principal component consists of the most variance, making it a suitable choice to replace the panchromatic component [16]. However, this method creates more spectral artifacts for imageries consisting of vegetation [17]. Gonzalez-Audicana et al. proposed a pan-sharpening method based on a merger of a wavelet–PCA to overcome this issue. However, their approach only utilizes the details of the first principal component replaced by the details of the PAN imagery [18] while ignoring the relationship between variance and correlation. Shah et al. overcome this limitation with an adaptive PCA-contourlet approach for pan-sharpening [17]. PCA-contourlet provides more effective spatial transformation than wavelet during pan-sharpening. However, such CS-based approaches often introduce spectral distortions in the SRR [19].
Bayesian-based SRR often finds the maximization posteriori estimator by combining the likelihood function and the defined appropriate image prior; for example, Zou et al. developed a Bayesian dictionary learning method for HSI SRR in the presence of mixed Poisson-Gaussian noise [20]. Vella et al. improved imagery quality by integrating learning and model-based methods to fuse the HSI and MSI, guaranteeing consistency in the spatial and spectral measurements [21]. Bungert et al. presented a novel model for simultaneous imagery fusion and blind deblurring of HSI based on the total directional variation, achieving good results on real remote sensing data from plant sciences and urban monitoring [22]. Akhtar et al. proposed an HSI SRR approach that fuses high-resolution imagery with low-resolution HSI using non-parametric Bayesian sparse representation [23]. However, these methods require prior knowledge depending on assumptions, so they are not always flexible to adapt to different HSI structures [24].
Since DL has been demonstrated to be very effective in object detection [25,26,27,28], classification [29,30,31], and natural image super-resolution [32,33,34], many researchers have introduced DL into HSI SRR. Using a deep HSI denoiser to leverage both domain knowledge likelihood and deep image prior, Dong et al. designed an iterative HSI SRR algorithm with excellent generalization [35]. Wei et al. introduced a novel deep recursive network for HSI SRR, with a fully end-to-end HSI structure with improved spectral reconstruction results [36]. Zheng et al. enhanced the computation of prior point spread function (PSF) and spectral response function (SRF) in SRR by using an unsupervised DL-based fusion method HyCoNet [37]. Yao et al. enhanced HSI spatial resolution through high spatial resolution MSI by cross-attention mechanism-based coupled unmixing network CUCaNet [38]. Inspired by the non-negative matrix factorization, Liu et al. designed an unsupervised MIAE network for HIS SRR [39]. Admittedly, these methods need an auxiliary higher resolution co-registered imagery, which is sometimes unavailable [40]. For this reason, Wang et al. proposed a novel dilated projection correction network aeDPCN using single low-resolution HIS for SRR [41]. However, DL-based methods often require many samples to train deep neural networks, which limits their application in specific scenarios. Training an excellent deep neural network also takes a lot of time [24].
Combined with matrix decomposition and spectral unmixing, SR-based methods have been widely used for HSI SRR in recent years, which have improved the spatial resolution and solved the spectral mixing of HSI [19,42]. Dong et al. proposed a non-negative structured sparse representation (NSSR) approach for HSI SRR [43]. However, the structured SR is only used to estimate the coefficient matrix, not for the spectral dictionary learning. To improve accuracy, Guo et al. proposed a non-negative clustering-based sparse representation (NNCSR) model [44], which jointly estimates hyperspectral dictionary and the sparse coefficients based on the spatial-spectral sparsity of the HSI. Yet they often ignore the original structure of HSI [45]. To fully consider the spatial/spectral subspace low rank relationships between available HSI/MSI and latent HSI, Xue et al. presented a novel structured sparse low-rank representation (SSLRR) method for HSI SRR [46]. Zhang et al. proposed an HSI and MSI fusion framework based on a novel group spectral embedding by exploring the multiple manifold structures of spectral bands and the low-rank structure of HSI [47]. Yokoya et al. used coupled non-negative matrix factorization (CNMF) to obtain high-resolution HSI, using non-negative matrix factorization to obtain the endmember spectral matrix and the endmember abundance matrix of HSI and MSI [48]. Borsoi et al. proposed an HSI and MSI fusion algorithm with spectral variability (FuVar) to reconstruct high-resolution HSI, employing an unmixing-based formulation and accounting for spectral mismatches between the two imageries [49]. Lanaras et al. presented an SRR method (ICCV15) using joint unmixing of the input HSI and MSI into the pure reflectance spectra of the observed materials and the associated mixing coefficients [50]. However, using only a spectral dictionary is insufficient for preserving spatial information and vice versa [14]. Therefore, Han et al. addressed the problem by fusing HSI and MSI-based optimized dictionaries [51]. Akhtar et al. proposed an SR-based approach (ECCV14) for HSI SRR [52]. Li et al. introduced a spatial group sparsity regularization unmixing-based method for HSI SRR, which obtained high-resolution imagery by entirely using the sparsity and deconvolution matrix of HSI [53].
This study aims to enhance the spatial resolution of ZY-1 02D HSI using the SRR method. Although most SRR methods have realized high reconstruction accuracy previously, they were usually applied in the simulated data, in which the proportion among the fusing imageries is an integer. Unfortunately, the ZY-1 02D imageries lack this integer proportion characteristic due to the inherent limitations during acquisition. Consequently, these methods perform poorly when applied to such data. In addition, ZY-1 02D HSI includes substantial noise in the infrared bands leading to poor data quality.
To overcome these difficulties, we propose an endmember matrix constraint unmixing SRR method in this research. Firstly, the proposed method reconstructs ZY-1 02D HSI with high spatial resolution and high spectral fidelity by adding novel smoothing constraint terms in non-negative matrix factorization. Thus, preserving more information on the endmember matrices. Secondly, the unmixing-based theory makes the proposed method remove noise available while improving the resolution.
2. Materials and Methods
This section presents the data, the proposed SRR methods, and the quality measures used in the research.
2.1. Data
Two datasets are used in the approach: Hyperspec-VNIR Chikusei and ZY-1 02D.
Hyperspec Chikusei is an airborne HSI dataset acquired by Headwall Hyperspec-VNIR-C imaging sensor (Headwall Photonics Inc., located in Bolton, MA, USA) over agricultural and urban areas in Chikusei, Ibaraki, Japan, on 29 July 2014. It comprises 128 bands in the spectral range from 363 to 1018 nm and 2517 × 2335 pixels with a GSD of 2.5 m [54]. We selected an image of the dimension 540 × 420 pixels for this experiment (Figure 1a).
The ZY-1 02D Satellite contains MSI and HSI in the same time–space. The HSI data has a spatial resolution of 30 m, 166 spectral bands, and a spectral range of 400~2500 nm. The MSI data has a spatial resolution of 10 m, eight spectral bands, and a spectral range of 486~959 nm. Therefore, we selected MSI with 600 × 600 pixel size (Figure 1b) and HSI with 178 × 198 pixel size (Figure 1c) for the experiment.
2.2. Methods
This section introduces the proposed method’s theoretical basis and the quality indices used in SRR.
2.2.1. HSI SRR by Endmember Matrix Constraint Unmixing
The proposed SRR method estimates unobserved high-spatial-resolution HSI (HR-HSI) from observable low-spatial-resolution HSI (LR-HSI) and high-spatial-resolution MSI (HR-MSI) . and denote the number of spectral channels of multispectral and hyperspectral sensors and and denote the number of pixels of HR-MSI and LR-HSI, respectively. Moreover , . We assume that the data has been denoised, radiometrically corrected, and geometrically corrected.
SRR Model
Linear spectral mixture modeling is often used to estimate LR-HSI due to its simplicity and efficiency. The model considers HSI a linear combination of a certain number of pure endmembers. Therefore, can be formulated as follows:
- is the spectral signature matrix, with each column vector representing the endmember spectrum and being the number of endmembers.
- is the abundance matrix, with each column vector denoting the abundance fractions of all endmembers at each pixel.
- is the residual.
In practical applications, HR-HSI can be reconstructed only by solving and .
The solution of Equation (1) relies on the original LR-HSI and HR-MSI in the SRR. However, according to the sensor observation model proposed by Yokoya et al. [48], LR-HSI can be a degenerate form of HR-MSI in the spatial dimension; and HR-MSI can be a degenerate form of HR-HSI in the spectral dimension. Consequently, and can be modeled as:
- is the spatial spread transform matrix, with each column vector representing the transformation of the PSF from the MSI to the HSI.
- is the spectral response transform matrix, with each row vector representing the transformation of the SRF from the hyperspectral sensor to the multispectral for each band.
- and are sparse matrices composed of non-negative components.
- and are the residuals.
Putting Equation (1) into (2) and (3), we can get:
- denotes the spatially degraded abundance matrix.
- denotes the spectrally degraded endmember matrix.
They can be described as:
Endmember Matrix Constraint Unmixing
Based on the non-negative matrix factorization theory, the proposed method iteratively updates the endmember spectral matrix and endmember abundance matrix decomposed from the LR-HSI and HR-MSI until the required HR-HSI is solved. It can be represented by the Figure 2.
To maintain the spectral information and spatial details of the SRR results in processing the real data, we add sparse constraint terms based on the CNMF [48]. Consequently, the proposed SRR model can be expressed using the following formulas:
- and .
- denotes F-norm.
- and are penalty terms constraining the solution of the formulas.
- and are their corresponding Lagrange multipliers, or the regularization parameters. The solution efficiency of different penalty terms varies from different actual problems.
In addition, according to the research of Pauca et al. [55], in each iteration step, a small positive number is added to the denominator as an adjustment. This study sets in the experiment. Therefore, the final update criterion is as follows:
2.2.2. Quality Measures
We use the following six complimentary and widely used quality indices for the quantitative SRR assessment: (1) mean peak signal-to-noise ratio (MPSNR); (2) cross-correlations (CC); (3) structure similarity index (SSIM); (4) root mean squared error (RMSE); (5) relative dimensionless global error in synthesis (ERGAS); and (6) spectral angle mapper (SAM). Lagger MPSNR, SSIM, CC and smaller RMSE, ERGAS, SAM, indicates better SRR results. The definitions are as follows:
3. Experiment Results
Many aforementioned methods such as the single-image-based methods are more practical for SRR. However, the ZY-1 02D satellite can effectively obtain MSI and HSI concurrently, providing auxiliary higher resolution co-registered imagery. Therefore, the proposed method is based on the fusion mechanism. In addition, five methods, with the same theoretical basis, are compared to evaluate the performance of our method. All these methods can be divided into DL- and model-based approaches. The DL-based method is MIAE [39]. The model-based methods are FuVar [49], ECCV14 [52], ICCV15 [50], CNMF [48], and our method.
3.1. The Simulated Data
The experiments were performed on Hyperspec Chikusei data. Firstly, the HR-HSI was down-sampled to obtain the simulated LR-HSI and HR-MSI [56]. Then, the SRR results were compared with the original HR-HSI to verify the effectiveness of the proposed method.
Figure 3 shows the results of SRR in the Hyperspec Chikusei simulated data. The RGB bands used in the color composite imagery of HSI and MSI are 55, 37, 22, and 4, 3, and 2, respectively. The color-composite error images (Figure 3b) visualize the spatial distribution of errors in RGB bands, where blue pixels mean no fusion error and colored pixels indicate local spectral distortion. It is essential to reveal the error characteristics of individual bands, because they significantly impact many applications based on spectral indices and band ratios that select very few specific bands [56]. The RMSE images visualize the magnitude of the error at each pixel spectrum. The SAM images visualize the spatial distribution of spectral angle errors.
The FuVar has the most prominent error in the color-composite error, RMSE, and SAM images. The reason is that many parameters in FuVar need to be known or estimated previously. Thus, the FuVar is sensitive to prior knowledge, leading to poor performance only using the available LR-HSI and HR-MSI. For the other five methods, finding the differences from the color composite imageries in Figure 3a is challenging. However, Figure 3b,d show that MIAE has a relatively large error, and then ICCV15 and ECCV14, CNMF and the proposed method have better and approximate results.
Table 1 presents the quantitative evaluation indices of the SRR results of the six methods, which quantify the SRR abilities from space, spectra, and time, respectively. According to the function of each evaluation index in Section 2.2.2, the proposed method achieves the best results except the time. At the same time, CNMF achieves the highest time efficiency compared with other methods. The reason is that the added constraint items of the proposed method require extra solving time.
Figure 4 shows the variation in the six indices with the number of endmembers in the Hyperspec Chikusei simulated data of the proposed method. The performance of the proposed method improves with an increase in the number of endmembers finally saturating. Furthermore, results indicate that time efficiency is proportional to the number of endmembers. According to the characteristics of HSI, this is reasonable because a linear combination of more varying endmember spectra enables a more accurate expression of all pixel spectra in the data until the endmember variety becomes sufficient. Owing to the abundance sum-to-one, the optimal endmember D may be larger than the actual object types in the scene. This leads to the calculated number of pure endmembers that include not only single objects but also shadows and mixed pixels [48]. Therefore, the number of pure endmembers may exceed the object types in the imagery. We conclude that 30 endmembers has the best performance when the proposed method is applied to the Hyperspec Chikusei simulated data.
Table 2 illustrates the effect of the constraints on the proposed method in the Hyperspec Chikusei simulated data. and were set as 0.00, 0.05, 0.10, 0.15, 0.30, 0.40, 0.50, and 0.60 respectively, and fixed endmembers at 30. We conclude that with the increase in the and , the indices gradually become better, but the quality of the SRR results begins declining when and are 0.40. This decline is due to using the multiplicative update principle in this method, which is a gradient descent criterion with a variable step size. Namely, and affect the gradient step size, affecting the smoothness of the solutions of Equations (8) and (9). Accordingly, the appropriate and can ensure the method converges at the optimal point to the greatest extent. Furthermore, the time efficiency of the proposed methods is comparable when and are between 0.15 and 0.50, especially with 0.15 taking the shortest time. To summarize, the proposed method has the best SRR results when and are 0.30.
3.2. ZY-1 02D HSI
Figure 5 presents the SRR results of the six methods on ZY-1 02D HSI. The RGB bands used in the color composite imagery of HSI and MSI are 35, 19, 11, and 4, 3, 2, respectively. Obviously, the FaVur has the relatively poorest SRR result. It produced a “mosaic” result with the lowest reconstructed quality. MIAE and ECCV14 reconstruct the spatial details but result in massive spectral distortion; significant differences exist between the SRR result and the original HSI in the color composite imagery. On the contrary, ICCV15 has good spectral fidelity but poor spatial details. Nevertheless, CNMF and the proposed method all achieve better results in spatial and spectral dimensions; furthermore, the spatial resolution of the reconstructed HSI was significantly improved, and the color information of the ground objects is correct. However, the CNMF inadequately solves the mixed spectrum at some edges and does not recover the spatial detail well.
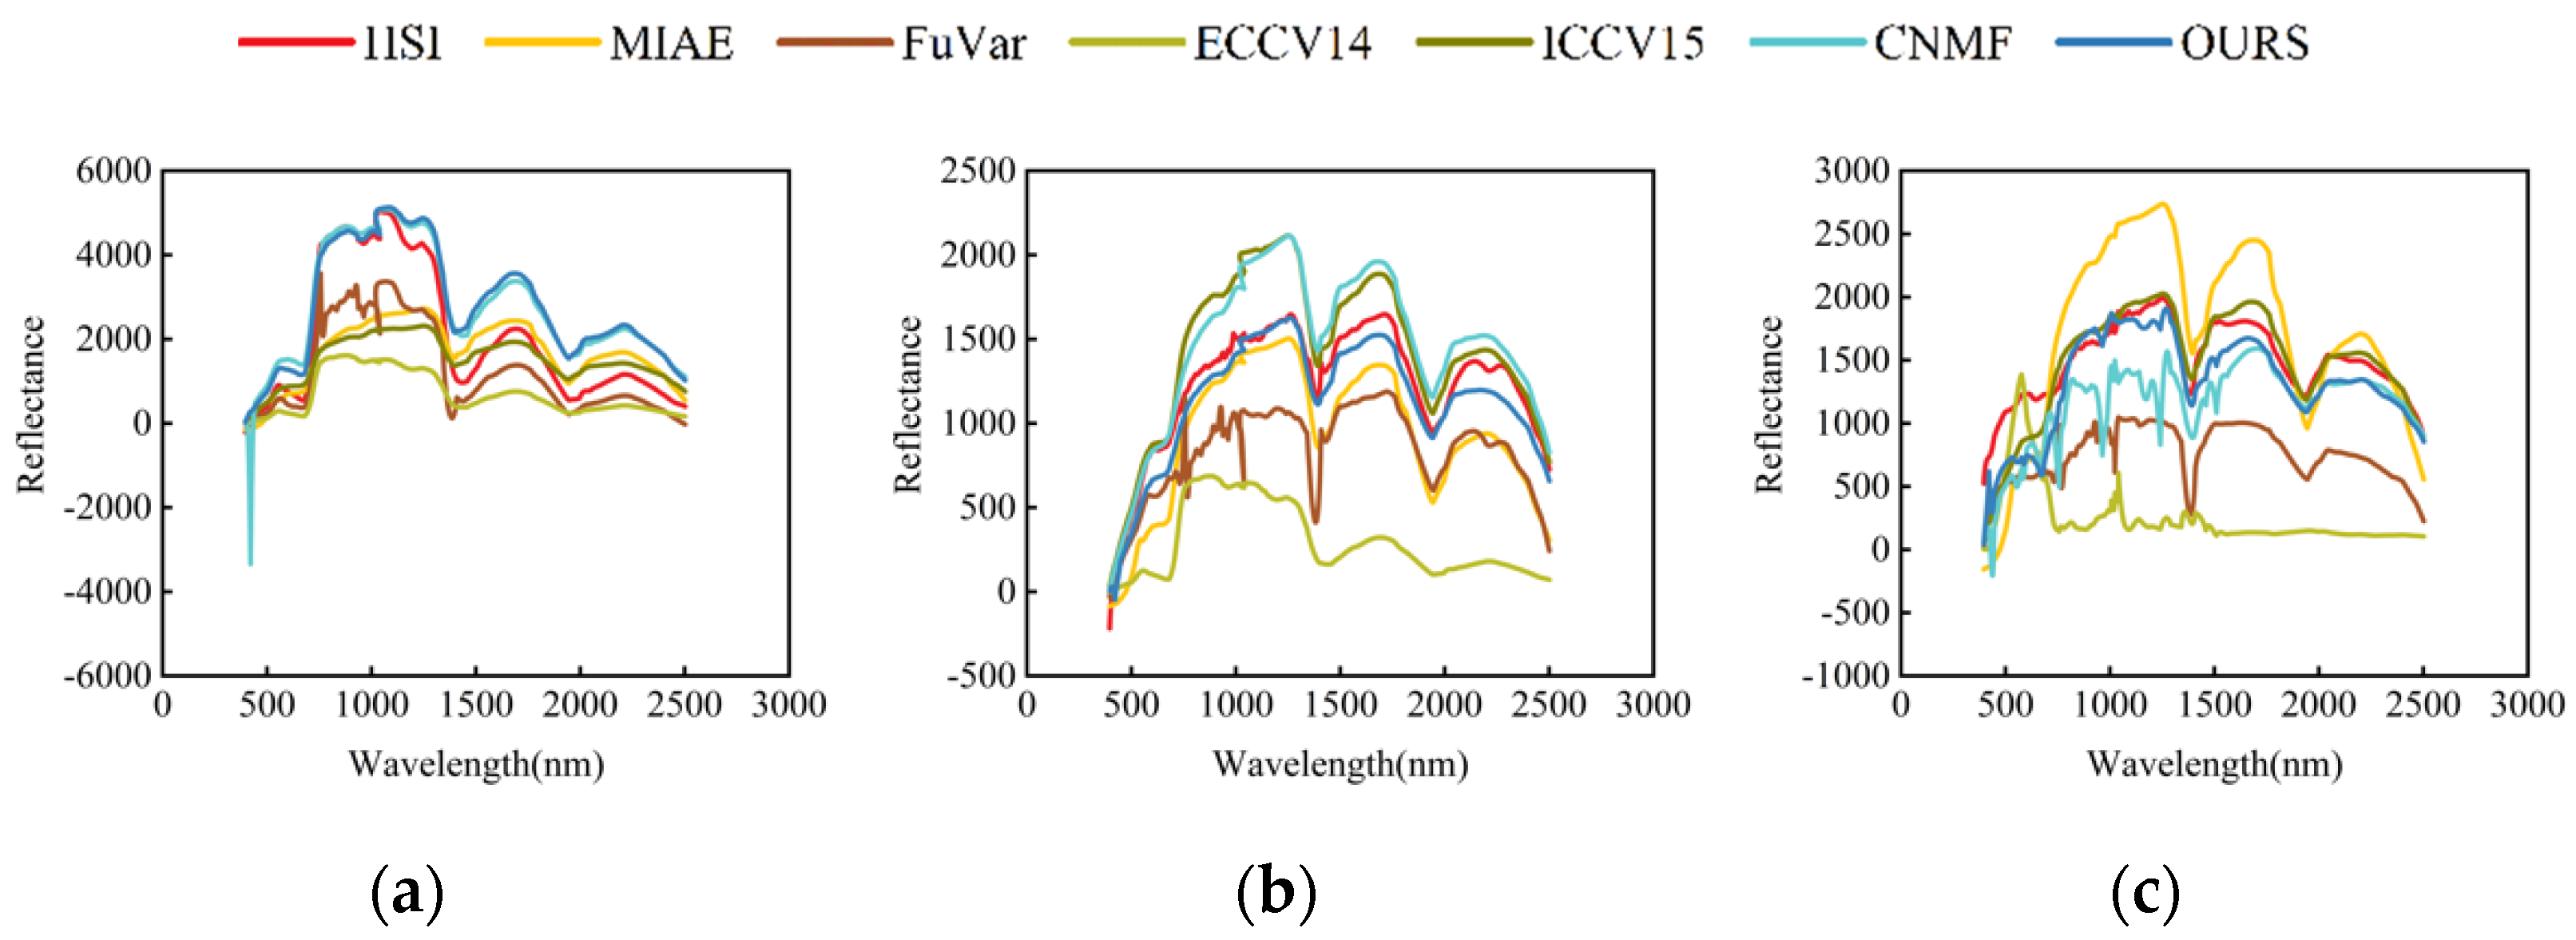
Figure 6 shows the spectral lines of ZY-1 02D HSI SRR results for different methods: vegetation, soil, and blue-roofed building. Compared with the original HSI spectral lines, MIAE fits better for soil but lower for others. FuVar and ICCV14 poorly fit the three types of ground objects. On the other hand, ECCV15 is a better fit for blue-roofed buildings but lower for the others. The fitting effect of CNMF and the proposed method is similar, but the proposed method is higher for blue-roofed buildings.
Table 3 presents the quantitative evaluation indices of the six methods SRR results in the ZY-1 02D HSI. According to the function of each evaluation index in Section 2.2.2, MIAE achieves the best CC and SSIM. The reason is that the imagery sizes of HSI and MSI used in the experiment are 178 × 198 and 600 × 600 pixels, respectively; therefore, the imagery size of the reconstructed HR-HSI is 600 × 600. In addition, there is no reference HR-HSI for the ZY-1 02D data, the original LR-HSI is selected to qualify the method’s performance. Additionally, the MIAE SRR result is very similar to the LR-HSI spatially (Figure 5). Thus, the CC and SSIM, which characterize the geometric distortion, to quantify the reconstructed results contain some errors. However, the proposed method achieves the optimal indices for the others. Especially, the ERGAS, which offers a global indication of the quality of a fused imagery [57], achieves the best value. In addition, the CNMF has the highest time efficiency.
Figure 7 shows the variation in the six indices with the number of endmembers in the ZY-1 02D HSI experimental data of the proposed method, which are similar to the performance in the Hyperspec Chikusei simulated data.
The performance of the proposed method improves with an increase in the number of endmembers and finally saturates from Figure 7a,b,d,e. However, Figure 7c shows the apparent fluctuation of SSIM with the increase in the number of endmembers. The reason is that, without the referenced HR-HSI, the original LR-HSI is selected to qualify the method’s performance. Yet significant differences exist between the spatial resolution of LR-HSI and reconstructed HR-HSI. Thus, the SSIM is low and unstable. The SAM also fluctuates in a small range with the endmember variations in Figure 7f, and the values are between 6 and 9 when the endmember is greater than 28. One of the possible reasons is that the resolution between HSI and corresponding MSI of ZY-1 02D is not an integer, so errors may occur during endmember unmixing, resulting in fluctuations in spatial structure and spectral similarity.
Thirty endmembers were used with the proposed method applied to ZY-1 02D experimental data, combining quantitative and qualitative indices.
3.3. ZY-1 02D HSI SRR Results for before and after Denoising
Due to severe noise in infrared bands of ZY-1 02D HSI, denoising is performed before SRR. Admittedly, denoising will affect the high-frequency information of images. Therefore, this section introduces the SRR results before and after denoising of ZY-1 02D HSI from the color composite imageries, single-band imageries, spectral lines, and quantitative evaluation indices.
Figure 8 illustrates the color composite imageries before and after denoising. The bands of color composite imageries of HSI and MSI are the same in Figure 5. Compared with HSI and MSI in Figure 8a, we can conclude that MIAE obtains a relatively blurry scene. FuVar achieves the poorest SRR results whether denoised or not. ECCV14 retains more spatial details than the spectral information from the SRR results before and after denoising. On the contrary, ICCV15 preserves spectral information better than the remaining spatial details and ICCV15 SRR results preserve more spatial details after denoising. Both CNMF and the proposed method have an excellent ability to preserve the spatial detail and spectral information, whether denoised or not.
Comparing SRR results of all noisy single-band imageries before and after denoising (Figure 9 shows the 160th band with the most severe noise corruption), it is revealed that MIAE and FuVar reconstruct the spatial details poorly, but the latter cannot remove the most noise compared to the first. ECCV14 recovers more spatial details before denoising but is incapable of removing noise. While restoring spatial details, ICCV15 also removes most of the noise in the result before denoising. Although noise in the SRR results of ICCV15 are reduced after denoising, some spatial details are lost, such as object edge contours. The SRR results of CNMF and the proposed method before and after denoising remove most of the noise while improving the resolution of the imagery and restoring the edges of objects and spatial details excellently.
Table 4 shows the quantitative evaluation indices of the six SRR methods results before denoising. According to the function of each evaluation index in Section 2.2.2, ICCV15 achieves the best SAM. Additionally, the MPSNR, RMSE, and ERGAS of CNMF are the best. The CC, SSIM, and time efficiency of the proposed method are the best.
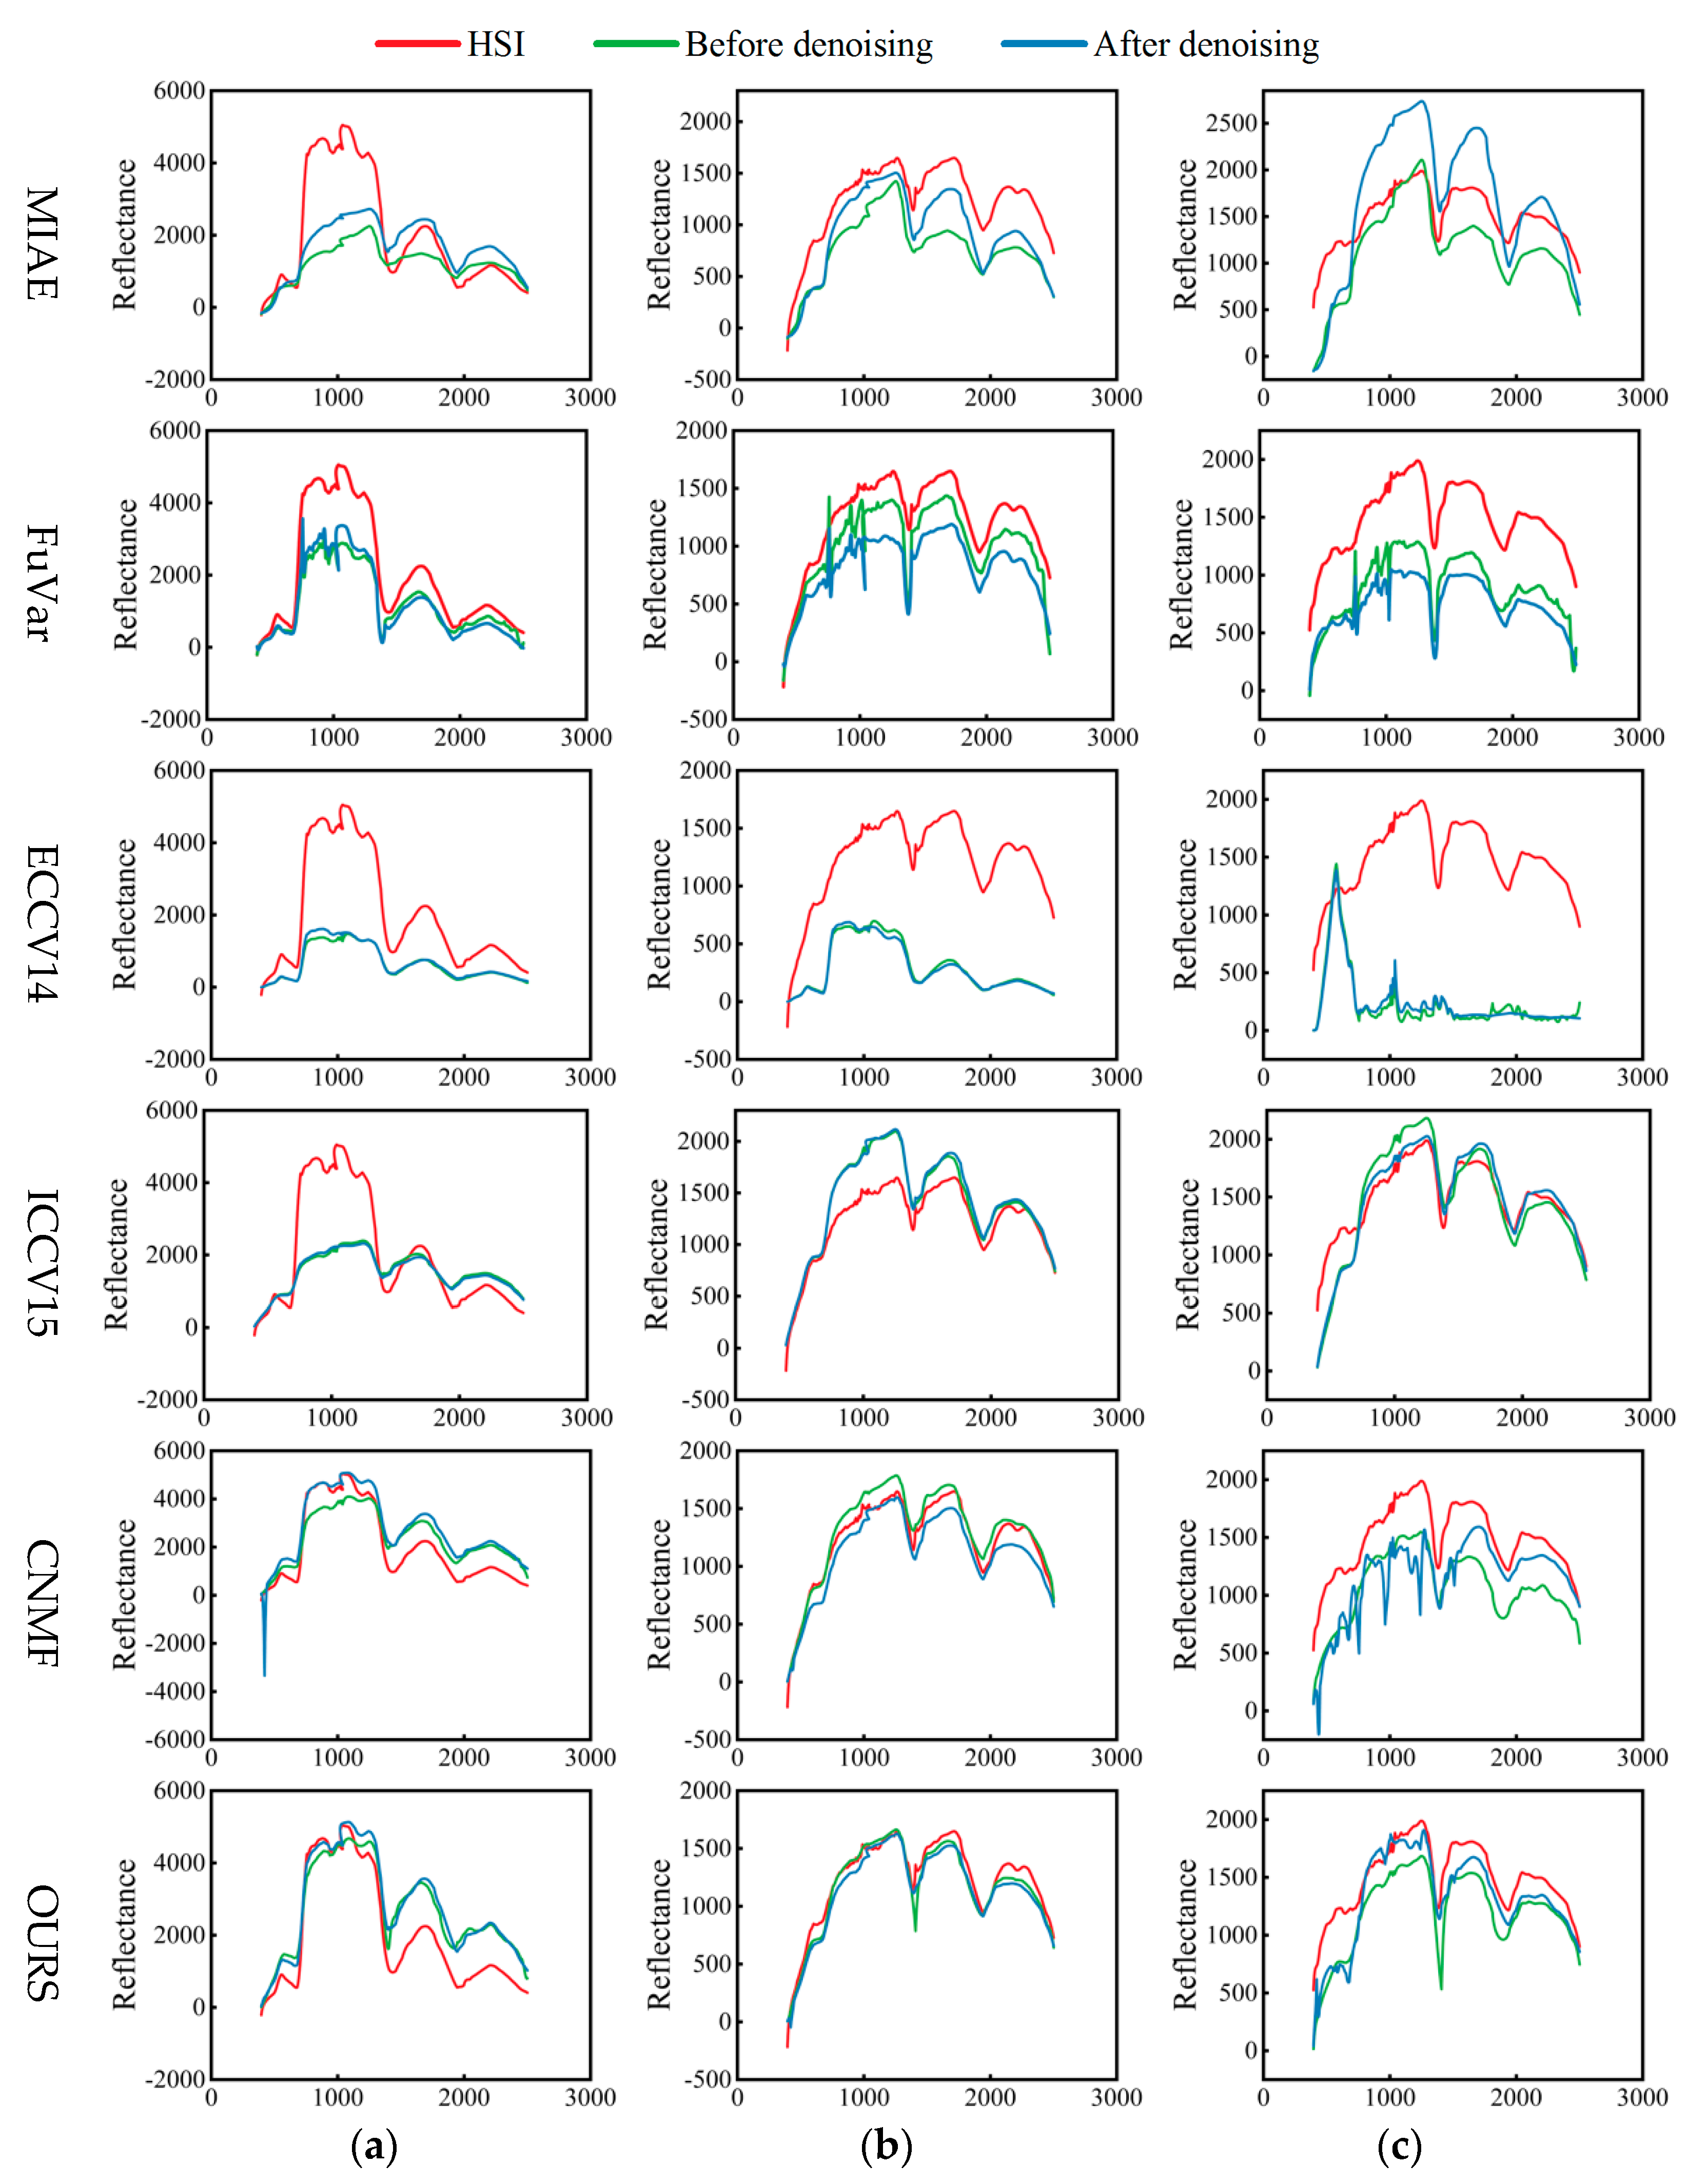
Figure 10 shows the spectral lines of ZY-1 02D HSI SRR results for different materials: vegetation, soil, and blue-roofed building. MIAE best fits the spectral lines of the soil relatively after denoising, but poorly for the others. The three spectral lines of FuVar and ECCV14 fit poorly with original spectral lines both before and after denoising, indicating the highest distortion of its SRR results. ICCV15 has a better-fitted result of the spectral line of the blue-roofed building after denoising. For CNMF, the spectral lines of the blue-roofed building before and after denoising are quite different from the original, while the spectral line of the soil after denoising fits well with the original. Notably, the vegetation spectral line of CNMF after denoising has some outliers. At the same time, the proposed method has the best fitting effect of all three spectral lines after denoising.
4. Discussion
4.1. SRR via Constraint Endmember Matrix Unmixing
Most of the traditional SRR methods are applied to simulated datasets, in which the proportion of resolution between HSI and corresponding MSI is an integer achieving high SRR accuracy. Unfortunately, these methods often achieved lower SRR accuracy when applied to the ZY-1 02D data. Our proposed method added endmember matrix constraint terms to traditional the non-negative matrix factorization, guiding Formulas (8) and (9) to conduct smoothing solutions to improve the usability of SRR on ZY-1 02D data. This measure enables the proposed method to fully utilize the properties of endmember matrices of HSI and MSI during SRR, thereby retaining more spatial details and spectral information.
Spectral unmixing and SRR can amplify each other in an interactive feedback framework. Hence the unmixing-based SRR not only enhances the spatial resolution but also solves the mixing pixels in HSI [58]. Linear spectral mixing (LMM) models are widely used in spectral unmixing with simplicity and efficiency [59]. The endmember abundance mapping in Figure 11 corresponds to easily recognizable surface materials observed in the ZY-1 02D HSI scene. Even though these are not always “pure materials” in the physical sense, they look realistic and comparatively clean due to inter-reflections and shadows. This confirms the conventional wisdom that the LMM is sufficient for many HSI imaging problems, particularly SRR [60].
The quantitative evaluation indices of spectral information of Hyperspec Chikusei simulated data and ZY-1 02D experimental data (Table 1 and Table 3) illustrate that the proposed method achieves the best MPSNR, RMSE, ERGAS, and SAM when compared to other methods. Furthermore, from the visual results (Figure 5) and the spectral line graphs (Figure 6), the proposed method also has less noise and the best spectral line fitting. This improvement is due to the proposed method’s non-negative endmember matrices and sum-to-one constraint, which avoids outliers and artifacts in SRR results [60]. Therefore, the proposed method can realize spectral unmixing during SRR.
To summarize, the proposed SRR method is suitable for ZY-1 02D data, improving the spatial resolution and preserving more spectral information.
4.2. Denoising Effect on SRR for ZY-102D HSI
Since the proposed method is based on spectral unmixing, the predefined number of endmembers is the corresponding subspace. Denoising means reducing the dimension of high-dimensional noisy data, separating noise in a signal subspace [61]. Consequently, subspace-based methods naturally imply denoising ability [57]. The results also logically illustrate that the proposed method can remove most noise during SRR (Figure 8, Figure 9 and Figure 10). However, the proposed method mainly implements SRR. Thus, some bands still contain some noise.
Consequently, we preprocessed the ZY-1 02D HSI noisy bands using subspace-based non-local low-rank and sparse factorization (SNLRSF) [62]. Typically, denoising will change the part of the high-frequency information of the imagery and influence SRR correspondingly. Accordingly, we set up the control experiment to explore whether to denoise previously.
The control experiment results (Section 3.3) reveal that preprocessing the ZY-1 02D HIS noised bands before SRR can preserve more information and achieve better results.
4.3. Future Works
The proposed method adds novel smoothing constraints to non-negative matrix factorization, improving the SRR accuracy for ZY-1 02D HSI. However, small-window images were selected in our experiments instead of the whole scene. Future works will be carried out to extend the proposed method for the whole scenes or realize the adaptive parameter blocking strategy for large-scale scenes to promote the broader application of ZY-1 02D HSI.
5. Conclusions
This study proposed an endmember matrix constraint unmixing method for ZY-1 02D HSI SRR. The proposed method adds endmember matrix constraint terms to the non-negative matrix factorization, which not only enhances the spatial resolution but also realizes the spectral unmixing vastly. In addition, regarding the severe noise in the infrared bands of ZY-1 02D HSI, the influence of denoising on SRR is also discussed. Experimental results on simulated and ZY-1 02D data demonstrate that the proposed method is suitable for ZY-1 02D HSI SRR.
Author Contributions
Conceptualization, A.Z. and X.Z. (Xintong Zhang); methodology, X.Z. (Xintong Zhang) and A.Z.; software, X.Z. (Xintong Zhang); validation, A.Z., X.Z. (Xintong Zhang) and H.G.; formal analysis, X.Z. (Xintong Zhang) and X.Z. (Xizhen Zhang); investigation, X.Z. (Xintong Zhang), A.Z. and H.G.; resources, A.Z.; data curation, A.Z.; writing—original draft preparation, X.Z. (Xintong Zhang) and X.Z. (Xizhen Zhang); writing—review and editing, A.Z., R.P., X.Z. (Xintong Zhang) and X.Z. (Xizhen Zhang); visualization, X.Z. (Xintong Zhang); supervision, A.Z.; project administration, A.Z.; funding acquisition, A.Z. All authors have read and agreed to the published version of the manuscript.
Funding
This research was funded by the National Natural Science Foundation of China, Grant Number (42071303, 41571369), and National Science and Technology Basic Resources Survey Program of China, Grant Number 2019FY101300, and Joint program of Beijing Municipal Education Commission and Beijing Municipal Natural Science Foundation, Grant Number KZ202110028044.
Data Availability Statement
Not applicable.
Acknowledgments
The authors would like to thank the Land Satellite Remote Sensing Application Center, Ministry of Natural Resource China, for generously providing the experiment data of the ZY-1 02D Satellite presented in this paper.
Conflicts of Interest
The authors declare no conflict of interest. The funders had no role in the design of the study; in the collection, analyses, or interpretation of data; in the writing of the manuscript, or in the decision to publish the results.
Abbreviations
The following abbreviations are used in this manuscript:
| HSI | Hyperspectral Imagery |
| SRR | Super-Resolution Reconstruction |
| MSI | Multispectral Imagery |
| CS | Component Substitution |
| DL | Deep Learning |
| SR | Sparse Representation |
| PCA | Principal Component Analysis |
| PSF | Point Spread Function |
| SRF | Spectral Response Function |
| CNMF | Coupled Non-Negative Matrix Factorization |
| HR-HSI | High-Spatial Resolution HSI |
| LR-HSI | Low-Space Resolution HSI |
| HR-MSI | High-Space Resolution |
| MPSNR | Mean Peak Signal to Noise Ratio |
| CC | Cross Correlations |
| SSIM | Structure Similarity Index |
| RMSE | Root Mean Squared Error |
| ERGAS | Relative Dimensionless Global Error in Synthesis |
| SAM | Spectral Angle Mapper |
References
- Lu, H.; Qiao, D.; Li, Y.; Wu, S.; Deng, L. Fusion of China ZY-1 02D Hyperspectral Data and Multispectral Data: Which Methods Should Be Used? Remote Sens. 2021, 13, 2354. [Google Scholar] [CrossRef]
- Zhang, H.; Han, B.; Wang, X.; An, M.; Lei, Y. System design and technique characteristic of ZY-1-02D satellite. Spacecr. Eng. 2020, 29. [Google Scholar] [CrossRef]
- Guo, H.; Han, B.; Wang, X.; Tan, K. Hyperspectral and Multispectral Remote Sensing Images Fusion Method of ZY-1-02D Satellite. Spacecr. Eng. 2020, 29, 180–185. [Google Scholar]
- Park, S.C.; Park, M.K.; Kang, M.G. Super-resolution image reconstruction: A technical overview. IEEE Signal Process. Mag. 2003, 20, 21–36. [Google Scholar] [CrossRef]
- Besiris, D.; Tsagaris, V.; Fragoulis, N.; Theoharatos, C. An FPGA-based hardware implementation of configurable pixel-level color image fusion. IEEE Trans. Geosci. Remote Sens. 2011, 50, 362–373. [Google Scholar] [CrossRef]
- Mamatha, G.; Sumalatha, V.; Lakshmaiah, M.V. FPGA implementation of satellite image fusion using wavelet substitution method. In Proceedings of the 2015 Science and Information Conference (SAI), London, UK, 28–30 July 2015; pp. 1155–1159. [Google Scholar]
- Chauhan, R.P.S.; Dwivedi, R.; Asthana, R. A high-speed image fusion method using hardware and software co-simulation. In Proceedings of the International Conference on Information and Communication Technology for Intelligent Systems, Ahmedabad, India, 25–26 March 2017; pp. 50–58. [Google Scholar]
- Yue, L.; Shen, H.; Li, J.; Yuan, Q.; Zhang, H.; Zhang, L. Image super-resolution: The techniques, applications, and future. Signal Process. 2016, 128, 389–408. [Google Scholar] [CrossRef]
- Zhou, C.; Tian, Y.; Ji, T.; Wu, S.; Zhang, F. The Study of Method for Improving the Spatial Resolution of Satellite Images with CCD Cameras. J. Remote Sens. 2002, 6, 179–182. [Google Scholar]
- Zhang, X.; Zhang, A.; Li, M.; Liu, L.; Kang, X. Restoration and Calibration of Tilting Hyperspectral Super-Resolution Image. Sensors 2020, 20, 4589. [Google Scholar] [CrossRef] [PubMed]
- Zhang, K.; Yang, C.; Li, X.; Zhou, C.; Zhong, R. High-Efficiency Microsatellite-Using Super-Resolution Algorithm Based on the Multi-Modality Super-CMOS Sensor. Sensors 2020, 20, 4019. [Google Scholar] [CrossRef]
- Wang, J.; Wu, Z.; Lee, Y.-S. Super-resolution of hyperspectral image using advanced nonlocal means filter and iterative back projection. J. Sens. 2015, 2015, 943561. [Google Scholar] [CrossRef]
- Farsiu, S.; Robinson, D.; Elad, M.; Milanfar, P. Advances and challenges in super-resolution. Int. J. Imaging Syst. Technol. 2004, 14, 47–57. [Google Scholar] [CrossRef]
- Li, X.; Zhang, Y.; Ge, Z.; Cao, G.; Shi, H.; Fu, P. Adaptive Nonnegative Sparse Representation for Hyperspectral Image Super-Resolution. IEEE J. Sel. Top. Appl. Earth Obs. Remote Sens. 2021, 14, 4267–4283. [Google Scholar] [CrossRef]
- Dalla Mura, M.; Vivone, G.; Restaino, R.; Addesso, P.; Chanussot, J. Global and local Gram-Schmidt methods for hyperspectral pansharpening. In Proceedings of the 2015 IEEE International Geoscience and Remote Sensing Symposium (IGARSS), Milan, Italy, 26–31 July 2015; pp. 37–40. [Google Scholar]
- Kwarteng, P.; Chavez, A. Extracting spectral contrast in Landsat Thematic Mapper image data using selective principal component analysis. Photogramm. Eng. Remote Sens. 1989, 55, 339–348. [Google Scholar]
- Shah, V.P.; Younan, N.H.; King, R.L. An efficient pan-sharpening method via a combined adaptive PCA approach and contourlets. IEEE Trans. Geosci. Remote Sens. 2008, 46, 1323–1335. [Google Scholar] [CrossRef]
- González-Audícana, M.; Saleta, J.L.; Catalán, R.G.; García, R. Fusion of multispectral and panchromatic images using improved IHS and PCA mergers based on wavelet decomposition. IEEE Trans. Geosci. Remote Sens. 2004, 42, 1291–1299. [Google Scholar] [CrossRef]
- Xu, Y.; Wu, Z.; Chanussot, J.; Wei, Z. Nonlocal patch tensor sparse representation for hyperspectral image super-resolution. IEEE Trans. Image Process. 2019, 28, 3034–3047. [Google Scholar] [CrossRef] [PubMed]
- Zou, C.; Xia, Y. Bayesian dictionary learning for hyperspectral image super resolution in mixed Poisson–Gaussian noise. Signal Process. Image Commun. 2018, 60, 29–41. [Google Scholar] [CrossRef]
- Vella, M.; Zhang, B.; Chen, W.; Mota, J.F.C. Enhanced Hyperspectral Image Super-Resolution via RGB Fusion and TV-TV Minimization. In Proceedings of the 2021 IEEE International Conference on Image Processing (ICIP), Anchorage, AK, USA, 19–22 September 2021; pp. 3837–3841. [Google Scholar]
- Bungert, L.; Coomes, D.A.; Ehrhardt, M.J.; Rasch, J.; Reisenhofer, R.; Schönlieb, C.-B. Blind image fusion for hyperspectral imaging with the directional total variation. Inverse Probl. 2018, 34, 044003. [Google Scholar] [CrossRef]
- Akhtar, N.; Shafait, F.; Mian, A. Bayesian sparse representation for hyperspectral image super resolution. In Proceedings of the IEEE Conference on Computer Vision and Pattern Recognition (CVPR), Boston, MA, USA, 7–12 June 2015; pp. 3631–3640. [Google Scholar]
- Zhang, M.; Sun, X.; Zhu, Q.; Zheng, G. A Survey of Hyperspectral Image Super-Resolution Technology. In Proceedings of the 2021 IEEE International Geoscience and Remote Sensing Symposium IGARSS, Brussels, Belgium, 11–6 July 2021; pp. 4476–4479. [Google Scholar]
- Han, J.; Zhang, D.; Cheng, G.; Liu, N.; Xu, D. Advanced deep-learning techniques for salient and category-specific object detection: A survey. IEEE Signal Process. Mag. 2018, 35, 84–100. [Google Scholar] [CrossRef]
- Liu, N.; Han, J. A deep spatial contextual long-term recurrent convolutional network for saliency detection. IEEE Trans. Image Process. 2018, 27, 3264–3274. [Google Scholar] [CrossRef]
- Protopapadakis, E.; Doulamis, A.; Doulamis, N.; Maltezos, E. Stacked autoencoders driven by semi-supervised learning for building extraction from near infrared remote sensing imagery. Remote Sens. 2021, 13, 371. [Google Scholar] [CrossRef]
- Cheng, G.; Zhou, P.; Han, J. Learning rotation-invariant convolutional neural networks for object detection in VHR optical remote sensing images. IEEE Trans. Geosci. Remote Sens. 2016, 54, 7405–7415. [Google Scholar] [CrossRef]
- Cheng, G.; Yang, C.; Yao, X.; Guo, L.; Han, J. When deep learning meets metric learning: Remote sensing image scene classification via learning discriminative CNNs. IEEE Trans. Geosci. Remote Sens. 2018, 56, 2811–2821. [Google Scholar] [CrossRef]
- Wu, H.; Prasad, S. Semi-supervised deep learning using pseudo labels for hyperspectral image classification. IEEE Trans. Image Process. 2017, 27, 1259–1270. [Google Scholar] [CrossRef]
- Lu, X.; Zheng, X.; Yuan, Y. Remote sensing scene classification by unsupervised representation learning. IEEE Trans. Geosci. Remote Sens. 2017, 55, 5148–5157. [Google Scholar] [CrossRef]
- Dong, C.; Loy, C.C.; He, K.; Tang, X. Image super-resolution using deep convolutional networks. IEEE Trans. Pattern Anal. Mach. Intell. 2015, 38, 295–307. [Google Scholar] [CrossRef]
- Lai, W.-S.; Huang, J.-B.; Ahuja, N.; Yang, M.-H. Fast and accurate image super-resolution with deep laplacian pyramid networks. IEEE Trans. Pattern Anal. Mach. Intell. 2018, 41, 2599–2613. [Google Scholar] [CrossRef]
- Ledig, C.; Theis, L.; Huszár, F.; Caballero, J.; Cunningham, A.; Acosta, A.; Aitken, A.; Tejani, A.; Totz, J.; Wang, Z. Photo-realistic single image super-resolution using a generative adversarial network. In Proceedings of the IEEE Conference on Computer Vision and Pattern Recognition (CVPR), Honolulu, HI, USA, 21–26 July 2017; pp. 4681–4690. [Google Scholar]
- Dong, W.; Zhou, C.; Wu, F.; Wu, J.; Shi, G.; Li, X. Model-guided deep hyperspectral image super-resolution. IEEE Trans. Image Process. 2021, 30, 5754–5768. [Google Scholar] [CrossRef]
- Wei, W.; Nie, J.; Li, Y.; Zhang, L.; Zhang, Y. Deep recursive network for hyperspectral image super-resolution. IEEE Trans. Comput. Imaging 2020, 6, 1233–1244. [Google Scholar] [CrossRef]
- Zheng, K.; Gao, L.; Liao, W.; Hong, D.; Zhang, B.; Cui, X.; Chanussot, J. Coupled convolutional neural network with adaptive response function learning for unsupervised hyperspectral super resolution. IEEE Trans. Geosci. Remote Sens. 2020, 59, 2487–2502. [Google Scholar] [CrossRef]
- Yao, J.; Hong, D.; Chanussot, J.; Meng, D.; Zhu, X.; Xu, Z. Cross-attention in coupled unmixing nets for unsupervised hyperspectral super-resolution. In Proceedings of the 16th European Conference on Computer Vision, Glasgow, UK, 23–28 August 2020; pp. 208–224. [Google Scholar]
- Liu, J.; Wu, Z.; Xiao, L.; Wu, X.-J. Model inspired autoencoder for unsupervised hyperspectral image super-resolution. IEEE Trans. Geosci. Remote Sens. 2022, 60, 1–12. [Google Scholar] [CrossRef]
- Lu, X.; Yang, D.; Zhang, J.; Jia, F. Hyperspectral image super-resolution based on spatial correlation-regularized unmixing convolutional neural network. Remote Sens. 2021, 13, 4074. [Google Scholar] [CrossRef]
- Wang, X.; Ma, J.; Jiang, J.; Zhang, X.-P. Dilated projection correction network based on autoencoder for hyperspectral image super-resolution. Neural Netw. 2022, 146, 107–119. [Google Scholar] [CrossRef] [PubMed]
- Yi, C.; Zhao, Y.-Q.; Chan, J.C.-W. Hyperspectral image super-resolution based on spatial and spectral correlation fusion. IEEE Trans. Geosci. Remote Sens. 2018, 56, 4165–4177. [Google Scholar] [CrossRef]
- Dong, W.; Fu, F.; Shi, G.; Cao, X.; Wu, J.; Li, G.; Li, X. Hyperspectral image super-resolution via non-negative structured sparse representation. IEEE Trans. Image Process. 2016, 25, 2337–2352. [Google Scholar] [CrossRef] [PubMed]
- Guo, F.; Zhang, C.; Zhang, M. Hyperspectral image super-resolution through clustering-based sparse representation. Multimed. Tools Appl. 2021, 80, 7351–7366. [Google Scholar] [CrossRef]
- Sun, L.; Cheng, Q.; Chen, Z. Hyperspectral Image Super-Resolution Method Based on Spectral Smoothing Prior and Tensor Tubal Row-Sparse Representation. Remote Sens. 2022, 14, 2142. [Google Scholar] [CrossRef]
- Xue, J.; Zhao, Y.-Q.; Bu, Y.; Liao, W.; Chan, J.C.-W.; Philips, W. Spatial-spectral structured sparse low-rank representation for hyperspectral image super-resolution. IEEE Trans. Image Process. 2021, 30, 3084–3097. [Google Scholar] [CrossRef]
- Zhang, K.; Wang, M.; Yang, S. Multispectral and hyperspectral image fusion based on group spectral embedding and low-rank factorization. IEEE Trans. Geosci. Remote Sens. 2016, 55, 1363–1371. [Google Scholar] [CrossRef]
- Yokoya, N.; Yairi, T.; Iwasaki, A. Coupled non-negative matrix factorization unmixing for hyperspectral and multispectral data fusion. IEEE Trans. Geosci. Remote Sens. 2011, 50, 528–537. [Google Scholar] [CrossRef]
- Borsoi, R.A.; Imbiriba, T.; Bermudez, J.C.M. Super-resolution for hyperspectral and multispectral image fusion accounting for seasonal spectral variability. IEEE Trans. Image Process. 2019, 29, 116–127. [Google Scholar] [CrossRef] [PubMed]
- Lanaras, C.; Baltsavias, E.; Schindler, K. Hyperspectral super-resolution by coupled spectral unmixing. In Proceedings of the 2015 IEEE International Conference on Computer Vision (ICCV), Santiago, Chile, 7–13 December 2015; pp. 3586–3594. [Google Scholar]
- Han, X.; Yu, J.; Xue, J.-H.; Sun, W. Hyperspectral and multispectral image fusion using optimized twin dictionaries. IEEE Trans. Image Process. 2020, 29, 4709–4720. [Google Scholar] [CrossRef]
- Akhtar, N.; Shafait, F.; Mian, A. Sparse spatio-spectral representation for hyperspectral image super-resolution. In Proceedings of the 13th European Conference on Computer Vision, Zurich, Switzerland, 6–12 September 2014; pp. 63–78. [Google Scholar]
- Li, J.; Peng, Y.; Jiang, T.; Zhang, L.; Long, J. Hyperspectral image super-resolution based on spatial group sparsity regularization unmixing. Appl. Sci. 2020, 10, 5583. [Google Scholar] [CrossRef]
- Yokoya, N.; Iwasaki, A. Airborne Hyperspectral Data over Chikusei. Space Appl. Lab., Univ. Tokyo, Tokyo, Japan, Tech. Rep. SAL-2016-05-27 2016. Available online: https://www.researchgate.net/publication/304013716_Airborne_hyperspectral_data_over_Chikusei (accessed on 16 June 2016).
- Pauca, V.P.; Piper, J.; Plemmons, R.J. Non-negative matrix factorization for spectral data analysis. Linear Algebra Its Appl. 2006, 416, 29–47. [Google Scholar] [CrossRef]
- Yokoya, N.; Grohnfeldt, C.; Chanussot, J. Hyperspectral and multispectral data fusion: A comparative review of the recent literature. IEEE Geosci. Remote Sens. Mag. 2017, 5, 29–56. [Google Scholar] [CrossRef]
- Loncan, L.; De Almeida, L.B.; Bioucas-Dias, J.M.; Briottet, X.; Chanussot, J.; Dobigeon, N.; Fabre, S.; Liao, W.; Licciardi, G.A.; Simoes, M. Hyperspectral pansharpening: A review. IEEE Geosci. Remote Sens. Mag. 2015, 3, 27–46. [Google Scholar] [CrossRef]
- Yi, C.; Zhao, Y.-Q.; Yang, J.; Chan, J.C.-W.; Kong, S.G. Joint hyperspectral super-resolution and unmixing with interactive feedback. IEEE Trans. Geosci. Remote Sens. 2017, 55, 3823–3834. [Google Scholar] [CrossRef]
- Wei, J.; Wang, X. An overview on linear unmixing of hyperspectral data. Math. Probl. Eng. 2020, 2020, 3735403. [Google Scholar] [CrossRef]
- Lanaras, C.; Baltsavias, E.; Schindler, K. Hyperspectral super-resolution with spectral unmixing constraints. Remote Sens. 2017, 9, 1196. [Google Scholar] [CrossRef]
- He, Y.; Gan, T.; Chen, W.; Wang, H. Adaptive denoising by singular value decomposition. IEEE Signal Process. Lett. 2011, 18, 215–218. [Google Scholar] [CrossRef]
- Cao, C.; Yu, J.; Zhou, C.; Hu, K.; Xiao, F.; Gao, X. Hyperspectral image denoising via subspace-based nonlocal low-rank and sparse factorization. IEEE J. Sel. Top. Appl. Earth Obs. Remote Sens. 2019, 12, 973–988. [Google Scholar] [CrossRef]
Figure 1.
RGB color composite imagery of (a) Hyperspec Chikusei HSI, (b) ZY-1 02D MSI, and (c) ZY-1 02D HSI.
Figure 1.
RGB color composite imagery of (a) Hyperspec Chikusei HSI, (b) ZY-1 02D MSI, and (c) ZY-1 02D HSI.

Figure 2.
Illustration of endmember matrix constraint unmixing.

Figure 3.
SRR results of Hyperspec Chikusei simulated data. (1st row) Color composite imageries of reference HSI and simulated LR-HSI. (2nd−7th rows) Color composite imageries of the six methods ((a) column), color-composite error images relative to the reference data ((b) column), RMSE ((c) column), and SAM images ((d) column).

Figure 4.
Effect of endmember number on the proposed method in the Hyperspec Chikusei simulated data. (a) MPSNR; (b) CC; (c) SSIM; (d) RMSE; (e) ERGAS; (f) SAM; and (g) TIME.
Figure 4.
Effect of endmember number on the proposed method in the Hyperspec Chikusei simulated data. (a) MPSNR; (b) CC; (c) SSIM; (d) RMSE; (e) ERGAS; (f) SAM; and (g) TIME.

Figure 5.
SRR results of ZY-1 02D HSI. (a) HSI; (b) MSI; (c) MIAE; (d) FuVar; (e) ECCV14; (f) ICCV15; (g) CNMF; and (h) ours.
Figure 5.
SRR results of ZY-1 02D HSI. (a) HSI; (b) MSI; (c) MIAE; (d) FuVar; (e) ECCV14; (f) ICCV15; (g) CNMF; and (h) ours.

Figure 6.
Different spectral lines of SRR results on ZY−1 02D HSI. (a) vegetation; (b) soil; and (c) blue-roofed building.
Figure 6.
Different spectral lines of SRR results on ZY−1 02D HSI. (a) vegetation; (b) soil; and (c) blue-roofed building.

Figure 7.
Effect of endmember number on the proposed method in the ZY-1 02D experimental data. (a) MPSNR; (b) CC; (c) SSIM; (d) RMSE; (e) ERGAS; (f) SAM; and (g) TIME.
Figure 7.
Effect of endmember number on the proposed method in the ZY-1 02D experimental data. (a) MPSNR; (b) CC; (c) SSIM; (d) RMSE; (e) ERGAS; (f) SAM; and (g) TIME.

Figure 8.
The SRR results before and after denoising in ZY-1 02D HSI. ((a) column) Noised HSI (1st row), MSI (2nd row). (b–g) Columns are SRR results before denoising (1st rows) and after denoising (2nd rows) of MIAE, FuVar, ECCV14, ICCV15, CNMF, and the proposed method.
Figure 8.
The SRR results before and after denoising in ZY-1 02D HSI. ((a) column) Noised HSI (1st row), MSI (2nd row). (b–g) Columns are SRR results before denoising (1st rows) and after denoising (2nd rows) of MIAE, FuVar, ECCV14, ICCV15, CNMF, and the proposed method.

Figure 9.
SRR results of ZY-1 02D HSI in band 166 before and after denoising. ((a) column) Noising HSI (1st row) and denoised HSI (2nd row). (b–g) Columns are before (1st row) and after denoising (2nd row) SRR results of MIAE, FuVar, ECCV14, ICCV15, CNMF, and ours, respectively.
Figure 9.
SRR results of ZY-1 02D HSI in band 166 before and after denoising. ((a) column) Noising HSI (1st row) and denoised HSI (2nd row). (b–g) Columns are before (1st row) and after denoising (2nd row) SRR results of MIAE, FuVar, ECCV14, ICCV15, CNMF, and ours, respectively.

Figure 10.
The spectral lines of SRR results in ZY−1 02D HSI before and after denoising. From top to bottom, each row represents MIAE, FuVar, ECCV14, ICCV15, CNMF, and the proposed method. ((a) column) vegetation; ((b) column) soil; and ((c) column) blue-roofed building.
Figure 10.
The spectral lines of SRR results in ZY−1 02D HSI before and after denoising. From top to bottom, each row represents MIAE, FuVar, ECCV14, ICCV15, CNMF, and the proposed method. ((a) column) vegetation; ((b) column) soil; and ((c) column) blue-roofed building.

Figure 11.
Different endmember abundance mapping obtained in ZY-1 02D HSI. (a) Color composite imagery; (b) vegetation; (c) soil; (d) blue-roofed building; (e) road; and (f) swamp.
Figure 11.
Different endmember abundance mapping obtained in ZY-1 02D HSI. (a) Color composite imagery; (b) vegetation; (c) soil; (d) blue-roofed building; (e) road; and (f) swamp.


Table 1.
Quantitative indices of SRR in Hyperspec Chikusei simulated data.
| Method | MPSNR | CC | SSIM | RMSE | ERGAS | SAM | TIME (s) |
|---|---|---|---|---|---|---|---|
| MIAE | 31.9489 | 0.9624 | 0.8888492 | 184.37565 | 17.3296 | 2.3846 | 325.1728 |
| FuVar | 19.7156 | 0.5038 | 0.3319486 | 791.5662 | 56.8757 | 21.4455 | 1861.6585 |
| ECCV14 | 13.4956 | 0.9870 | 0.0000111 | 1680.3724 | 114.5954 | 1.4832 | 1302.0734 |
| ICCV15 | 13.4956 | 0.9868 | 0.0000111 | 1680.3726 | 114.5954 | 1.3751 | 357.9853 |
| CNMF | 47.3551 | 0.9890 | 0.9999995 | 0.0039 | 1.5966 | 1.3619 | 240.6289 |
| OURS | 47.4468 | 0.9896 | 0.9999996 | 0.0037 | 1.5117 | 1.3305 | 253.2515 |
Table 2.
Effect of the constraints on the proposed method in the Hyperspec Chikusei simulated data.
| Values | MPSNR | CC | SSIM | RMSE | ERGAS | SAM | TIME (s) |
|---|---|---|---|---|---|---|---|
| 0.00 | 47.2463 | 0.9890 | 0.9999995 | 0.0039 | 1.5688 | 1.3580 | 273.4078 |
| 0.05 | 47.2376 | 0.9892 | 0.9999995 | 0.0039 | 1.5438 | 1.3647 | 281.8419 |
| 0.10 | 47.2711 | 0.9890 | 0.9999995 | 0.0039 | 1.5576 | 1.3695 | 280.2361 |
| 0.15 | 47.2951 | 0.9890 | 0.9999995 | 0.0039 | 1.5646 | 1.3709 | 250.1167 |
| 0.30 | 47.4468 | 0.9896 | 0.9999996 | 0.0037 | 1.5117 | 1.3305 | 253.2515 |
| 0.40 | 47.3949 | 0.9889 | 0.9999995 | 0.0039 | 1.5794 | 1.3799 | 256.5485 |
| 0.50 | 47.3993 | 0.9890 | 0.9999995 | 0.0039 | 1.5761 | 1.3732 | 257.3367 |
| 0.60 | 47.4953 | 0.9890 | 0.9999995 | 0.0039 | 1.5673 | 1.3677 | 281.2979 |
Table 3.
Quantitative indices of SRR in ZY-1 02D HSI.
| Method | MPSNR | CC | SSIM | RMSE | ERGAS | SAM | TIME (s) |
|---|---|---|---|---|---|---|---|
| MIAE | 17.8093 | 0.7392 | 0.4168 | 476.9396 | 60.6493 | 11.4362 | 616.3177 |
| FuVar | 11.0014 | 0.2747 | 0.0811 | 1203.2809 | 84.7249 | 44.2109 | 4812.1460 |
| ECCV14 | 10.8087 | 0.5921 | 0.0843 | 1191.3784 | 87.8039 | 25.2693 | 2966.4885 |
| ICCV15 | 18.8991 | 0.6769 | 0.0903 | 468.8753 | 42.3810 | 8.3175 | 188.3746 |
| CNMF | 18.2901 | 0.6937 | 0.2494 | 489.3940 | 41.8792 | 11.1107 | 150.0200 |
| OURS | 19.1274 | 0.6839 | 0.2478 | 443.3611 | 39.4557 | 7.2542 | 153.2204 |
Table 4.
Quantitative indices of SRR in ZY-1 02D HSI before denoising.
| Method | MPSNR | CC | SSIM | RMSE | ERGAS | SAM | TIME (s) |
|---|---|---|---|---|---|---|---|
| MIAE | 15.0415 | 0.6439 | 0.0599 | 696.3550 | 65.3466 | 10.8613 | 619.4395 |
| FuVar | 10.9691 | 0.2757 | 0.0363 | 1208.1741 | 84.0772 | 43.9273 | 4408.8130 |
| ECCV14 | 10.8002 | 0.5885 | 0.0857 | 1187.8724 | 87.6889 | 23.7784 | 2979.5627 |
| ICCV15 | 18.7260 | 0.5643 | 0.0663 | 479.8861 | 42.9734 | 8.5419 | 173.6451 |
| CNMF | 18.7657 | 0.6957 | 0.2499 | 464.5570 | 39.6662 | 9.6229 | 159.7210 |
| OURS | 18.5660 | 0.7072 | 0.2572 | 476.7362 | 40.0394 | 15.2285 | 159.2980 |
Publisher’s Note: MDPI stays neutral with regard to jurisdictional claims in published maps and institutional affiliations. |
© 2022 by the authors. Licensee MDPI, Basel, Switzerland. This article is an open access article distributed under the terms and conditions of the Creative Commons Attribution (CC BY) license (https://creativecommons.org/licenses/by/4.0/).
Share and Cite
MDPI and ACS Style
Zhang, X.; Zhang, A.; Portelli, R.; Zhang, X.; Guan, H. ZY-1 02D Hyperspectral Imagery Super-Resolution via Endmember Matrix Constraint Unmixing. Remote Sens. 2022, 14, 4034. https://0-doi-org.brum.beds.ac.uk/10.3390/rs14164034
AMA Style
Zhang X, Zhang A, Portelli R, Zhang X, Guan H. ZY-1 02D Hyperspectral Imagery Super-Resolution via Endmember Matrix Constraint Unmixing. Remote Sensing. 2022; 14(16):4034. https://0-doi-org.brum.beds.ac.uk/10.3390/rs14164034
Chicago/Turabian StyleZhang, Xintong, Aiwu Zhang, Raechel Portelli, Xizhen Zhang, and Hongliang Guan. 2022. "ZY-1 02D Hyperspectral Imagery Super-Resolution via Endmember Matrix Constraint Unmixing" Remote Sensing 14, no. 16: 4034. https://0-doi-org.brum.beds.ac.uk/10.3390/rs14164034
Note that from the first issue of 2016, this journal uses article numbers instead of page numbers. See further details here.