Article

Monitoring Land Use/Cover Changes by Using Multi-Temporal Remote Sensing for Urban Hydrological Assessment: A Case Study in Beijing, China

by
Crispin Kabeja
1,2,
Rui Li
1,3,4,*,
Digne Edmond Rwabuhungu Rwatangabo
2 and
Jiawei Duan
1
1
School of Earth and Space Sciences, University of Science and Technology of China, Hefei 230026, China
2
School of Mining and Geology, College of Science and Technology, University of Rwanda, Kigali P.O. Box 4285, Rwanda
3
Comparative Planetary Excellence Innovation Center, Chinese Academy of Sciences, Hefei 230026, China
4
State Key Laboratory of Fire Science, University of Science and Technology of China, Hefei 230026, China
*
Author to whom correspondence should be addressed.
Remote Sens. 2022, 14(17), 4273; https://0-doi-org.brum.beds.ac.uk/10.3390/rs14174273
Submission received: 9 July 2022 / Revised: 15 August 2022 / Accepted: 19 August 2022 / Published: 30 August 2022
(This article belongs to the Special Issue Remote Sensing of Hydrological Processes: Modelling and Applications)

Abstract

:
Understanding the change in hydrological response due to urban dynamics is important for better flood preparedness and future sustainable urban planning. This study investigated the influence of urban land cover change on spatiotemporal changes in flood peak discharge and flood volume within a rapidly urbanizing catchment located in Beijing, China. We used Landsat satellite data ranging from 1986 to 2017 to monitor and quantify urban growth. Moreover, the Hydrological Modeling System (HEC-HMS) coupled with meteorological data was utilized to examine the impact of urban growth on hydrological responses. The results revealed that major changes in land use/cover (LULC) were detected in the urban landscape, which increased from 25.22% to 65.48% of the total catchment area, while agricultural land decreased from 64.85% to 25.28% during 1986–2017. The flood peak discharge and flood volume average of the three rainstorms events reached 7.02% and 11.93%, respectively. Furthermore, the changes in flood peak discharge and flood volume were more obvious at the sub-catchment scale. These findings indicate that urban growth enhanced the possible flooding risk in the study catchment. This study improves the understanding of the isolated impacts of urbanization on flooding and provides essential information for sustainable urban planning.

1. Introduction

According to the United Nations statistics, the world’s population living in urban areas has increased up to 54%, and forecasts indicate an increase of up to 68% by the year 2050 [1]. These demographic changes have driven rapid urban land use/cover change where natural (e.g., forest) and agricultural land use types were converted to urban areas [2,3,4]. These changes have affected the hydrological processes in urban areas and consequently increased surface runoff and flood risk [5,6,7,8]. Major flood events have been recorded in highly urbanized areas and caused economic losses and human casualties worldwide [7,8,9]. Quantifying the impact of urban land growth on potential flooding can help mitigate future flood disaster through sustainable urban land use/cover planning.
Urbanization involves replacing natural land such as forest and grassland with impervious surfaces [10,11]. Impervious surfaces include all human constructed elements such as buildings, parking lots, roads, etc. [12,13]. Impervious surfaces may cause considerable hydrological effects in an urban environment and result in an increase of runoff and flood frequency [14,15,16]. Other authors proposed the introduction of low-impact development (LID) strategies, which are measures of management and storage of stormwater to cope with the hydrological effect of urbanization [17,18,19]. Moreover, some other authors argued that changes in hydrological processes (e.g., an increase in flood) in an urbanized catchment are mainly caused by the spatial configuration and location of urban land use in the catchment [20,21]. Thus, it is essential to consider the urban dynamic and other land cover types while analyzing the flood risk in urban areas.
China’s urban population has experienced rapid growth by more than two times since the late 1970s. This population growth accelerated the change in urban land cover mainly due to housing and industrial demand [22,23]. The growth in housing and industrial development contributed to the increase of impervious surfaces, which have affected urban hydrological conditions [24,25]. For example, many studies showed that more than 200 cities in China suffer from flood hazards every year during the rainfall period [26,27,28]. To minimize the impact of these floods, the Chinese government introduced various programs, including the green for grain program, the sponge city programs, and rainwater harvesting technique in various cities [29,30,31]. However, due to climate change and continuing urban sprawl, flood hazards are anticipated to increase in the future [32,33,34].
Over the last three decades, the capital city of China, Beijing, has recognized rapid urban development, which resulted in a decrease in agriculture and vegetation land [35,36]. This change in urban land use/cover contributed to the increase of flood-related disaster in the city. For example, Beijing has been affected by severe urban floods in recent years, which resulted in many economic and human losses [25,37]. The most devastating flood event took place in July 2012 and caused estimated economic losses of 14 billion RMB and the death of 15 people [38].
Few studies investigated the impact of urban development on floods in Beijing. Mei et al. [39] assessed the impact of green infrastructure (GI) on flood reduction in a catchment in Beijing and found that the introduction of GI in urban areas may contribute to mitigating urban flooding. Other research either focused on the assessment of the impact of urban green space on runoff and flood reduction [40,41] or was limited to the assessment of the impact of urbanization on runoff and floods at a bigger scale and without considering the historical urban change in Beijing [25]. Therefore, there is a need to fully investigate the extent to which flood peak discharge and flood volume respond to historical urban land use/cover change at both the basin and sub-basin scales.
To address the aforementioned issues, this study explored the effects of urbanization on flood characteristics in a quickly urbanizing catchment in Beijing, China. Based on the historical and current urban development patterns and their impact on catchment hydrological processes, the specific objectives of this study are: (1) To estimate spatiotemporal changes in urban land cover expansion from 1986 to 2017 using Landsat satellite remote sensing images; (2) Use the HEC-HMS model to evaluate the hydrological response of different urban land cover conditions at both the catchment and sub-catchment scales. A better understanding of the hydrological response driven by urban land use/cover changes at a small-scale level (e.g., sub-basin) would be beneficial for future flood control and sustainable urban planning.

2. Materials and Methods
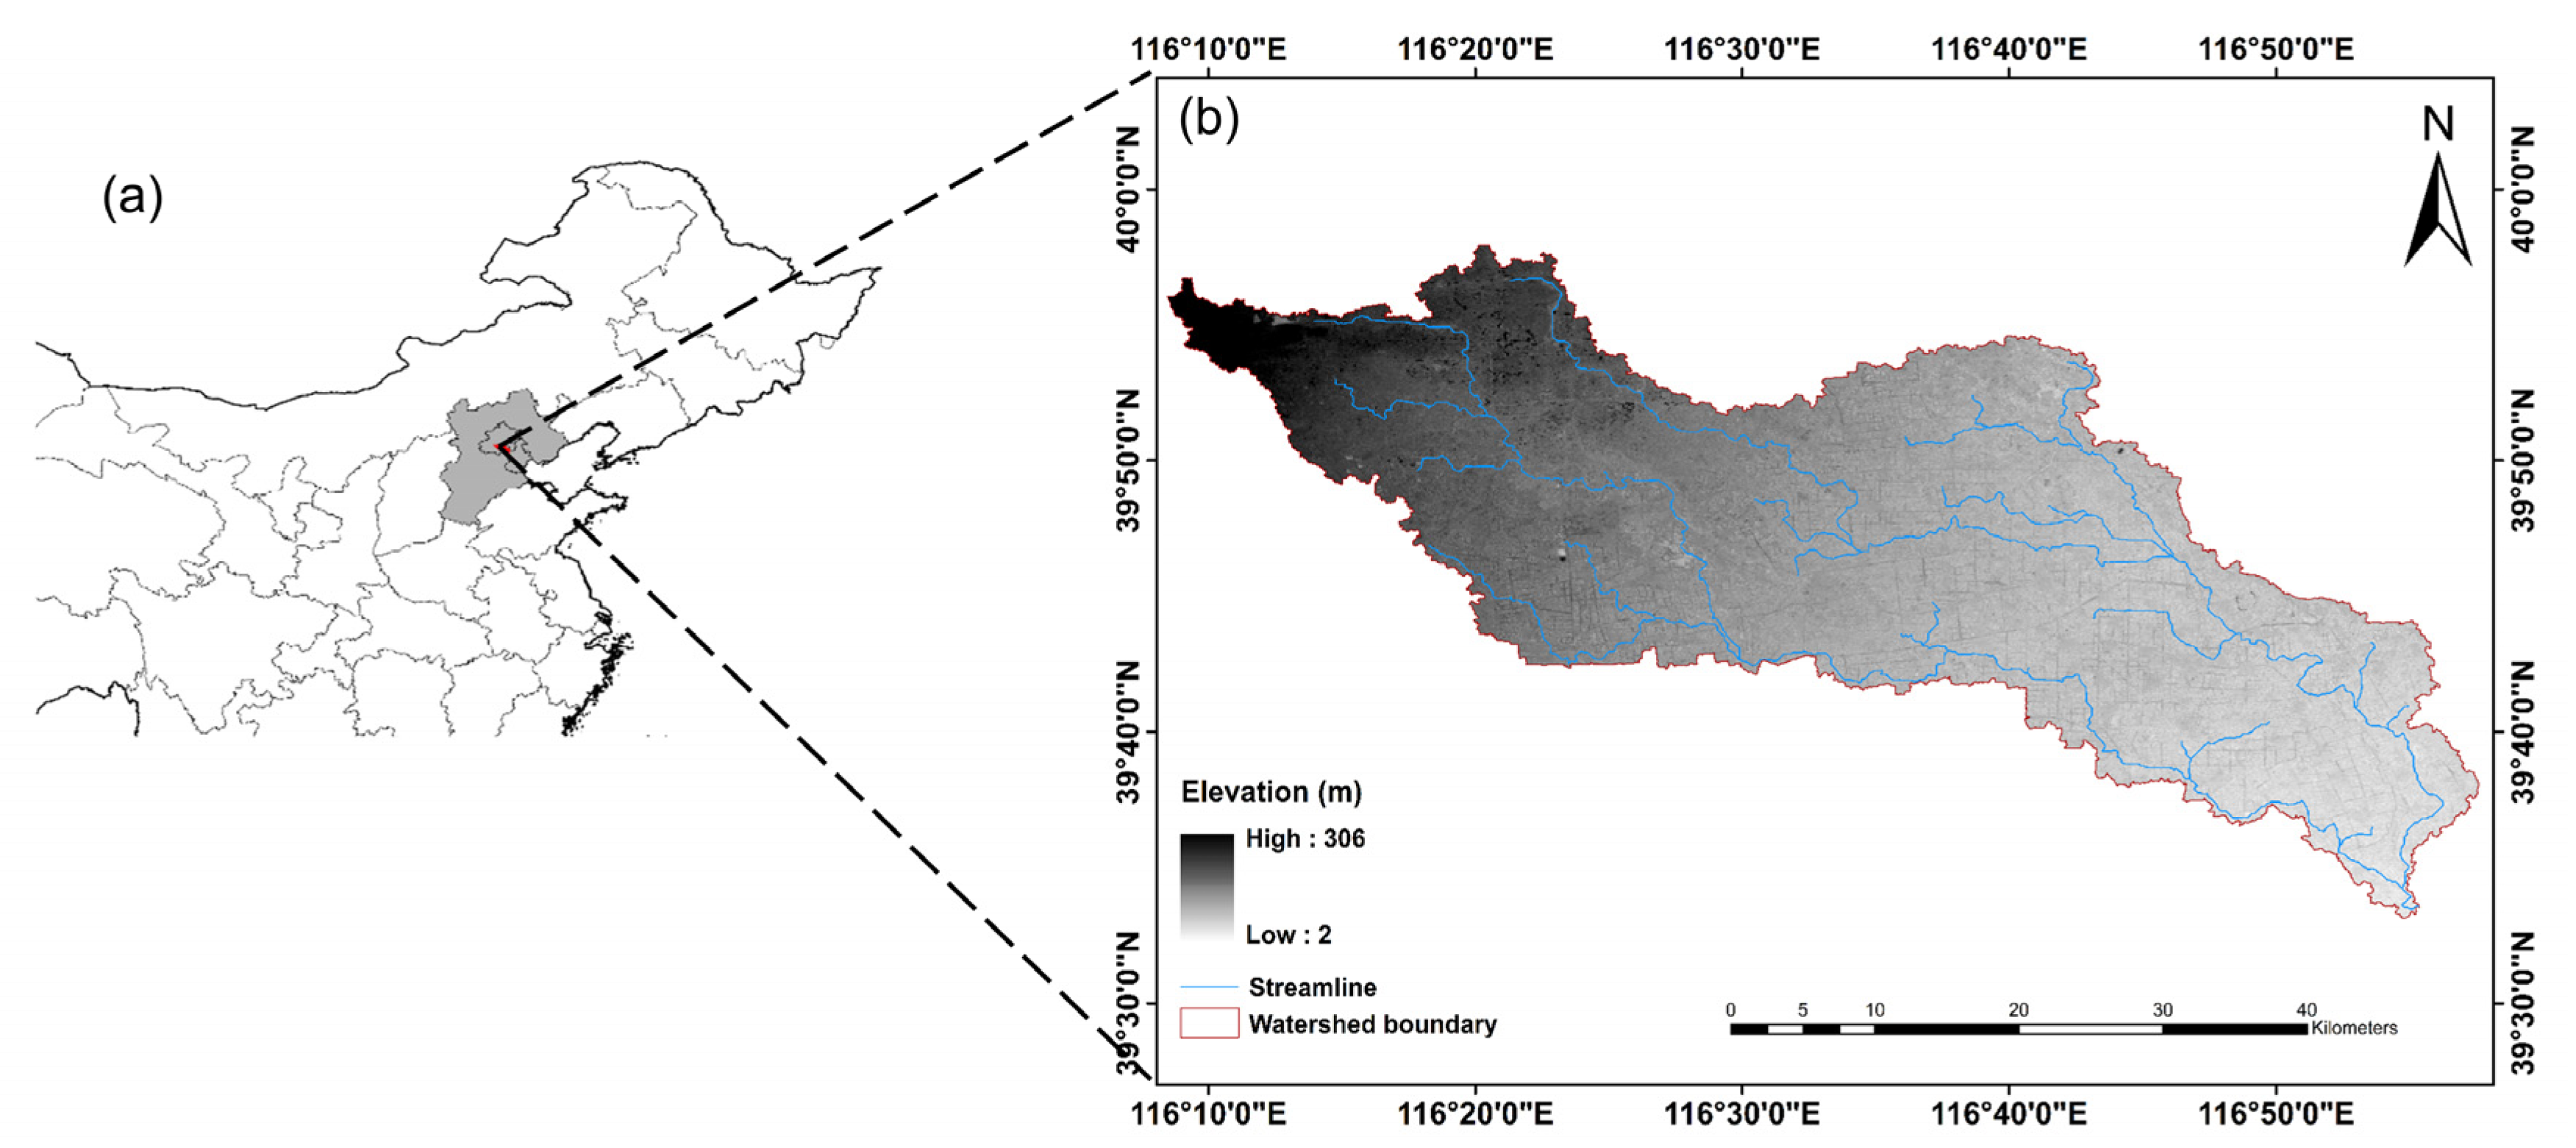
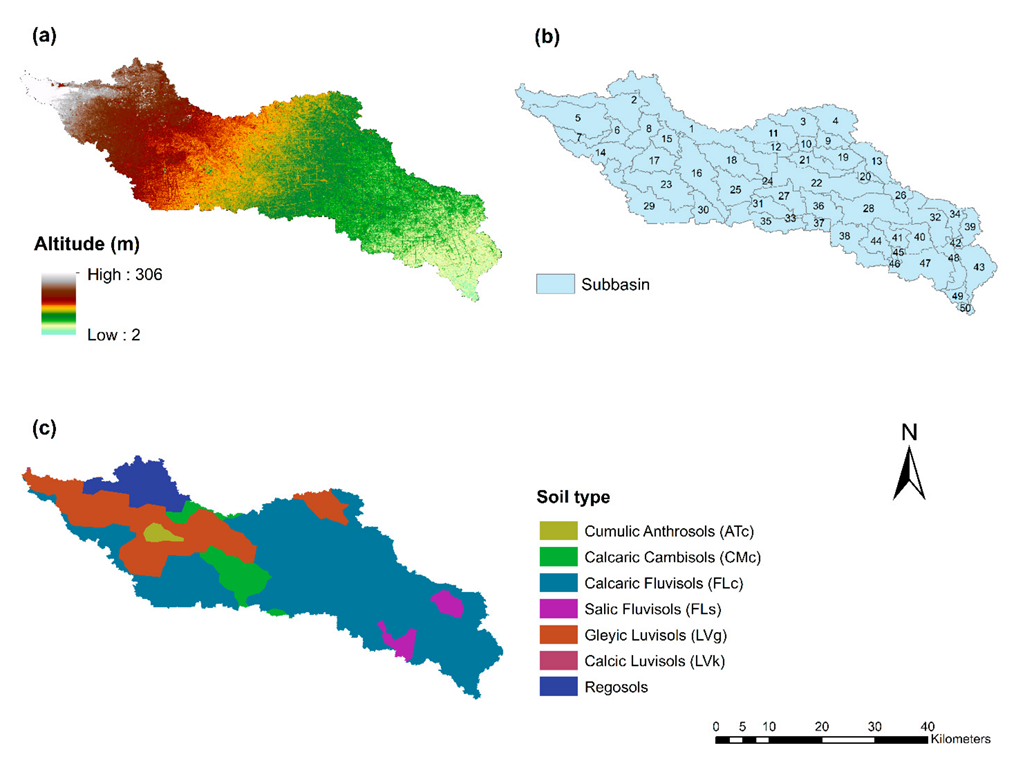
2.1. Study Area

This study was carried out in the Liangshuihe catchment located in Beijing, the capital city of China (39°54′–39°97′N; 116°14′–116°95′E) (Figure 1). The Liangshuihe catchment has an area of nearly 1238 km2 and an altitude ranging from 2 to 306 m asl. It has a warm monsoon climate with an annual temperature ranging from 6 to 14 °C and an average precipitation of 522 mm. The Liangshuihe catchment has been rapidly urbanized over the last 30 years with built-up areas as the main land use type, followed by the agricultural land use type. The study catchment has been affected by floods, mainly during rainfall season [39]. Hence, this catchment serves as an ideal site for investigating the impact of urban expansion on floods. A comprehensive understanding of urban land use/cover change effects on runoff and flooding is essential for future sustainable urban development.

2.2. Data Collection

In this study, we used Landsat satellite images, precipitation data, digital elevation model (DEM) data, soil data, and discharge data. The Landsat satellite imagery covering a period from 1986 to 2017 were acquired for land use/cover maps generation. The free available geometrically corrected Landsat L1T data with a spatial resolution of 30 m were considered appropriate to investigate the change in urban development as it allows the longest series of uninterrupted land surface records. We selected image scenes from the summer season under clear sky conditions. The acquisition date, sensor type, and cloud cover percentage of the selected images are presented in Table 1. The precipitation data were provided by the China Meteorological Administration (CMA). We selected the long record of hourly precipitation data from 2002 to 2011 covering the study catchment. We acquired the Digital Elevation Model (DEM) from the Shuttle Radar Topography Mission (SRTM) with a spatial resolution of 30 m. Lastly, soil data (soil type and texture) of the study catchment were downloaded from the world soil database [42].

2.3. Satellite Image Classification and Land Cover Change Analysis

The urban fraction has evolved in the Liangshuihe catchment over the last three decades. Previous studies showed that Landsat satellite data are adequate for investigating changes in urban land use/cover due to their spatial and spectral resolution [43,44,45,46,47,48]. Therefore, we used the Landsat reflectance images to derive the urban land use/cover maps of the study catchment in 1986, 1996, 2005, 2010, and 2017. The supervised image classification technique was applied to perform land cover classification [49]. First, we did radiometric calibration to convert Landsat satellite images digital numbers (DNs) to the top of atmosphere (TOA) radiance using spectral values stored in the metadata file of each image [50]. Second, we applied the Fast Line-of-Sight Atmospheric Analysis for Spectral Hypercubes algorithm to transform the calibrated radiance values into surface reflectance data [51]. Lastly, we used the Maximum Likelihood Classification (MLC) algorithm to classify the surface reflectance Landsat data. The MLC algorithm computes variance and correlation of spectral values in a satellite image and associates similar pixels to the appropriate land cover type [52,53,54]. During satellite image classification, high-resolution images from Google Earth Pro, and the land use maps of China (accessible at http://www.resdc.cn, (accessed on 16 August 2021)) served as a reference for training sample selection. Moreover, we accessed historical high-resolution imagery of the Liangshuihe catchment in Google Earth Pro with dates similar or close to those of Landsat images [55,56,57]. The land use/cover map of the study catchment was classified into five land cover classes, which were agriculture, grassland, forest, urban, and water bodies. The names of land use/cover types were provided based on the nomenclature developed by the Chinese Academy of Science (CAS) [58].
According to Foody [59], it is important to assess the quality of obtained maps after satellite image classification. Therefore, we assessed the accuracy of each generated land use/cover map (1986, 1996, 2005, 2010, and 2017) of the study catchment. The overall classification accuracy of each classified map and the Kappa coefficient were >85% and >0.86, respectively, which indicated high accuracy of the developed maps, following the standard for satellite image classification [60].

2.4. Analysis of Land Use/Cover and Vegetation Changes

Assessing historical land use/cover changes requires monitoring and analysis of the selected study area by using satellite images taken at different times [61]. Therefore, to assess changes in urban land use/cover in the study catchment across selected years, we analyzed and compared classified Landsat images. We used the post-classification change extraction method to quantify the classified land use/cover maps of the years 1986, 1996, 2005, 2010, and 2017 [52,62]. We calculated the statistical information and surface area covered by each land use/cover class to generate a change matrix. Moreover, we conducted a spatial analysis of land use/cover data to better visualize and quantify the observed trends in urban sprawl in the study catchment.

2.5. Hydrological Model and Input Data

2.5.1. HEC-HMS Hydrological Model

The present study utilizes the Hydrological Modeling System (HEC-HMS) to investigate the impact of urban sprawl on flood peak discharge and flood volume in the Liangshuihe catchment in Beijing. The HEC-HMS is a hydrological model developed by the United States Army Corps of Engineers to study different hydrological aspects [63]. It has been utilized worldwide for urban flooding studies, flood forecasting, water resource assessment, and other natural hazards studies [64,65,66,67,68]. The HEC-HMS model has four modules that need to be defined for setting up the model. The four modules are basin and meteorological models, control specifications, and time series data [69]. Detailed descriptions of each of these elements are provided below.
(1)
Basin model: defines the basin’s physical features such as the streams network, the sub-basins’ areas, reach and junctions for the catchment.
(2)
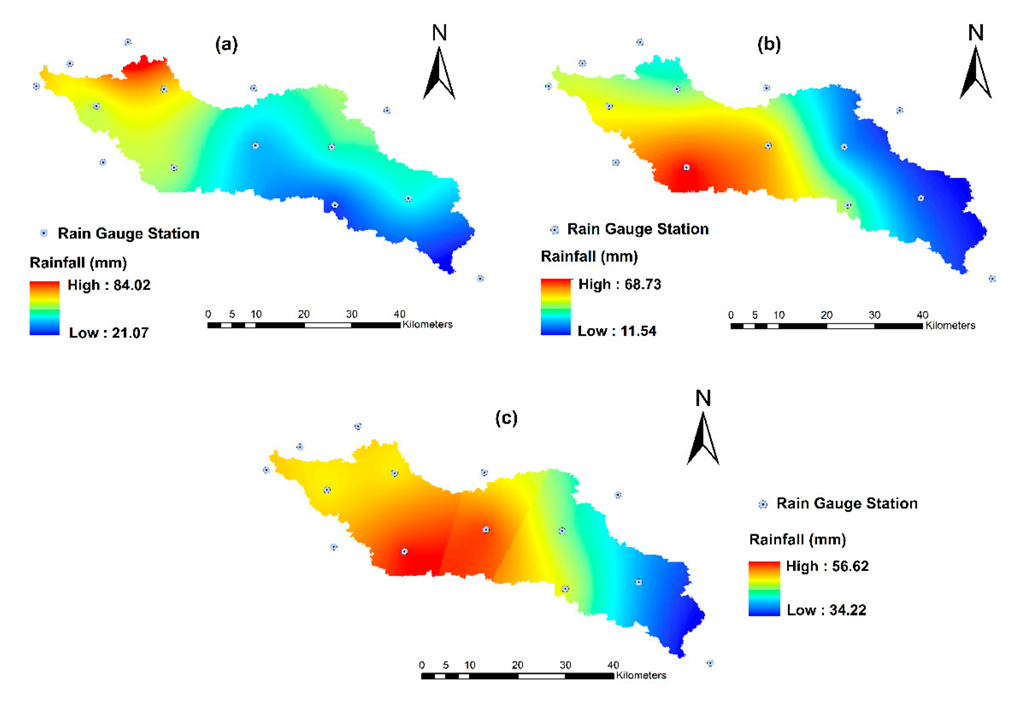
Meteorological model: contains spatial distribution of climate data (rainfall) associated with the catchment.
(3)
Control Specification: specifies different simulation times for the model (start time and end time and date for the simulation).
(4)
Time-series data: include detailed precipitation data (e.g., hourly rainfall) from selected rain events for model simulation.
The input data for the four models are less extensive and were obtained mainly through remote sensing means. The HEC-HMS model converted the rainfall into runoff through various methods such as loss, transform and routing methods. Furthermore, we used the soil conservation service (SCS) curve number (CN) loss method to calculate excess rainfall after loss estimation, the SCS Unit Hydrograph Method to transform excess rainfall into runoff and direct to the outlet, and the Muskingum method to transfer stream flow through channeling in the reaches [63,70,71,72].

2.5.2. Model Input Data

The main data required to run the HEC-HMS model consist of the Digital Elevation Model (DEM), land use/cover maps, meteorological data (e.g., precipitation), and soil data [63]. The DEM data were obtained from the Shuttle Radar Topography Mission (SRTM) with a spatial resolution of 30 m (Figure 2a). According to Schumann et al. [73], the SRTM DEM data are reliable for flood modelling. We used the DEM data to delineate the study catchment boundaries, analyze topographic characteristics of the catchment, and subdivide the study catchment into 50 sub-basins. Soil information data in the study catchment were extracted from the Harmonized World Soil Database (Figure 2c). Hourly rainfall data from 2002 to 2011 were provided by the China Meteorological Administration (CMA). After analyzing the rainfall data, we selected three largest rainstorm events (23 July 2005; 17 July 2009; 21 August 2010) for the HEC-HMS model simulation. We estimated the distribution of these rainfall events in the study catchment by utilizing the kriging interpolation method [74] (Figure 3). Land cover maps, which describe the continuous urban expansion in the study catchment, were derived from the processing of Landsat satellite images (see Section 2.3). We combined the land cover data information and the hydrologic soil group (HSG) to generate CN maps [69]. The HSG data were prepared using soil data that contained all information related to soil texture and soil types of the study catchment. The CN values reflect land cover features and soil characteristics, hence a higher CN corresponds to less infiltration losses and form surface runoff while a low CN signifies higher infiltration losses [75].
Therefore, most urban areas are associated with a low infiltration rate and high CN value, which may lead to higher runoff and flooding. Table 2 presents CN values of land cover types and the hydrologic soil group used in the present study. All the main input data required by the HEC-HMS model were prepared by using the HEC-GeoHMS model [69].

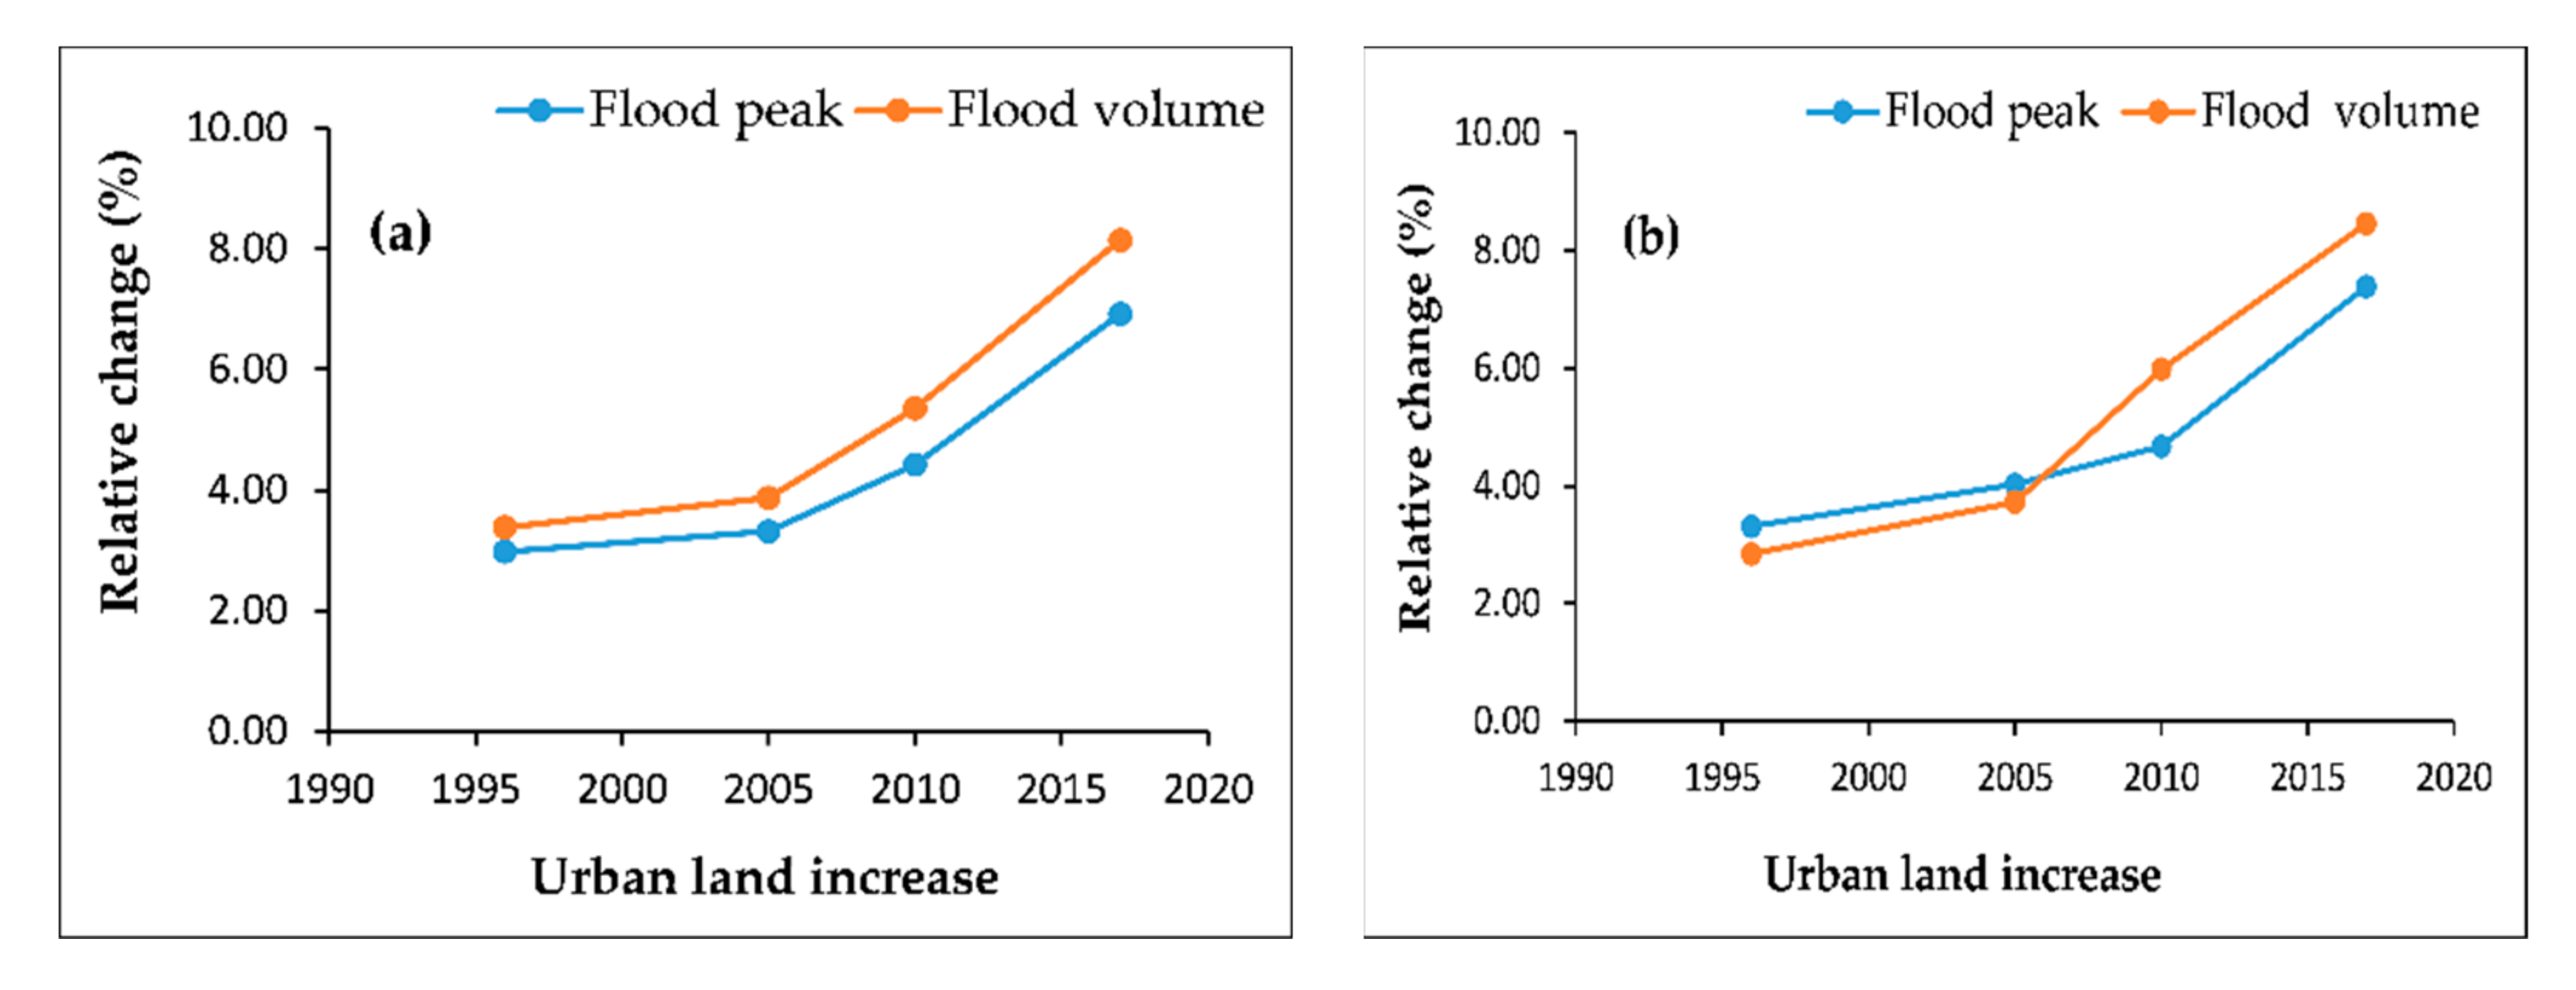
2.6. Quantifying the Hydrological Impact of Urbanization in the Study Watershed

In the present study, we set up the HEC-HMS model for various scenarios to investigate the historical impact of urbanization on flood volume and flood peak in the study catchment. Following an approach similar to that of Yan et al. [76], we designed five scenarios representing various degrees of urban land use/cover from 1986 to 2017 in the Liangshuihe catchment. The baseline scenario (S1986) was created using the 1986 land use/cover conditions. Similarly, other scenarios (S1996, S2005, S2010, and S2017) were designed using historical urban land use/cover data that reflect urban conditions in these respective years. We used the HEC-HMS model to simulate three rainfall events for different scenarios. Thus, there were five hydrological simulations for each rainstorm event. The simulation results (flood peak and volumes) for various land cover scenarios (S1996, S2005, S2010, and S2017) were compared to the baseline scenario (S1986) to assess any changes in flood peak and flood volume [77].

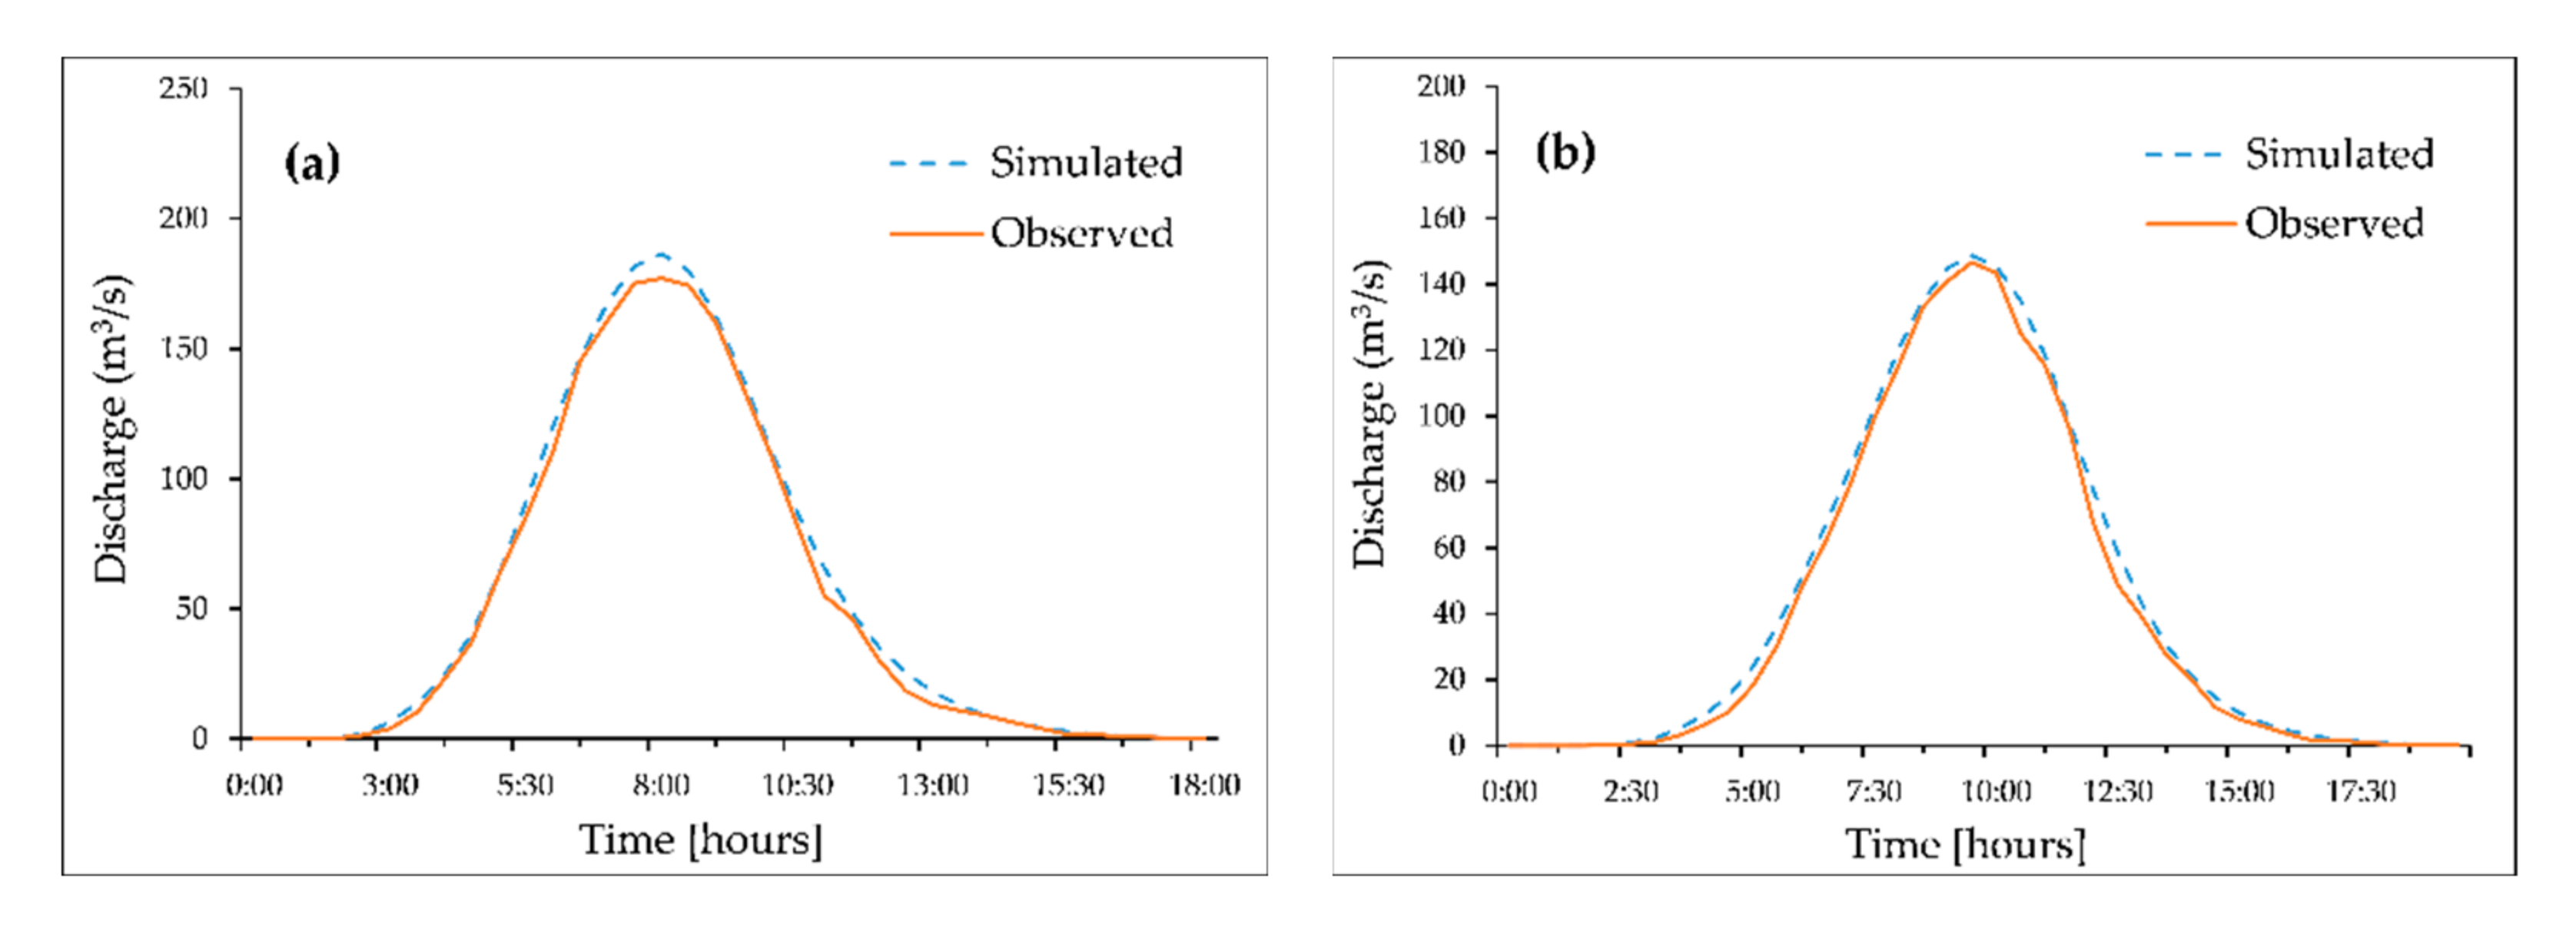
2.7. Performance of Catchment Hydrological Simulation

According to Halwatura [78], the hydrological model shall be calibrated using the ground-observed data to improve the accuracy of the model results. Therefore, to evaluate the performance of the HEC-HMS model, we conducted the calibration process by adapting the model parameters until the model-simulated results matched the available ground discharge data. We used the ground discharge data from two rainfall events of 21 August 2010 and 2 June 2010. We obtained the best fit between the simulated hydrographs at the watershed outlet and the ground discharged data as shown in Figure 4. The model calibration results show that the HEC-HMS model was able to accurately simulate flood peak discharge and produce acceptable results (both R2 values exceeded 0.86). Thus, the calibrated HEC-HMS model was used to assess flood peak discharge in the study catchment under various land use/cover scenarios.

3. Results

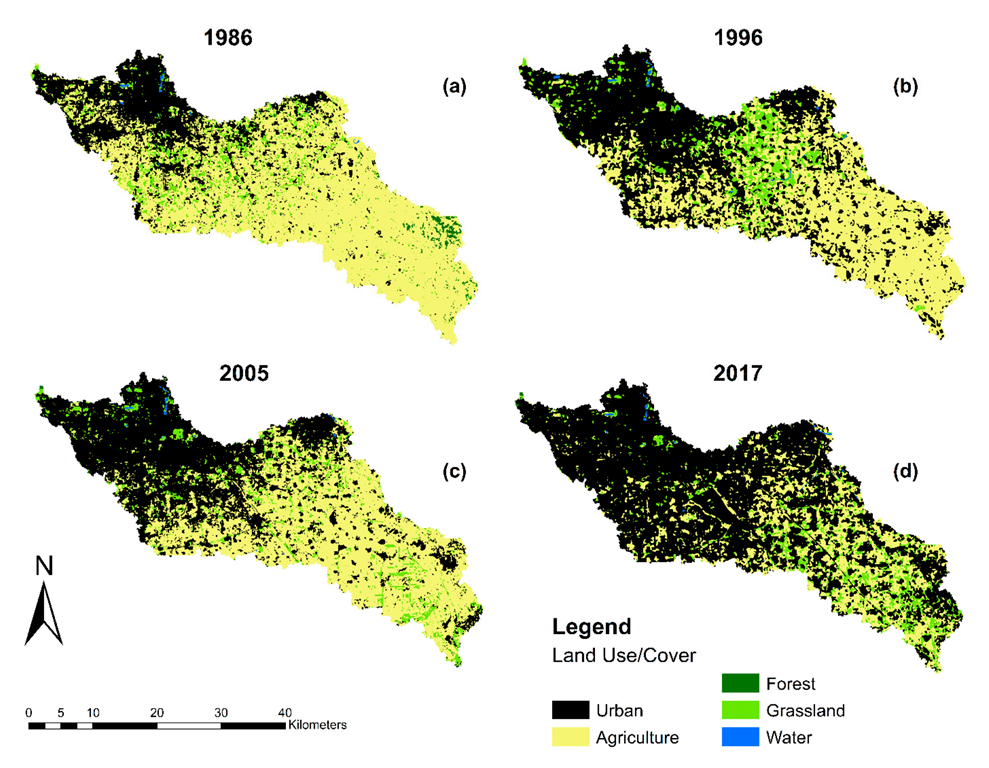
3.1. Spatiotemporal Urban Land Use/Cover Change

The growth patterns of urban land use/cover in the Liangshuihe watershed for the years 1986, 1996, 2005, and 2017 are presented in Figure 5 and Table 3. The urban and built-up areas showed significant changes during 1986–2017. In 1986, urban land use/cover type was approximately 25.22%, then, it was significantly increasing to nearly 65.48% of the total catchment area in 2017. In contrast, agricultural land experienced the greatest decrease by 490.05 km2 (39.57% of the total area) during the same study period. In addition, from 2005 to 2010, grassland and forest areas were altered slightly with decreases of 0.45% and 0.33%, respectively. Water bodies showed a slight increase by 0.1%. The spatial analysis indicated that most of urban expansion was the result of the conversion of agricultural land use/cover type areas as illustrated in Figure 5. This urban growth was mainly expanded towards the southern regions of the study watershed (Figure 5).
In this study, we found that built-up areas expanded significantly in the Liangshuihe watershed in Beijing over 30 years.

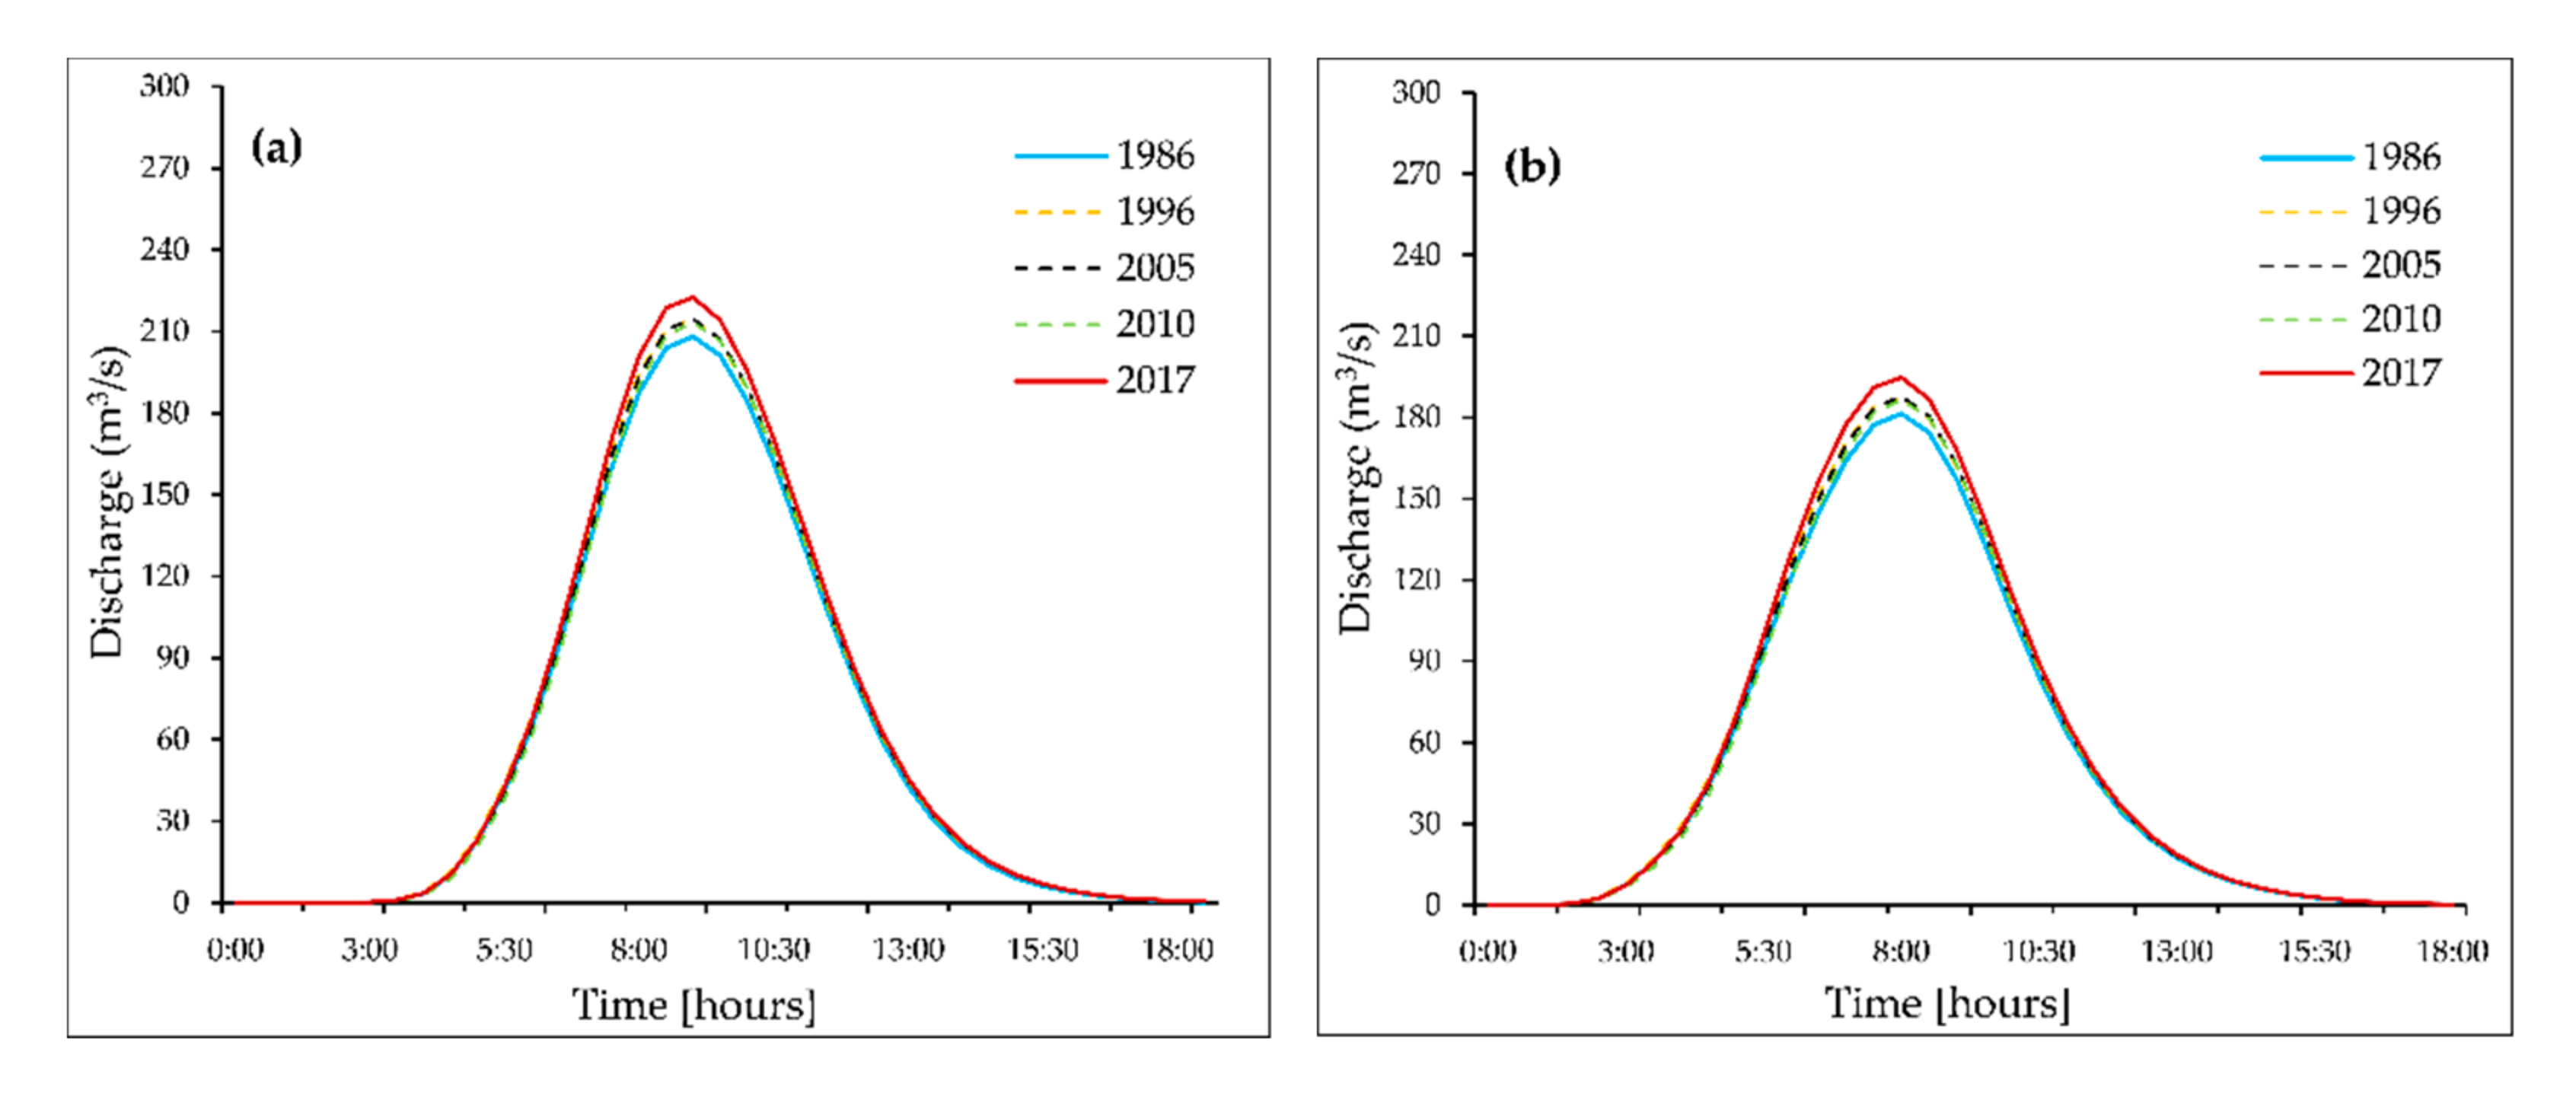
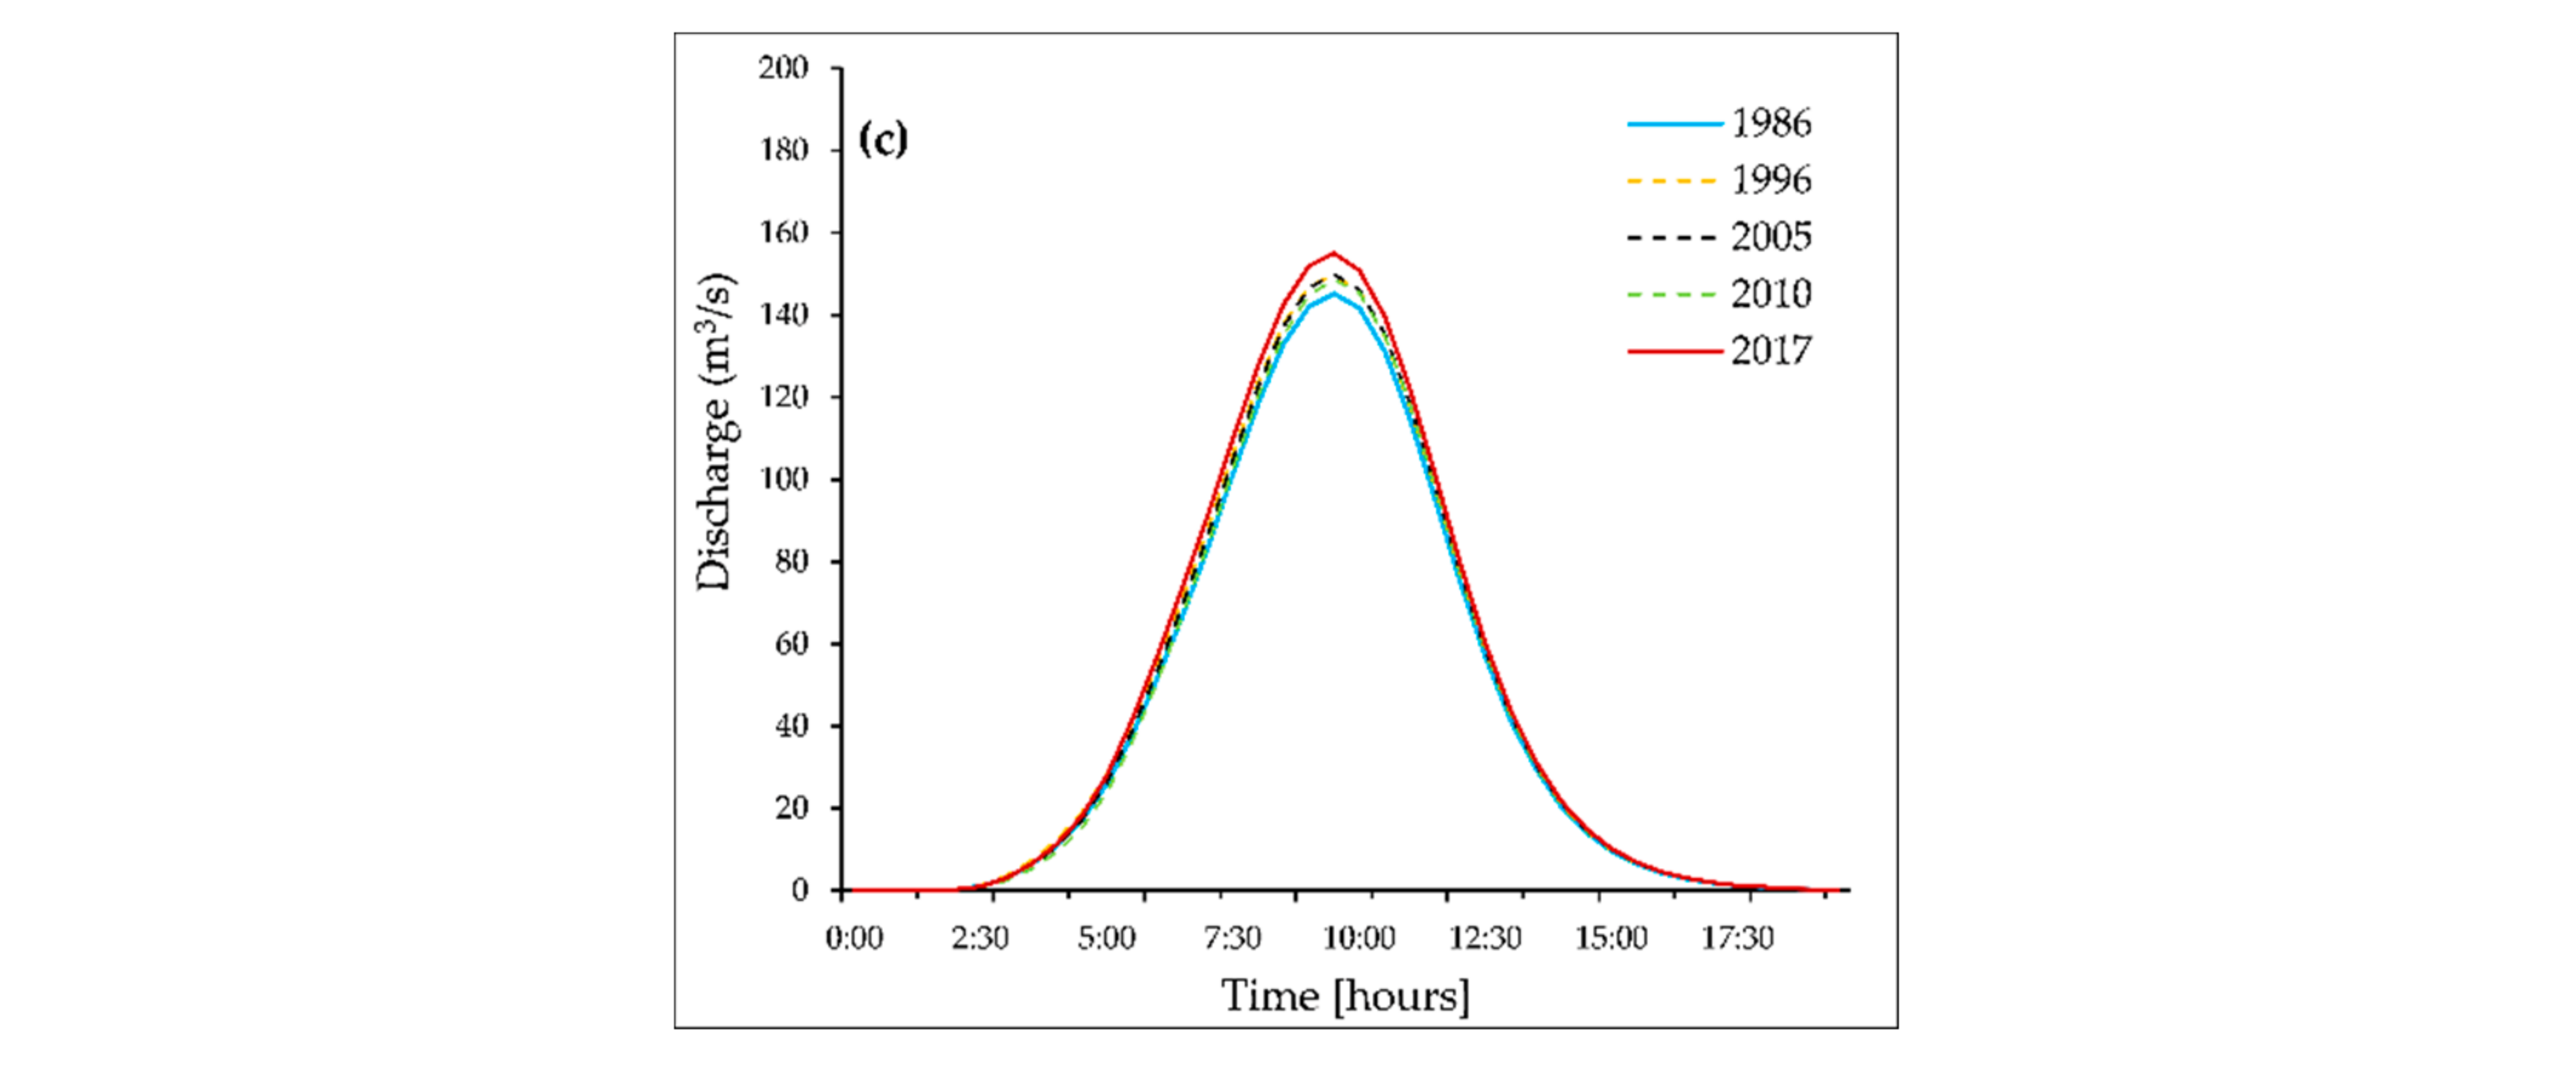
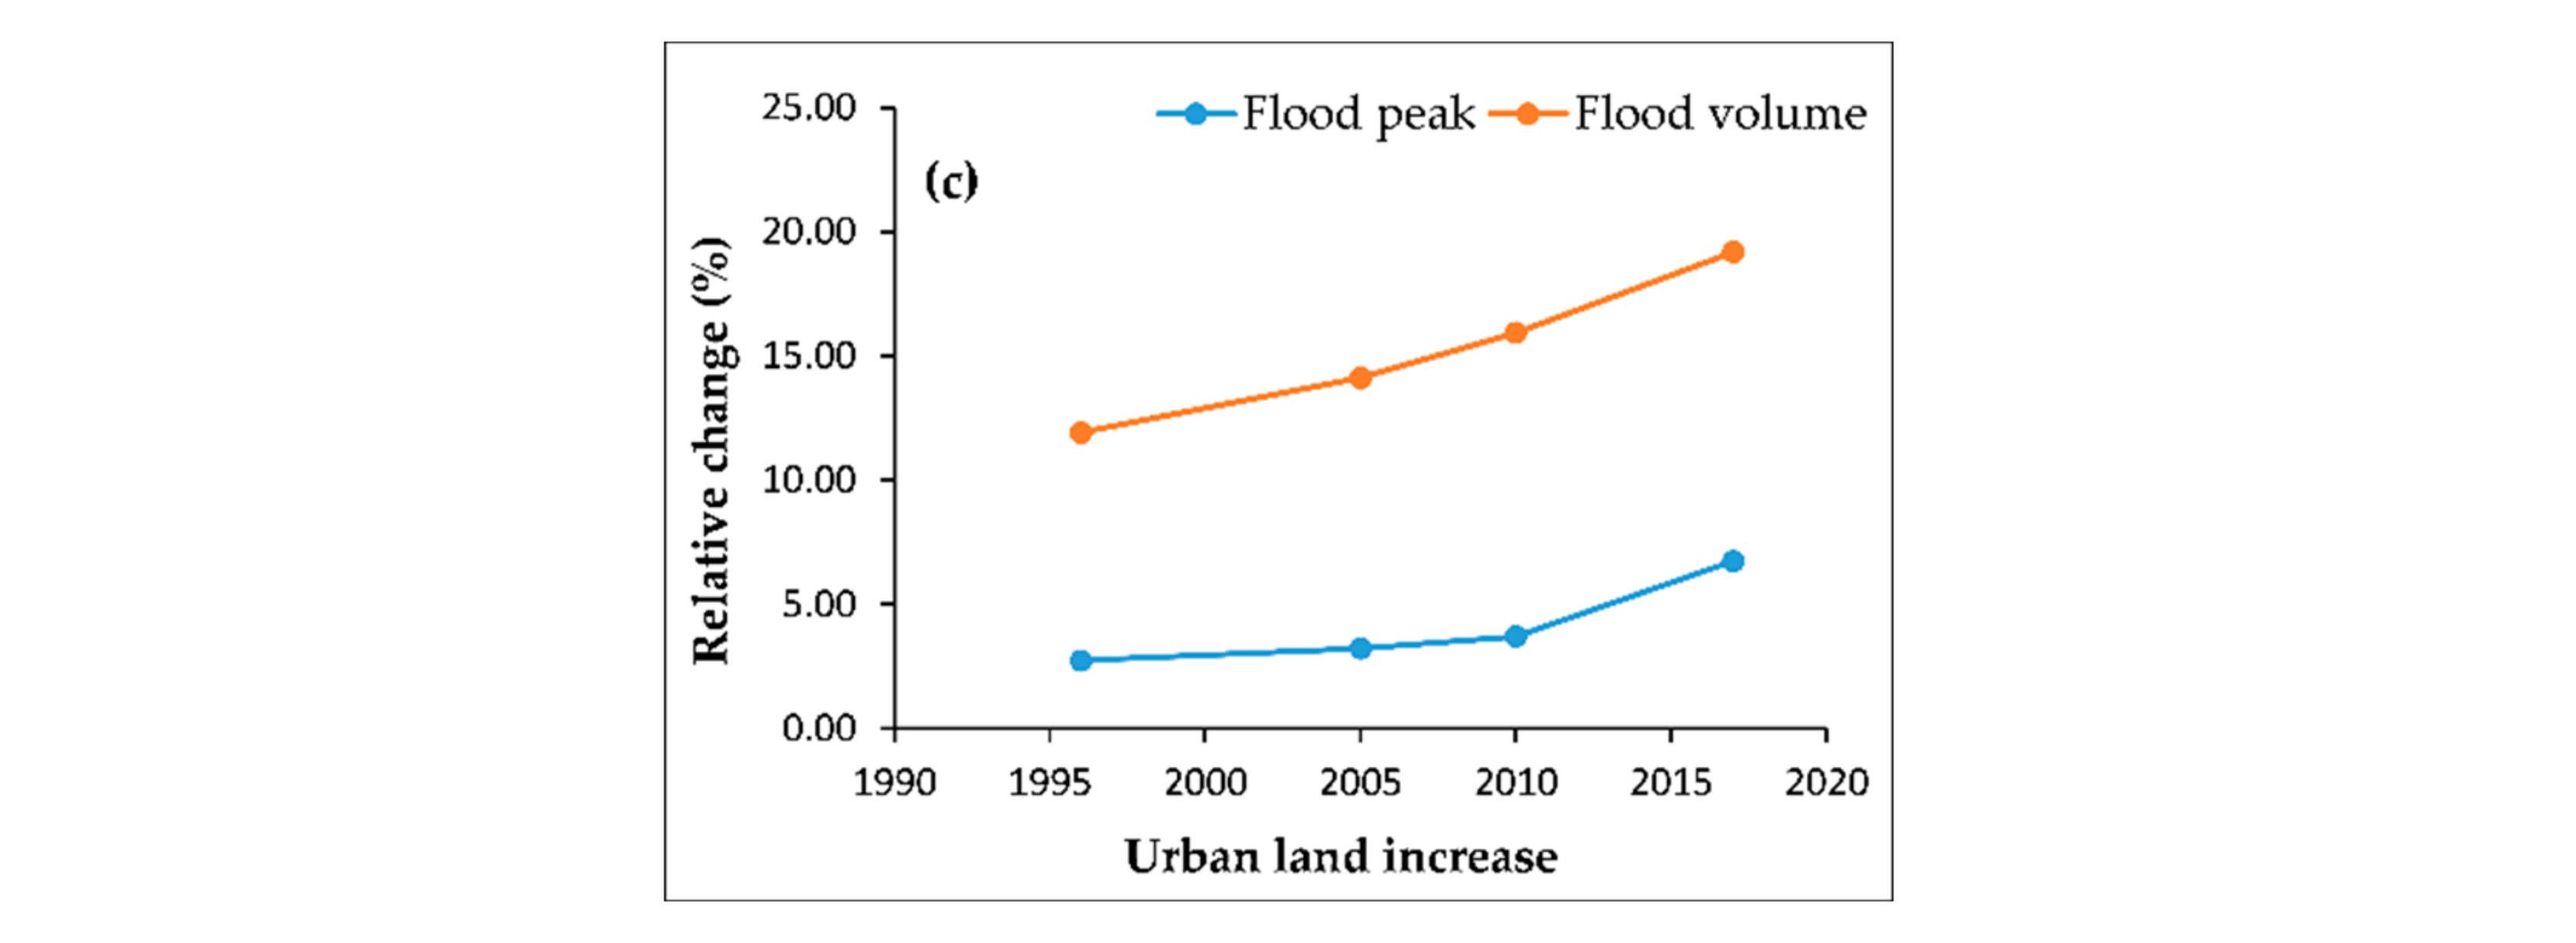
3.2. Flood Hydrological Response to Urban Development at Watershed Scale

To evaluate the impacts of urban sprawl on flood hydrological responses in the study catchment, we used the HEC-HMS model to simulate three varying-scale rainstorm events for five different urban land use/cover scenarios (S1986, S1996, S2005, S2010, and S2017). The flood peak hydrographs at the catchment outlet showed an increasing trend from 1987 to 2017 in all three rainfall events used during the model simulation (Figure 6). There was an increase in both flood peak discharge and flood volume in all scenarios representing various levels of urban development (Figure 7 and Table 4). The flood peak discharge and flood volume average increased by 7.02% and 11.93% in 2017, respectively. From 1986 to 2017, the respective relative changes of flood peak discharge and flood volume were 6.92% and 8.14% for rainstorm 1, 7.39% and 8.46% for rainstorm 2, and 6.75% and 16.33% for rainstorm 3 (Table 4). It seems that various rainstorm events are more sensitive to urbanization differently.
Furthermore, we observed a consistent increase in flood peak discharge and flood volume in four scenarios representing different proportions of urban land cover change in the selected years (1996, 2005, 2010, and 2017) under three rainstorm events (Figure 7).
An increase in urban land cover in each scenario resulted in an increase in flood peak discharge and flood volume. Over the 30 years, the percent of urban land use/cover increased substantially in our study watershed and was probably the main cause of the increases in flood peak discharge and flood volume. These changes in flood peak discharge and flood volume will likely increase the risk of floods in the Liangshuihe watershed in Beijing.

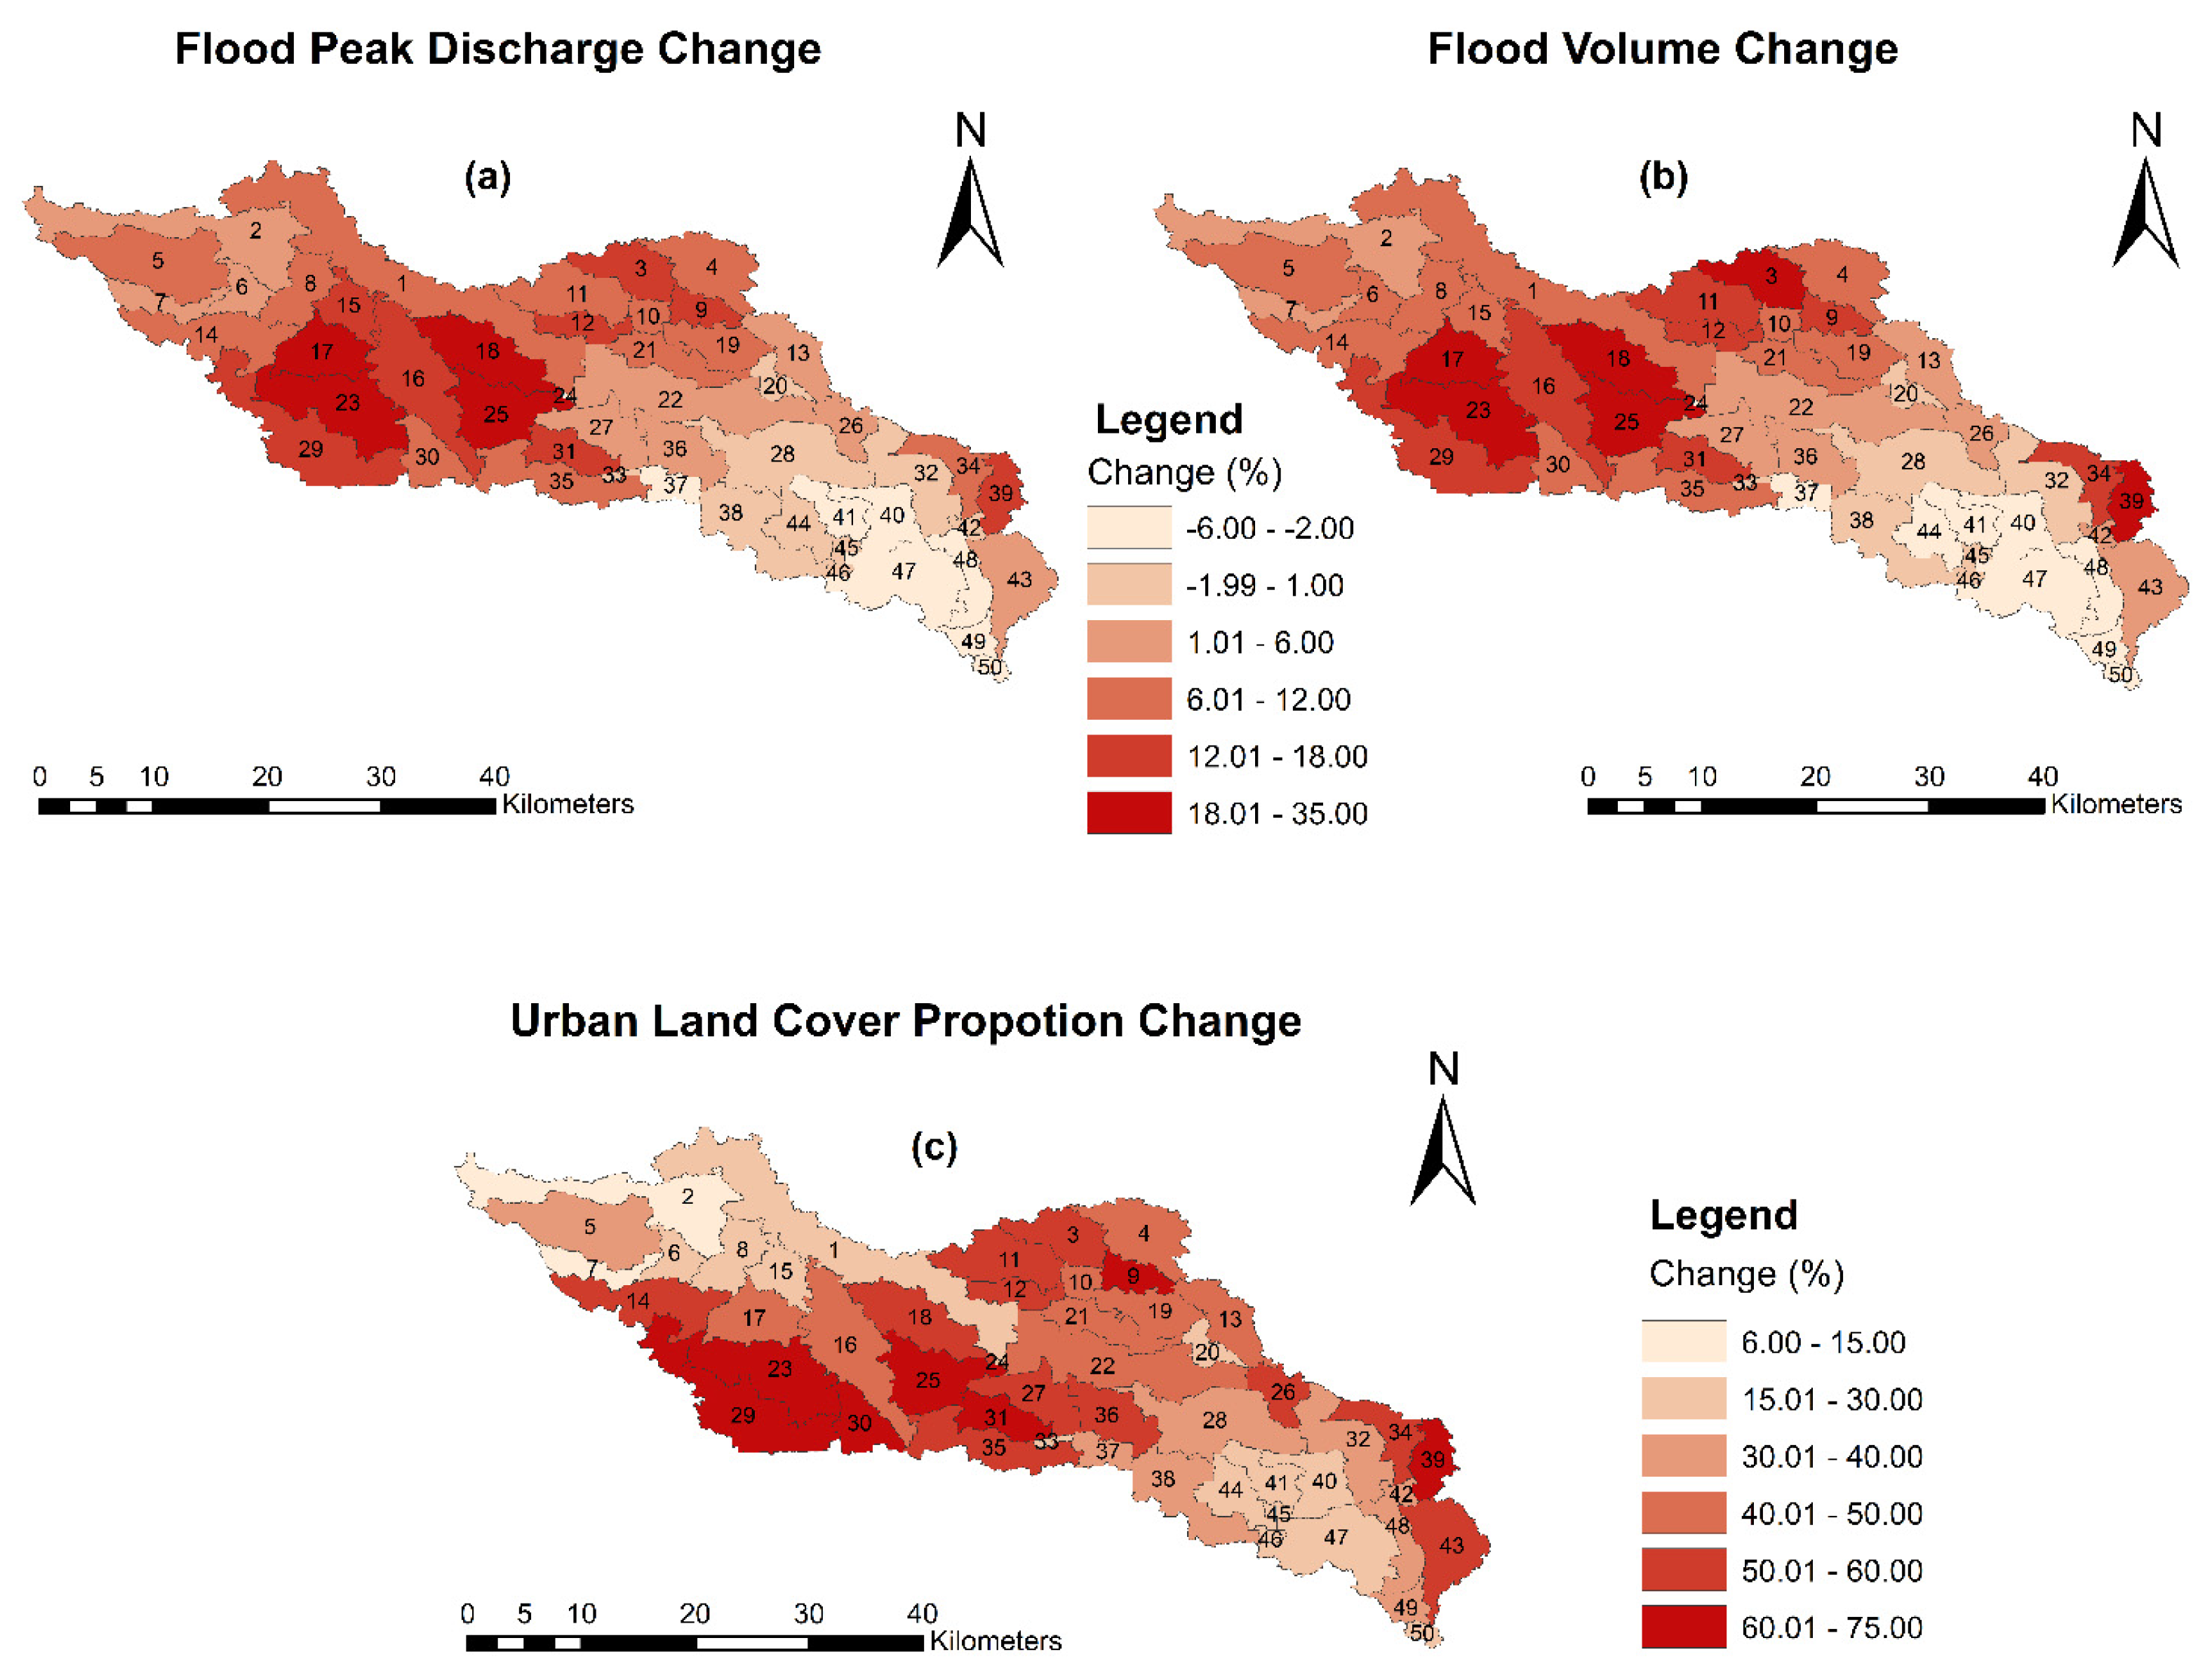
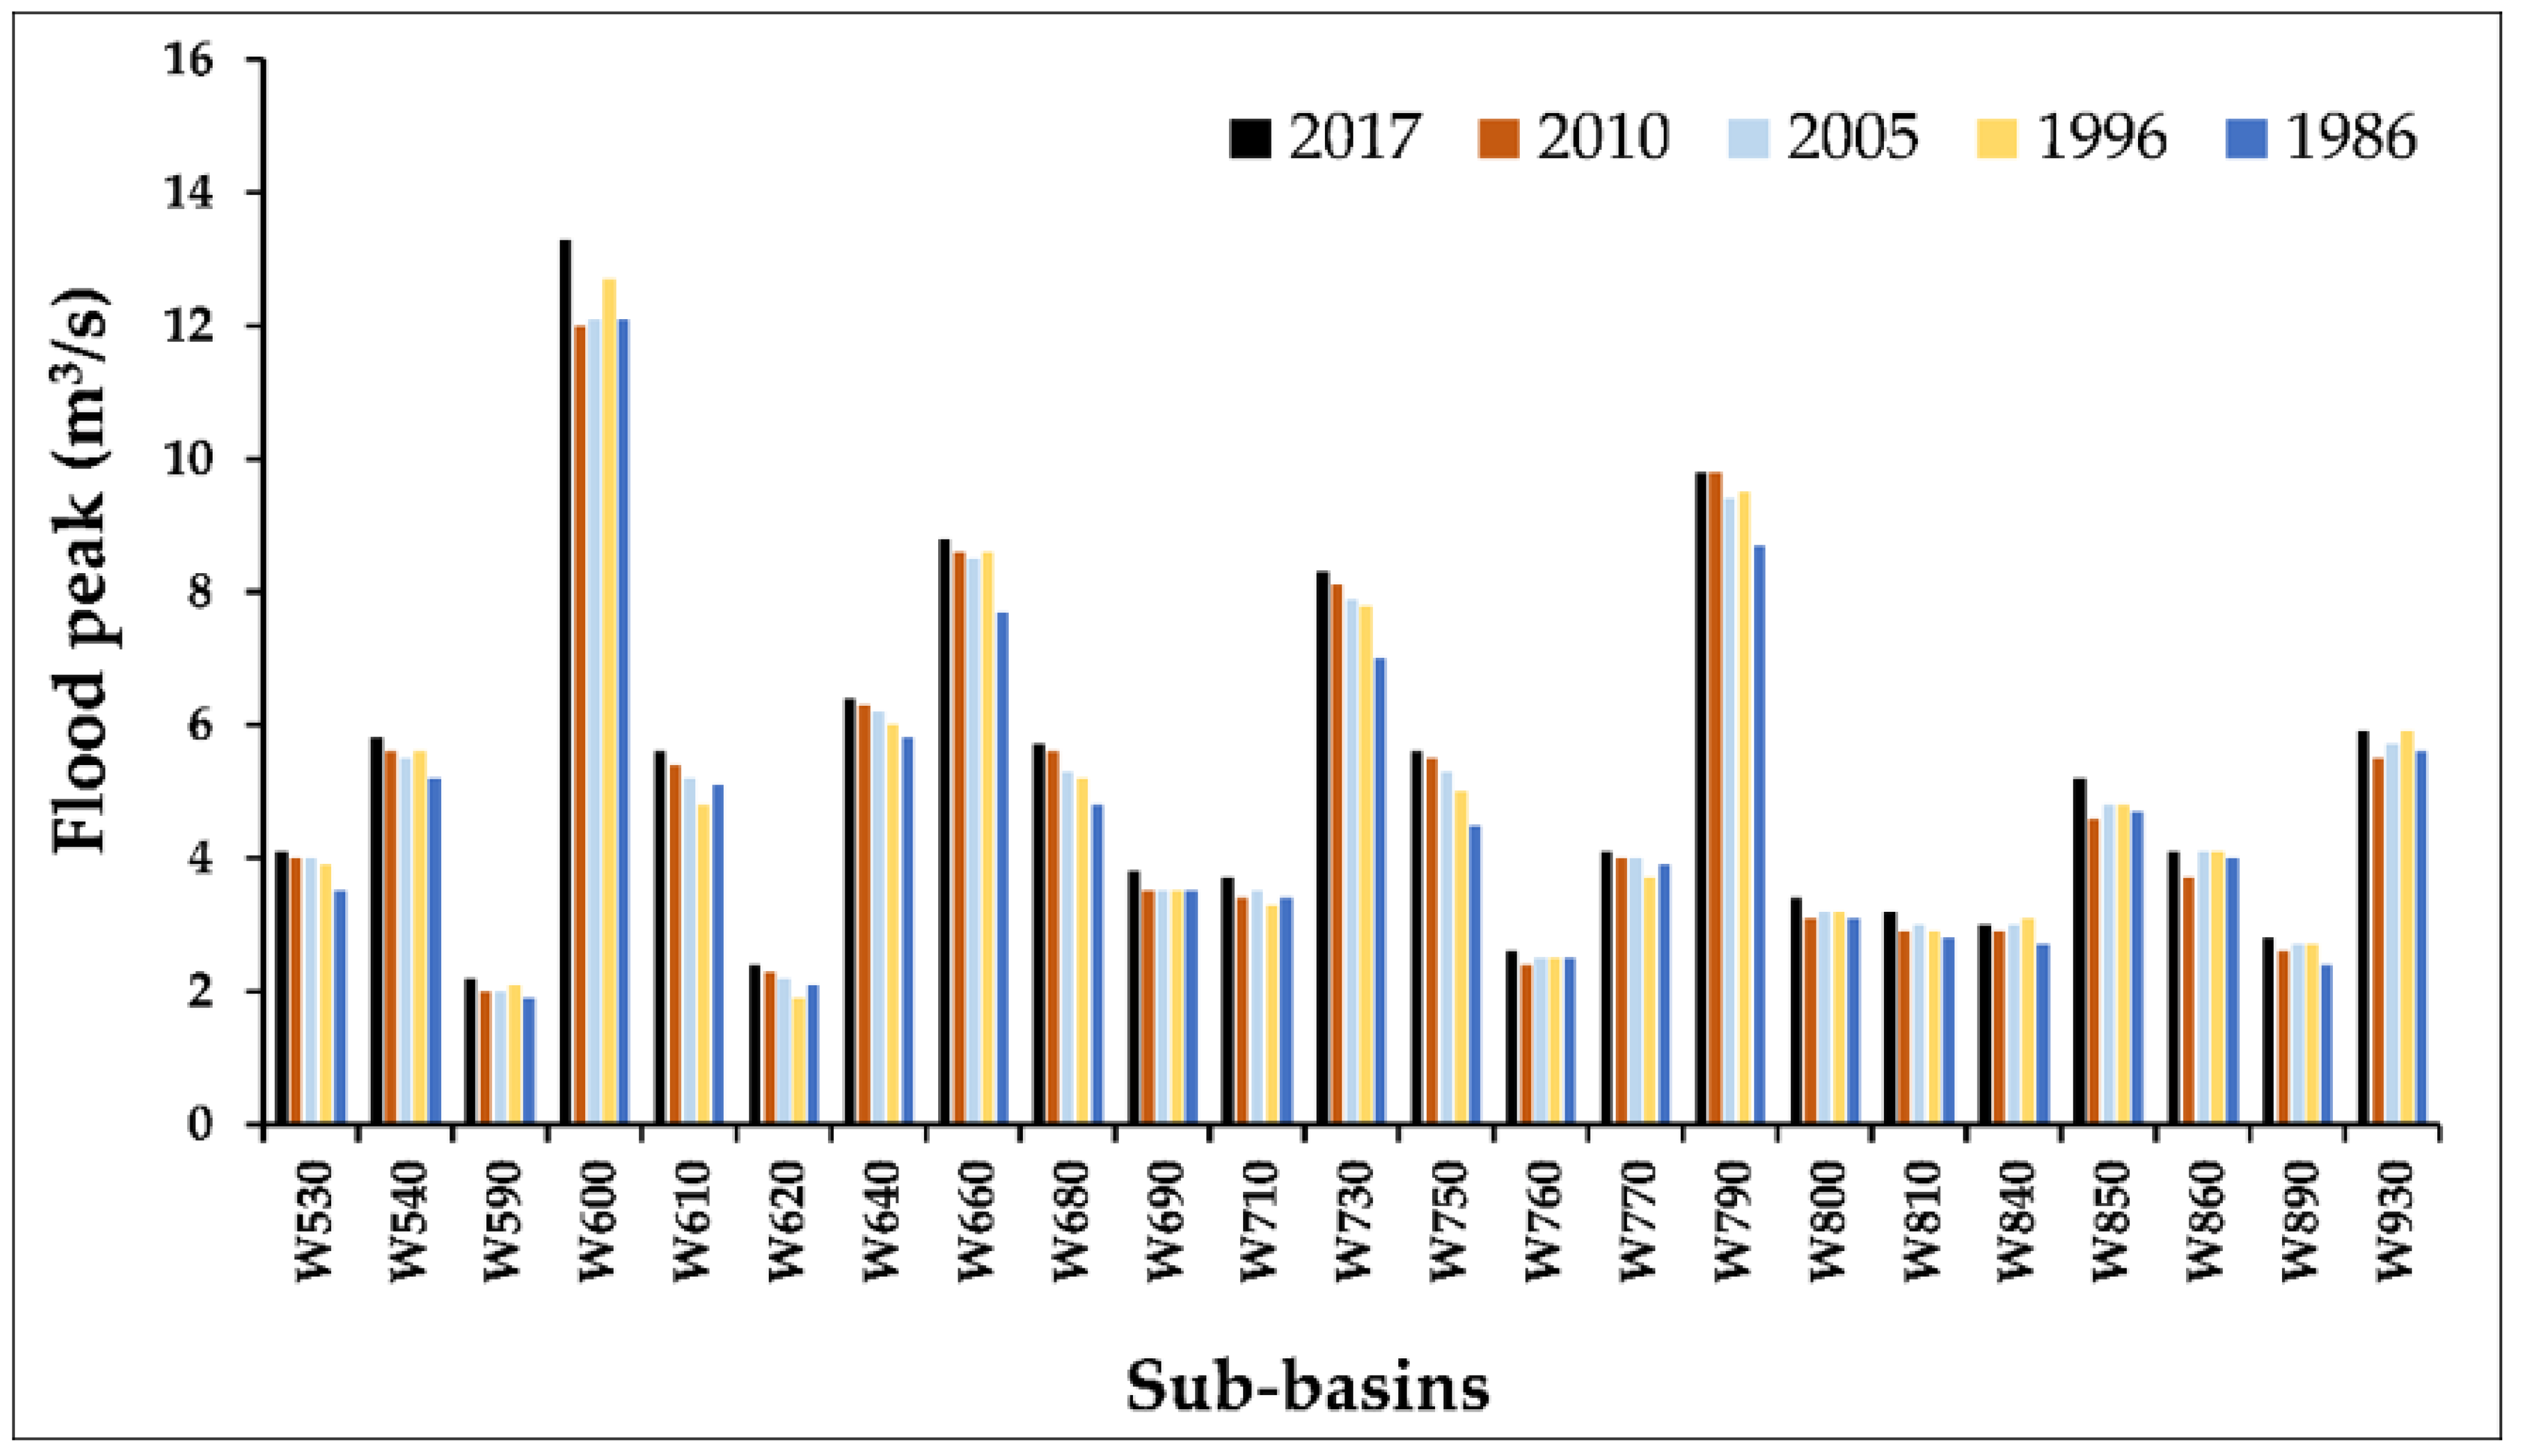
3.3. Hydrological Responses to Urban Land Use/Cover Change at the Sub-Basin Scale

The changes of flood peak discharge and flood volume at the sub-catchment scale were much more obvious. As can be seen from the Figure 8a,b, the statistical analysis of flood volume and flood peak discharge showed an overall increasing trend at various degrees in most sub-basins during 1986–2017. The spatial variability in flood peak discharge and flood volume in sub-basins corresponded to various percentages of urban expansion in these sub-basins (Figure 8c). Sub-basins with the highest increase in urban land use/cover change showed a larger increase in flood peak and flood volume. Similarly, sub-basins with little to no change in urban land cover demonstrated a slight change in flood peak and volume (Figure 8). Sub-basins with the highest increase in flood peak discharge and flood volume were mainly located in the upper middle stream regions of the study catchment (Figure 8a,b). For example, from 1986 to 2017, the simulation results showed that an increase in urban land cover of 66.1% and 74.9% in sub-basins W730 and W750 had led to significant increases in flood volume and peak discharge of 19.39% and 18.57% and of 25.8% and 24.44%, respectively. The spatial distribution pattern of land cover types and analysis at the sub-basins scale showed that these sub-basins were associated with the highest increase in urban land cover. On the other hand, sub-basins with little to no change in flood peak and flood volume were located in the downstream regions near the catchment outlet (Figure 8a,b). These regions showed no significant change in urban land cover during 1986–2017 (Figure 5c). For example, the change in urban land cover of 6.1% in sub-basin W520 resulted in a slight increase in flood peak discharge (1.12%) and flood volume (1.20%).
Additionally, we selected 23 sub-basins that have the largest increases in urban land growth and examined their trends in flood peak discharge from 1986 to 2017. The statistical analysis of the flood hydrological response revealed an increasing trend in flood peak discharge, as shown in Figure 9. These results confirmed that different degrees and spatial heterogeneity of land cover types in various years (1986, 1996, 2005, 2010 and 2017) likely played a big role in the hydrological response in these sub-basins.
However, we observed a decrease in flood volume and flood peak discharge in few sub-basins. For example, from 1986 to 2017, in sub-basin W740, flood peak discharge and flood volume decreased by 2.04% and 3.09%, respectively. The spatial analysis of land cover types in these sub-basins revealed an increase in vegetation coverage mainly due to the introduction of recreational facilities in these sub-basins (e.g., urban forest) and a slight increase in urban land cover type from 1986 to 2017.

4. Discussion

Many cities are experiencing the increase in urban land at the highest rate in developing countries [9]. A similar tendency was observed in our study catchment in Beijing, China. The increases in urbanization were mainly caused by the conversion of agricultural land to urban land. Other authors [36,79] revealed the expansion in urban land in the last four decades mainly due to urbanization policy that facilitates urban growth, population growth and demand for housing and industries. These changes in urban land use/cover have increased the vulnerability of the study catchment to flood hazards. For example, we observed an increase in flood peak discharge and flood volume during 1986–2017. As discussed by Suriya and Mudgal [80], the transformation of agriculture and grassland land into impervious surfaces (e.g., buildings, roads) often leads to different levels of increase in flood disaster. Similar observations have also been made by other studies conducted in Beijing. For example, Zhang et al. [81] observed an increase in surface runoff in catchment associated with a high rate of urban development compared to that of catchment associated with a low rate of urbanization in Beijing. Zhao et al. [82] investigated the impact of increasing urban areas in the Dahongmen catchment in Beijing and observed an increase in surface runoff by 3.5 times compared to that in the non-urbanization period. These studies observed that the increase in urban land cover has intensified the potential of floods risk in Beijing. Most of the above studies mostly focused on bigger catchment analysis and lack a deep analysis at the small-scale level (e.g., sub-basin), which may provide essential information in developing sustainable urban flood management strategies.
The present study has the advantages of assessing the long-term dynamics of urban land use/cover and quantifying the impact of these urban growths to flood risk both at the basin and sub-basin scales in the study catchment in Beijing. We investigated the changes in flood volume and flood peak discharge in sub-basins and found a decrease in both flood volume and flood peak discharge in few sub-basins from 1986 to 2017. Our analysis revealed that these sub-basins had the highest proportion of vegetation coverage mainly caused by the introduction of urban green spaces (e.g., park, urban forest). In contrast, most of the sub-basins demonstrated a continuous increase in both flood volume and flood peak discharge, these sub-basins were associated with the highest expansion in urban land use/cover during 1986–2017. We observed a consistent increasing trend between the proportion of urban land cover change and flood volume and flood peak discharge in these sub-basins. Our findings showed that the urban planning processes that take into account the inclusion of green areas in a small-scale area can contribute significantly to reducing runoff and floods in Beijing. Other few studies attempted to assess the impact of urban green spaces on surface runoff reduction. For example, Gao et al. [83] examined the impact of various expansions in urban land and proposed that the area covered by urban land should not exceed 20% to avoid an increase in urban flooding. Similarly, Sun and Caldwell [84] argued that an increase in urban land up to 43% would double the surface runoff and floods in the catchment. These studies helped us to understand the impact of green space in reducing flood disasters in urban areas. However, they lack a deep analysis at the small0scale level, which is crucial for flood management in urbanized catchments.
Other regions of China have also been affected by floods due to urban growth. For example, Shao et al. [85] studied the relationship between the change in urban land cover and urban runoffs at many small watersheds in Wuhan City. They found that urban growth has resulted in an increase in surface runoff and recommended the use of pervious surfaces (e.g., green spaces) as a way of reducing the risk of urban flooding. In addition, other studies attributed the increase in flooding to change in urban development patterns and climate change [37,86,87].
Moreover, authors in different parts of the world argued that the fast increase in urban land is one of the main causes of the increase in streamflow and flooding in urban areas [80,88]. Nevertheless, few studies [20,87] showed that the increase in urban flooding has a correlation with the change in spatial configuration of urban land use. Therefore, some specific placement of new urban land could be very useful to minimizing flood peak discharge in an urban catchment. According to Mitsakis et al. [89], floods cause damage to urban infrastructure (e.g., road cut) and interruption of business activities, which may result in negative impact to human life and the economy in general.

5. Conclusions

This study investigated the impact of urban sprawl on flash flood peak discharge and flood volume in the Liangshuihe urban catchment in Beijing, China. We used a combination of historical mapping of urban growth during 1986–2017 and hydro-meteorological data as inputs to the HEC-HMS hydrological model to assess the impact of urban expansion on catchment hydrological response. Our findings indicated that major changes were observed in urban land use/cover type (an increase of up to 40.26%) and in agricultural land use/cover type (a decrease of 39.57%) from 1986 to 2017. The urban growth increased the trend in flood peak discharge and flood volume up to 7.02% and 11.93%, respectively. Importantly, the changes in flood peak discharge and flood volume were more obvious at the sub-basin level. Highly urbanized sub-basins demonstrated an increasing flood peak discharge and flood volume up to 24.44% and 25.88%, respectively. The above findings help us to better understand the continuous impact of urban land cover expansion on flooding in urban areas. Furthermore, the outcome of this study suggest that urban planners and policy makers should consider an increase in flood peak discharge under future urban expansion when designing and devising land use/cover policies and flood management facilities. The present study did not consider the detailed impact of climate change in causing urban floods in the study catchment. It serves as a basis for further research to consider the impact of increasing high-intensity storms due to climate change on flood occurrence in the study catchment.

Author Contributions

Funding acquisition, R.L.; conceptualization, R.L. and C.K.; methodology, C.K.; supervision, R.L.; project administration, R.L.; investigation, C.K. and R.L.; data curation, J.D.; visualization, D.E.R.R. and C.K.; writing—original draft preparation, C.K.; writing—review and editing, D.E.R.R. All authors have read and agreed to the published version of the manuscript.

Funding

This work was supported by the National Key Research and Development Program of China (Grant No. 2017YFC1501402), the National Natural Science Foundation of China NSFC (Grant No.41675022, 41661144007, 41830104, 42105123), and the Jiangsu Provincial 2011 Program (Col-laborative Innovation Center of Climate Change).

Data Availability Statement

The dataset related to this article are available upon request.

Acknowledgments

The first author has a doctoral grant funded by the Chinese Academy of Science (CAS) and The World Academy of Sciences (TWAS). Additionally, we thank the United States Geological Survey (USGS) for open access to the Landsat imagery archive.

Conflicts of Interest

The authors declare no conflict of interest.

References

  1. United Nations. World Urbanization Prospects. United Nations Department of Economic and Social Affairs; Population Division: New York, NY, USA, 2018; Volume 12, pp. 197–236. [Google Scholar]
  2. Cohen, B. Urbanization in developing countries: Current trends, future projections, and key challenges for sustainability. Technol. Soc. 2006, 28, 63–80. [Google Scholar] [CrossRef]
  3. Molina-Navarro, E.; Trolle, D.; Martínez-Pérez, S.; Sastre-Merlín, A.; Jeppesen, E. Hydrological and water quality impact assessment of a Mediterranean limno-reservoir under climate change and land use management scenarios. J. Hydrol. 2014, 509, 354–366. [Google Scholar] [CrossRef]
  4. Umair, M.; Kim, D.; Choi, M. Impacts of land use/land cover on runoff and energy budgets in an East Asia ecosystem from remotely sensed data in a community land model. Sci. Total Environ. 2019, 684, 641–656. [Google Scholar] [CrossRef]
  5. Oni, S.K.; Futter, M.N.; Buttle, J.; Dillon, P.J. Hydrological footprints of urban developments in the Lake Simcoe watershed, Canada: A combined paired-catchment and change detection modelling approach. Hydrol. Processes 2015, 29, 1829–1843. [Google Scholar] [CrossRef]
  6. Shao, M.; Zhao, G.; Kao, S.C.; Cuo, L.; Rankin, C.; Gao, H. Quantifying the effects of urbanization on floods in a changing environment to promote water security—A case study of two adjacent basins in Texas. J. Hydrol. 2020, 589, 125154. [Google Scholar] [CrossRef]
  7. Guha-Sapir, D.; Hoyois, P.; Below, R. Annual Disaster Statistical Review 2013: The Numbers and Trends; CRED: Brussels, Belgium, 2014. [Google Scholar]
  8. Wu, Z.; Shen, Y.; Wang, H.; Wu, M. Urban flood disaster risk evaluation based on ontology and Bayesian Network. J. Hydrol. 2020, 583, 124596. [Google Scholar] [CrossRef]
  9. Moniruzzaman, M.; Thakur, P.K.; Kumar, P.; Ashraful Alam, M.; Garg, V.; Rousta, I.; Olafsson, H. Decadal Urban Land Use/Land Cover Changes and Its Impact on Surface Runoff Potential for the Dhaka City and Surroundings Using Remote Sensing. Remote Sens. 2020, 13, 83. [Google Scholar] [CrossRef]
  10. Miller, J.D.; Brewer, T. Refining flood estimation in urbanized catchments using landscape metrics. Landsc. Urban Plan. 2018, 175, 34–49. [Google Scholar] [CrossRef]
  11. United Nations, Department of Economic and Social Affairs, Population Division. World Urbanization Prospects: The 2011 Revision; United Nations, Department of Economic and Social Affairs, Population Division: Geneva, Switzerland, 2012. [Google Scholar]
  12. Kuang, W.H.; Liu, J.Y.; Zhang, Z.X.; Lu, D.S.; Xiang, B. Spatiotemporal dynamics of impervious surface areas across China during the early 21st century. Chin. Sci. Bull. 2013, 58, 1691–1701. [Google Scholar] [CrossRef]
  13. Pickett, S.T.A.; Cadenasso, M.L.; Grove, J.M.; Boone, C.G.; Groffman, P.M.; Irwin, E.; Kaushal, S.S.; Marshall, V.; McGrath, B.P.; Nilon, C.H.; et al. Urban ecological systems: Scientific foundations and a decade of progress. J. Environ. Manag. 2011, 92, 331–362. [Google Scholar] [CrossRef]
  14. Chen, Y.; Zhou, H.; Zhang, H.; Du, G.; Zhou, J. Urban flood risk warning under rapid urbanization. Environ. Res. 2015, 139, 3–10. [Google Scholar] [CrossRef] [PubMed]
  15. Nirupama, N.; Simonovic, S.P. Increase of flood risk due to urbanisation: A Canadian example. Nat. Hazards 2007, 40, 25–41. [Google Scholar] [CrossRef]
  16. Saghafian, B.; Farazjoo, H.; Bozorgy, B.; Yazdandoost, F. Flood intensification due to changes in land use. Water Resour. Manag. 2008, 22, 1051–1067. [Google Scholar] [CrossRef]
  17. Kim, H.W.; Kim, J.-H.; Li, W.; Yang, P.; Cao, Y. Exploring the impact of green space health on runoff reduction using NDVI. Urban For. Urban Green. 2017, 28, 81–87. [Google Scholar] [CrossRef]
  18. Li, F.; Liu, Y.; Engel, B.A.; Chen, J.; Sun, H. Green infrastructure practices simulation of the impacts of land use on surface runoff: Case study in Ecorse River watershed, Michigan. J. Env. Manag. 2019, 233, 603–611. [Google Scholar] [CrossRef] [PubMed]
  19. Abdullah, S.; Adnan, M.S.G.; Barua, D.; Murshed, M.M.; Kabir, Z.; Chowdhury, M.B.H.; Hassan, Q.K.; Dewan, A. Urban green and blue space changes: A spatiotemporal evaluation of impacts on ecosystem service value in Bangladesh. Ecol. Inform. 2022, 70, 101730. [Google Scholar] [CrossRef]
  20. Debbage, N.; Shepherd, J.M. The Influence of Urban Development Patterns on Streamflow Characteristics in the Charlanta Megaregion. Water Resour. Res. 2018, 54, 3728–3747. [Google Scholar] [CrossRef]
  21. Lee, J.G.; Heaney, J.P. Estimation of Urban Imperviousness and its Impacts on Storm Water Systems. J. Water Resour. Plan. Manag. 2003, 129, 419–426. [Google Scholar] [CrossRef]
  22. Zhang, Z.; Li, N.; Wang, X.; Liu, F.; Yang, L. A comparative study of urban expansion in Beijing, Tianjin and Tangshan from the 1970s to 2013. Remote Sens. 2016, 8, 496. [Google Scholar] [CrossRef]
  23. Cao, G.Y.; Chen, G.; Pang, L.H.; Zheng, X.Y.; Nilsson, S. Urban growth in China: Past, prospect, and its impacts. Popul. Environ. 2012, 33, 137–160. [Google Scholar] [CrossRef]
  24. Zhou, Q.; Leng, G.; Su, J.; Ren, Y. Comparison of urbanization and climate change impacts on urban flood volumes: Importance of urban planning and drainage adaptation. Sci. Total Environ. 2019, 658, 24–33. [Google Scholar] [CrossRef] [PubMed]
  25. Wang, Y.; Xie, X.; Liang, S.; Zhu, B.; Yao, Y.; Meng, S.; Lu, C. Quantifying the response of potential flooding risk to urban growth in Beijing. Sci. Total Environ. J. 2019, 705, 136868. [Google Scholar] [CrossRef] [PubMed]
  26. Lyu, H.M.; Sun, W.J.; Shen, S.L.; Arulrajah, A. Flood risk assessment in metro systems of mega-cities using a GIS-based modeling approach. Sci. Total Environ. 2018, 626, 1012–1025. [Google Scholar] [CrossRef] [PubMed]
  27. Sang, Y.F.; Yang, M. Urban waterlogs control in China: More effective strategies and actions are needed. Nat. Hazards 2017, 85, 1291–1294. [Google Scholar] [CrossRef]
  28. Yin, J.; Ye, M.; Yin, Z.; Xu, S. A review of advances in urban flood risk analysis over China. Stoch. Environ. Res. Risk Assess. 2015, 29, 1063–1070. [Google Scholar] [CrossRef]
  29. Wang, Y.; Sun, M.; Song, B. Public perceptions of and willingness to pay for sponge city initiatives in China. Resour. Conserv. Recycl. 2017, 122, 11–20. [Google Scholar] [CrossRef]
  30. Wu, J.; Miao, C.; Wang, Y.; Duan, Q.; Zhang, X. Contribution analysis of the long-term changes in seasonal runoff on the Loess Plateau, China, using eight Budyko-based methods. J. Hydrol. 2017, 545, 263–275. [Google Scholar] [CrossRef]
  31. Yuan, Y.; Xu, Y.S.; Arulrajah, A. Sustainable measures for mitigation of flooding hazards: A case study in Shanghai, China. Water 2017, 9, 310. [Google Scholar] [CrossRef]
  32. Miao, Q.; Yang, D.; Yang, H.; Li, Z. Establishing a rainfall threshold for flash flood warnings in China’s mountainous areas based on a distributed hydrological model. J. Hydrol. 2016, 541, 371–386. [Google Scholar] [CrossRef]
  33. Li, X.; Zhang, Q.; Hu, Q.; Zhang, D.; Ye, X. Lake flooding sensitivity to the relative timing of peak flows between upstream and downstream waterways: A case study of Poyang Lake, China. Hydrol. Processes 2017, 31, 4217–4228. [Google Scholar] [CrossRef]
  34. Lin, W.; Sun, Y.; Nijhuis, S.; Wang, Z. Scenario-based flood risk assessment for urbanizing deltas using future land-use simulation (FLUS): Guangzhou Metropolitan Area as a case study. Sci. Total Env. 2020, 739, 139899. [Google Scholar] [CrossRef] [PubMed]
  35. Tan, M.; Guy, M.R.; Li, X. Urban spatial development and land use in Beijing: Implications from London’s experiences. J. Geogr. Sci. 2011, 21, 49–64. [Google Scholar] [CrossRef]
  36. Song, X.; Zhang, J.; AghaKouchak, A.; Roy, S.S.; Xuan, Y.; Wang, G.; He, R.; Wang, X.; Liu, C. Rapid urbanization and changes in spatiotemporal characteristics of precipitation in Beijing metropolitan area. J. Geophys. Res. Atmos. 2014, 10, 131–146. [Google Scholar] [CrossRef]
  37. Zhang, Y.; Xia, J.; Yu, J.; Randall, M.; Zhang, Y.; Zhao, T.; Pan, X.; Zhai, X.; Shao, Q. Simulation and assessment of urbanization impacts on runoff metrics: Insights from landuse changes. J. Hydrol. 2018, 560, 247–258. [Google Scholar] [CrossRef]
  38. Zhang, D.-W.; Quan, J.; Zhang, H.-B.; Wang, F.; Wang, H.; He, X.-Y. Flash flood hazard mapping: A pilot case study in Xiapu River Basin, China. Water Sci. Eng. 2015, 8, 195–204. [Google Scholar] [CrossRef]
  39. Mei, C.; Liu, J.; Wang, H.; Yang, Z.; Ding, X.; Shao, W. Integrated assessments of green infrastructure for flood mitigation to support robust decision-making for sponge city construction in an urbanized watershed. Sci. Total Environ. 2018, 639, 1394–1407. [Google Scholar] [CrossRef]
  40. Yao, L.; Chen, L.; Wei, W.; Sun, R. Urban Forestry & Urban Greening Potential reduction in urban runoff by green spaces in Beijing: A scenario analysis. Urban For. Urban Green. 2015, 14, 300–308. [Google Scholar]
  41. Zhang, J.; Wang, T.; Ge, J. Assessing vegetation cover dynamics induced by policy-driven ecological restoration and implication to soil erosion in southern China. PLoS ONE 2015, 10, 1–17. [Google Scholar] [CrossRef]
  42. FAO; IIASA; ISRIC; ISSCAS; JRC. Harmonized World Soil Database (Version 1.2); FAO: Rome, Italy; IIASA: Laxenburg, Austria, 2012. [Google Scholar]
  43. Chowdhury, S.; Peddle, D.R.; Wulder, M.A.; Heckbert, S.; Shipman, T.C.; Chao, D.K. Estimation of land-use/land-cover changes associated with energy footprints and other disturbance agents in the Upper Peace Region of Alberta Canada from 1985 to 2015 using Landsat data. Int. J. Appl. Earth Obs. Geoinf. 2021, 94, 2224. [Google Scholar] [CrossRef]
  44. Cochrane, S.M.V.; Matricardi, E.A.T.; Numata, I.; Lefebvre, P.A. Landsat-based analysis of mega dam flooding impacts in the Amazon compared to associated environmental impact assessments: Upper Madeira River example 2006–2015. Remote Sens. Appl. Soc. Environ. 2017, 7, 1–8. [Google Scholar] [CrossRef]
  45. Deines, J.M.; Kendall, A.D.; Crowley, M.A.; Rapp, J.; Cardille, J.A.; Hyndman, D.W. Mapping three decades of annual irrigation across the US High Plains Aquifer using Landsat and Google Earth Engine. Remote Sens. Environ. 2019, 233, 111400. [Google Scholar] [CrossRef]
  46. Li, W.; Dong, R.; Fu, H.; Wang, J.; Yu, L.; Gong, P. Integrating Google Earth imagery with Landsat data to improve 30-m resolution land cover mapping. Remote Sens. Environ. 2020, 237, 111563. [Google Scholar] [CrossRef]
  47. Wellmann, T.; Schug, F.; Haase, D.; Pflugmacher, D.; van der Linden, S. Green growth? On the relation between population density, land use and vegetation cover fractions in a city using a 30-years Landsat time series. Landsc. Urban Plan. 2020, 202, 103857. [Google Scholar] [CrossRef]
  48. White, J.C.; Wulder, M.A.; Hobart, G.W.; Luther, J.E.; Hermosilla, T.; Griffiths, P.; Coops, N.C.; Hall, R.J.; Hostert, P.; Dyk, A.; et al. Pixel-based image compositing for large-area dense time series applications and science. Can. J. Remote Sens. 2014, 40, 192–212. [Google Scholar] [CrossRef]
  49. John, E.; Wasige, T.A.G.; Smaling, E.; Jetten, V. Monitoring basin-scale land cover changes in Kagera Basin of Lake Victoria using ancillary data and remote sensing. Int. J. Appl. Earth Obs. Geoinf. 2013, 21, 32–42. [Google Scholar] [CrossRef]
  50. Mekonnen, D.F.; Duan, Z.; Rientjes, T.; Disse, M. Analysis of combined and isolated effects of land-use and land-cover changes and climate change on the upper Blue Nile River basin’s streamflow. Hydrol. Earth Syst. Sci. 2018, 22, 6187–6207. [Google Scholar] [CrossRef]
  51. Matthew, M.W.; Adler-Golden, S.; Berk, A.; Felde, G.; Anderson, G.P.; Gorodetzky, D.; Paswaters, S.; Shippert, M. Atmospheric Correction of Spectral Imagery: Evaluation of the FLAASH Algorithm with AVIRIS Data. In Proceedings of the 31st Applied Imagery Pattern Recognition Workshop—IEEE, Washington, DC, USA, 12–14 October 2002; p. 6. [Google Scholar] [CrossRef]
  52. Bayarsaikhan, U.; Boldgiv, B.; Kim, K.-R.; Park, K.-A.; Lee, D. Change detection and classification of land cover at Hustai National Park in Mongolia. Int. J. Appl. Earth Obs. Geoinf. 2009, 11, 273–280. [Google Scholar] [CrossRef]
  53. Kun, B.W.; Tian, Y.; Zeng, Y.; Li, Q. Vegetation classification method with biochemical composition estimated from remote sensing data. Int. J. Remote Sens. 2011, 1161, 554454. [Google Scholar] [CrossRef]
  54. Zheng, M.; Cai, Q.; Qin, M. The effect of prior probabilities in the maximum likelihood classification on individual classes: A theoretical reasoning and empirical testing. Photogramm. Eng. Remote Sens. 2009, 75, 1109–1117. [Google Scholar] [CrossRef]
  55. Estoque, R.C.; Pontius, R.G.; Murayama, Y.; Hou, H.; Thapa, R.B.; Lasco, R.D.; Villar, M.A. Simultaneous comparison and assessment of eight remotely sensed maps of Philippine forests. Int. J. Appl. Earth Obs. Geoinf. 2018, 67, 123–134. [Google Scholar] [CrossRef]
  56. Jacobson, A.; Dhanota, J.; Godfrey, J.; Jacobson, H.; Rossman, Z.; Stanish, A.; Walker, H.; Riggio, J. A novel approach to mapping land conversion using Google Earth with an application to East Africa. Environ. Model. Softw. 2015, 72, 1–9. [Google Scholar] [CrossRef]
  57. Liu, X.; Hu, G.; Chen, Y.; Li, X.; Xu, X.; Li, S.; Pei, F.; Wang, S. High-resolution multi-temporal mapping of global urban land using Landsat images based on the Google Earth Engine Platform. Remote Sens. Environ. 2018, 209, 227–239. [Google Scholar] [CrossRef]
  58. Zhang, Z.; Wang, X.; Zhao, X.; Liu, B.; Yi, L.; Zuo, L.; Wen, Q.; Liu, F.; Xu, J.; Hu, S. A 2010 update of National Land Use/Cover Database of China at 1: 100,000 scale using medium spatial resolution satellite images. Remote Sens. Environ. 2014, 149, 142–154. [Google Scholar] [CrossRef]
  59. Foody, G.M. Status of land cover classification accuracy assessment. Remote Sens. Environ. 2002, 80, 185–201. [Google Scholar] [CrossRef]
  60. Anderson, J.R.; Hardy, E.E.; Roach, J.T.; Witmer, R.E. A Land Use and Land Cover Classification System for Use with Remote Sensor Data; Professional Paper; US Government Printing Office: Washington, DC, USA, 1976. [Google Scholar]
  61. Lu, D.; Mausel, P.; Brondízio, E.; Moran, E. Change detection techniques. Int. J. Remote Sens. 2004, 25, 2365–2401. [Google Scholar] [CrossRef]
  62. Napoli, M.; Massetti, L.; Orlandini, S. Hydrological response to land use and climate changes in a rural hilly basin in Italy. Catena 2017, 157, 1–11. [Google Scholar] [CrossRef]
  63. USACE-HEC. Hydrologic Modeling System HEC-HMS v3.2 User’s Manual; US Army Corps of Engineers, Hydrologic Engineering Center (HEC): Davis, CA, USA, 2008. [Google Scholar]
  64. Zope, P.E.; Eldho, T.I.; Jothiprakash, V. Impacts of land use-land cover change and urbanization on flooding: A case study of Oshiwara River Basin in Mumbai, India. Catena 2016, 145, 142–154. [Google Scholar] [CrossRef]
  65. Kabeja, C.; Li, R.; Guo, J.; Rwatangabo, D.E.R.; Manyifika, M.; Gao, Z.; Wang, Y.; Zhang, Y. The impact of reforestation induced land cover change (1990–2017) on flood peak discharge using HEC-HMS hydrological model and satellite observations: A study in two mountain Basins, China. Water 2020, 12, 1347. [Google Scholar] [CrossRef]
  66. Jin, H.; Liang, R.; Wang, Y.; Tumula, P. Flood-runoff in semi-arid and sub-humid regions, a case study: A simulation of Jianghe watershed in northern China. Water 2015, 7, 5155–5172. [Google Scholar] [CrossRef]
  67. Castro, C.V.; Maidment, D.R. GIS preprocessing for rapid initialization of HEC-HMS hydrological basin models using web-based data services. Environ. Model. Softw. 2020, 130, 104732. [Google Scholar] [CrossRef]
  68. Ali, M.; Khan, S.J.; Aslam, I.; Khan, Z. Simulation of the impacts of land-use change on surface runoff of Lai Nullah Basin in Islamabad, Pakistan. Landsc. Urban Plan. 2011, 102, 271–279. [Google Scholar] [CrossRef]
  69. USACE-HEC. Hydrologic Modeling System HEC-HMS Technical Reference Manual; US Army Corps of Engineers, Hydrologic Engineering Centre (HEC): Davis, CA, USA, 2000. [Google Scholar]
  70. Surendra Kumar Mishra, V.P.S. Soil Conservation Service Curve Number (SCS-CN) Methodology; Water Science and Technology Library; Springer: Berlin/Heidelberg, Germany, 2003. [Google Scholar]
  71. US Department of Agriculture. National Engineering Handbook, Section 4, Hydrology. In National Engineering Handbook; USDA Soil Conservation Service: Washington, DC, USA, 1972. [Google Scholar]
  72. Heimhuber, V.; Hannemann, J.-C.; Rieger, W. Flood Risk Management in Remote and Impoverished Areas—A Case Study of Onaville, Haiti. Water 2015, 7, 3832–3860. [Google Scholar] [CrossRef]
  73. Schumann, G.; Matgen, P.; Cutler, M.E.J.; Black, A.; Hoffmann, L.; Pfister, L. Comparison of remotely sensed water stages from LiDAR, topographic contours and SRTM. ISPRS J. Photogramm. Remote Sens. 2008, 63, 283–296. [Google Scholar] [CrossRef]
  74. Haberlandt, U. Geostatistical interpolation of hourly precipitation from rain gauges and radar for a large-scale extreme rainfall event. J. Hydrol. 2007, 332, 144–157. [Google Scholar] [CrossRef]
  75. Ponce, V.M.; Hawkins, R.H. Runoff Curve Number: Has It Reached Maturity? J. Hydrol. Eng. 1996, 1, 11–19. [Google Scholar] [CrossRef]
  76. Yan, B.; Fang, N.F.; Zhang, P.C.; Shi, Z.H. Impacts of land use change on watershed streamflow and sediment yield: An assessment using hydrologic modelling and partial least squares regression. J. Hydrol. 2013, 484, 26–37. [Google Scholar] [CrossRef]
  77. Nie, W.; Yuan, Y.; Kepner, W.; Nash, M.S.; Jackson, M.; Erickson, C. Assessing impacts of Landuse and Landcover changes on hydrology for the upper San Pedro watershed. J. Hydrol. 2011, 407, 105–114. [Google Scholar] [CrossRef]
  78. Halwatura, D.; Najim, M.M.M. Application of the HEC-HMS model for runoff simulation in a tropical catchment. Environ. Model. Softw. 2013, 46, 155–162. [Google Scholar] [CrossRef]
  79. Liu, J.; Shi, Z.-w. Quantifying land-use change impacts on the dynamic evolution of flood vulnerability. Land Use Policy 2017, 65, 198–210. [Google Scholar] [CrossRef]
  80. Suriya, S.; Mudgal, B.V. Impact of urbanization on flooding: The Thirusoolam sub watershed—A case study. J. Hydrol. 2012, 413, 210–219. [Google Scholar] [CrossRef]
  81. Zhang, B.; Xie, G.; Li, N.; Wang, S. Effect of urban green space changes on the role of rainwater runoff reduction in Beijing, China. Landsc. Urban Plan. 2015, 140, 8–16. [Google Scholar] [CrossRef]
  82. Zhao, G.; Xu, Z.; Pang, B.; Tu, T.; Xu, L.; Du, L. An enhanced inundation method for urban flood hazard mapping at the large catchment scale. J. Hydrol. 2019, 571, 873–882. [Google Scholar] [CrossRef]
  83. Gao, Y.; Yuan, Y.; Wang, H.; Schmidt, A.R.; Wang, K.; Ye, L. Examining the effects of urban agglomeration polders on flood events in Qinhuai River basin, China with HEC-HMS model. Water Sci. Technol. 2017, 75, 2130–2138. [Google Scholar] [CrossRef] [PubMed]
  84. Sun, G.; Caldwell, P. Impacts of Urbanization on Stream Water Quantity and Quality in the United States. Water Resour. Impact 2015, 17, 17–20. [Google Scholar]
  85. Shao, Z.; Fu, H.; Li, D.; Altan, O.; Cheng, T. Remote sensing monitoring of multi-scale watersheds impermeability for urban hydrological evaluation. Remote Sens. Environ. 2019, 232, 111338. [Google Scholar] [CrossRef]
  86. Du, J.; Qian, L.; Rui, H.; Zuo, T.; Zheng, D.; Xu, Y.; Xu, C.Y. Assessing the effects of urbanization on annual runoff and flood events using an integrated hydrological modeling system for Qinhuai River basin, China. J. Hydrol. 2012, 464, 127–139. [Google Scholar] [CrossRef]
  87. Du, S.Q.; Shi, P.J.; Van Rompaey, A.; Wen, J.H. Quantifying the impact of impervious surface location on flood peak discharge in urban areas. Nat. Hazards 2015, 76, 1457–1471. [Google Scholar] [CrossRef]
  88. Anim, D.O.; Fletcher, T.D.; Vietz, G.J.; Pasternack, G.B.; Burns, M.J. Effect of urbanization on stream hydraulics. River Res. Appl. 2018, 34, 661–674. [Google Scholar] [CrossRef]
  89. Mitsakis, E.; Stamos, I.; Diakakis, M.; Grau, J.M.S. Impacts of high-intensity storms on urban transportation: Applying traffic flow control methodologies for quantifying the effects. Int. J. Environ. Sci. Technol. 2014, 11, 2145–2154. [Google Scholar] [CrossRef] [Green Version]
Figure 1. Map of the study area. Location of Liangshuihe catchment in Beijing, China (a). Study area boundary (b).
Remotesensing 14 04273 g001
Figure 2. Map showing the digital elevation model (DEM) (a), sub-basins (b), and soil types (c) of the Liangshuihe catchment.
Remotesensing 14 04273 g002
Figure 3. Spatial distribution of hourly rainfall in the study catchment, (a) Rainstorm 1, (b) Rainstorm 2, and (c) Rainstorm 3.
Remotesensing 14 04273 g003
Figure 4. Comparison between the simulated and measured discharge hydrograph: (a) calibration and (b) validation.
Remotesensing 14 04273 g004
Figure 5. Land use/cover maps of the study catchment in (a) 1986, (b) 1996, (c) 2005, and (d) 2017.
Remotesensing 14 04273 g005
Figure 6. Hydrographs for the land use/cover scenarios of the study catchment under three rainfall events: (a) Rainstorm 1, (b) Rainstorm 2, and (c) Rainstorm 3.
Remotesensing 14 04273 g006aRemotesensing 14 04273 g006b
Figure 7. Relative change in flood peak discharge and flood volume considering various urban land cover increases (1986–2017) in three varying scales rainstorm events: (a) Rainstorm 1, (b) Rainstorm 2, and (c) Rainstorm 3.
Remotesensing 14 04273 g007aRemotesensing 14 04273 g007b
Figure 8. Spatial variations of flood peak discharge (a), flood volume (b), and spatial distribution of relative change in urban land cover (c) between 1986 and 2017 at the sub-basin scale.
Remotesensing 14 04273 g008
Figure 9. Change in land use/cover area at the sub-basin scale and the corresponding change in flood peak from 1986 to 2017.
Remotesensing 14 04273 g009
Table 1. List of Landsat satellite images used in this study with acquisition dates, sensor type, resolutions, and cloud cover.
Date of AcquisitionLandsat SensorResolution (m)Cloud Cover (%)
3 June 1986Landsat-5 TM300
30 June 1996Landsat-5 TM301
23 June 2005Landsat-5 TM303
5 June 2010Landsat-5 TM302
10 July 2017Landsat-8 OLI300.01
Table 2. LULC types and corresponding CN values for each hydrologic soil group used in the present study.
Land Use/Cover TypeCurve Numbers for Hydrologic Soil Group
ABCD
Urban77859092
Forest32587279
Grassland36617480
Agriculture67788589
Water98989898
Table 3. Land use/cover changes in the study catchment from 1986 to 2017.
Land-Use
Type
19862017Change
Area (km2)Percent (%)Area (km2)Percent (%)Area (km2)Percent (%)
Urban312.32325.22811.0865.48498.7640.26
Forest17.071.3812.881.04−4.19−0.34
Grassland103.758.3898.157.92−5.59−0.45
Agriculture803.2164.85313.1625.28−490.05−39.57
Water2.210.183.380.271.180.09
Note: a negative value indicates a decrease in land use/cover.
Table 4. Modeling comparison of flood peak and flood volume simulation results considering land use/cover in 1986 and in 2017.
Varying Scales Rainstorm Events19862017
Flood Peak (m3/s)Flood Volume (mm)Flood Peak (m3/s)Relative Change (%)Flood Volume (mm)Relative Change (%)
Rainstorm 1208.249.12222.66.9253.128.14
Rainstorm 2181.443.28194.87.3946.948.46
Rainstorm 3145.234.971556.7541.6816.33
Publisher’s Note: MDPI stays neutral with regard to jurisdictional claims in published maps and institutional affiliations.

