
Integrating Remote Sensing and Spatiotemporal Analysis to Characterize Artificial Vegetation Restoration Suitability in Desert Areas: A Case Study of Mu Us Sandy Land

 ,
, 
Abstract
:1. Introduction
2. Materials and Methods
2.1. Study Area
2.2. Data Preparations
2.3. Methods
2.3.1. Annual Vegetation Detection by Remote Sensing
2.3.2. Spatiotemporal Analysis for Vegetation Suitability Mapping
2.3.3. Constructing an AVRSI
2.3.4. Mapping Artificial Vegetation Restoration Suitability
3. Results
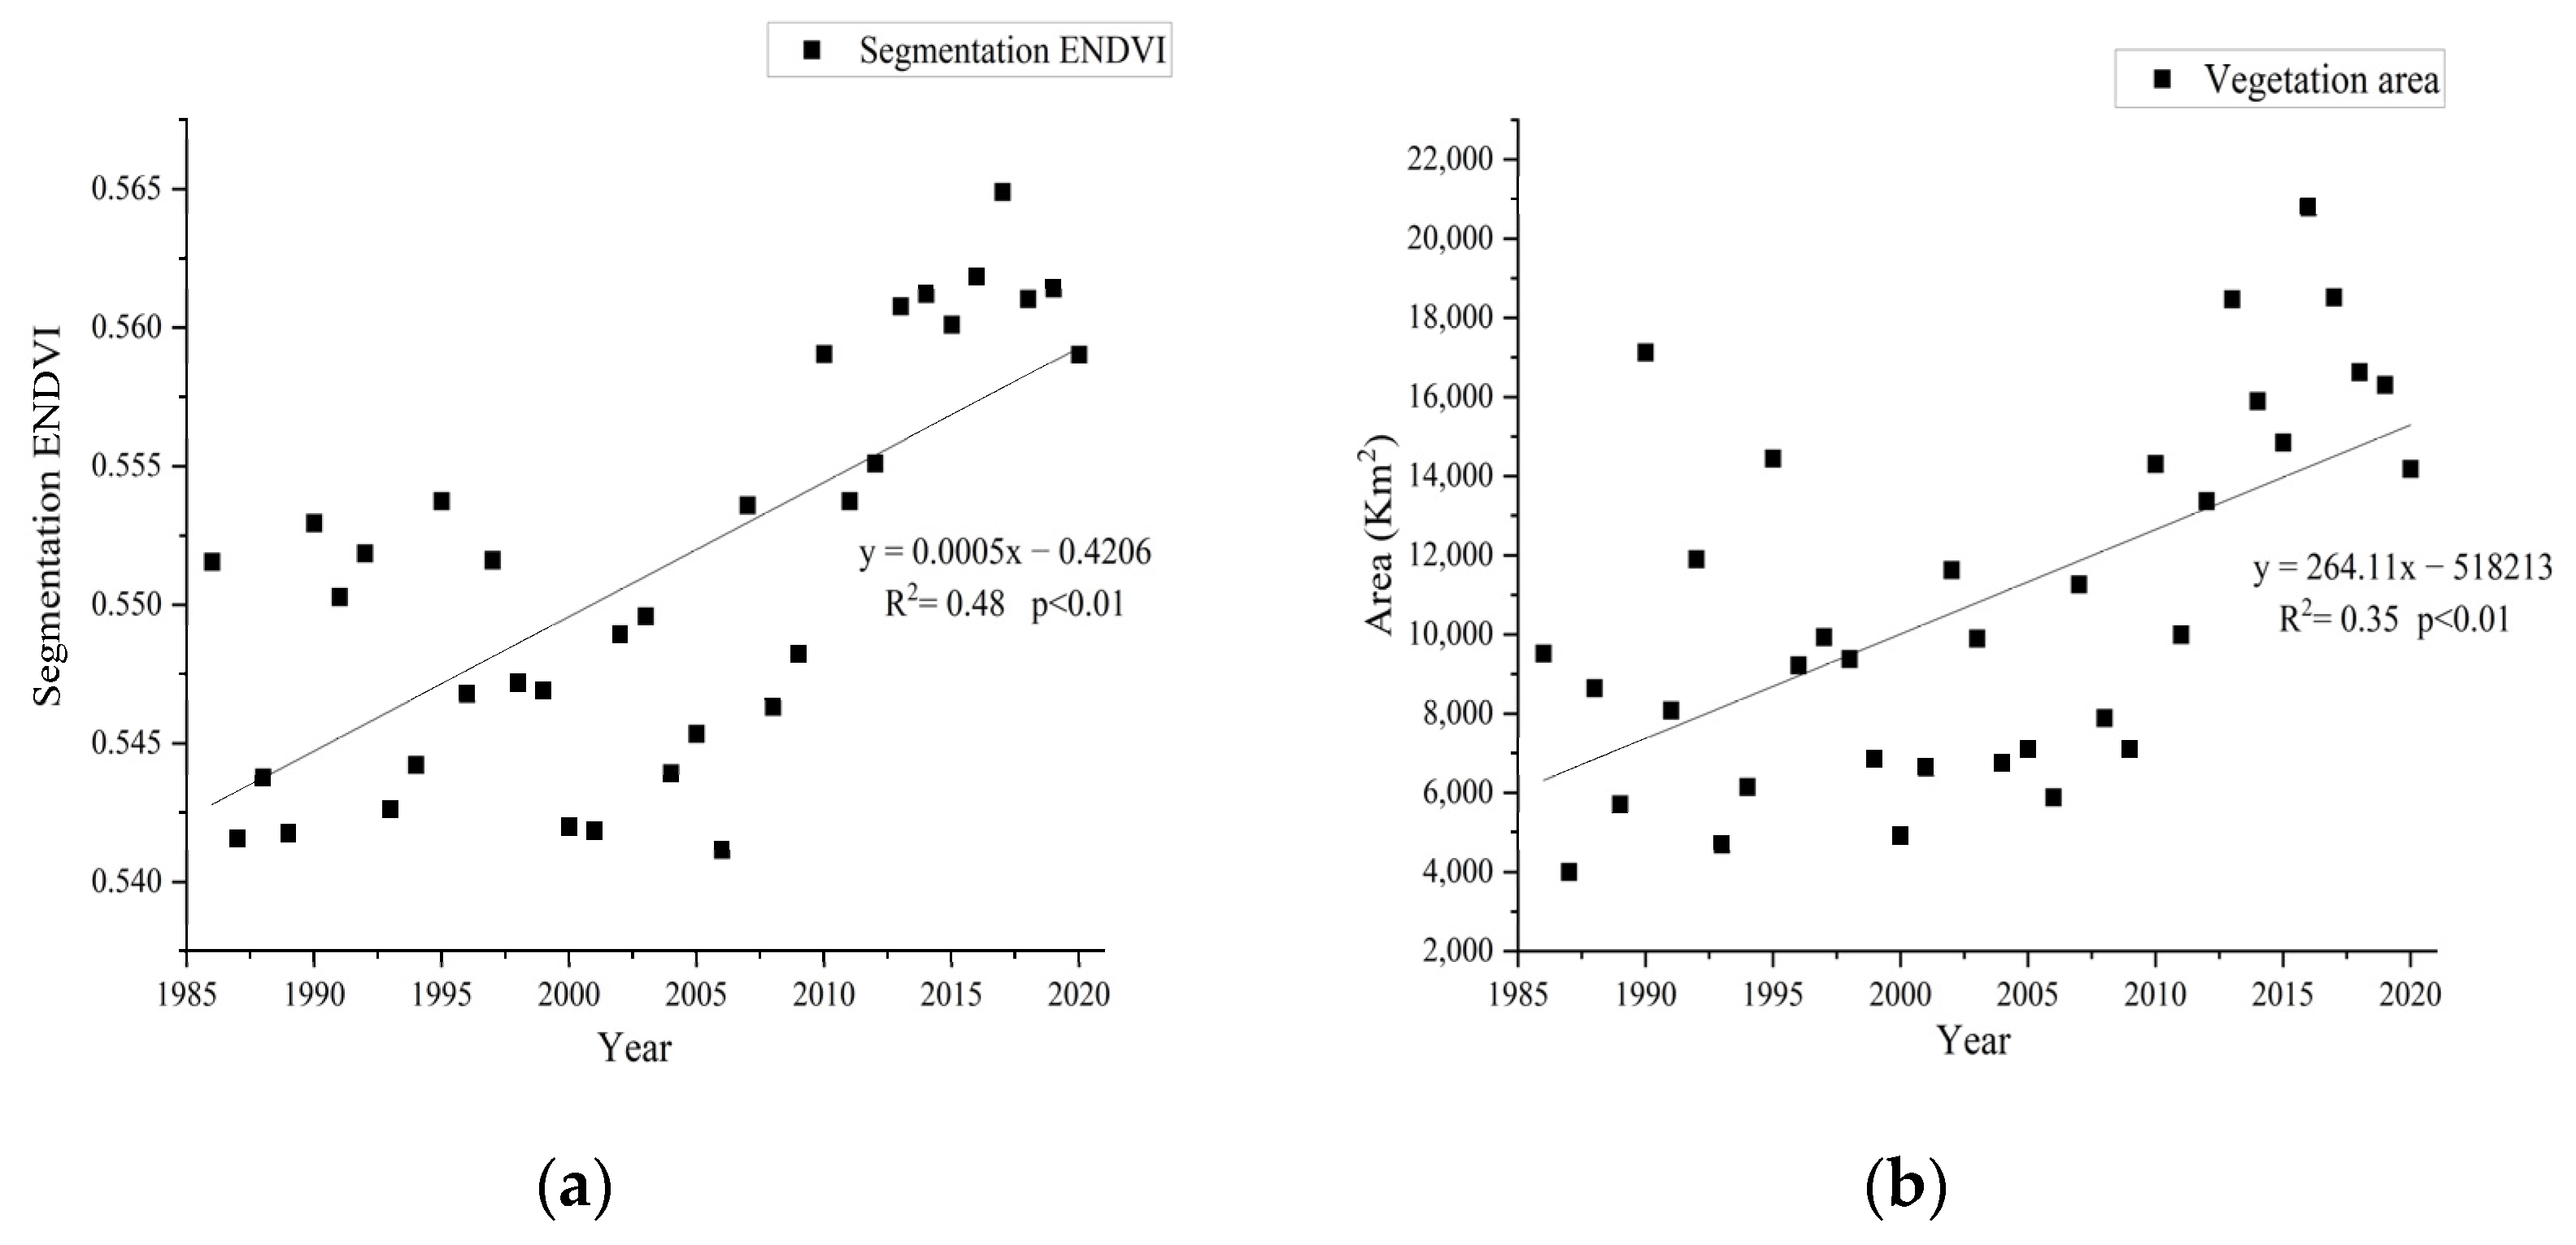
3.1. ENDVI
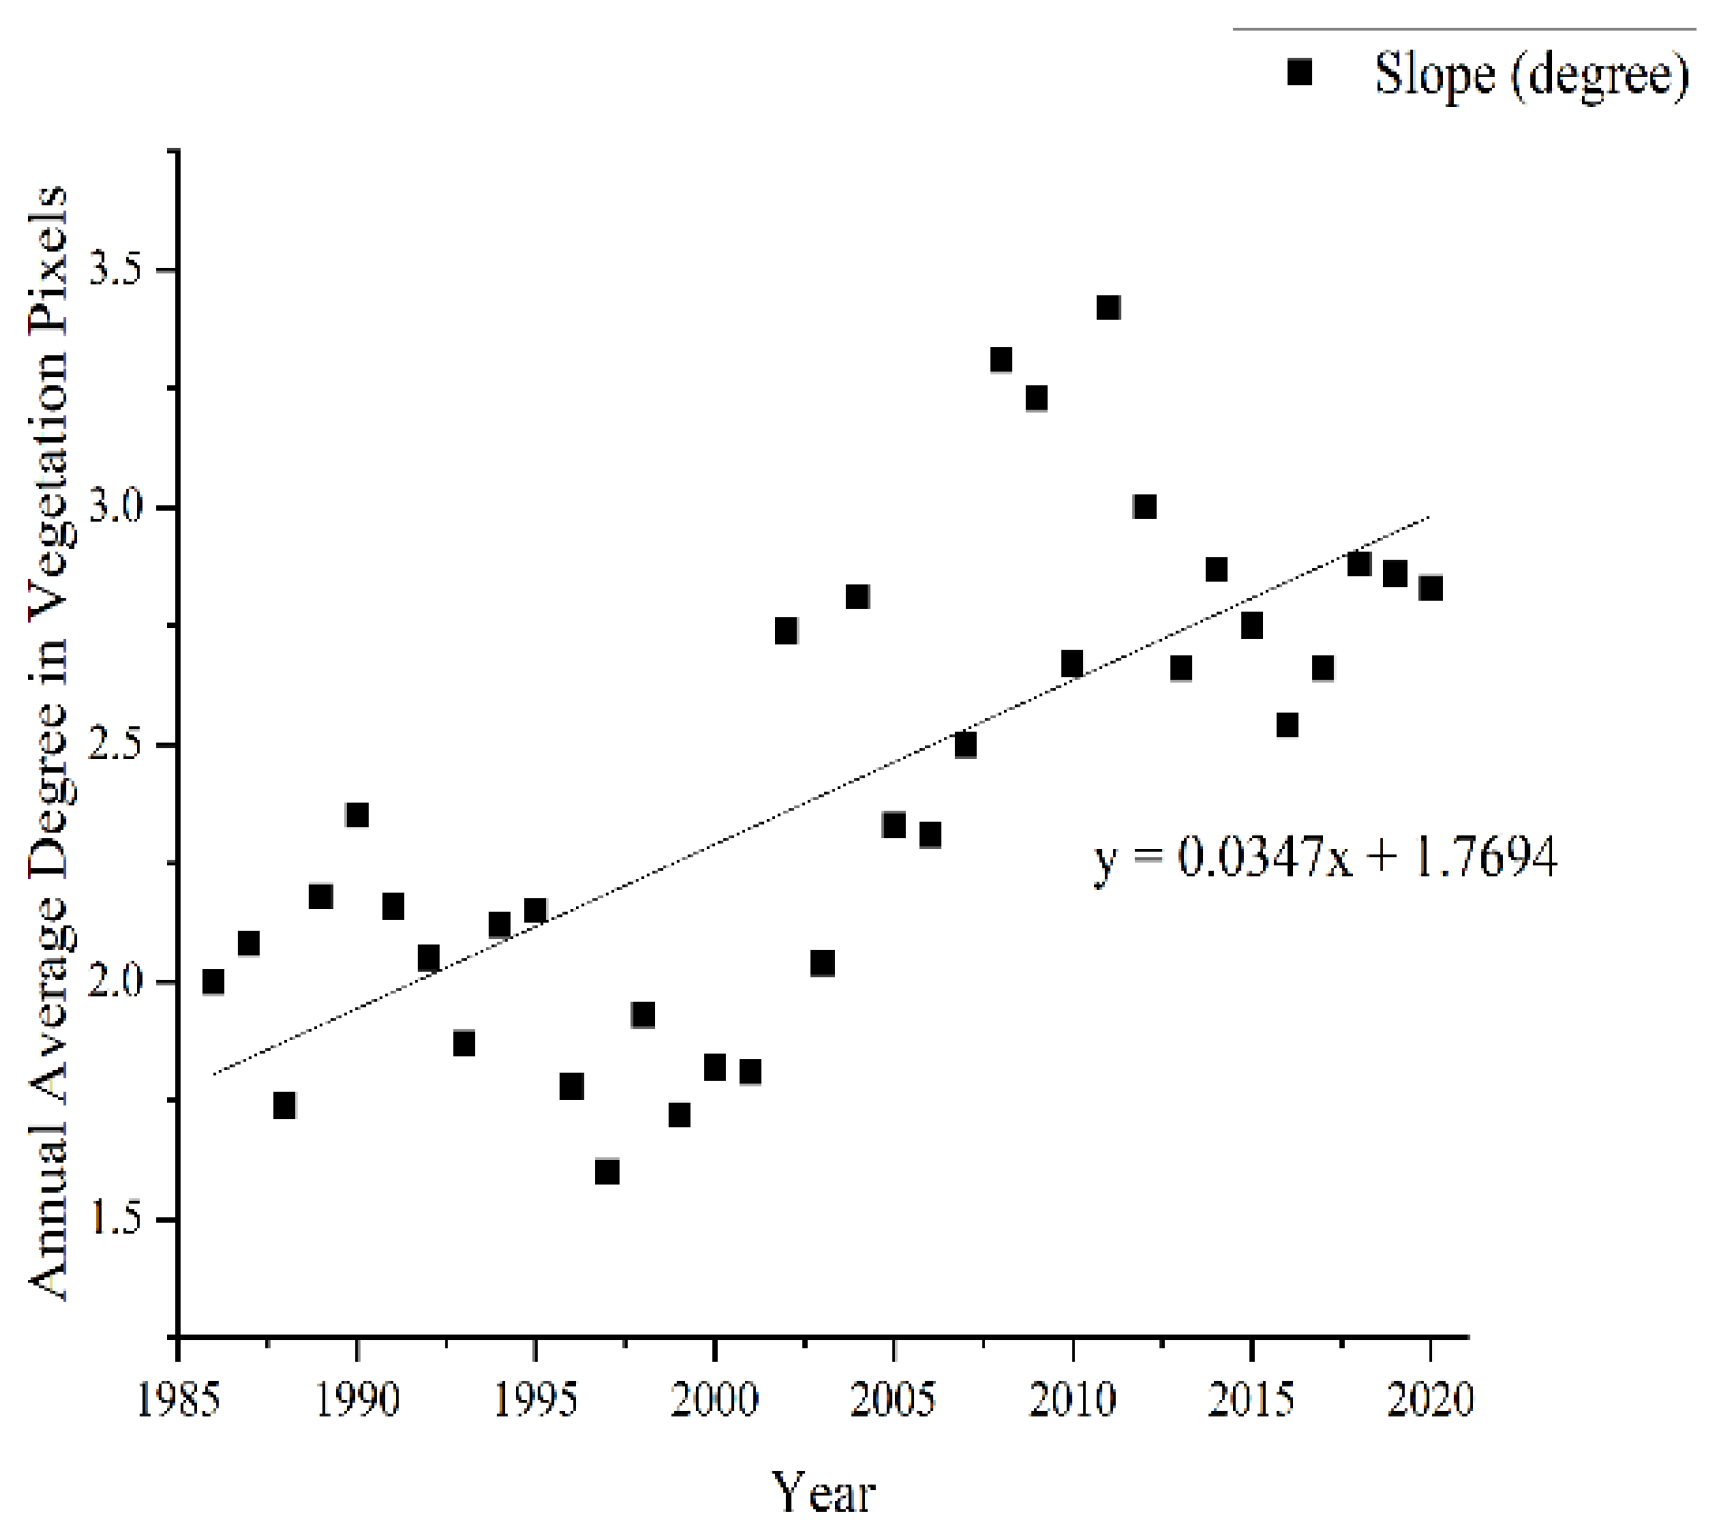
3.2. Annual Vegetation Change
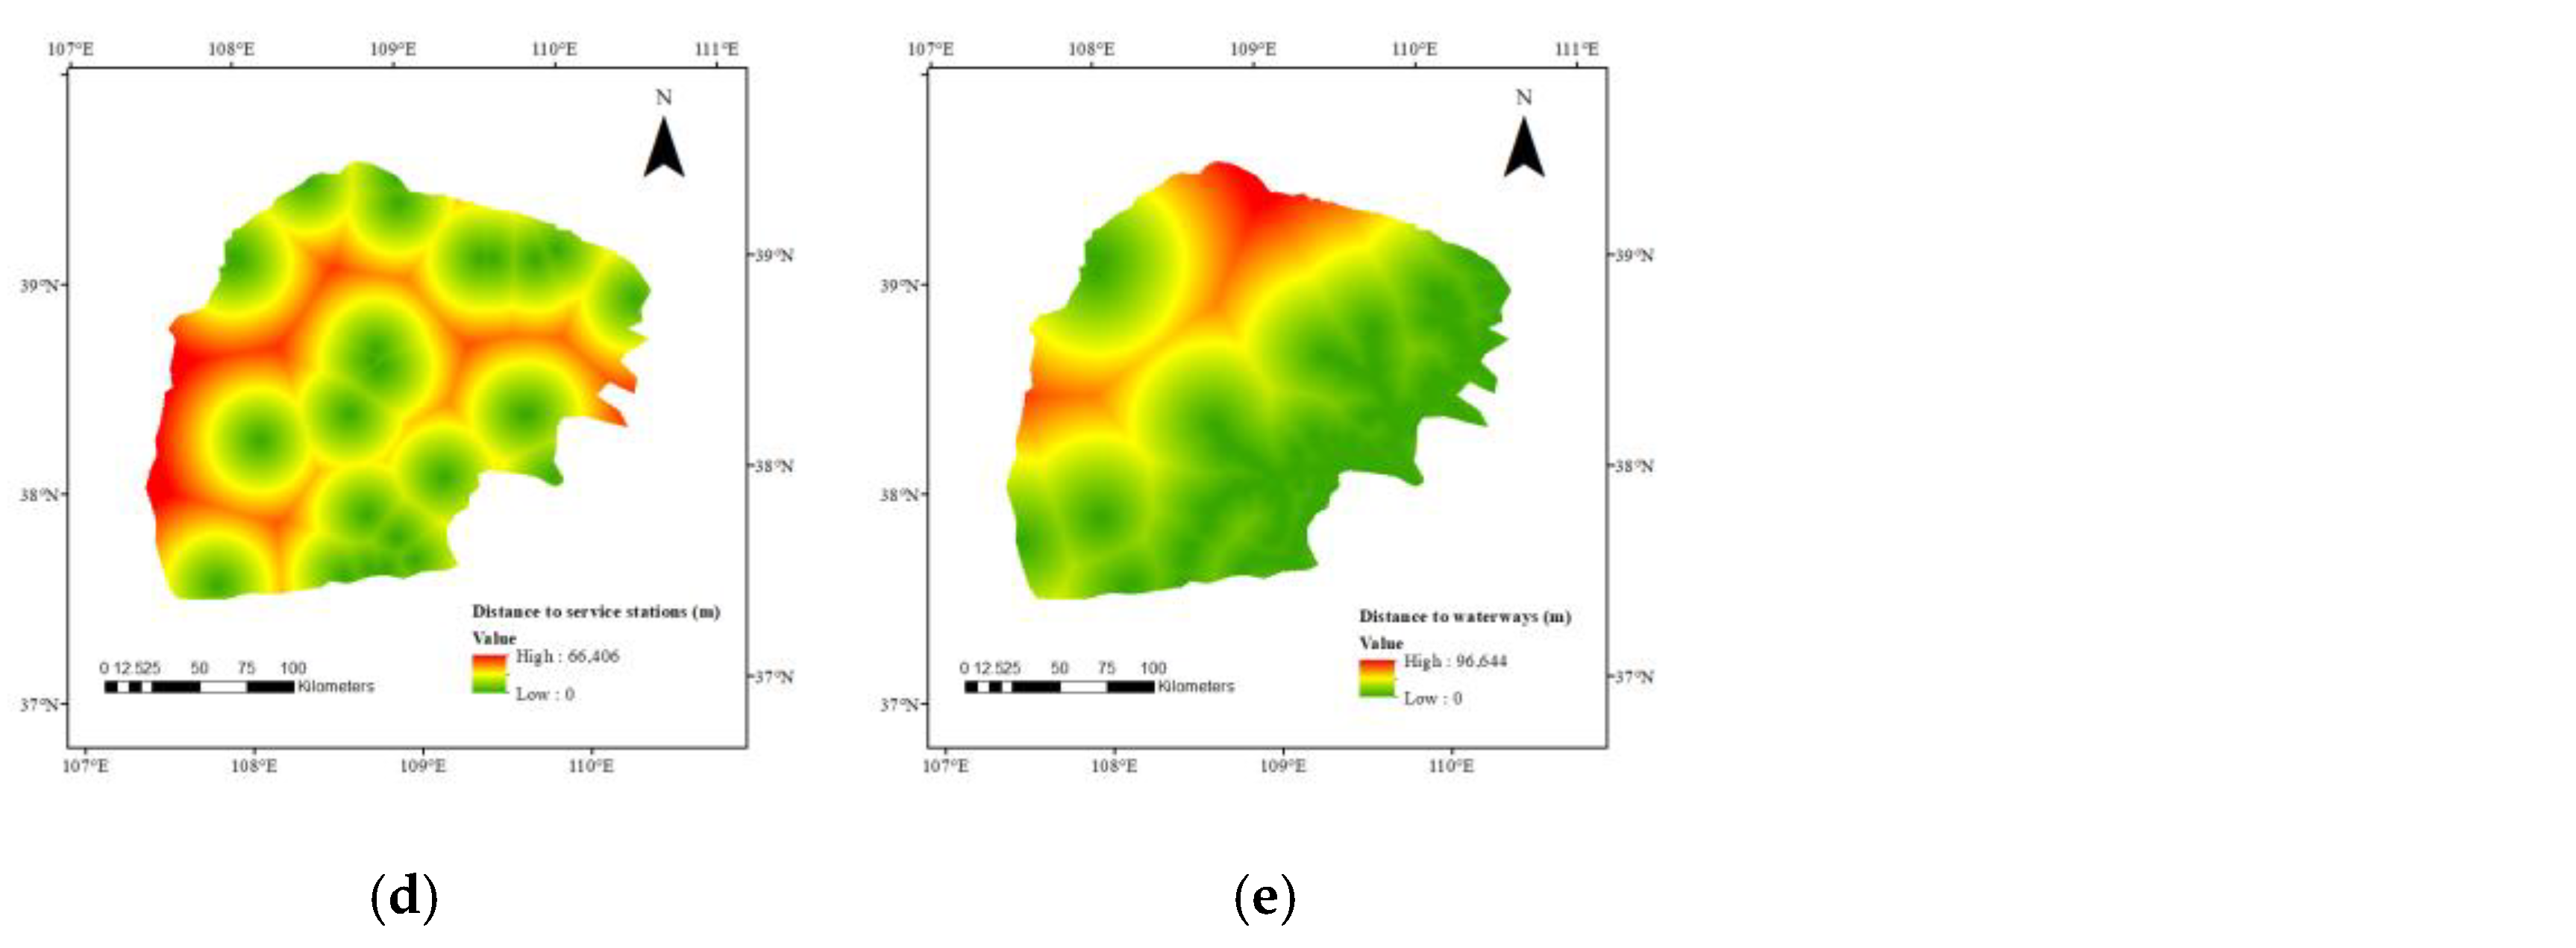
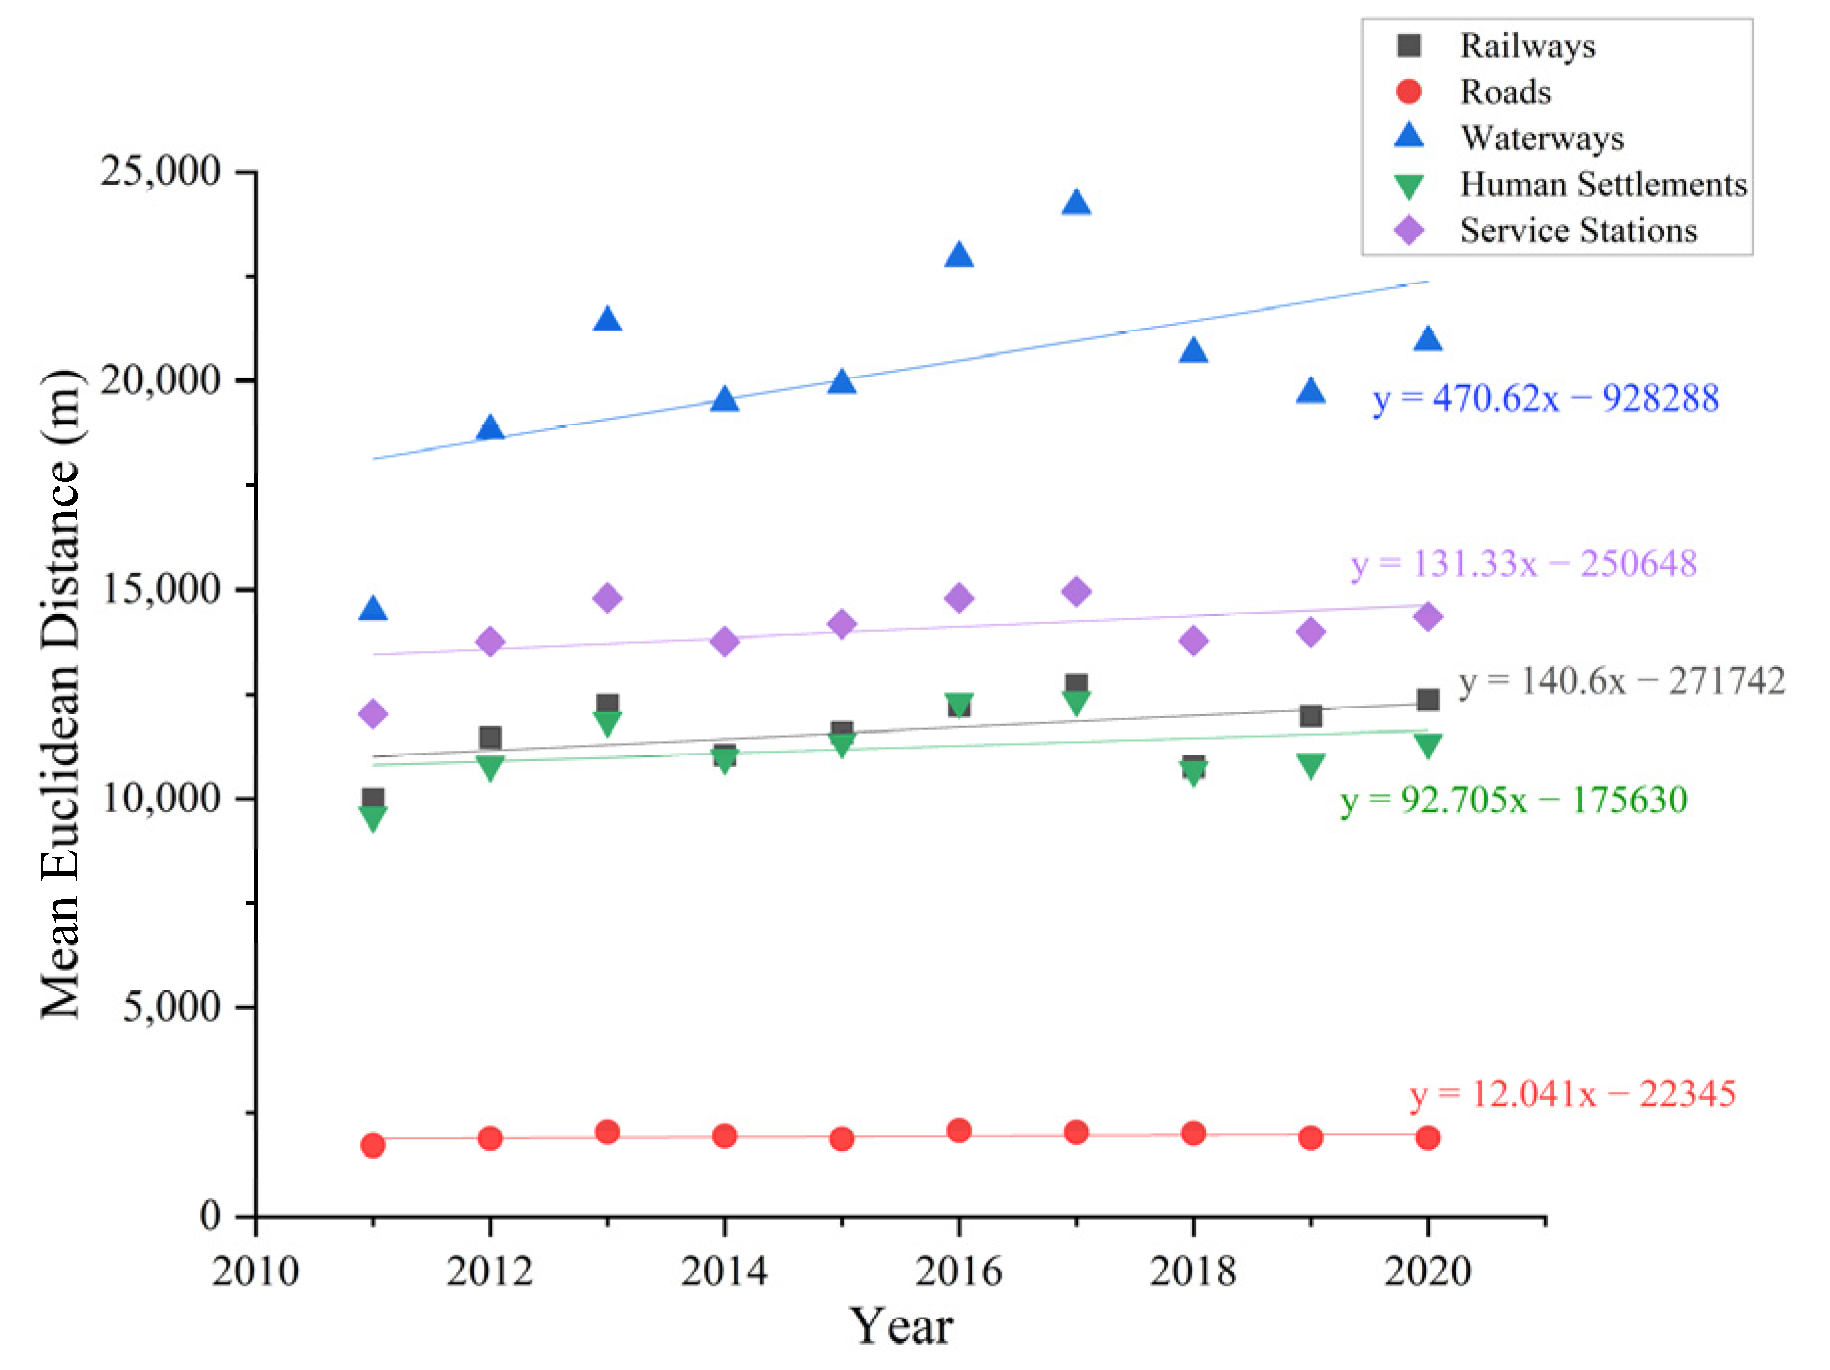
3.3. Spatiotemporal Analysis between Time-Series Vegetation Dynamic and Human-Related Factors
3.4. Vegetation Restoration Suitability Mapping
4. Discussion
4.1. Anti-Desertification Process in Mu Us Sandy Land
4.2. Future Restoration
4.3. Limitations and Future Work
5. Conclusions
Supplementary Materials
Author Contributions
Funding
Data Availability Statement
Acknowledgments
Conflicts of Interest
References
- Reynolds, J.F.; Stafford Smith, D.M.S.; Lambin, E.F.; Turner, B.L.; Mortimore, M.; Batterbury, S.P.; Downing, T.E.; Dowlatabadi, H.; Fernández, R.J.; Herrick, J.E.; et al. Global Desertification: Building a Science for Dryland Development. Science 2007, 316, 847–851. [Google Scholar] [CrossRef]
- Hillel, D.; Rosenzweig, C. DESERTIFICATION. In Encyclopedia of Soils in the Environment; Elsevier: Amsterdam, The Netherlands, 2005; pp. 382–389. [Google Scholar] [CrossRef]
- Jiang, L.; Bao, A.; Jiapaer, G.; Guo, H.; Zheng, G.; Gafforov, K.; Kurban, A.; De Maeyer, P. Monitoring land sensitivity to desertification in Central Asia: Convergence or divergence? Sci. Total Environ. 2019, 658, 669–683. [Google Scholar] [CrossRef]
- Li, Y.; Cao, Z.; Long, H.; Liu, Y.; Li, W. Dynamic analysis of ecological environment combined with land cover and NDVI changes and implications for sustainable urban–rural development: The case of Mu Us Sandy Land, China. J. Clean. Prod. 2017, 142, 697–715. [Google Scholar] [CrossRef]
- Chen, F.; Li, G.; Zhao, H.; Jin, M.; Chen, X.; Fan, Y.; Liu, X.; Wu, D.; Madsen, D. Landscape evolution of the Ulan Buh Desert in northern China during the late Quaternary. Quat. Res. 2014, 81, 476–487. [Google Scholar] [CrossRef]
- Wu, B.; Ci, L.J. Landscape change and desertification development in the Mu Us Sandland, Northern China. J. Arid Environ. 2002, 50, 429–444. [Google Scholar] [CrossRef]
- Salvati, L.; Kosmas, C.; Kairis, O.; Karavitis, C.; Acikalin, S.; Belgacem, A.; Solé-Benet, A.; Chaker, M.; Fassouli, V.; Gokceoglu, C.; et al. Assessing the effectiveness of sustainable land management policies for combating desertification: A data mining approach. J. Environ. Manag. 2016, 183, 754–762. [Google Scholar] [CrossRef]
- Gao, Z.; Li, C.; Yang, X.; Ci, L. Engineering and Technological Measures for Combating Desertification. In Desertification and Its Control in China; Springer: Berlin/Heidelberg, Germany, 2010; pp. 427–463. [Google Scholar] [CrossRef]
- Karnieli, A.; Qin, Z.; Wu, B.; Panov, N.; Yan, F. Spatio-Temporal Dynamics of Land-Use and Land-Cover in the Mu Us Sandy Land, China, Using the Change Vector Analysis Technique. Remote Sens. 2014, 6, 9316–9339. [Google Scholar] [CrossRef]
- Wu, W. Study on process of desertification in Mu Us sandy land for last 50 years. China J. Desert Res. 2001, 21, 164. Available online: http://www.desert.ac.cn/EN/Y2001/V21/I2/164 (accessed on 6 July 2021).
- Prince, S.D. Where Does Desertification Occur? Mapping Dryland Degradation at Regional to Global Scales. In The End of Desertification? Disputing Environmental Change in the Drylands; Springer: Berlin/Heidelberg, Germany, 2016; pp. 225–263. [Google Scholar] [CrossRef]
- Symeonakis, E.; Drake, N. Monitoring desertification and land degradation over sub-Saharan Africa. Int. J. Remote Sens. 2004, 25, 573–592. [Google Scholar] [CrossRef]
- Hountondji, Y.; Sokpon, N.; Ozer, P. Analysis of the vegetation trends using low resolution remote sensing data in Burkina Faso (1982–1999) for the monitoring of desertification. Int. J. Remote Sens. 2006, 27, 871–884. [Google Scholar] [CrossRef]
- Lamchin, M.; Lee, W.-K.; Jeon, S.W.; Lee, J.-Y.; Song, C.; Piao, D.; Lim, C.H.; Khaulenbek, A.; Navaandorj, I. Correlation between Desertification and Environmental Variables Using Remote Sensing Techniques in Hogno Khaan, Mongolia. Sustainability 2017, 9, 581. [Google Scholar] [CrossRef]
- Chen, Z.; Huang, M.; Zhu, D.; Altan, O. Integrating Remote Sensing and a Markov-FLUS Model to Simulate Future Land Use Changes in Hokkaido, Japan. Remote Sens. 2021, 13, 2621. [Google Scholar] [CrossRef]
- Huang, M.; Chen, N.; Du, W.; Wen, M.; Zhu, D.; Gong, J. An on-demand scheme driven by the knowledge of geospatial distribution for large-scale high-resolution impervious surface mapping. GIScience Remote Sens. 2021, 58, 562–586. [Google Scholar] [CrossRef]
- Liu, Y.Y.; Van Dijk, A.; De Jeu, R.A.M.; Canadell, J.; McCabe, M.; Evans, J.; Wang, G. Recent reversal in loss of global terrestrial biomass. Nat. Clim. Chang. 2015, 5, 470–474. [Google Scholar] [CrossRef]
- He, Y.; Lee, E.; Warner, T.A. A time series of annual land use and land cover maps of China from 1982 to 2013 generated using AVHRR GIMMS NDVI3g data. Remote Sens. Environ. 2017, 199, 201–217. [Google Scholar] [CrossRef]
- Hua, T.; Zhao, W.; Liu, Y.; Wang, S.; Yang, S. Spatial Consistency Assessments for Global Land-Cover Datasets: A Comparison among GLC2000, CCI LC, MCD12, GLOBCOVER and GLCNMO. Remote Sens. 2018, 10, 1846. [Google Scholar] [CrossRef]
- Sulla-Menashe, D.; Gray, J.M.; Abercrombie, S.P.; Friedl, M.A. Hierarchical mapping of annual global land cover 2001 to present: The MODIS Collection 6 Land Cover product. Remote Sens. Environ. 2019, 222, 183–194. [Google Scholar] [CrossRef]
- Zhang, H.K.; Roy, D.P. Using the 500 m MODIS land cover product to derive a consistent continental scale 30 m Landsat land cover classification. Remote Sens. Environ. 2017, 197, 15–34. [Google Scholar] [CrossRef]
- Li, Y.; Wang, J.; Liu, Y.; Long, H. Problem regions and regional problems of socioeconomic development in China: A perspective from the coordinated development of industrialization, informatization, urbanization and agricultural modernization. J. Geogr. Sci. 2014, 24, 1115–1130. [Google Scholar] [CrossRef]
- Liu, Q.; Zhao, Y.; Zhang, X.; Buyantuev, A.; Niu, J.; Wang, X. Spatiotemporal Patterns of Desertification Dynamics and Desertification Effects on Ecosystem Services in the Mu Us Desert in China. Sustainability 2018, 10, 589. [Google Scholar] [CrossRef]
- Liu, Q.; Zhang, Q.; Yan, Y.; Zhang, X.; Niu, J.; Svenning, J.-C. Ecological restoration is the dominant driver of the recent reversal of desertification in the Mu Us Desert (China). J. Clean. Prod. 2020, 268, 122241. [Google Scholar] [CrossRef]
- Xiu, L.; Yan, C.; Li, X.; Qian, D.; Feng, K. Monitoring the response of vegetation dynamics to ecological engineering in the Mu Us Sandy Land of China from 1982 to 2014. Environ. Monit. Assess. 2018, 190, 543. [Google Scholar] [CrossRef]
- Sun, Z.; Mao, Z.; Yang, L.; Liu, Z.; Han, J.; Wanag, H.; He, W. Impacts of climate change and afforestation on vegetation dynamic in the Mu Us Desert, China. Ecol. Indic. 2021, 129, 108020. [Google Scholar] [CrossRef]
- Huang, Y.; Wang, N.-A.; He, T.; Chen, H.; Zhao, L. Historical desertification of the Mu Us Desert, Northern China: A multidisciplinary study. Geomorphology 2009, 110, 108–117. [Google Scholar] [CrossRef]
- Wang, C.; Wang, S.; Fu, B.; Lü, Y.; Liu, Y.; Wu, X. Integrating vegetation suitability in sustainable revegetation for the Loess Plateau, China. Sci. Total Environ. 2020, 759, 143572. [Google Scholar] [CrossRef]
- McVicar, T.R.; Van Niel, T.; Li, L.; Wen, Z.; Yang, Q.; Li, R.; Jiao, F. Parsimoniously modelling perennial vegetation suitability and identifying priority areas to support China’s re-vegetation program in the Loess Plateau: Matching model complexity to data availability. For. Ecol. Manag. 2010, 259, 1277–1290. [Google Scholar] [CrossRef]
- Peng, S.; Yu, K.; Li, Z.; Wen, Z.; Zhang, C. Integrating potential natural vegetation and habitat suitability into revegetation programs for sustainable ecosystems under future climate change. Agric. For. Meteorol. 2019, 269–270, 270–284. [Google Scholar] [CrossRef]
- Robinson, T.; Rogers, D.; Williams, B. Mapping tsetse habitat suitability in the common fly belt of Southern Africa using multivariate analysis of climate and remotely sensed vegetation data. Med. Veter. Ѐntomol. 1997, 11, 235–245. [Google Scholar] [CrossRef]
- Kobayashi, T.; Nakayama, S.; Wang, L.-M.; Li, G.-Q.; Yang, J. Socio-ecological analysis of desertification in the Mu-Us Sandy Land with satellite remote sensing. Landsc. Ecol. Eng. 2005, 1, 17–24. [Google Scholar] [CrossRef]
- Otsu, N. A threshold selection method from gray-level histograms. IEEE Trans. Syst. Man Cybern. 1979, 9, 62–66. [Google Scholar] [CrossRef]
- Liu, D.; Yu, J. Otsu Method and K-means. In Proceedings of the 2009 9th International Conference on Hybrid Intelligent Systems, Shenyang, China, 12–14 August 2009; Volume 1, pp. 344–349. [Google Scholar] [CrossRef]
- Yuan, X.-C.; Wu, L.-S.; Peng, Q. An improved Otsu method using the weighted object variance for defect detection. Appl. Surf. Sci. 2015, 349, 472–484. [Google Scholar] [CrossRef]
- Gandhi, G.M.; Parthiban, S.; Thummalu, N.; Christy, A. Ndvi: Vegetation Change Detection Using Remote Sensing and Gis—A Case Study of Vellore District. Procedia Comput. Sci. 2015, 57, 1199–1210. [Google Scholar] [CrossRef]
- Gou, L.; Zhang, J.; Li, N.; Wang, Z.; Chen, J.; Qi, L. Weighted assignment fusion algorithm of evidence conflict based on Euclidean distance and weighting strategy, and application in the wind turbine system. PLoS ONE 2022, 17, e0262883. [Google Scholar] [CrossRef]
- Yang, Z.; Liao, W.; Wang, H.; Bak, C.L.; Chen, Z. Improved Euclidean Distance Based Pilot Protection for Lines with Renewable Energy Sources. IEEE Trans. Ind. Inform. 2022, 3203. [Google Scholar] [CrossRef]
- Bozdağ, A.; Yavuz, F.; Günay, A.S. AHP and GIS based land suitability analysis for Cihanbeyli (Turkey) County. Environ. Earth Sci. 2016, 75, 813. [Google Scholar] [CrossRef]
- Rossiter, D.G. A theoretical framework for land evaluation. Geoderma 1996, 72, 165–190. [Google Scholar] [CrossRef]
- Akpoti, K.; Higginbottom, T.P.; Foster, T.; Adhikari, R.; Zwart, S.J. Mapping land suitability for informal, small-scale irrigation development using spatial modelling and machine learning in the Upper East Region, Ghana. Sci. Total Environ. 2022, 803, 149959. [Google Scholar] [CrossRef]
- Jiao, S.; Zhang, X.; Xu, Y. A review of Chinese land suitability assessment from the rainfall-waterlogging perspective: Evidence from the Su Yu Yuan area. J. Clean. Prod. 2017, 144, 100–106. [Google Scholar] [CrossRef]
- Akpoti, K.; Kabo-Bah, A.T.; Zwart, S.J. Agricultural land suitability analysis: State-of-the-art and outlooks for integration of climate change analysis. Agric. Syst. 2019, 173, 172–208. [Google Scholar] [CrossRef]
- Ebrahimi, M.; Nejadsoleymani, H.; Daneshvar, M.R.M. Land suitability map and ecological carrying capacity for the recognition of touristic zones in the Kalat region, Iran: A multi-criteria analysis based on AHP and GIS. Asia-Pac. J. Reg. Sci. 2019, 3, 697–718. [Google Scholar] [CrossRef]
- Nurda, N.; Noguchi, R.; Ahamed, T. Change Detection and Land Suitability Analysis for Extension of Potential Forest Areas in Indonesia Using Satellite Remote Sensing and GIS. Forests 2020, 11, 398. [Google Scholar] [CrossRef]
- Parry, J.A.; Ganaie, S.A.; Bhat, M.S. GIS based land suitability analysis using AHP model for urban services planning in Srinagar and Jammu urban centers of J&K, India. J. Urban Manag. 2018, 7, 46–56. [Google Scholar] [CrossRef]
- Zhou, J.; Cao, X. What is the policy improvement of China’s land consolidation? Evidence from completed land consolidation projects in Shaanxi Province. Land Use Policy 2020, 99, 104847. [Google Scholar] [CrossRef]
- Verstappen, H.T. Old and New Trends in Geomorphological and Landform Mapping. Dev. Earth Surf. Processes 2011, 15, 13–38. [Google Scholar] [CrossRef]
- Proulx, R.; Fahrig, L. Detecting human-driven deviations from trajectories in landscape composition and configuration. Landsc. Ecol. 2010, 25, 1479–1487. [Google Scholar] [CrossRef]
- Zhang, Z.; Huang, X.; Zhou, Y. Factors influencing the evolution of human-driven rocky desertification in karst areas. Land Degrad. Dev. 2020, 32, 817–829. [Google Scholar] [CrossRef]
- Li, N.; Yan, C.Z.; Xie, J.L. Remote sensing monitoring recent rapid increase of coal mining activity of an important energy base in northern China, a case study of Mu Us Sandy Land. Resour. Conserv. Recycl. 2015, 94, 129–135. [Google Scholar] [CrossRef]
- Gao, W.; Zheng, C.; Liu, X.; Lu, Y.; Chen, Y.; Wei, Y.; Ma, Y. NDVI-based vegetation dynamics and their responses to climate change and human activities from 1982 to 2020: A case study in the Mu Us Sandy Land, China. Ecol. Indic. 2022, 137, 108745. [Google Scholar] [CrossRef]
- Guo, Z.-C.; Wang, T.; Liu, S.-L.; Kang, W.-P.; Chen, X.; Feng, K.; Zhang, X.-Q.; Zhi, Y. Biomass and vegetation coverage survey in the Mu Us sandy land-based on unmanned aerial vehicle RGB images. Int. J. Appl. Earth Obs. Geoinf. ITC J. 2021, 94, 102239. [Google Scholar] [CrossRef]
- Ju, C.; Cai, T.; Yang, X. Topography-based modeling to estimate percent vegetation cover in semi-arid Mu Us sandy land, China. Comput. Electron. Agric. 2008, 64, 133–139. [Google Scholar] [CrossRef]
- Wang, L.; Wu, Q.; Fu, Z.; Jiang, G.; Liu, Y.; Xu, K. Aeolian sand accumulation and land desertification over the past 1,500 years as revealed by two aeolian dunes in the Beiluhe Basin on interior Qinghai-Tibet Plateau, SW China. Quat. Int. 2022, 613, 101–117. [Google Scholar] [CrossRef]
- Cao, S. Why Large-Scale Afforestation Efforts in China Have Failed To Solve the Desertification Problem. Environ. Sci. Technol. 2008, 42, 1826–1831. [Google Scholar] [CrossRef] [PubMed]
- Le Houérou, H.N. Climate change, drought and desertification. J. Arid Environ. 1996, 34, 133–185. [Google Scholar] [CrossRef] [Green Version]


Publisher’s Note: MDPI stays neutral with regard to jurisdictional claims in published maps and institutional affiliations. |
© 2022 by the authors. Licensee MDPI, Basel, Switzerland. This article is an open access article distributed under the terms and conditions of the Creative Commons Attribution (CC BY) license (https://creativecommons.org/licenses/by/4.0/).
Share and Cite
Chen, Z.; Huang, M.; Xiao, C.; Qi, S.; Du, W.; Zhu, D.; Altan, O. Integrating Remote Sensing and Spatiotemporal Analysis to Characterize Artificial Vegetation Restoration Suitability in Desert Areas: A Case Study of Mu Us Sandy Land. Remote Sens. 2022, 14, 4736. https://0-doi-org.brum.beds.ac.uk/10.3390/rs14194736
Chen Z, Huang M, Xiao C, Qi S, Du W, Zhu D, Altan O. Integrating Remote Sensing and Spatiotemporal Analysis to Characterize Artificial Vegetation Restoration Suitability in Desert Areas: A Case Study of Mu Us Sandy Land. Remote Sensing. 2022; 14(19):4736. https://0-doi-org.brum.beds.ac.uk/10.3390/rs14194736
Chicago/Turabian StyleChen, Zhanzhuo, Min Huang, Changjiang Xiao, Shuhua Qi, Wenying Du, Daoye Zhu, and Orhan Altan. 2022. "Integrating Remote Sensing and Spatiotemporal Analysis to Characterize Artificial Vegetation Restoration Suitability in Desert Areas: A Case Study of Mu Us Sandy Land" Remote Sensing 14, no. 19: 4736. https://0-doi-org.brum.beds.ac.uk/10.3390/rs14194736