Article

Aerosols on the Tropical Island of La Réunion (21°S, 55°E): Assessment of Climatology, Origin of Variability and Trend

1
Laboratoire de l’Atmosphère et des Cyclones (LACy), UMR8105, Université de la Réunion—CNRS—Météo-France, 97400 Saint-Denis, France
2
Département de Physique, Laboratoire d’Optique Atmosphérique (LOA), Université de Lille, 59655 Villeneuve d’Ascq, France
3
Observatoire des Sciences de l’Univers de La Réunion (OSUR), UAR3365, 97400 Saint-Denis, France
*
Author to whom correspondence should be addressed.
Remote Sens. 2022, 14(19), 4945; https://0-doi-org.brum.beds.ac.uk/10.3390/rs14194945
Submission received: 26 July 2022 / Revised: 28 September 2022 / Accepted: 30 September 2022 / Published: 3 October 2022
(This article belongs to the Special Issue Optical and Laser Remote Sensing of Atmospheric Composition)

Abstract

:
Aerosols are essential climate variables that need to be observed at a global scale to monitor the evolution of the atmospheric composition and potential climate impacts. We used the measurements performed over the May 2007–December 2019 period by a ground-based sun photometer installed at the island of La Réunion (21°S, 55°E), together with a linear regression fitting model, to assess the climatology and types of aerosols reaching this observation site located in a sparsely documented pristine area, and the forcings responsible for the variability of the observed aerosol optical depth (AOD) and related trend. The climatology of the aerosol optical depth (AOD) at 440 nm (AOD440) and Ångström exponent between 500 and 870 nm (α) revealed that sea salts could be considered as the La Réunion AOD440 and α baselines (0.06 ± 0.03 and 0.61 ± 0.40, respectively, from December to August), which were mainly modulated by biomass burning (BB) plumes passing over La Réunion (causing a doubling of AOD440 and α up to 0.13 ± 0.07 and 1.06 ± 0.34, respectively, in October). This was confirmed by the retrieved aerosol volume size distributions showing that the coarse-mode (fine-mode) dominated the total volume concentration for AOD440 lower (higher) than 0.2 with a mean radius equal to 3 μm (0.15 μm). The main contribution to the AOD440 variability over La Réunion was evaluated to be the BB activity (67.4 ± 28.1%), followed by marine aerosols (16.3 ± 4.2%) and large-scale atmospheric structures (5.5 ± 1.7%). The calculated trend for AOD440 equaled 0.02 ± 0.01 per decade (2.6 ± 1.3% per year). These results provide a scientific reference base for upcoming studies dedicated to the quantification of the impact of wildfire emissions on the southwestern Indian Ocean’s atmospheric composition and radiative balance.

1. Introduction

Aerosols contribute the largest uncertainty to estimates and interpretations of the Earth’s changing energy budget [1]. Aerosols are therefore essential climate variables that need to be observed at a global scale to monitor the evolution of the atmospheric composition and potential climate impacts.
The southwestern Indian Ocean (SWIO) can be considered as a pristine region [2,3], where land and human activities have so far had little impact, where sea salt aerosols are dominant, and where changes in the aerosol concentration can significantly impact the radiative balance over the area. Actually, the SWIO is strongly impacted by long range atmospheric transport pathways connecting South America, Southern Africa, Australia and Southeast Asia to this part of the world [4,5,6,7]. These source regions are yearly submitted to the Southern Hemisphere (SH) biomass burning (BB) season, and show records of extreme wildfires (e.g., the 2020 Australian wildfires, [8]). Wildfires emit large quantities of gases and aerosols into the troposphere [9] and, through the tremendous amount of heat they release (pyroconvection), even directly into the stratosphere (e.g., [8]). The increasing frequency of extreme wildfires events occurring in response to global and regional warming trends (e.g., [10]) urges the assessment of their climate-altering potential. As a matter of fact, the SWIO exhibits a low yet highly variable aerosol burden [3,7], which makes it a region difficult to monitor from spaceborne instruments (measurements performed with a small signal-to-noise ratio) [3,11,12,13,14,15,16,17], and makes the global climate models struggle to simulate the related aerosol optical depth (AOD) in this part of the world [18,19]. Therefore, field experiments and ground-based observations provide the most accurate and comprehensive analysis of aerosol properties, especially in such low AOD conditions characterizing the SWIO [7].
Various studies have already been devoted to aerosols over the Indian Ocean, especially the northeast part, around India. In particular, the INDOEX experiment in 1999 allowed the characterization of the Indian pollution and the cooling influence of sulfate aerosols on the regional climate (e.g., [20]), mainly in the Bay of Bengal. The impact of contamination from Asia to the Southern Indian Ocean was analyzed further [21,22], and additional studies were encouraged. The Southern African Regional Science Initiative (SAFARI 2000) experiment showed pronounced smoke and haze (the so-called “River of Smoke”) exiting off South-Southeast Africa during the Southern Hemisphere BB season going from July to October (e.g., [23]). Recently, the formation of a river of smoke crossing Southern Africa was investigated during the Aerosols, Radiation and Clouds in southern Africa (AEROCLO-sA) campaign in September 2017 [24].
La Réunion (21°S, 55°E) is an island located in the subtropical SWIO at the crossroads of the long-range transport pathways bringing air masses from South America, Southern Africa, Australia and South-East Asia. It hosts the Observatory of Atmospheric Physics of La Réunion (OPAR), which is a world-class permanent station for long-term atmospheric observations: the dynamic and chemistry of the low and middle atmospheres in the context of climate change in the South Hemisphere. It is a French instrumented site and provides data for international monitoring networks (such as Global Atmospheric Watch—GAW and the Network for the Detection of Atmospheric Composition Change—NDACC), European Research Infrastructures (such as the Integrated Carbon Observing System—ICOS and the Aerosols, Clouds, and Trace Gases Research Infrastructure—ACTRIS), scientific research, and satellite validation (https://opar.univ-reunion.fr/ (accessed on 29 September 2022)). OPAR is one of the few ground-based observation points in the Indian Ocean and its range of instruments gives potential to fully characterize aerosol loading, microphysical, optical and radiative properties as well as vertical distribution, which are the comprehensive set of parameters to assess their impact on climate [25,26]. The location of OPAR makes it a hot spot for the study of BB aerosol plumes crossing the SWIO and originating from ones of the areas which are the most intensely submitted to BB activity [27], as well as an important validation point for the next spaceborne aerosol lidar mission EarthCARE (Earth Clouds, Aerosols and Radiation Explorer) of the European Space Agency (ESA). However, up to now, the influence of pollution plumes on the tropical atmospheric composition of La Réunion has been only determined by analyzing trace gases measurements [6,28,29,30,31,32,33,34,35].
The purpose of this paper was to document the aerosol burden and type over La Réunion, along with their variability and trend, and to identify the forcings influencing its variability. We use here the measurements performed by a ground-based sun photometer installed at La Réunion to assess the climatology and types of aerosols reaching this observation site. The AOD, the Ångström exponent and the temporal variability of these parameters are analyzed. In addition, retrieved aerosol volume size distributions (VSD) for different optical conditions, high and low AOD, are investigated. Using a linear regression fitting model, the forcings responsible for the observed AOD variability together with their relative impact are evaluated. Finally, we give an estimate of the AOD trend above La Réunion. The measurements and method are presented in the next section. Results are presented in Section 3 and discussed in Section 4. Conclusions are given in Section 5.

2. Materials and Methods

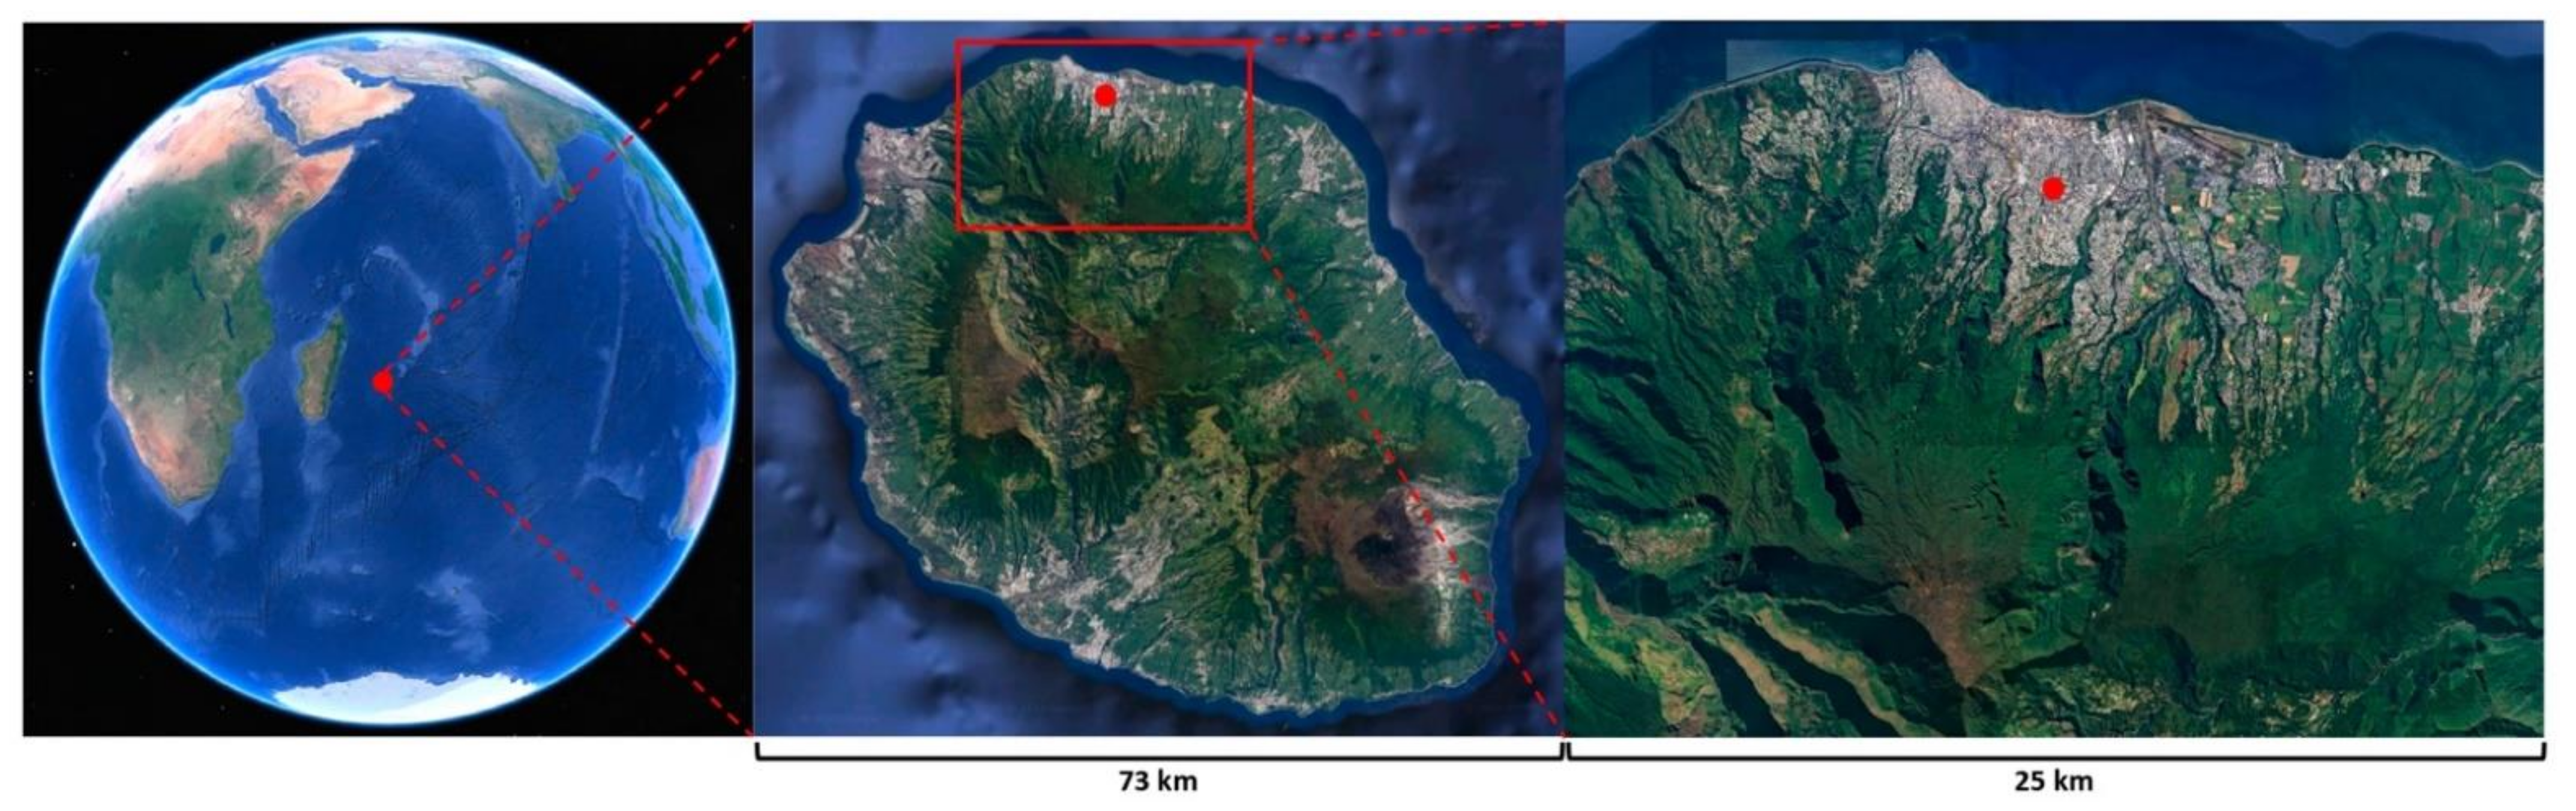
2.1. Sun Photometer and Observation Site

Measurements were performed in the framework of the CNRS-INSU (Centre National de la Recherche Scientifique-Institut National des Sciences de l’Univers) SNO PHOTONS/AERONET (Service National d’Observation PHOTONS/AErosol RObotic NETwork) [36], part of the ACTRIS-ERIC (Aerosol, Clouds, Trace Gases European Research Infrastructure Consortium) with a CIMEL sun photometer (Cimel Electronique, Paris, France), which makes two important solar extinction measurements, direct sun and diffuse sky radiances.
We used in this study instantaneous measurements of the AOD and Ångström exponent retrieved from direct sun Version 3 Level 2.0 [37,38,39] (https://aeronet.gsfc.nasa.gov/cgi-bin/webtool_aod_v3, last access: 3 June 2022). The uncertainties related to these AOD measurements were estimated to be approximately ±0.01 [40]. Sky radiance almucantar measurements at 440, 675, 870 and 1020 nm in conjunction with the direct-sun-measured AOD at the same wavelengths were used to retrieve aerosol size distribution following the methodology of [41] (Version 3: Almucantar Level 2.0 Inversion, https://aeronet.gsfc.nasa.gov/cgi-bin/webtool_inv_v3, last access 3 June 2022). Measurements were made quasi-continuously from May 2007 to December 2019. As part of the AERONET protocol to ensure measurement consistency throughout the years, the used sun photometer was calibrated yearly against reference instruments. In the present study, we used measurements of the AOD at 440 nm (AOD440) and the Ångström exponent between 500 and 870 nm, noted α in the following. The wavelength of 440 nm was selected for the AOD to facilitate comparisons with previous studies, and the range 500–870 nm was selected for the Ångström exponent calculation to ensure it was independent from AOD440.
The instrument was installed on the roof of a building at the University of La Réunion campus (80 m above sea level, 20.90°S and 55.45°E) at Saint-Denis, which is the capital of La Réunion, located on the coast in the northern part of the island (Figure 1). As of 2019, there were 153,810 inhabitants in Saint-Denis, with a population density of about 1100 km−2. The city lies on a slope between the ocean and the nature reserve of La Roche Écrite (ultimately reaching a height of 2276 m), which is part of a 100,000 ha national park. La Réunion, and Saint-Denis, are mainly affected by southeasterly trade winds near the ground and westerlies in the free troposphere.

2.2. The Trend-Run Model and Used Data Sets

Trend analyses and the evaluation of the parameters impacting the variability of the AOD440 time series were based on a linear regression fitting model based on a multivariate least squares method called Trend-Run. It was adapted from the AMOUNTS (Adaptive MOdel UNambiguous Trend Survey) and AMOUNTSO3 models, developed for ozone and temperature trend assessments [42,43,44].
The multilinear regression is a method that is frequently used to explain the relationship between one continuous dependent and two or more independent variables (geophysical parameters in our case). The model is based on the principle of breaking down the variations of a time series Y(t) into the sum of different parameters that explain the variations of Y(t):
Y(z,t) = a1 X1(z,t) + a2 X2(z,t) + a3 X4(z,t) +…+ aiXi + ε
where ε is the residual term, assumed to consist of trend and noise.
The model applies the least squares method in order to minimize the sum of the residual squares and to determine the parameter coefficients ai. Regarding the trend, it is parameterized as linear: Trend(t) = c0 + c1.t, where t denotes the time range, c0 is a constant and c1 is the slope of the Trend(t) line that estimates the trend over the time scale.
The trend and coefficient uncertainty are derived by considering the autocorrelation coefficient φ. As shown in the appendix of [45], this uncertainty is given by:
σ a 2 = v k × σ s   2 × 1 + φ 1 φ    
σ s   2 represents the variance of the residual term and v(k) represents the covariance matrix of different forcing considered by the regression model.
A statistical parameter that is used to quantify how well the regression fitting model describes the data is the coefficient of determination R2. It is defined as the ratio of regression sum of squares to the total sum of squares. The coefficient of determination measures the proportion of the total variation in the target parameter (here: AOD440) in time, explained by the regression model. When the regression model very clearly explains the total variation in the geophysical signal Y(t), the value of R2 is close to unity; on the other hand, when the model does not resolve all the variations, R2 tends to zero [46].
The Trend-Run model was adapted and used at the University of La Réunion for the estimation of trends of temperature in the subtropical upper troposphere-lower stratosphere [46,47] and total column and stratospheric ozone over the southern tropics and subtropics [48].
In this study, we used the Trend-Run model to evaluate the trend of the observed AOD440 over La Réunion as well as the contribution of relevant forcings to the variability of this observed AOD440. It is noteworthy that this purely statistical approach cannot take into account any transport mechanism determining an impact on the AOD440 over La Réunion. The following relevant forcings were considered within the Trend-Run model: biomass burning aerosols emissions, sea salt loading and large-scale atmospheric structures (i.e., Quasi-Biennial Oscillation (QBO), El Niño Southern Oscillation (ENSO), Indian Ocean Dipole (IOD), Madden–Julian Oscillation (MJO)).
Regional biomass burning aerosols emissions were taken from the Global Fire Emissions Database, Version 4.1s (GFEDv4s, [27]). The GFEDv4.1s dataset can be accessed through the following link: http://www.globalfiredata.org/ (accessed on 22 November 2021). We used in the present study the GFEDv4s’s emitted total particulate matter (ETPM) calculated following GFED4s recommendations available at: https://www.geo.vu.nl/~gwerf/GFED/GFED4/Readme.pdf (accessed on 29 September 2022). The ETPM was computed from dry matter emissions using the provided emission factors stated here: https://www.geo.vu.nl/~gwerf/GFED/GFED4/ancill/GFED4_Emission_Factors.txt (accessed on 29 September 2022). The resulting ETPM had a 1° spatial resolution and a monthly time resolution. We considered the ETPM from the following relevant areas (as defined by Figure 3 in [29]): Southern Hemisphere South America (SHSA), Northern Hemisphere Africa (NHAF), Southern Hemisphere Africa (SHAF), South-East Asia (SEAS), Equatorial Asia (EQAS), AUST (Australia and New Zealand). Figure 2 shows the climatology of the ETPM emitted by these areas for the 2007–2019 period used in this study. The ETPM values for SHSA, NHAF, SHAF, SEAS, EQAS and AUST peak in September, December, August, March, September and November, respectively. While the African ETPM shows a small standard deviation, indicating a quite stable annual BB activity, all other areas, and especially SHSA, EQAS and AUST, show a large standard deviation, indicating a large interannual variability in their BB activity (as highlighted in [27]).
Sea salt loading was taken into account through the sea salt AOD at 550 nm (SSAOD550) product from the Copernicus Atmosphere Monitoring Service (CAMS) European Center for Medium-Range Weather Forecast (ECMWF, Reading, United Kingdom) Atmospheric Composition Reanalysis 4 (CAMS EAC4) averaged over a 2° wide box centered on La Réunion. Spatial and temporal resolutions of CAMS EAC4 SSAOD550 were 1.3° and monthly, respectively. The CAMS EAC4 products can be accessed through the following link: https://ads.atmosphere.copernicus.eu/cdsapp#!/dataset/cams-global-reanalysis-eac4?tab=overview (accessed on 22 November 2021). Figure 3 shows the climatology of the SSAOD550 for the 2007–2019 period, with a maximum in austral winter (June-July-August, JJA) and a minimum in austral summer (December-January-February, DJF). As sea salt aerosols emissions are mainly driven by sea surface wind speed [49,50], this SSAOD550 climatology reassuringly follows the climatology of the sea surface wind speed in the area [51]. Please note that we do not discuss here the SSAOD550 values, as this CAMS EAC4 product is only used in this study to document the variability of sea salt aerosols over La Réunion after normalization (Section 3.2).
Large-scale atmospheric structures were taken into account through the following relevant indexes: we used the monthly mean zonal wind speed at Singapore at the 40 hPa level and the Southern Oscillation Index to parameterize the QBO (link: https://www.geo.fu-berlin.de/en/met/ag/strat/produkte/qbo/index.html (accessed on 15 July 2022)) and the ENSO (link: https://psl.noaa.gov/gcos_wgsp/Timeseries/SOI (accessed on 15 July 2022)) forcings, respectively. In order to consider IOD in the Trend-Run model, we used DMI from https://psl.noaa.gov/gcos_wgsp/Timeseries/DMI/ (accessed on 15 July 2022). Given the MJO is the dominant intraseasonal mode of variability in the tropics, this forcing was also added in the Trend-Run model [52]. We used the index of [53] which is based on the first two empirical orthogonal functions of the combined fields of the 850 hPa zonal wind, 200 hPa zonal wind and outgoing longwave radiation (link: https://psl.noaa.gov/mjo/mjoindex (accessed on 15 July 2022)).

3. Results

3.1. Column-Integrated Loading and Size of Aerosols

In total, 89,150 measurements were performed over the May 2007–December 2019 period. Figure 4 gives the total number of sun photometer measurements per month used in this study. DJF is the period with the lowest number of observations due to the high occurrence of cloudy skies in austral summer.
Table 1 gives the average (±standard deviation), minimum, maximum and median (25th and 75th percentile) values for AOD440 and α over La Réunion for March-April-May (MAM), June-July-August (JJA), September-October-November (SON), December-January-February (DJF) and all seasons for the 2007–2019 considered period. The values reported in Table 1 for all seasons are typical values observed at remote maritime AERONET sites such as Nauru (0.52°S, 167°E), Lanai (20.7°N, 157°W) and Tahiti (17.6°S, 149.6°W) [54,55], which are mainly loaded in sea salt aerosols.
Figure 5 shows a synthesis view of the sun photometer measurements performed at La Réunion over the considered period. We used two independent variables: AOD440 and the Ångström exponent between 500 and 870 nm (α). The bottom and upper-left panels of Figure 5 show the median (red line on each box), range (whiskers, defined as median ± three times the standard deviation), 25th and 75th percentile (edges of each box) and outliers (red crosses) of AOD440 and α values, respectively, for MAM (green filled box), JJA (blue filled box), SON (black filled box), DJF (orange filled box) and all seasons (blue box). The upper-right panel of Figure 5 shows the scatter plot of the two independent variables AOD440 versus α for MAM (green dots), JJA (blue dots), SON (black dots) and DJF (orange dots). Big colored dots give the mean AOD440 versus α for each season.
While more than 75% of AOD440 and α values were below 0.1 and 1, respectively, confirming that La Réunion could be considered as a remote oceanic site [54], the distributions of AOD440 and α ranged from 0.01 to 0.66 and from −1.85 to 2.89, respectively, providing evidence that the aerosol loading over La Réunion could be highly variable and had a diverse number of contributing sources. It should be noted that negative values of α probably resulted from very low AOD measurements and were thus associated to a large uncertainty.
Using Table 1 and Figure 5 to focus on the seasonal variability of AOD440 and α values, one can note that (see Table 1 for values discussed here below):
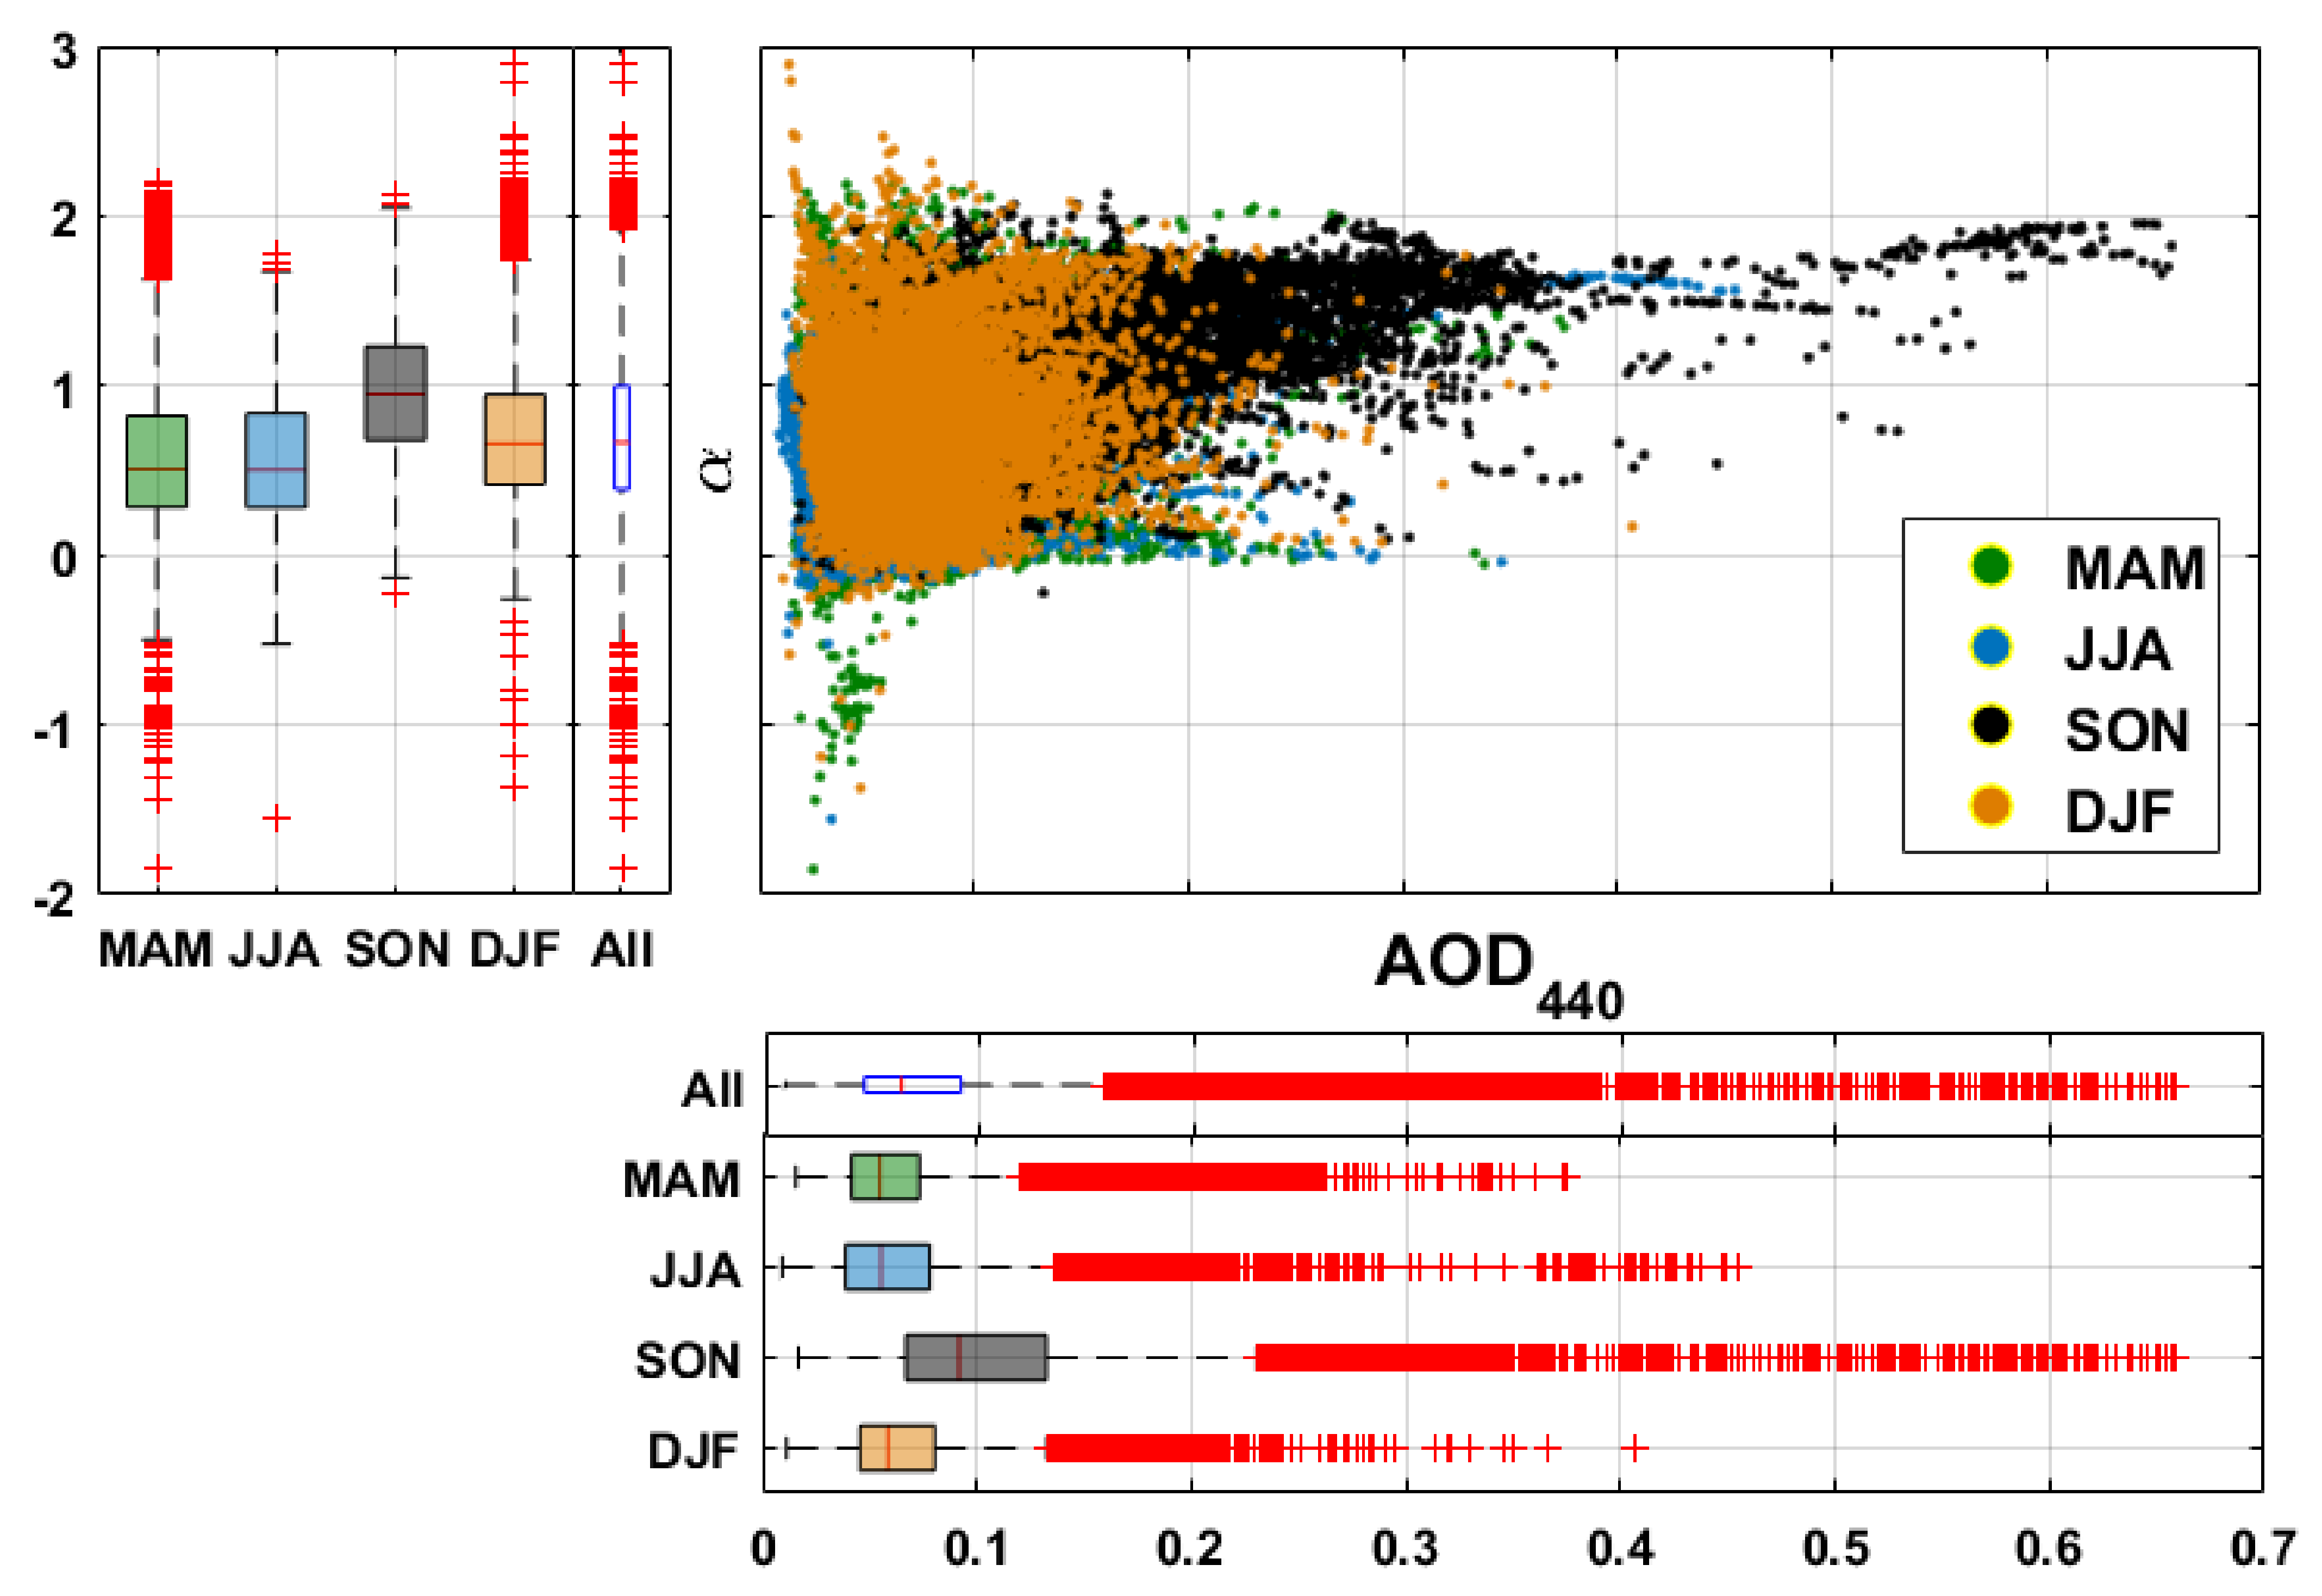
  • The upper-right panel of Figure 5 shows a clear behavior of increasing values of α as AOT440 increases;
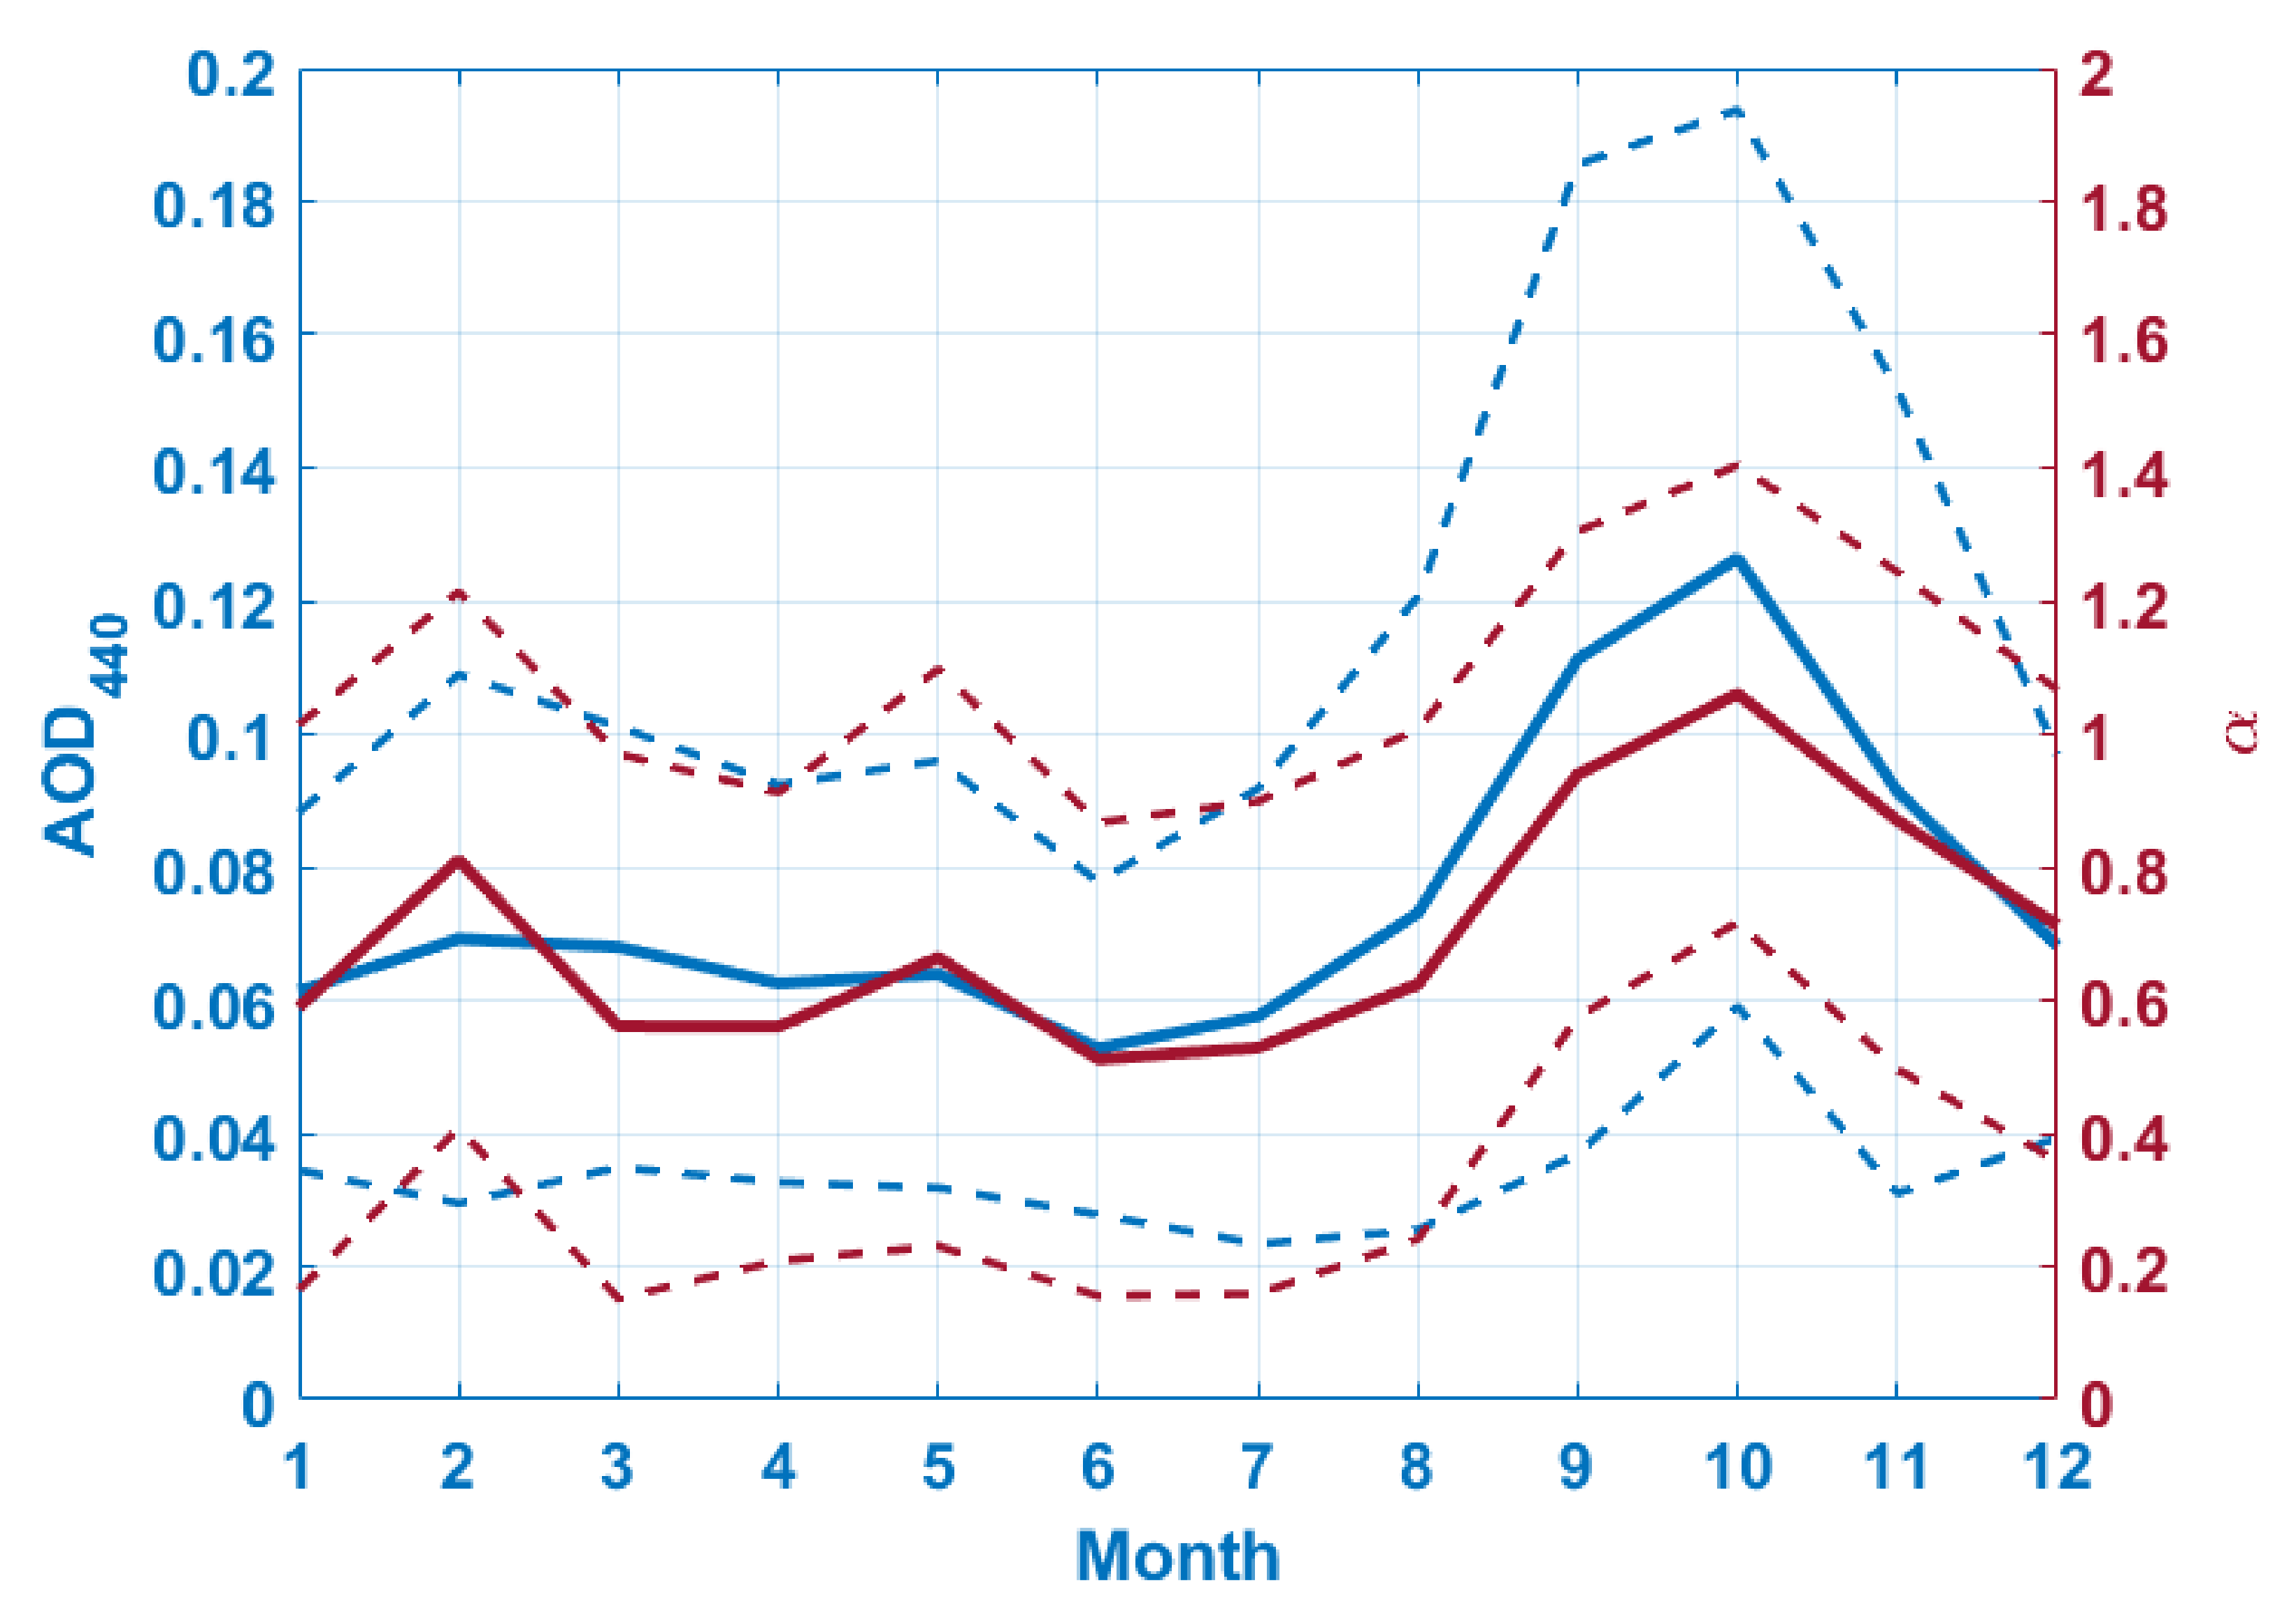
  • The lowest mean and median AOD440 and α values are found for MAM and JJA, followed by DJF, while SON is clearly the season with the highest mean and median values;
  • The maximum (minimum) values for AOD440 and α are found in SON (JJA and DJF) and DJF (MAM), respectively;
  • The highest (lowest) dispersion for AOD440 and α values are found in SON (MAM and DJF) and MAM and DJF (SON), respectively.
Therefore, SON exhibited the highest mean AOD440 value and AOD440 dispersion, as well as the highest α mean value and the lowest variability in α, leading to the conclusion that this season was impacted by a regular loading of fine-mode-dominated particles.
Figure 6 shows the monthly climatology of AOD440 and α values. The mean monthly AOD440 was 0.06 ± 0.03 from December to August and rose to 0.13 ± 0.07 in October. The same pattern was visible on the monthly climatology of α: the mean monthly α was 0.61 ± 0.40 from December to August and rose to 1.06 ± 0.34 in October.
Figure 7 shows the mean aerosol VSD retrieved from sun photometer measurements with respect to the related AOD440 (3311 cases). The VSD varied with different AOD440 values. The coarse mode dominated the total volume concentration for AOD440 up to 0.2 with a mean effective radius equal to 3 μm. For AOD440 greater than 0.2, the fine mode dominated the total volume concentration with a mean radius equal to 0.15 μm. This higher contribution of the fine mode to the total volume concentration with higher AOD440 confirmed that BB aerosols were the main contributors to the AOD440 increase. These results were in agreement with [56], showing the same behavior of the aerosol VSD at Inhaca Island (26°S, 33°E, 73 m asl, Mozambique) with increasing AOD in September 2000.
Taking into account that (i) α values below (above) one are indicative of aerosols dominated by coarse (fine) particles (e.g., [55]), (ii) coarse (fine) particles are typically mineral dusts or sea salts (biomass burning aerosols or anthropogenic aerosols) (e.g., [57]), (iii) there is no evidence of dust transport pathway toward the SWIO [58], and (iv) La Réunion is located in a remote maritime area disconnected from large anthropogenic sources, the results of the present Section suggested that these seasonal and climatological behaviors of AOD440 and α values over La Réunion were a signature of the main contribution of marine aerosols (coarse particles) over the year and of the Southern Hemisphere BB season from September to November emitting BB aerosols (fine particles). The next Section further investigates the validity of these conclusions by using the Trend-Run model to calculate the contributions of the forcings responsible for the variability of the observed AOD440 time series above La Réunion.

3.2. Origin of the AOD Variability and Linear Trend Estimate

Figure 8 shows the time evolution of monthly AOD440 values observed by the sun photometer and simulated by the Trend-Run model over La Réunion from January 2007 to December 2019 (blue stars and red circles, respectively).
Table 2 and Figure 9 give the contributions and corresponding standard deviations (in percentages) of QBO, ENSO, IOD and MJO, BB emissions from the SHSA, NHAF, SHAF, SEAS, EQAS and AUST areas and sea salts to the AOD440 variability over La Réunion as obtained by the linear regression Trend-Run model, as well as the total coefficient of determination R2 and the resulting calculated trend.
The coefficient of determination R2 equaled 89.2%, which showed that the model quite precisely reproduced most of the variability of the studied AOD440.
As expected, the main contribution to the AOD440 variability over La Réunion was the BB activity, which explained 67.4 ± 28.1% of the observed AOD440 variability. Having a closer look to the contributing BB areas, one can see that the main contributions came from SHAF (21.7 ± 7.2%) and SHSA (19.5 ± 8.1%), followed by SEAS (9.8 ± 2.4%), NHAF (7.2 ± 5.6%), AUST (4.7 ± 3.2%) and EQAS (4.5 ± 1.6%). These results were in line with the conclusions of [6], who similarly identified these areas as sources governing the abundance of CO above La Réunion, the main contributing ones being unambiguously SHAF and SHSA.
Large-scale atmospheric structures explained 5.5 ± 1.7% of the AOD440 variability, the main contributions coming from the QBO (2.9 ± 0.1%) and ENSO (2.1 ± 1.4%), followed by small contributions of the MJO (0.3 ± 0.2%) and the IOD (0.2 ± 0.1%).
The contribution from the surrounding Indian Ocean to the AOD440 variability over La Réunion through sea salts emission equaled 16.3 ± 4.2%. Although marine aerosols strongly contributed throughout the year to the AOD above La Réunion (see Section 3.1), their impact on the variability of the aerosol loading was ~four times inferior to the BB one (67.4 ± 28.1%). Sea salt aerosols could therefore be considered as the La Réunion AOD baseline, this latter being mainly modulated by the BB plumes coming from the contributing sources areas.
The calculated AOD440 through the Trend-Run model equaled 0.02 ± 0.01 per decade, respectively, which was equivalent to a mean increase of 2.6 ± 1.3% per year.

4. Discussion

The robustness of this work mostly relied on the relevance of the chosen parameters (forcings) used as inputs in the Trend-Run model. The coefficient of determination resulting from the Trend-Run equaling 89.2%, one could reasonably trust the results presented here above. Nevertheless, part of the unexplained variability and of the nonreproduced AOD440 peaks by the Trend-Run model (Figure 8) may come from:
  • Local anthropogenic and wildfire aerosol emissions: This study focused on long-range transport affecting the aerosols burden above La Réunion. However, the used instrument being located in an urban area, the local influence of the measurements could not be excluded, and some of the 89,150 measurement points presented in Section 3.1 (Sun photometer measurements) might have reflected this local influence. Still, as there is no industrial center in La Réunion, as local wildfires are uncommon, and as we dealt with monthly mean within the Trend-Run model, on could consider them negligible.
  • Volcanic aerosol emissions: It is noteworthy that the island of La Réunion hosts an active volcano (the Piton de la Fournaise) [59], whose episodic plumes might affect the aerosol burden above Saint-Denis when local circulation is appropriate. In addition, La Réunion was impacted by the Calbuco volcanic plume in 2015 [60]. Attempts were made in the framework of this study to take into account these episodic volcanic aerosol plumes by using the Infrared Atmospheric Sounding Interferometer (IASI) SO2 retrievals (e.g., [61]) over La Réunion as an input parameter into the Trend-Run model. However, no contribution from this forcing was detectable by the model.
  • Regional anthropogenic aerosol emissions: The present work dealt with wildfires and sea salt aerosols only. However, contamination due to long-range transport of anthropogenic emissions could not be excluded. Still, the SWIO being a pristine region, the anthropogenic influence could be considered as negligible [3].
  • Fire emissions inventories: Regional biomass-burning aerosols emissions were taken from the GFEDv4s database. However, [62] pointed out that “differences across inventories in the interpretation of satellite imagery, the emissions factors assumed for different components of smoke, and the adjustments made for small and obscured fires can result in large regional differences in fire emissions estimates across inventories”. These differences across global fire emissions inventories may have affected our results and would deserve a dedicated study.
  • Sea salt aerosols: Sea salt loading over La Réunion was taken into account through the SSAOD550 product from CAMS EAC4. Similarly to the previous point, differences between datasets (such as between CAMS and the Modern-Era Retrospective analysis for Research and Applications, Version 2—MERRA-2, e.g., [63]) for this input parameter used within the Trend-Run model may have affected our results and would deserve a dedicated study.
  • Large-scale atmospheric structures: QBO, ENSO, IOD and MJO large-scale atmospheric structures all together explained 5.5 ± 1.7% of the observed AOD440 variability. However, these figures for the large-scale atmospheric structures should be considered carefully for the following reasons (despite the fact that autocorrelations were taken into account within the Trend-Run model): (i) as MJO, ENSO and IOD strongly modulate the occurrence of many types of extreme weathers in the global tropics and midlatitudes, including droughts, heat waves, and subsequent wildfires [64,65,66], and as QBO can impact precipitation patterns, which may inhibit wildfires [67], part of their impact on the variability of the observed AOD over La Réunion was already taken into account in the used GFEDv4s ETPM emission database; (ii) MJO, ENSO and IOD are interconnected through complex dynamical feedbacks (e.g., [68]), and separating precisely their contribution on the variability of the observed AOD over La Réunion would deserve a dedicated study. Actually, the pure statistical approach used in the present study to evaluate the trend of the observed AOD440 over La Réunion as well as the contribution of relevant parameters (or forcings) to the variability of this observed AOD440, could not take into account any transport mechanism determining an impact on the AOD440 over La Réunion. Insights into such transport mechanisms would need the use of a Lagrangian model (such as FLEXPART, e.g., [69]) coupled with emissions inventories and proper injection heights (e.g., [6]).

5. Conclusions

Measurements of spectral optical thickness were made with a CIMEL sun photometer in the framework of AERONET at La Réunion in the SWIO (800 km off the east coast of Madagascar) pristine area from May 2007 to December 2019 to characterize the aerosol optical properties over this site. Using the GFEDv4s ETPM emission database, the CAMS EAC4 SSAOD550 product around La Réunion and QBO, ENSO, IOD and MJO forcings indexes as inputs within the linear regression model Trend-Run, contributions from the BB sources areas, sea salts and large-scale atmospheric structures to the variability of the AOD over La Réunion were assessed together with the AOD trend.
The principal findings of this study are summarized as follows:
  • The seasonal and climatological behaviors of AOD440 and α values over La Réunion were a signature of the main contribution of marine aerosols (coarse particles) along the year and of the Southern Hemisphere BB season from August to November (fine particles), causing a quasi-doubling of the mean AOD440 and α values from 0.06 ± 0.03 and 0.61 ± 0.40, respectively, in December to August up to 0.13 ± 0.07 and 1.06 ± 0.34, respectively, in October.
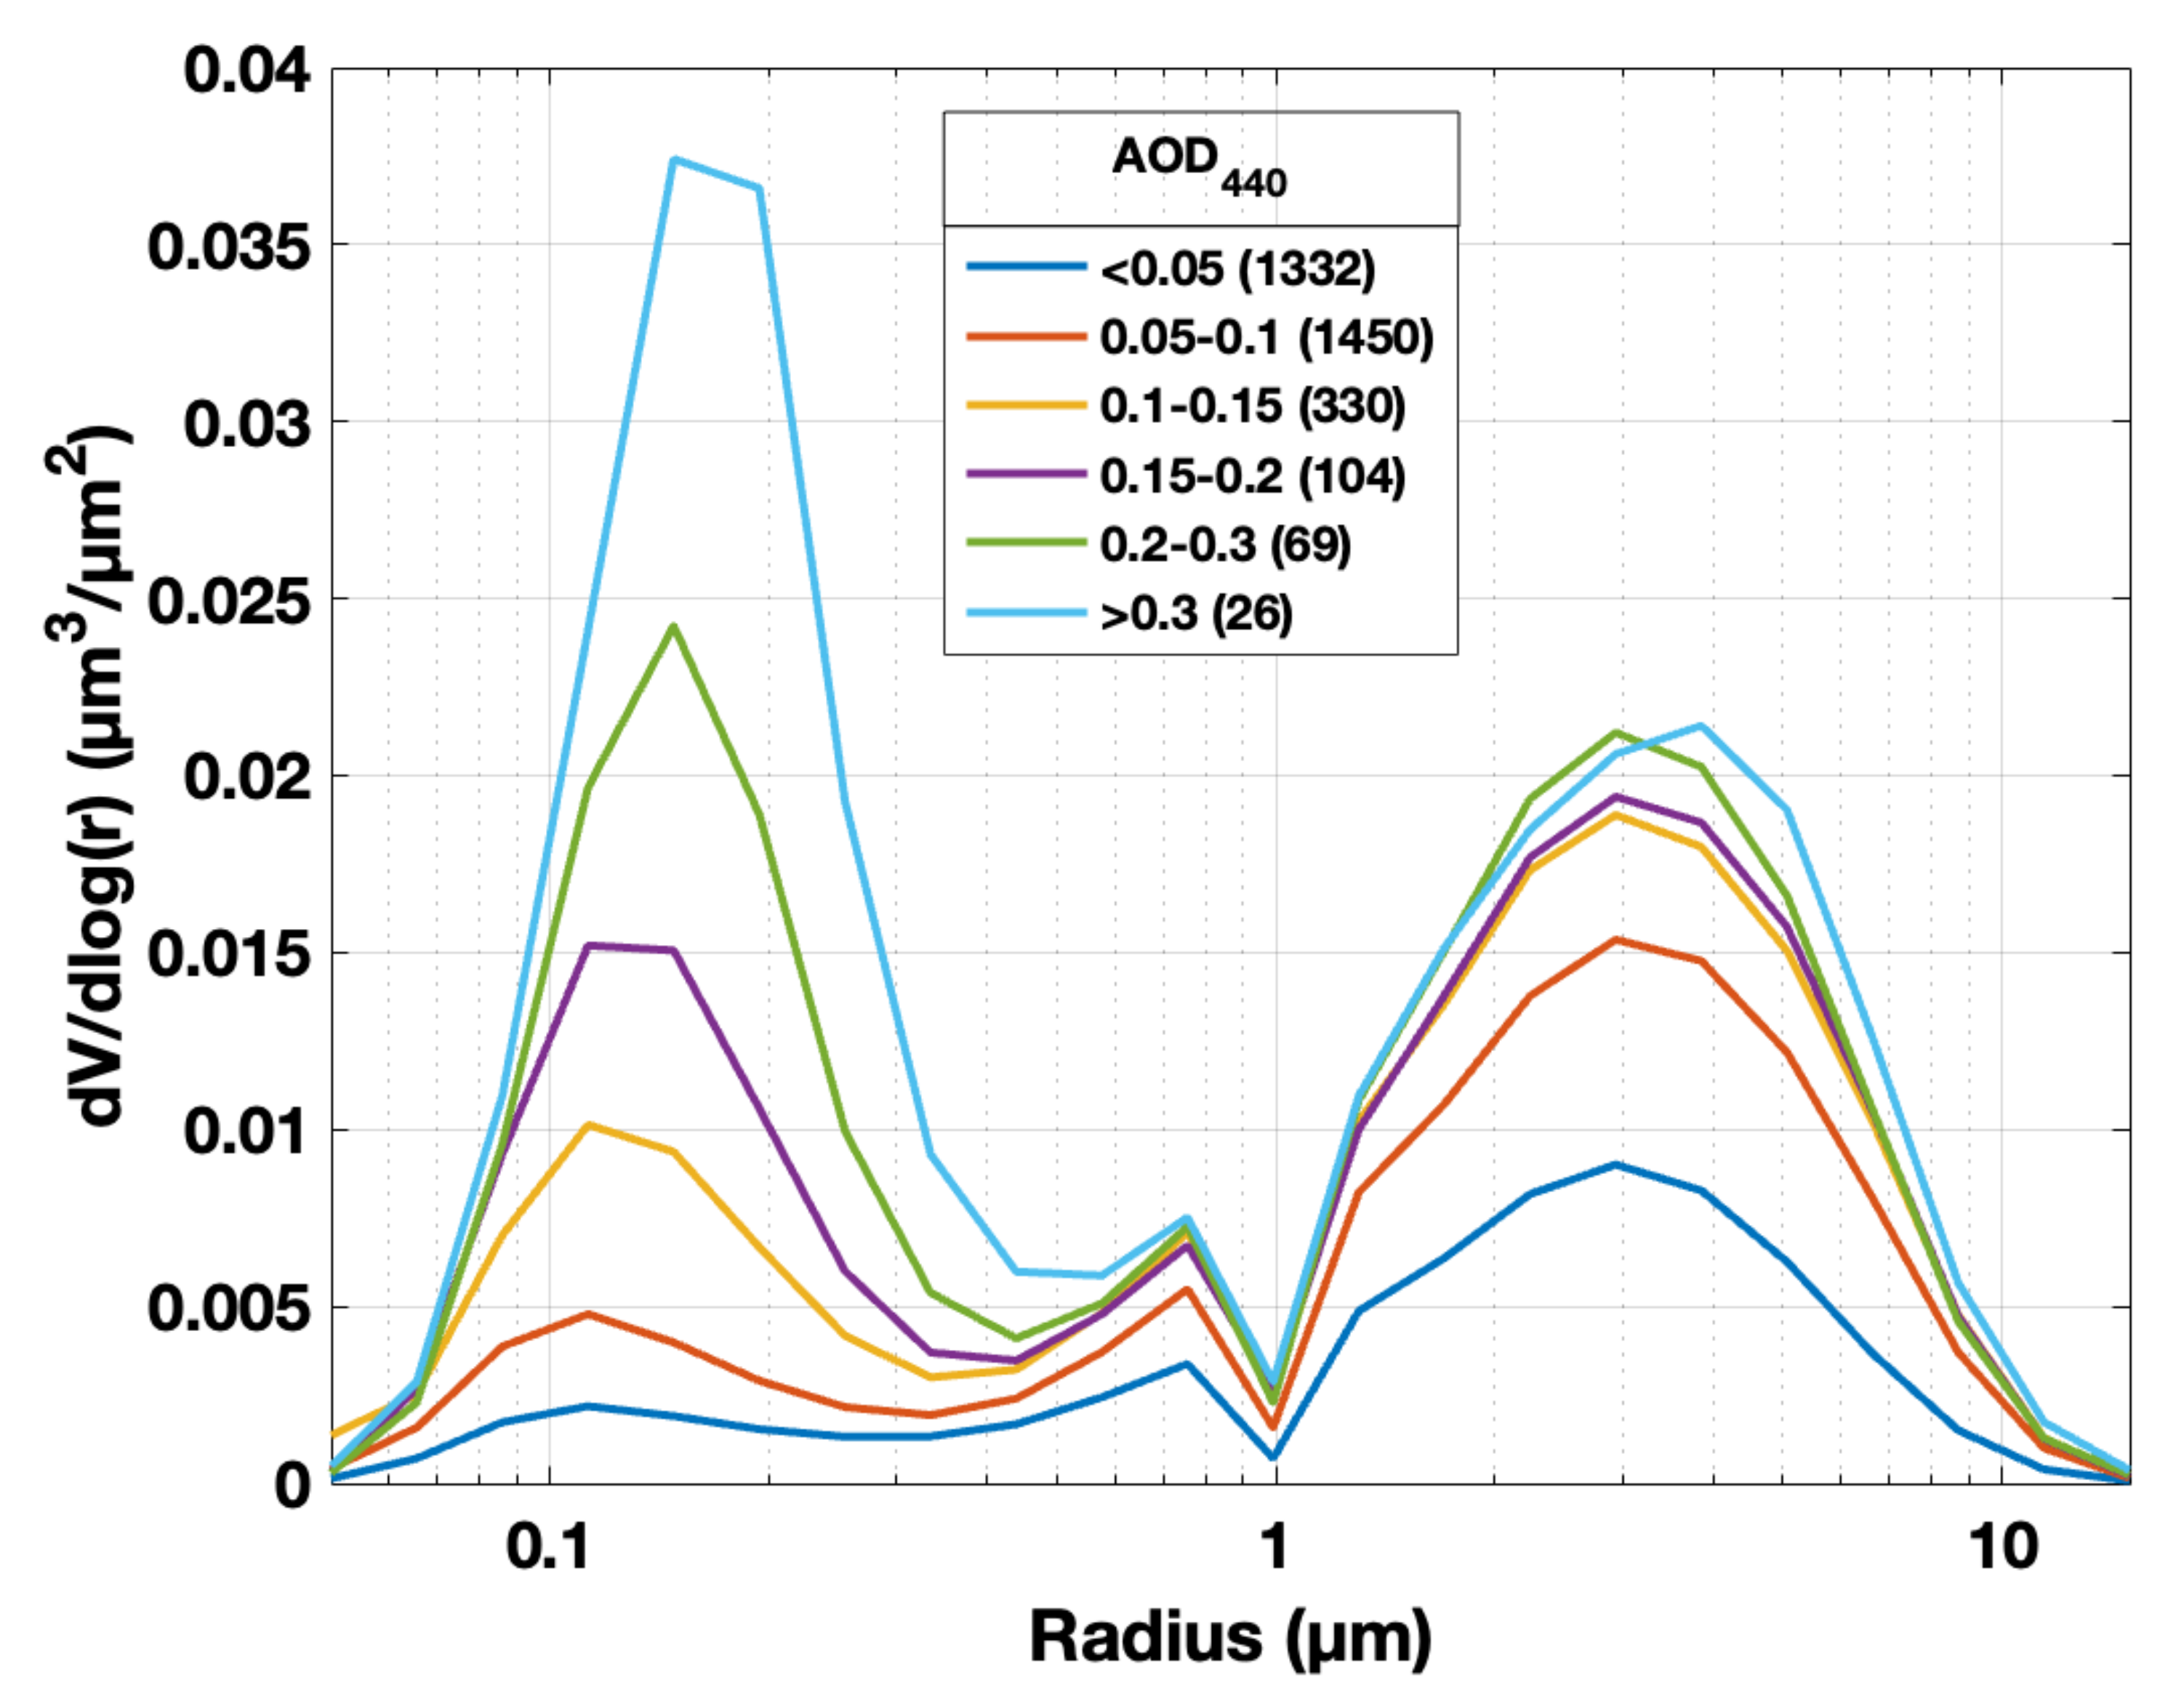
  • The retrieved aerosol VSD showed that the coarse-mode (fine-mode) dominated the total volume concentration for an AOD440 lower (higher) than 0.2 with a mean radius equal to 3 μm (0.15 μm), implying that BB aerosols were the main contributors to the AOD440 increase over La Réunion.
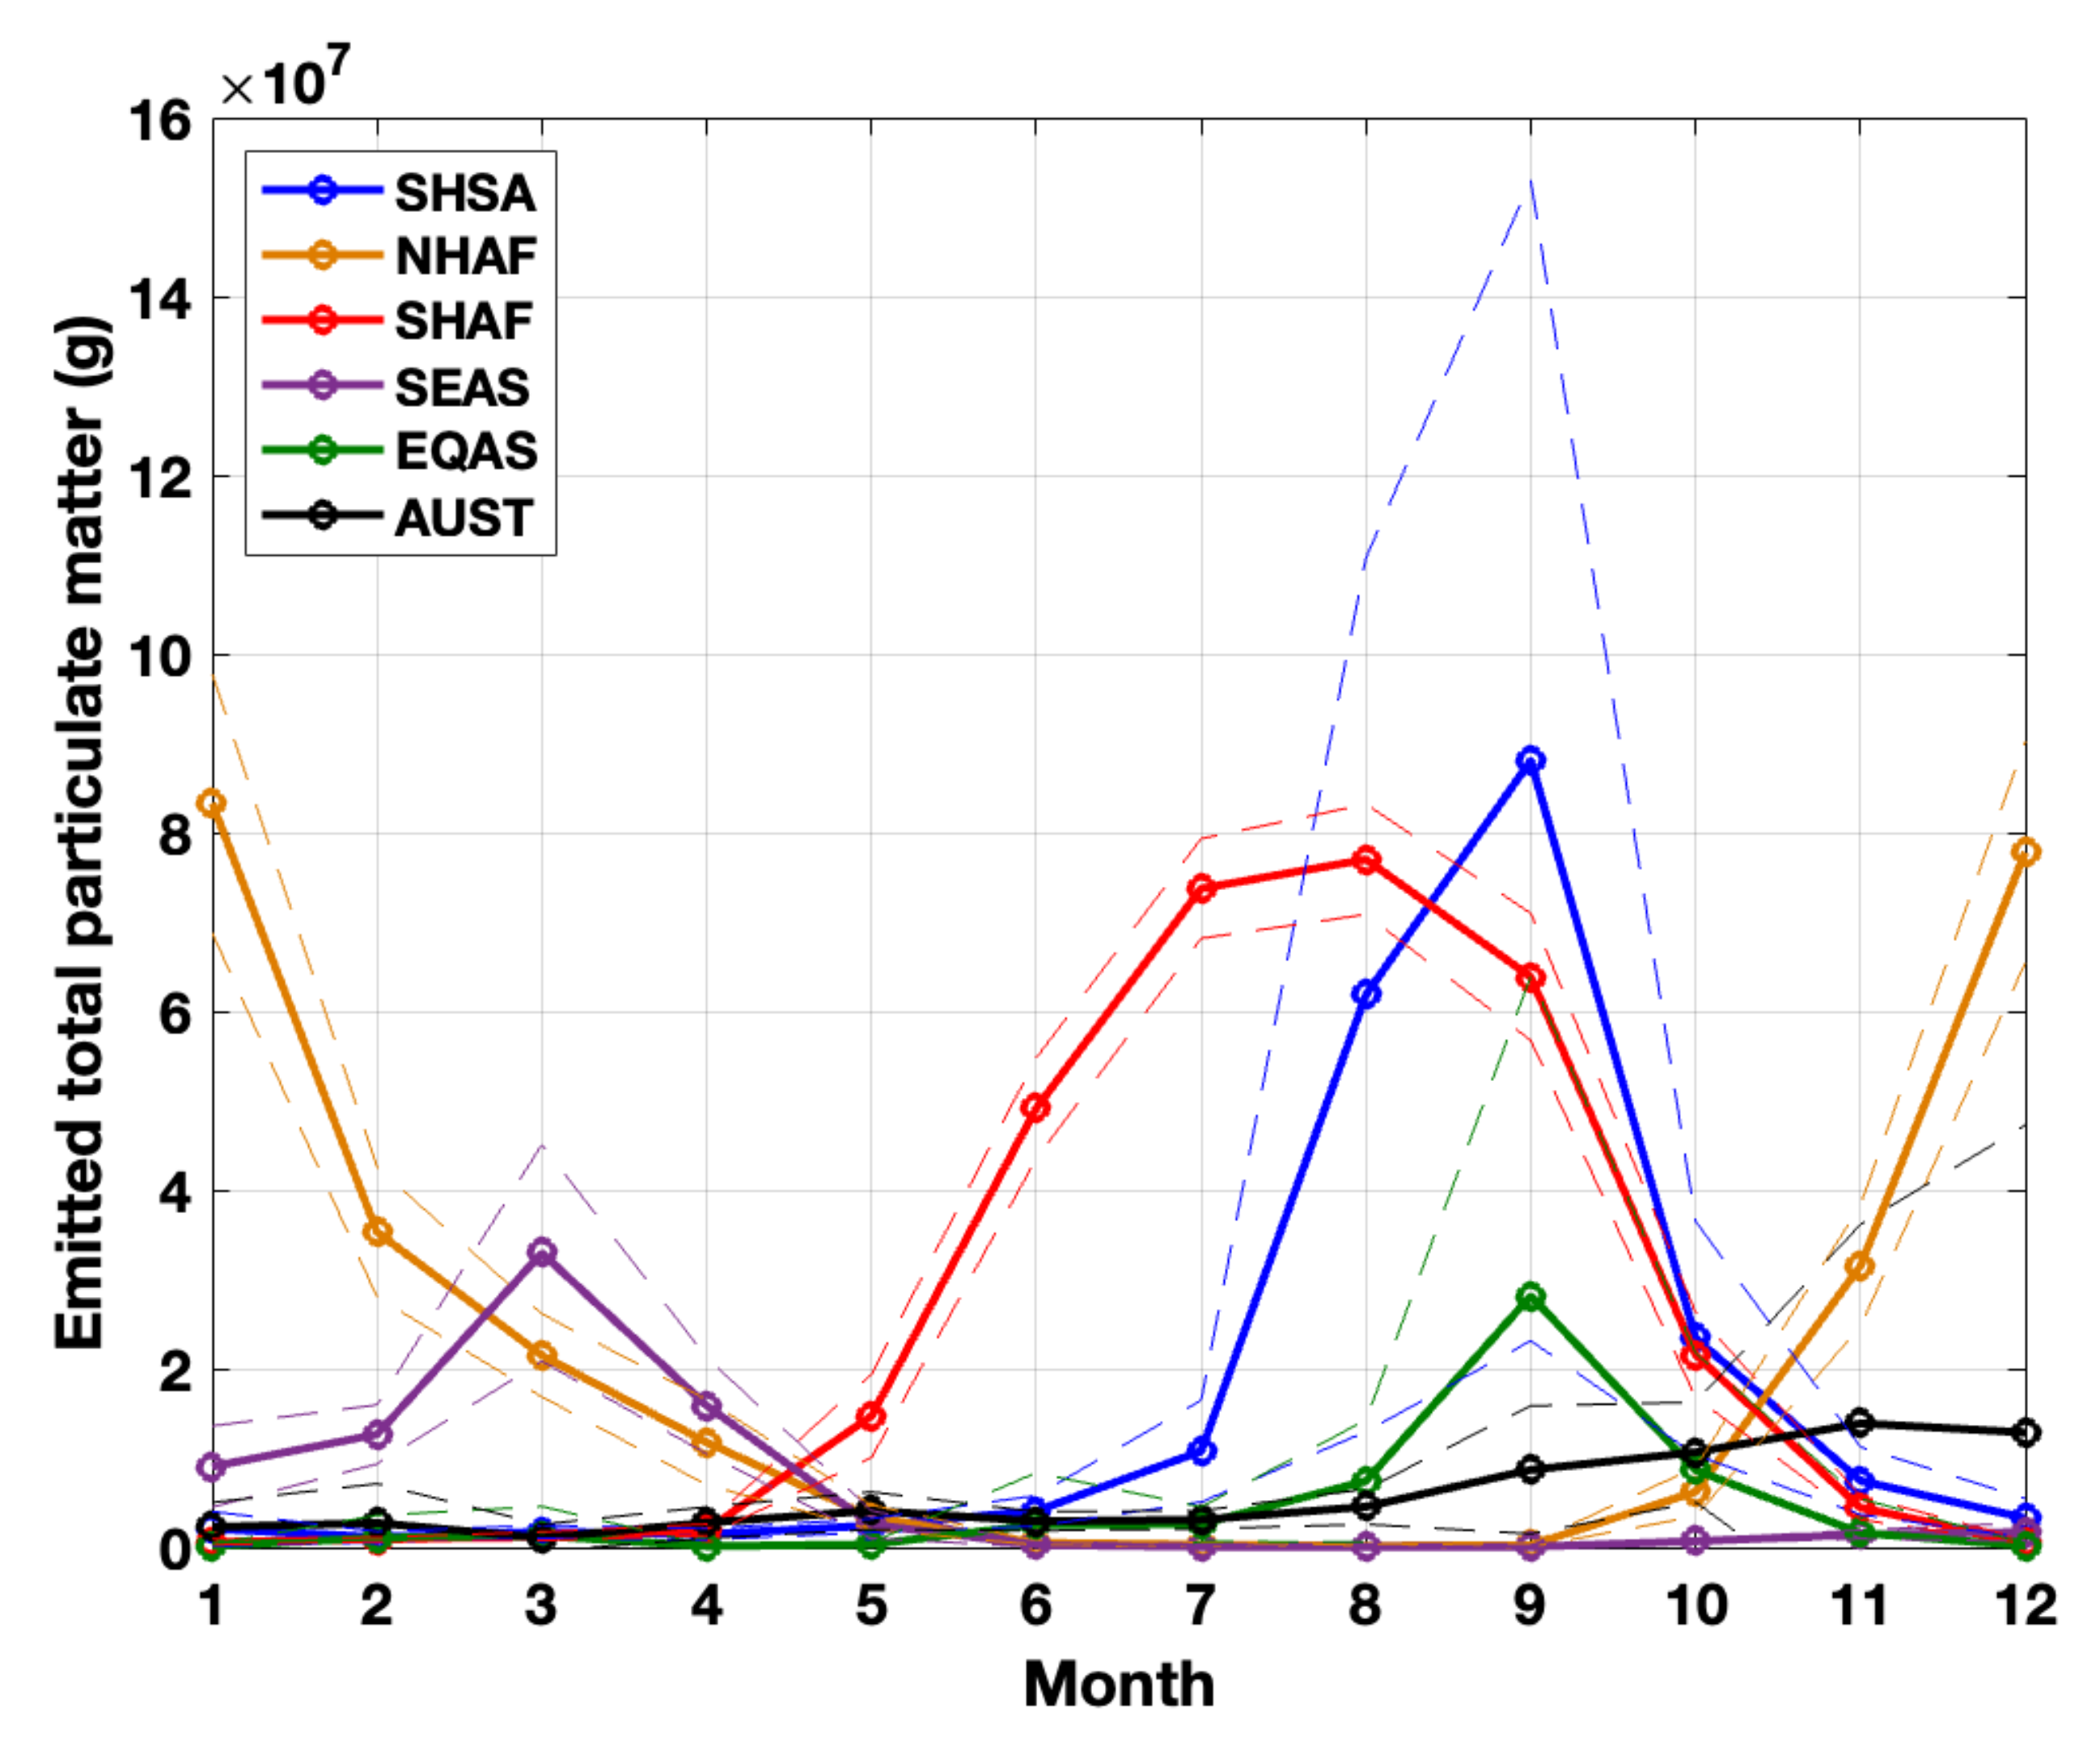
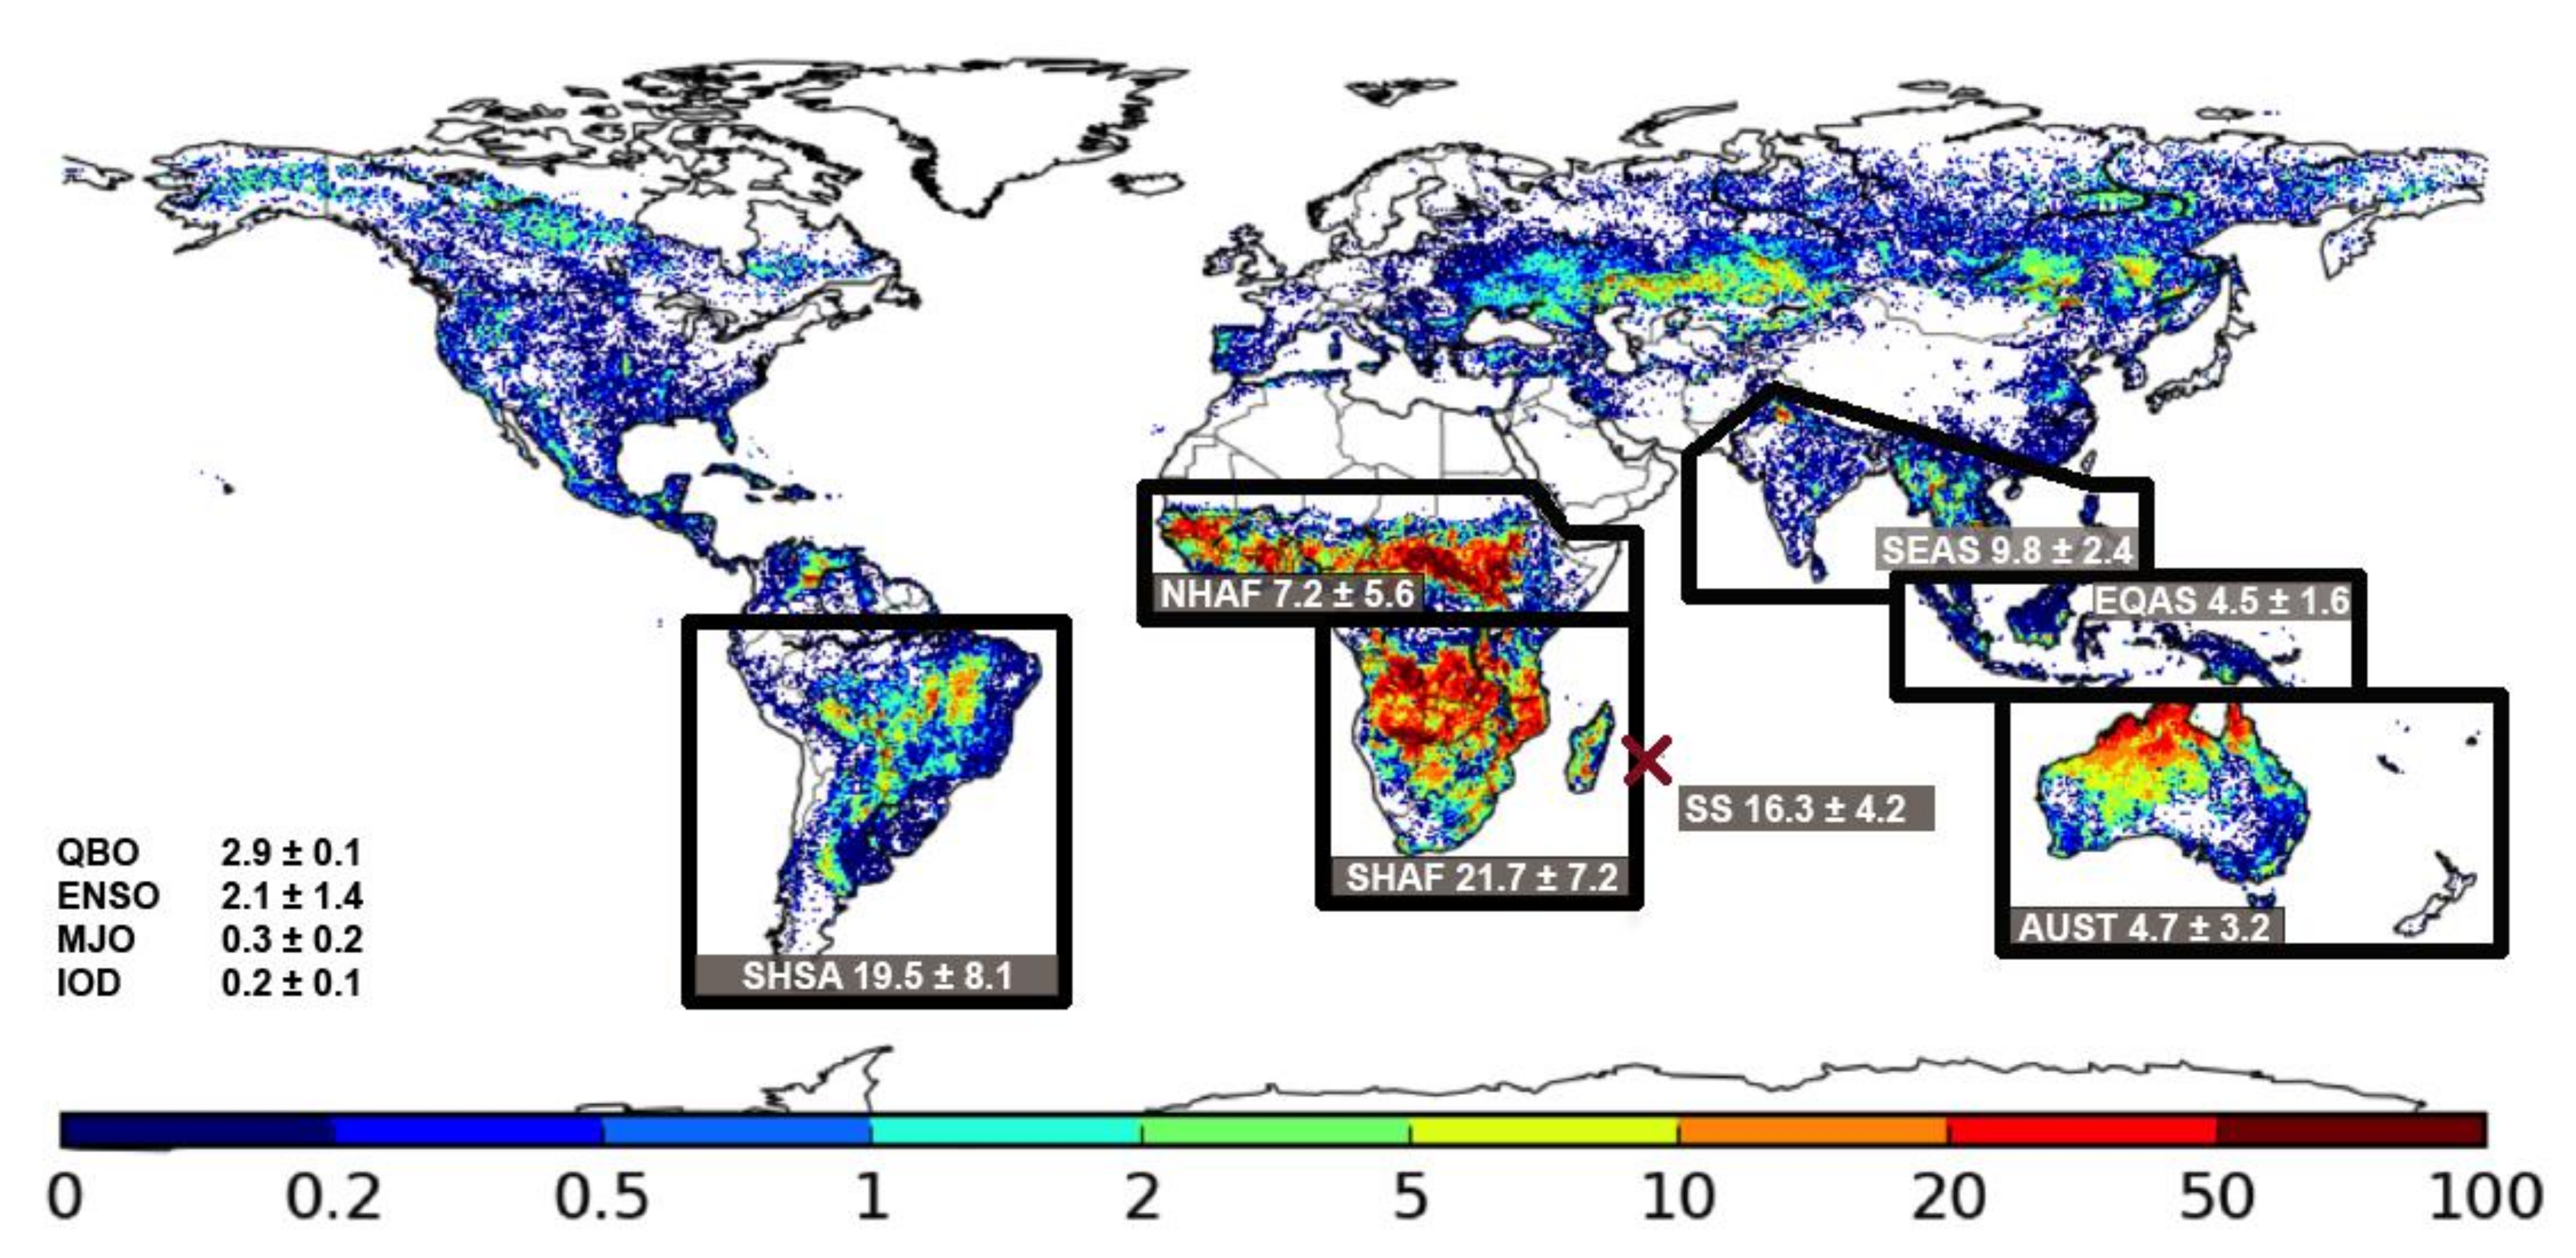
  • The main contribution to the AOD440 variability over La Réunion was the BB activity, which explained 67.4 ± 28.1% of the observed AOD440 variability. The main contributions came from SHAF (21.7 ± 7.2%) and SHSA (19.5 ± 8.1%), followed by SEAS (9.8 ± 2.4%), NHAF (7.2 ± 5.6%), AUST (4.7 ± 3.2%) and EQAS (4.5 ± 1.6%).
  • The contribution from the surrounding Indian Ocean to the AOD440 variability over La Réunion through sea salts emission equaled 16.3 ± 4.2%. Sea salt aerosols could therefore be considered as the La Réunion AOD baseline, this latter being mainly modulated by the BB plumes coming from the contributing sources areas.
  • QBO, ENSO, IOD and MJO large-scale atmospheric structures all together explained 5.5 ± 1.7% of the observed AOD440 variability.
  • The calculated trend for AOD440 over La Réunion through the Trend-Run model equaled 0.02 ± 0.01 per decade (2.6 ± 1.3% per year). Using simple linear fits, the calculated trends for α (not shown) and SSAOD550 (not shown) equaled 0.06 ± 0.03 and −1 × 10⁻³ ± 5 × 10⁻⁴ per decade, respectively (0.7 ± 0.4% and −1.3 ± 0.7% per year, respectively). Performing a similar simple linear fit on the ETPM emitted by each considered area weighted by their respective contribution to the AOD440 variability over La Réunion, we found a trend equal to −0.1 ± 0.05 Tg per decade (−0.1 ± 0.05% per year, not shown), which was in agreement with [70] showing low to null trends in fire activity for the areas considered in the present study. These simply calculated trends for α and SSAOD550 may suggest that the Trend-Run-calculated positive trend for AOD440 over La Réunion could be caused by an increase in fine particles loading above La Réunion (increasing α and decreasing sea salt loading). However, the very low (almost null) trend for the weighted ETPM did not allow us to link this increase in fine particles loading to the biomass burning activity, thus leaving open the question of the origin of this AOD440 positive trend over La Réunion.
This study gave unique insights on the loading and type of aerosols over La Réunion, on the forcings contributing to their variability and on the associated trends. The SWIO being a sparsely documented pristine area, and yet at the crossroad of transport pathways bringing pollution plumes from distant and highly active wildfire sources, such results fill the gap of space-borne observations performed over this low signal-to-noise ratio measurement area, further identify the wildfire source regions impacting the aerosol burden over the SWIO, and open the door for upcoming studies related to the vertical distribution of BB aerosol plumes and their properties to quantify the impact of wildfire emissions on the SWIO tropospheric and lower stratospheric composition and radiative balance at seasonal and interannual scales [71,72,73,74,75].

Author Contributions

Conceptualization, V.D.; methodology, V.D. and N.B.; software, V.D., M.-L.P. and N.B.; validation, P.G., V.D. and N.B.; formal analysis, V.D., M.-L.P. and N.B.; investigation, V.D. and M.-L.P.; resources, J.-M.M., P.G., V.D. and N.B.; data curation, V.D. and P.G.; writing—original draft preparation, V.D.; writing—review and editing, All; visualization, V.D.; supervision, V.D.; project administration, V.D. All authors have read and agreed to the published version of the manuscript.

Funding

This research received no external funding.

Data Availability Statement

AOD from direct sun Version 3 Level 2.0 and Aerosol size distribution Version 3: Almucantar Level 2.0 Inversion are available on https://aeronet.gsfc.nasa.gov/ (accessed on 3 June 2022). The GFEDv4.1s dataset can be accessed on http://www.globalfiredata.org/ (accessed on 22 November 2021). The CAMS EAC4 products can be accessed on https://ads.atmosphere.copernicus.eu/cdsapp#!/dataset/cams-global-reanalysis-eac4?tab=overview (accessed on 22 November 2021). The QBO and ENSO data can be accessed on https://www.geo.fu-berlin.de/en/met/ag/strat/produkte/qbo/index.html (accessed on 15 July 2022) and https://psl.noaa.gov/gcos_wgsp/Timeseries/SOI (accessed on 15 July 2022), respectively. The DMI data are available on https://psl.noaa.gov/gcos_wgsp/Timeseries/DMI/ (accessed on 15 July 2022). The MJO data can be accessed on https://psl.noaa.gov/mjo/mjoindex (accessed on 15 July 2022).

Acknowledgments

The authors acknowledge the European Communities, the Région Réunion, CNRS and Université de la Réunion for their support and contributions in the construction phase of the research infrastructure OPAR (Observatoire de Physique de l’Atmosphère de La Réunion). OPAR is presently funded by CNRS (INSU), Météo France and Université de La Réunion and managed by OSUR (Observatoire des Sciences de l’Univers de La Réunion, UAR 3365). The SNO PHOTONS/AERONET and ACTRIS-FR are also acknowledged for their support in the sun photometer calibration and maintenance. We also wish to thank Vincent-Henri Peuch (ECMWF Copernicus Services) for useful discussions about CAMS products.

Conflicts of Interest

The authors declare no conflict of interest.

References

  1. Boucher, O.; Randall, D.; Artaxo, P.; Bretherton, C.; Feingold, G.; Forster, P.; Kerminen, V.-M.; Kondo, Y.; Liao, H.; Lohmann, U.; et al. Clouds and Aerosols. In Climate Change 2013: The Physical Science Basis, Contribution of Working Group I to the Fifth Assessment Report of the Intergovernmental Panel on Climate Change; Stocker, T.F., Qin, D., Plattner, G.-K., Tignor, M., Allen, S.K., Boschung, J., Nauels, A., Xia, Y., Bex, V., Midgley, P.M., Eds.; Cambridge Universtiy Press: Cambridge, UK, 2013; pp. 571–657. [Google Scholar]
  2. Hamilton, D.S.; Lee, L.A.; Pringle, K.J.; Reddington, C.L.; Spracklen, D.V.; Carslaw, K.S. Occurrence of pristine aerosol environments on a polluted planet. Proc. Natl. Acad. Sci. USA 2014, 111, 18466–18471. [Google Scholar] [CrossRef] [Green Version]
  3. Mallet, P.; Pujol, O.; Brioude, J.; Evan, S.; Jensen, A. Marine aerosol distribution and variability over the pristine Southern Indian Ocean. Atmos. Environ. 2018, 182, 17–30. [Google Scholar] [CrossRef]
  4. Bremer, H.; Drummond, J.R.; Nichitu, F.; Zou, J.; Gille, J.C.; Deeter, M.N.; Francis, G.; Warner, J.; Kar, J.; Liu, J.; et al. Spatial and temporal variation of MOPITT CO in Africa and South America: A comparison with SHADOZ ozone and MODIS aerosol. J. Geophys. Res. Atmos. 2004, 109, D12304. [Google Scholar] [CrossRef]
  5. Edwards, D.P.; Emmons, L.K.; Gille, J.C.; Chu, A.; Attié, J.-L.; Giglio, L.; Wood, S.W.; Haywood, J.; Deeter, M.; Massie, S.T.; et al. Satellite-observed pollution from Southern Hemisphere biomass burning. J. Geophys. Res. Atmos. 2006, 111, 6655. [Google Scholar] [CrossRef]
  6. Duflot, V.; Dils, B.; Baray, J.L.; De Mazière, M.; Attié, J.L.; Vanhaelewyn, G.; Senten, C.; Vigouroux, C.; Clain, G.; Delmas, R. Analysis of the origin of the distribution of CO in the subtropical southern Indian Ocean in 2007. J. Geophys. Res. Atmos. 2010, 115, D22106. [Google Scholar] [CrossRef] [Green Version]
  7. Duflot, V.; Royer, P.; Chazette, P.; Baray, J.-L.; Courcoux, Y.; Delmas, R. Marine and biomass burning aerosols in the southern Indian Ocean: Retrieval of aerosol optical properties from shipborne lidar and Sun photometer measurements. J. Geophys. Res. Atmos. 2011, 116, D18208. [Google Scholar] [CrossRef] [Green Version]
  8. Khaykin, S.; Legras, B.; Bucci, S.; Sellitto, P.; Isaksen, L.; Tencé, F.; Bekki, S.; Bourassa, A.; Rieger, L.; Zawada, D.; et al. The 2019/20 Australian wildfires generated a persistent smoke-charged vortex rising up to 35 km altitude. Commun. Earth Environ. 2020, 1, 1–12. [Google Scholar] [CrossRef]
  9. Andreae, M.O.; Merlet, P. Emission of trace gases and aerosols from biomass burning. Glob. Biogeochem. Cycles 2001, 15, 955–966. [Google Scholar] [CrossRef] [Green Version]
  10. Dowdy, A.J.; Ye, H.; Pepler, A.; Thatcher, M.; Osbrough, S.L.; Evans, J.P.; Di Virgilio, G.; McCarthy, N. Future changes in extreme weather and pyroconvection risk factors for Australian wildfires. Sci. Rep. 2019, 9, 10073. [Google Scholar] [CrossRef] [PubMed] [Green Version]
  11. Ruiz-Arias, J.A.; Dudhia, J.; Gueymard, C.A.; Pozo-Vázquez, D. Assessment of the Level-3 MODIS daily aerosol optical depth in the context of surface solar radiation and numerical weather modeling. Atmos. Chem. Phys. 2013, 13, 675–692. [Google Scholar] [CrossRef]
  12. Li, J.; Li, X.; Carlson, B.; Kahn, R.A.; Lacis, A.A.; Dubovik, O.; Nakajima, T. Reducing multisensor satellite monthly mean aerosol optical depth uncertainty: 1. Objective assessment of current AERONET locations. J. Geophys. Res. Atmos. 2016, 121, 609–613, 627. [Google Scholar] [CrossRef] [PubMed] [Green Version]
  13. Li, J.; Kahn, R.A.; Wei, J.; Carlson, B.E.; Lacis, A.A.; Li, Z.; Li, X.; Dubovik, O.; Nakajima, T. Synergy of Satellite- and Ground-Based Aerosol Optical Depth Measurements Using an Ensemble Kalman Filter Approach. J. Geophys. Res. Atmos. 2020, 125, 31884. [Google Scholar] [CrossRef]
  14. Bright, J.M.; Gueymard, C.A. Climate-specific and global validation of MODIS Aqua and Terra aerosol optical depth at 452 AERONET stations. Sol. Energy 2019, 183, 594–605. [Google Scholar] [CrossRef]
  15. Gupta, P.; Remer, L.; Patadia, F.; Levy, R.; Christopher, S. High-Resolution Gridded Level 3 Aerosol Optical Depth Data from MODIS. Remote Sens. 2020, 12, 2847. [Google Scholar] [CrossRef]
  16. Sogacheva, L.; Popp, T.; Sayer, A.M.; Dubovik, O.; Garay, M.J.; Heckel, A.; Hsu, N.C.; Jethva, H.; Kahn, R.A.; Kolmonen, P.; et al. Merging regional and global aerosol optical depth records from major available satellite products. Atmos. Chem. Phys. 2020, 20, 2031–2056. [Google Scholar] [CrossRef] [Green Version]
  17. Tong, Y.; Feng, L.; Sun, K.; Tang, J. Assessment of the Representativeness of MODIS Aerosol Optical Depth Products at Different Temporal Scales Using Global AERONET Measurements. Remote Sens. 2020, 12, 2330. [Google Scholar] [CrossRef]
  18. Horowitz, H.M.; Garland, R.M.; Thatcher, M.; Landman, W.A.; Dedekind, Z.; van der Merwe, J.; Engelbrecht, F.A. Evaluation of climate model aerosol seasonal and spatial variability over Africa using AERONET. Atmos. Chem. Phys. 2017, 17, 13999–14023. [Google Scholar] [CrossRef] [Green Version]
  19. Fei, K.-C.; Wu, L.; Zeng, Q.-C. Aerosol Optical Depth and Burden From Large Sea Salt Particles. J. Geophys. Res. Atmos. 2019, 124, 1680–1696. [Google Scholar] [CrossRef]
  20. Collins, W.D.; Rasch, P.J.; Eaton, B.E.; Fillmore, D.W.; Kiehl, J.T.; Beck, C.T.; Zender, C.S. Simulation of aerosol distributions and radiative forcing for INDOEX: Regional climate impacts. J. Geophys. Res. Atmos. 2002, 107, 8028. [Google Scholar] [CrossRef]
  21. Pant, V.; Deshpande, C.; Kamra, A. The concentration and number size distribution measurements of the Marine Boundary Layer aerosols over the Indian Ocean. Atmos. Res. 2009, 92, 381–393. [Google Scholar] [CrossRef]
  22. Lawrence, M.G.; Lelieveld, J. Atmospheric pollutant outflow from southern Asia: A review. Atmos. Chem. Phys. 2010, 10, 11017–11096. [Google Scholar] [CrossRef] [Green Version]
  23. Annegarn, H.; Otter, L.; Swap, R.; Scholes, R. Southern Africa’s ecosystem in a test-tube-A perspective on the Southern African Regional Science Initiative (SAFARI 2000), S. Afr. J. Sci. 2002, 98, 111–113. [Google Scholar]
  24. Flamant, C.; Gaetani, M.; Chaboureau, J.-P.; Chazette, P.; Cuesta, J.; Piketh, S.J.; Formenti, P. Smoke in the river: An Aerosols, Radiation and Clouds in southern Africa (AEROCLO-sA) case study. Atmos. Chem. Phys. 2022, 22, 5701–5724. [Google Scholar] [CrossRef]
  25. Baray, J.-L.; Leveau, J.; Baldy, S.; Jouzel, J.; Keckhut, P.; Bergametti, G.; Ancellet, G.; Bencherif, H.; Cadet, B.; Carleer, M.; et al. An instrumented station for the survey of ozone and climate change in the southern tropics: Scientific motivation, technical description and future plans. J. Environ. Monit. 2006, 8, 1020–1028. [Google Scholar] [CrossRef] [Green Version]
  26. Baray, J.-L.; Courcoux, Y.; Keckhut, P.; Portafaix, T.; Tulet, P.; Cammas, J.-P.; Hauchecorne, A.; Godin-Beekmann, S.; De Mazière, M.; Hermans, C.; et al. Maïdo observatory: A new high-altitude station facility at Reunion Island (21° S, 55° E) for long-term atmospheric remote sensing and in situ measurements. Atmos. Meas. Tech. 2013, 6, 2865–2877. [Google Scholar] [CrossRef] [Green Version]
  27. Van der Werf, G.R.; Randerson, J.T.; Giglio, L.; van Leeuwen, T.T.; Chen, Y.; Rogers, B.M.; Mu, M.; van Marle, M.J.E.; Morton, D.C.; Collatz, G.J.; et al. Global fire emissions estimates during 1997–2016. Earth Syst. Sci. Data 2017, 9, 697–720. [Google Scholar] [CrossRef] [Green Version]
  28. Randriambelo, T.; Baray, J.-L.; Baldy, S. The effect of biomass burning, convective venting, and transport on tropospheric O3 over the Indian ocean: Reunion Island field observations, J. Geophys. Res. 2000, 105, 11813–11832. [Google Scholar] [CrossRef]
  29. Clain, G.; Baray, J.L.; Delmas, R.; Diab, R.; Leclair de Bellevue, J.; Keckhut, P.; Posny, F.; Metzger, J.M.; Cammas, J.P. Tropospheric O3 climatology at two Southern Hemisphere tropical/subtropical sites, (Reunion Island and Irene, South Africa) from ozonesondes, LIDAR, and in situ aircraft measurements. Atmos. Chem. Phys. 2009, 9, 1723–1734. [Google Scholar] [CrossRef] [Green Version]
  30. Senten, C.; De Mazière, M.; Dils, B.; Hermans, C.; Kruglanski, M.; Neefs, E.; Scolas, F.; Vandaele, A.C.; Vanhaelewyn, G.; Vigouroux, C.; et al. Technical Note: New ground-based FTIR measurements at Ile de La Réunion: Observations, error analysis, and comparisons with independent data. Atmos. Chem. Phys. 2008, 8, 3483–3508. [Google Scholar] [CrossRef] [Green Version]
  31. Vigouroux, C.; Hendrick, F.; Stavrakou, T.; Dils, B.; De Smedt, I.; Hermans, C.; Merlaud, A.; Scolas, F.; Senten, C.; Vanhaelewyn, G.; et al. Ground-based FTIR and MAX-DOAS observations of formaldehyde at Réunion Island and comparisons with satellite and model data. Atmos. Chem. Phys. 2009, 9, 9523–9544. [Google Scholar] [CrossRef] [Green Version]
  32. Vigouroux, C.; Stavrakou, T.; Whaley, C.; Dils, B.; Duflot, V.; Hermans, C.; Kumps, N.; Metzger, J.-M.; Scolas, F.; Vanhaelewyn, G.; et al. FTIR time-series of biomass burning products (HCN, C2H6, C2H2, CH3OH, and HCOOH) at Reunion Island (21° S, 55° E) and comparisons with model data. Atmos. Chem. Phys. 2012, 12, 10367–10385. [Google Scholar] [CrossRef]
  33. Duflot, V.; Baray, J.-L.; Payen, G.; Marquestaut, N.; Posny, F.; Metzger, J.-M.; Langerock, B.; Vigouroux, C.; Hadji-Lazaro, J.; Portafaix, T.; et al. Tropospheric ozone profiles by DIAL at Maïdo Observatory (Reunion Island): System description, instrumental performance and result comparison with ozone external data set. Atmos. Meas. Tech. 2017, 10, 3359–3373. [Google Scholar] [CrossRef] [Green Version]
  34. Zhou, M.; Langerock, B.; Vigouroux, C.; Sha, M.K.; Ramonet, M.; Delmotte, M.; Mahieu, E.; Bader, W.; Hermans, C.; Kumps, N.; et al. Atmospheric CO and CH4 time series and seasonal variations on Reunion Island from ground-based in situ and FTIR (NDACC and TCCON) measurements. Atmos. Chem. Phys. 2018, 18, 13881–13901. [Google Scholar] [CrossRef] [Green Version]
  35. Verreyken, B.; Amelynck, C.; Brioude, J.; Müller, J.-F.; Schoon, N.; Kumps, N.; Colomb, A.; Metzger, J.-M.; Lee, C.F.; Koenig, T.K.; et al. Characterisation of African biomass burning plumes and impacts on the atmospheric composition over the south-west Indian Ocean. Atmos. Chem. Phys. 2020, 20, 14821–14845. [Google Scholar] [CrossRef]
  36. Holben, B.N.; Eck, T.F.; Slutsker, I.; Tanré, D.; Buis, J.P.; Setzer, A.; Vermote, E.; Reagan, J.A.; Kaufman, Y.J.; Nakajima, T.; et al. AERONET—A federated instrument network and data archive for aerosol characterisation. Remote Sens. Environ. 1998, 66, 1–16. [Google Scholar] [CrossRef]
  37. Giles, D.M.; Sinyuk, A.; Sorokin, M.G.; Schafer, J.S.; Smirnov, A.; Slutsker, I.; Eck, T.F.; Holben, B.N.; Lewis, J.R.; Campbell, J.R.; et al. Advancements in the Aerosol Robotic Network (AERONET) Version 3 database—automated near-real-time quality control algorithm with improved cloud screening for Sun photometer aerosol optical depth (AOD) measurements. Atmos. Meas. Tech. 2019, 12, 169–209. [Google Scholar] [CrossRef] [Green Version]
  38. Smirnov, A.; Holben, B.; Eck, T.; Dubovik, O.; Slutsker, I. Cloud-Screening and Quality Control Algorithms for the AERONET Database. Remote Sens. Environ. 2000, 73, 337–349. [Google Scholar] [CrossRef]
  39. Ångström, A. The parameters of atmospheric turbidity. Tellus 1964, 16, 64–75. [Google Scholar] [CrossRef] [Green Version]
  40. Eck, T.F.; Holben, B.N.; Reid, J.S.; Dubovik, O.; Smirnov, A.; O’Neill, N.T.; Slutsker, I.; Kinne, S. Wavelength dependence of the optical depth of biomass burning, urban, and desert dust aerosols. J. Geophys. Res. Atmos. 1999, 104, 31333–31349. [Google Scholar] [CrossRef]
  41. Dubovik, O.; King, M.D. A flexible inversion algorithm for retrieval of aerosol optical properties from Sun and sky radiance measurements. J. Geophys. Res. Atmos. 2000, 105, 20673–20696. [Google Scholar] [CrossRef] [Green Version]
  42. Hauchecorne, A.; Chanin, M.-L.; Keckhut, P. Climatology and trends of the middle atmospheric temperature (33–87 km) as seen by Rayleigh lidar over the south of France. J. Geophys. Res. Atmos. 1991, 96, 15297–15309. [Google Scholar] [CrossRef]
  43. Keckhut, P.; Hauchecorne, A.; Chanin, M.L. Midlatitude long-term variability of the middle atmosphere: Trends and cyclic and episodic changes. J. Geophys. Res. Atmos. 1995, 100, 18887–18897. [Google Scholar] [CrossRef]
  44. Guirlet, M.; Keckhut, P.; Godin, S.; Megie, G. Description of the long-term ozone data series obtained from different instrumental techniques at a single location: The Observatoire de Haute-Provence (43.9°N, 5.7°E). Ann. Geophys. 2000, 18, 1325–1339. [Google Scholar] [CrossRef]
  45. Logan, J.A. Trends in the vertical distribution of ozone: An analysis of ozonesonde data. J. Geophys. Res. Atmos. 1994, 99, 25553–25585. [Google Scholar] [CrossRef]
  46. Bègue, N.; Bencherif, H.; Sivakumar, V.; Kirgis, G.; Mze, N.; de Bellevue, J.L. Temperature variability and trends in the UT-LS over a subtropical site: Reunion (20.8° S, 55.5° E). Atmos. Chem. Phys. 2010, 10, 8563–8574. [Google Scholar] [CrossRef] [Green Version]
  47. Bencherif, H.; Diab, R.; Portafaix, T.; Morel, B.; Keckhut, P.; Moorgawa, A. Temperature climatology and trend estimates in the UTLS region as observed over a southern subtropical site, Durban, South Africa. Atmos. Chem. Phys. 2006, 6, 5121–5128. [Google Scholar] [CrossRef] [Green Version]
  48. Toihir, A.M.; Portafaix, T.; Sivakumar, V.; Bencherif, H.; Pazmiño, A.; Bègue, N. Variability and trend in ozone over the southern tropics and subtropics. Ann. Geophys. 2018, 36, 381–404. [Google Scholar] [CrossRef] [Green Version]
  49. Lewis, E.R.; Schwartz, S.E. Sea Salt Aerosol Production: Mechanisms, Methods, Measurements, and Models—A Critical Review; Geophysical Monograph Series 2004; Wiley: Hoboken, NJ, USA, 2004. [Google Scholar]
  50. Grythe, H.; Ström, J.; Krejci, R.; Quinn, P.; Stohl, A. A review of sea-spray aerosol source functions using a large global set of sea salt aerosol concentration measurements. Atmos. Chem. Phys. 2014, 14, 1277–1297. [Google Scholar] [CrossRef] [Green Version]
  51. Naseef, T.M.; Kumar, V.S. Climatology and trends of the Indian Ocean surface waves based on 39-year long ERA5 reanalysis data. Int. J. Clim. 2019, 40, 979–1006. [Google Scholar] [CrossRef]
  52. Bovalo, C.; Barthe, C.; Bègue, N. A lightning climatology of the South-West Indian Ocean. Nat. Hazards Earth Syst. Sci. 2012, 12, 2659–2670. [Google Scholar] [CrossRef] [Green Version]
  53. Wheeler, M.C.; Hendon, H.H. An All-Season Real-Time Multivariate MJO Index: Development of an Index for Monitoring and Prediction. Mon. Weather. Rev. 2004, 132, 1917–1932. Available online: https://journals.ametsoc.org/view/journals/mwre/132/8/1520-0493_2004_132_1917_aarmmi_2.0.co_2.xml (accessed on 21 July 2022). [CrossRef]
  54. Smirnov, A.; Holben, B.N.; Kaufman, Y.J.; Dubovik, O.; Eck, T.F.; Slutsker, I.; Pietras, C.; Halthore, R.N. Optical Properties of Atmospheric Aerosol in Maritime Environments. J. Atmos. Sci. 2002, 59, 501–523. [Google Scholar] [CrossRef]
  55. Kahn, R.A.; Gaitley, B.J.; Garay, M.J.; Diner, D.J.; Eck, T.F.; Smirnov, A.; Holben, B.N. Multiangle Imaging SpectroRadiometer global aerosol product assessment by comparison with the Aerosol Robotic Network. J. Geophys. Res. Atmos. 2010, 115, D23209. [Google Scholar] [CrossRef]
  56. Queface, A.J.; Piketh, S.; Annegarn, H.J.; Uthui, R.J.; Holben, B.N. Retrieval of aerosol optical thickness and size distribution from the CIMEL Sun photometer over Inhaca Island, Mozambique. J. Geophys. Res. Atmos. 2003, 108, 2374. [Google Scholar] [CrossRef]
  57. Kaufman, Y.J.; Tanré, D.; Boucher, O. A Satellite View of Aerosols in the Climate System. Nature 2002, 419, 215–223. [Google Scholar] [CrossRef]
  58. Alizadeh-Choobari, O.; Sturman, A.; Zawar-Reza, P.; Alizadeh-Choobari, O.; Sturman, A.; Zawar-Reza, P. A global satellite view of the seasonal distribution of mineral dust and its correlation with atmospheric circulation. Dyn. Atmos. Ocean. 2014, 68, 20–34. [Google Scholar] [CrossRef]
  59. Tulet, P.; Di Muro, A.; Colomb, A.; Denjean, C.; Duflot, V.; Arellano, S.; Foucart, B.; Brioude, J.; Sellegri, K.; Peltier, A.; et al. First results of the Piton de la Fournaise STRAP 2015 experiment: Multidisciplinary tracking of a volcanic gas and aerosol plume. Atmos. Chem. Phys. 2017, 17, 5355–5378. [Google Scholar] [CrossRef] [Green Version]
  60. Bègue, N.; Vignelles, D.; Berthet, G.; Portafaix, T.; Payen, G.; Jégou, F.; Benchérif, H.; Jumelet, J.; Vernier, J.-P.; Lurton, T.; et al. Long-range transport of stratospheric aerosols in the Southern Hemisphere following the 2015 Calbuco eruption. Atmos. Chem. Phys. 2017, 17, 15019–15036. [Google Scholar] [CrossRef] [Green Version]
  61. Taylor, I.A.; Preston, J.; Carboni, E.; Mather, T.A.; Grainger, R.G.; Theys, N.; Hidalgo, S.; Kilbride, B.M. Exploring the Utility of IASI for Monitoring Volcanic SO2Emissions. J. Geophys. Res. Atmos. 2018, 123, 5588–5606. [Google Scholar] [CrossRef]
  62. Liu, T.; Mickley L j Marlierc, M.E.; DeFriesd, R.D.; Khane, F.M.; Latiff, M.T.; Karambelasg, A. Diagnosing spatial biases and uncertainties in global fire emissions inventories: Indonesia as regional case study. Remote Sens. Environ. 2020, 237, 111557. [Google Scholar] [CrossRef]
  63. Weng, H.; Lin, J.; Martin, R.; Millet, D.B.; Jaeglé, L.; Ridley, D.; Keller, C.; Li, C.; Du, M.; Meng, J. Global high-resolution emissions of soil NOx, sea salt aerosols, and biogenic volatile organic compounds. Sci. Data 2020, 7, 148. [Google Scholar] [CrossRef] [PubMed]
  64. Abram, N.J.; Gagan, M.K.; McCulloch, M.T.; Chappell, J.; Hantoro, W.S. Coral Reef Death During the 1997 Indian Ocean Dipole Linked to Indonesian Wildfires. Science 2003, 301, 952–955. [Google Scholar] [CrossRef] [PubMed]
  65. Andela, N.; Van Der Werf, G.R. Recent trends in African fires driven by cropland expansion and El Niño to La Niña transition. Nat. Clim. Chang. 2014, 4, 791–795. [Google Scholar] [CrossRef]
  66. Wang, B.; Chen, G.; Liu, F. Diversity of the Madden-Julian Oscillation. Sci. Adv. 2019, 5, eaax0220. [Google Scholar] [CrossRef] [PubMed] [Green Version]
  67. Gray, L.J.; Anstey, J.A.; Kawatani, Y.; Lu, H.; Osprey, S.; Schenzinger, V. Surface impacts of the Quasi Biennial Oscillation. Atmos. Chem. Phys. 2018, 18, 8227–8247. [Google Scholar] [CrossRef] [Green Version]
  68. Huang, Z.; Zhang, W.; Liu, C.; Stuecker, M.F. Extreme Indian Ocean dipole events associated with El Niño and Madden–Julian oscillation. Clim. Dyn. 2022, 6, 1–16. [Google Scholar] [CrossRef]
  69. Stohl, A.; Sodemann, H.; Eckhardt, S.; Frank, A.; Seibert, P.; Wotawa, G. The Lagrangian particle dispersion model flexpart version 8.2. 2015. Available online: https://www.flexpart.eu/wiki/FpDocumentation (accessed on 29 September 2022).
  70. Earl, N.; Simmonds, I. Spatial and temporal variability and trends in 2001–2016 global fire activity. J. Geophys. Res.-Atmos. 2018, 123, 2524–2536. [Google Scholar] [CrossRef]
  71. Gu, Y.; Liou, K.N.; Jiang, J.H.; Su, H.; Liu, X. Dust aerosol impact on North Africa climate: A GCM investigation of aerosol-cloud-radiation interactions using A-Train satellite data. Atmos. Chem. Phys. 2012, 12, 1667–1679. [Google Scholar] [CrossRef] [Green Version]
  72. Sun, T.; Che, H.; Qi, B.; Wang, Y.; Dong, Y.; Xia, X.; Wang, H.; Gui, K.; Zheng, Y.; Zhao, H.; et al. Characterization of vertical distribution and radiative forcing of ambient aerosol over the Yangtze River Delta during 2013–2015. Sci. Total Environ. 2019, 650, 1846–1857. [Google Scholar] [CrossRef]
  73. Lolli, S.; Khor, W.Y.; Matjafri, M.Z.; Lim, H.S. Monsoon Season Quantitative Assessment of Biomass Burning Clear-Sky Aerosol Radiative Effect at Surface by Ground-Based Lidar Observations in Pulau Pinang, Malaysia in 2014. Remote Sens. 2019, 11, 2660. [Google Scholar] [CrossRef] [Green Version]
  74. Ningombam, S.S.; Dumka, U.C.; Srivastava, A.; Song, H.-J. Optical and physical properties of aerosols during active fire events occurring in the Indo-Gangetic Plains: Implications for aerosol radiative forcing. Atmos. Environ. 2019, 223, 117225. [Google Scholar] [CrossRef]
  75. Soupiona, O.; Papayannis, A.; Kokkalis, P.; Foskinis, R.; Hernández, G.S.; Ortiz-Amezcua, P.; Mylonaki, M.; Papanikolaou, C.-A.; Papagiannopoulos, N.; Samaras, S.; et al. EARLINET observations of Saharan dust intrusions over the northern Mediterranean region (2014–2017): Properties and impact on radiative forcing. Atmos. Chem. Phys. 2020, 20, 15147–15166. [Google Scholar] [CrossRef]
Figure 1. Localization of La Réunion and of the measurement site in Saint-Denis (red dot).
Remotesensing 14 04945 g001
Figure 2. Climatology over the 2007–2019 period of the GFEDv4s monthly mean emitted total particulate matter from SHSA (blue line), NHAF (orange line), SHAF (red line), SEAS (purple line), EQAS (green line) and AUST (black line). Standard deviations around the means are given by the dotted lines.
Remotesensing 14 04945 g002
Figure 3. Climatology over the 2007–2019 period of the CAMS mean SSAOD550 around La Réunion. Standard deviation around the mean is given by the dotted lines.
Remotesensing 14 04945 g003
Figure 4. Total number of measurements per month used in this study (89,150 measurements).
Remotesensing 14 04945 g004
Figure 5. (upper-left panel) Measured α for March-April-May (MAM, green filled box), June-July-August (JJA, blue filled box), September-October-November (SON, black filled box), December-January-February (DJF, orange filled box) and all seasons (blue box) showing the range (whiskers, defined as median ± 3 times the standard deviation), median (red line on each box), 25th and 75th percentile (edges of each box) and outliers (red crosses); (bottom panel) Same as upper left panel for AOD440; (upper-right panel) Scatter plot of AOD440 versus α for MAM (green dots), JJA (blue dots), SON (black dots) and DJF (orange dots). Big colored dots give the mean AOD440 versus α for each season. Please note that the mean AOD440 versus α for MAM (big green dot) and JJA (big blue dot) are almost superimposed.
Remotesensing 14 04945 g005
Figure 6. Monthly climatology of AOD440 (blue) and α (red). Dotted lines give the ±1 standard deviation around the mean.
Remotesensing 14 04945 g006
Figure 7. Mean aerosol volume size distribution with respect to the related AOD440. The number of cases for each AOD440 bin is given in parentheses.
Remotesensing 14 04945 g007
Figure 8. Time evolution of monthly AOD440 values observed and simulated over La Réunion from January 2007 to December 2019 (blue stars and red circles, respectively). The black line gives the obtained AOD440 trend. The corresponding coefficient of determination is 89.2%.
Remotesensing 14 04945 g008
Figure 9. Contributions and corresponding standard deviations (in percentages) of large-scale atmospheric structures (QBO, ENSO, MJO, IOD), BB emissions and sea salts (SS) to the AOD440 variability over La Réunion (located by the red cross) as obtained by the linear regression Trend-Run model superimposed over the regular average burned area over 2003–2016 (color scale in percentage per year) from the Moderate Resolution Imaging Spectroradiometer (MODIS) surface reflectance imagery (MCD64A1) (figure adapted from [27]).
Remotesensing 14 04945 g009
Table 1. Average (±standard deviation), minimum, maximum and median (25th and 75th percentile) values for AOD440 and α for March-April-May (MAM), June-July-August (JJA), September-October-November (SON), December-January-February (DJF) and all seasons.
AOD440α
MAMJJASONDJFAllMAMJJASONDJFAll
Mean
(±std)
0.06
(±0.03)
0.07
(±0.04)
0.11
(±0.07)
0.07
(±0.03)
0.08
(±0.05)
0.58
(±0.40)
0.58
(±0.38)
0.96
(±0.37)
0.71
(±0.40)
0.71
(±0.42)
Min0.020.010.020.010.01−1.85−1.56−0.22−1.37−1.85
Max0.380.450.660.410.662.201.772.132.892.89
Median
(25th, 75th percentile)
0.05
(0.04, 0.07)
0.06
(0.04, 0.08)
0.09
(0.07, 0.13)
0.06
(0.05, 0.08)
0.06
(0.05, 0.09)
0.51
(0.28, 0.82)
0.51
(0.28, 0.84)
0.95
(0.68, 1.23)
0.66
(0.42, 0.95)
0.67
(0.39, 1.00)
Table 2. Contributions and corresponding standard deviations (in percentages) of large-scale atmospheric structures, BB emissions from the SHSA, NHAF, SHAF, SEAS, EQAS and AUST areas and sea salts to the AOD440 variability over La Réunion as obtained by the linear regression Trend-Run model, coefficient of determination R2 and resulting calculated trend.
ParametersContribution (%)
Large-scale atmospheric structures
Quasi-Biennial Oscillation (QBO)2.9 ± 0.1
El Niño Southern Oscillation (ENSO)2.1 ± 1.4
Indian Ocean Dipole (IOD)0.2 ± 0.1
Madden–Julian Oscillation (MJO)0.3 ± 0.2
Total large-scale atmospheric structures5.5 ± 1.7
Biomass burning
Southern Hemisphere South America (SHSA)19.5 ± 8.1
Northern Hemisphere Africa (NHAF)7.2 ± 5.6
Southern Hemisphere Africa (SHAF)21.7 ± 7.2
Southeast Asia (SEAS)9.8 ± 2.4
Equatorial Asia (EQAS)4.5 ± 1.6
Australia (AUST)4.7 ± 3.2
Total biomass burning67.4 ± 28.1
Sea salts
CAMS SSAOD55016.3 ± 4.2
Determination coefficient89.2
Trend (/decade)0.02 ± 0.01
Publisher’s Note: MDPI stays neutral with regard to jurisdictional claims in published maps and institutional affiliations.

