
Integrated Satellite System for Fire Detection and Prioritization

 , , , , , , ,
Abstract
:
1. Introduction
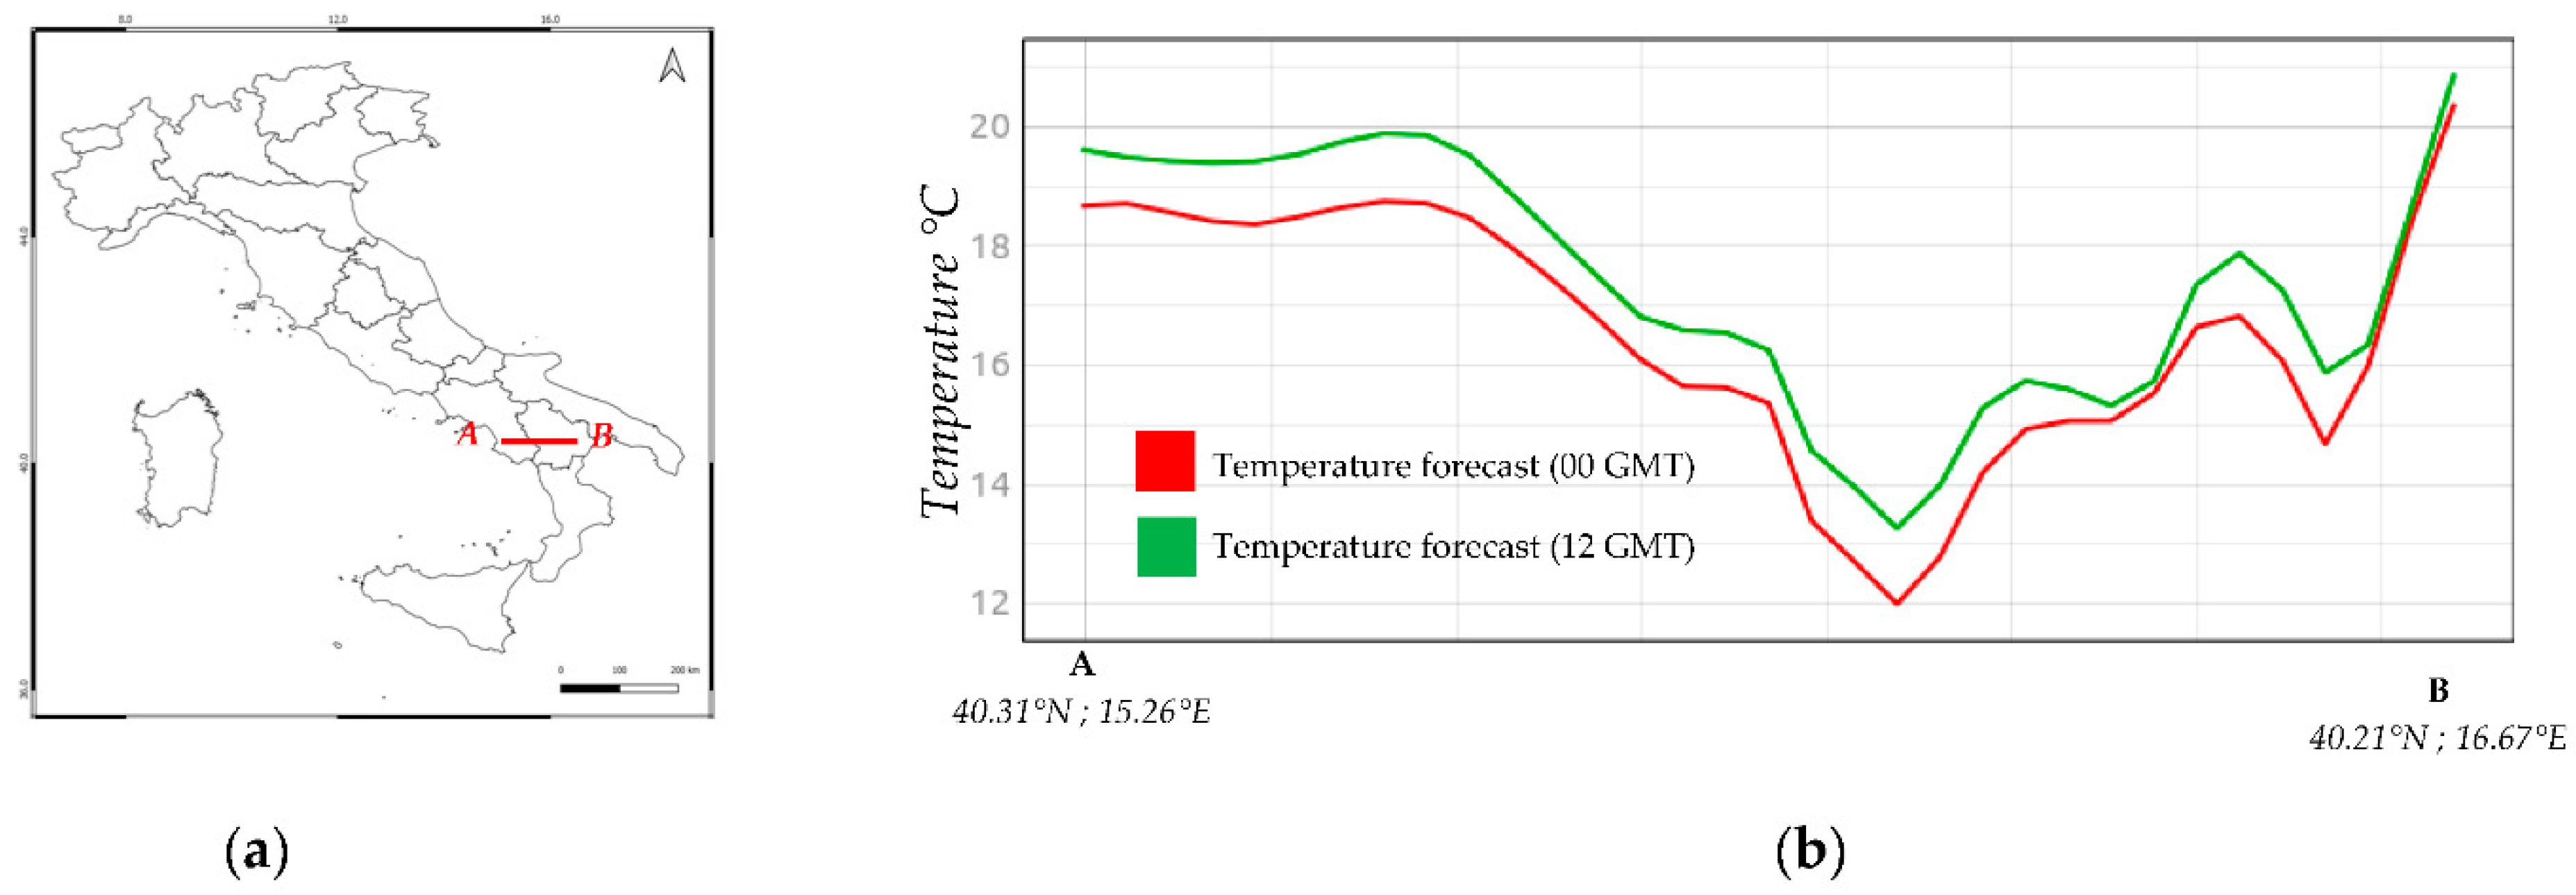
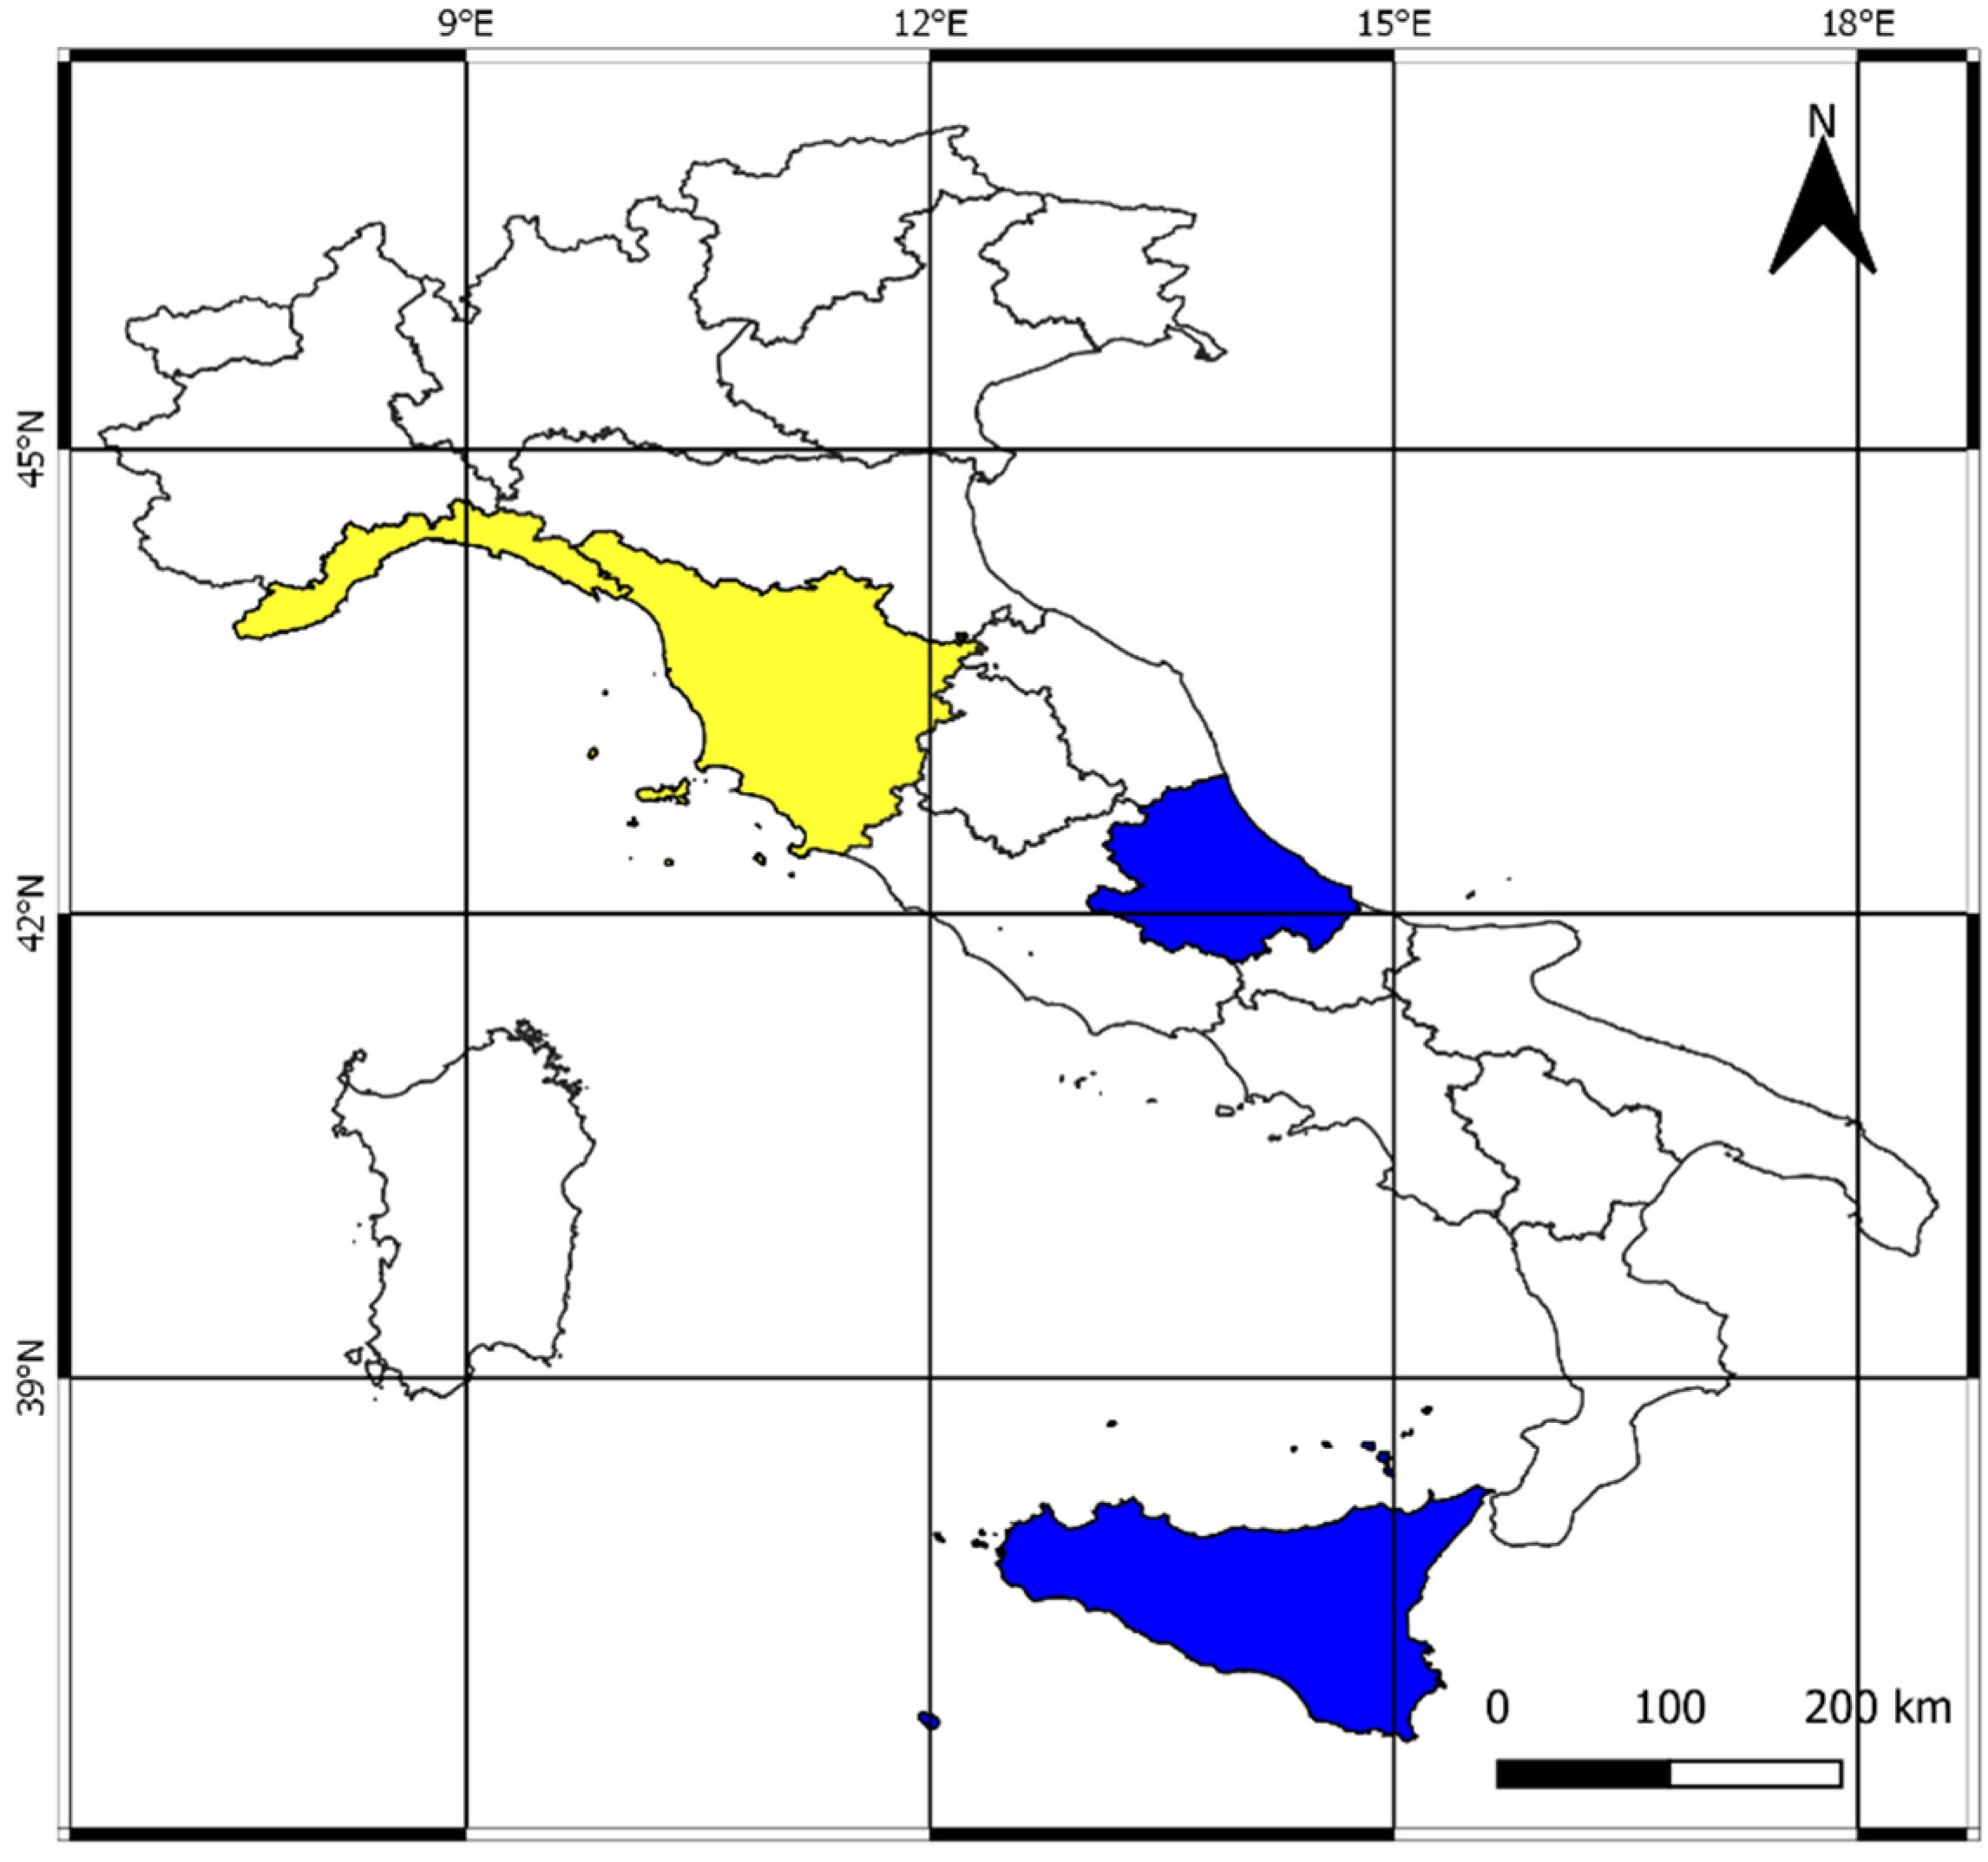
2. Study Area
3. Data and Methods
3.1. Data
3.1.1. Satellite Data and Products
3.1.2. Weather Forecast
3.1.3. Geomorphology Data
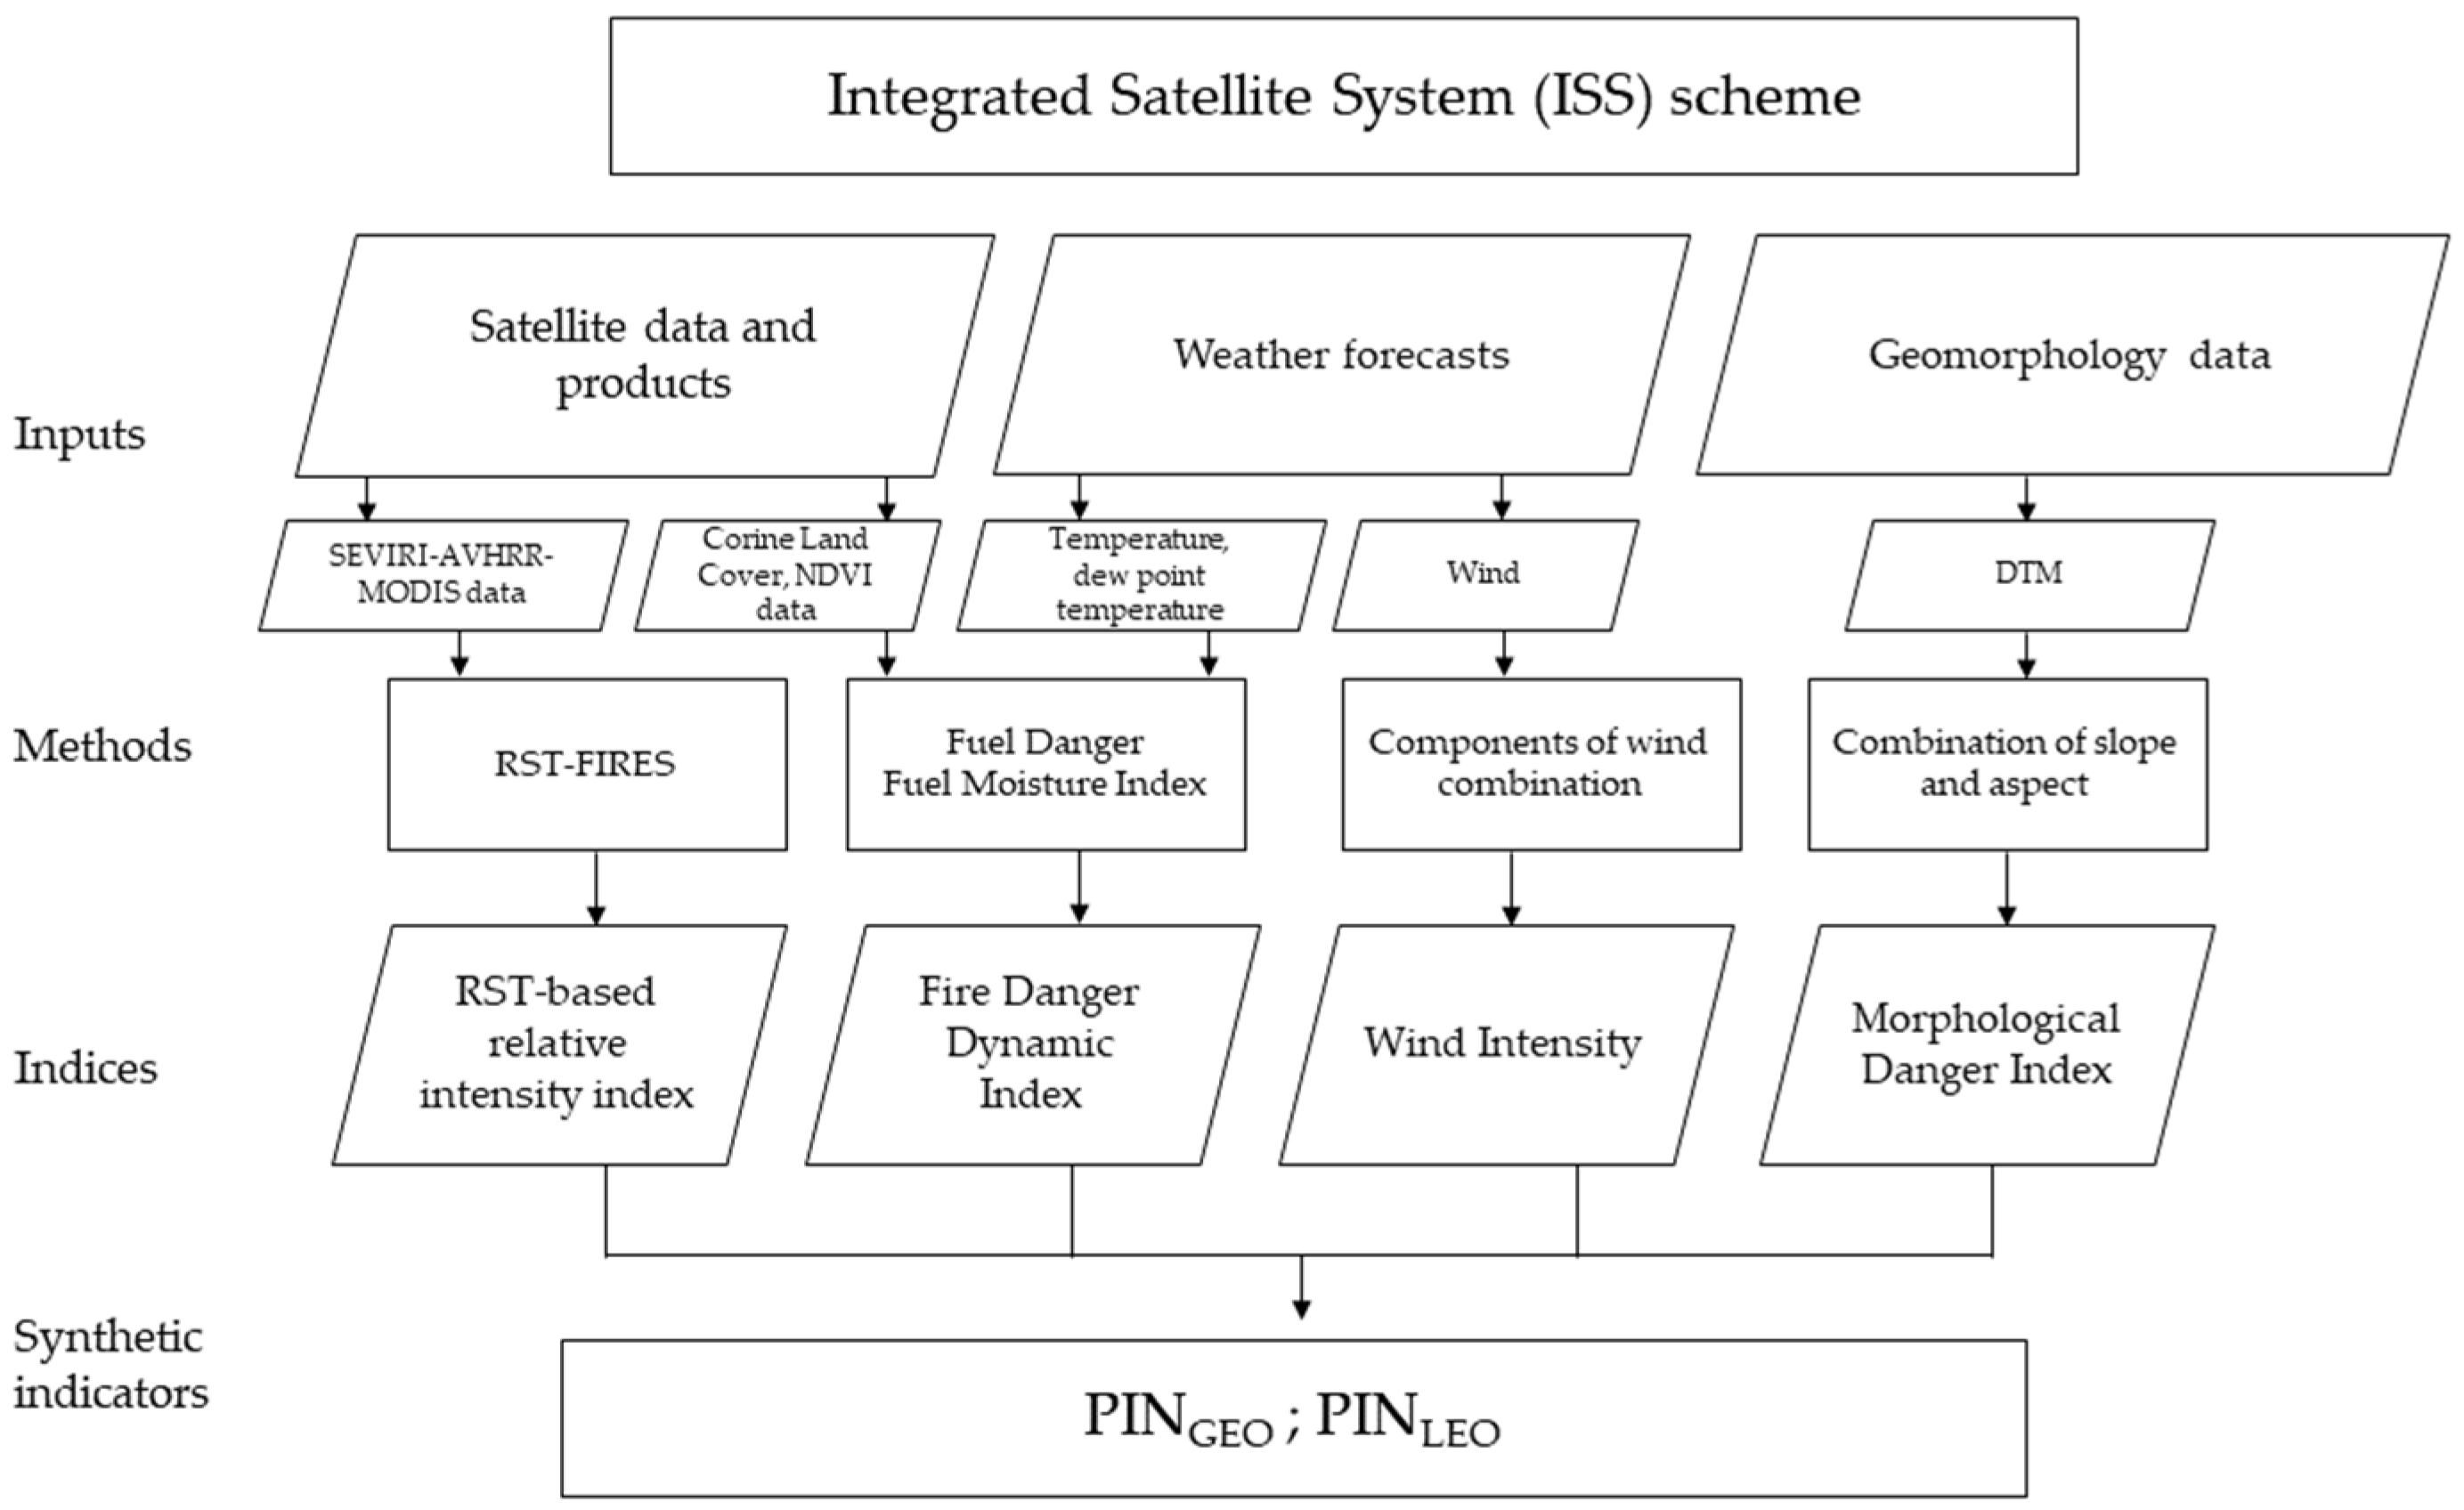
3.2. Methods Implemented and Indices Developed
3.2.1. The RST-FIRES Methodology
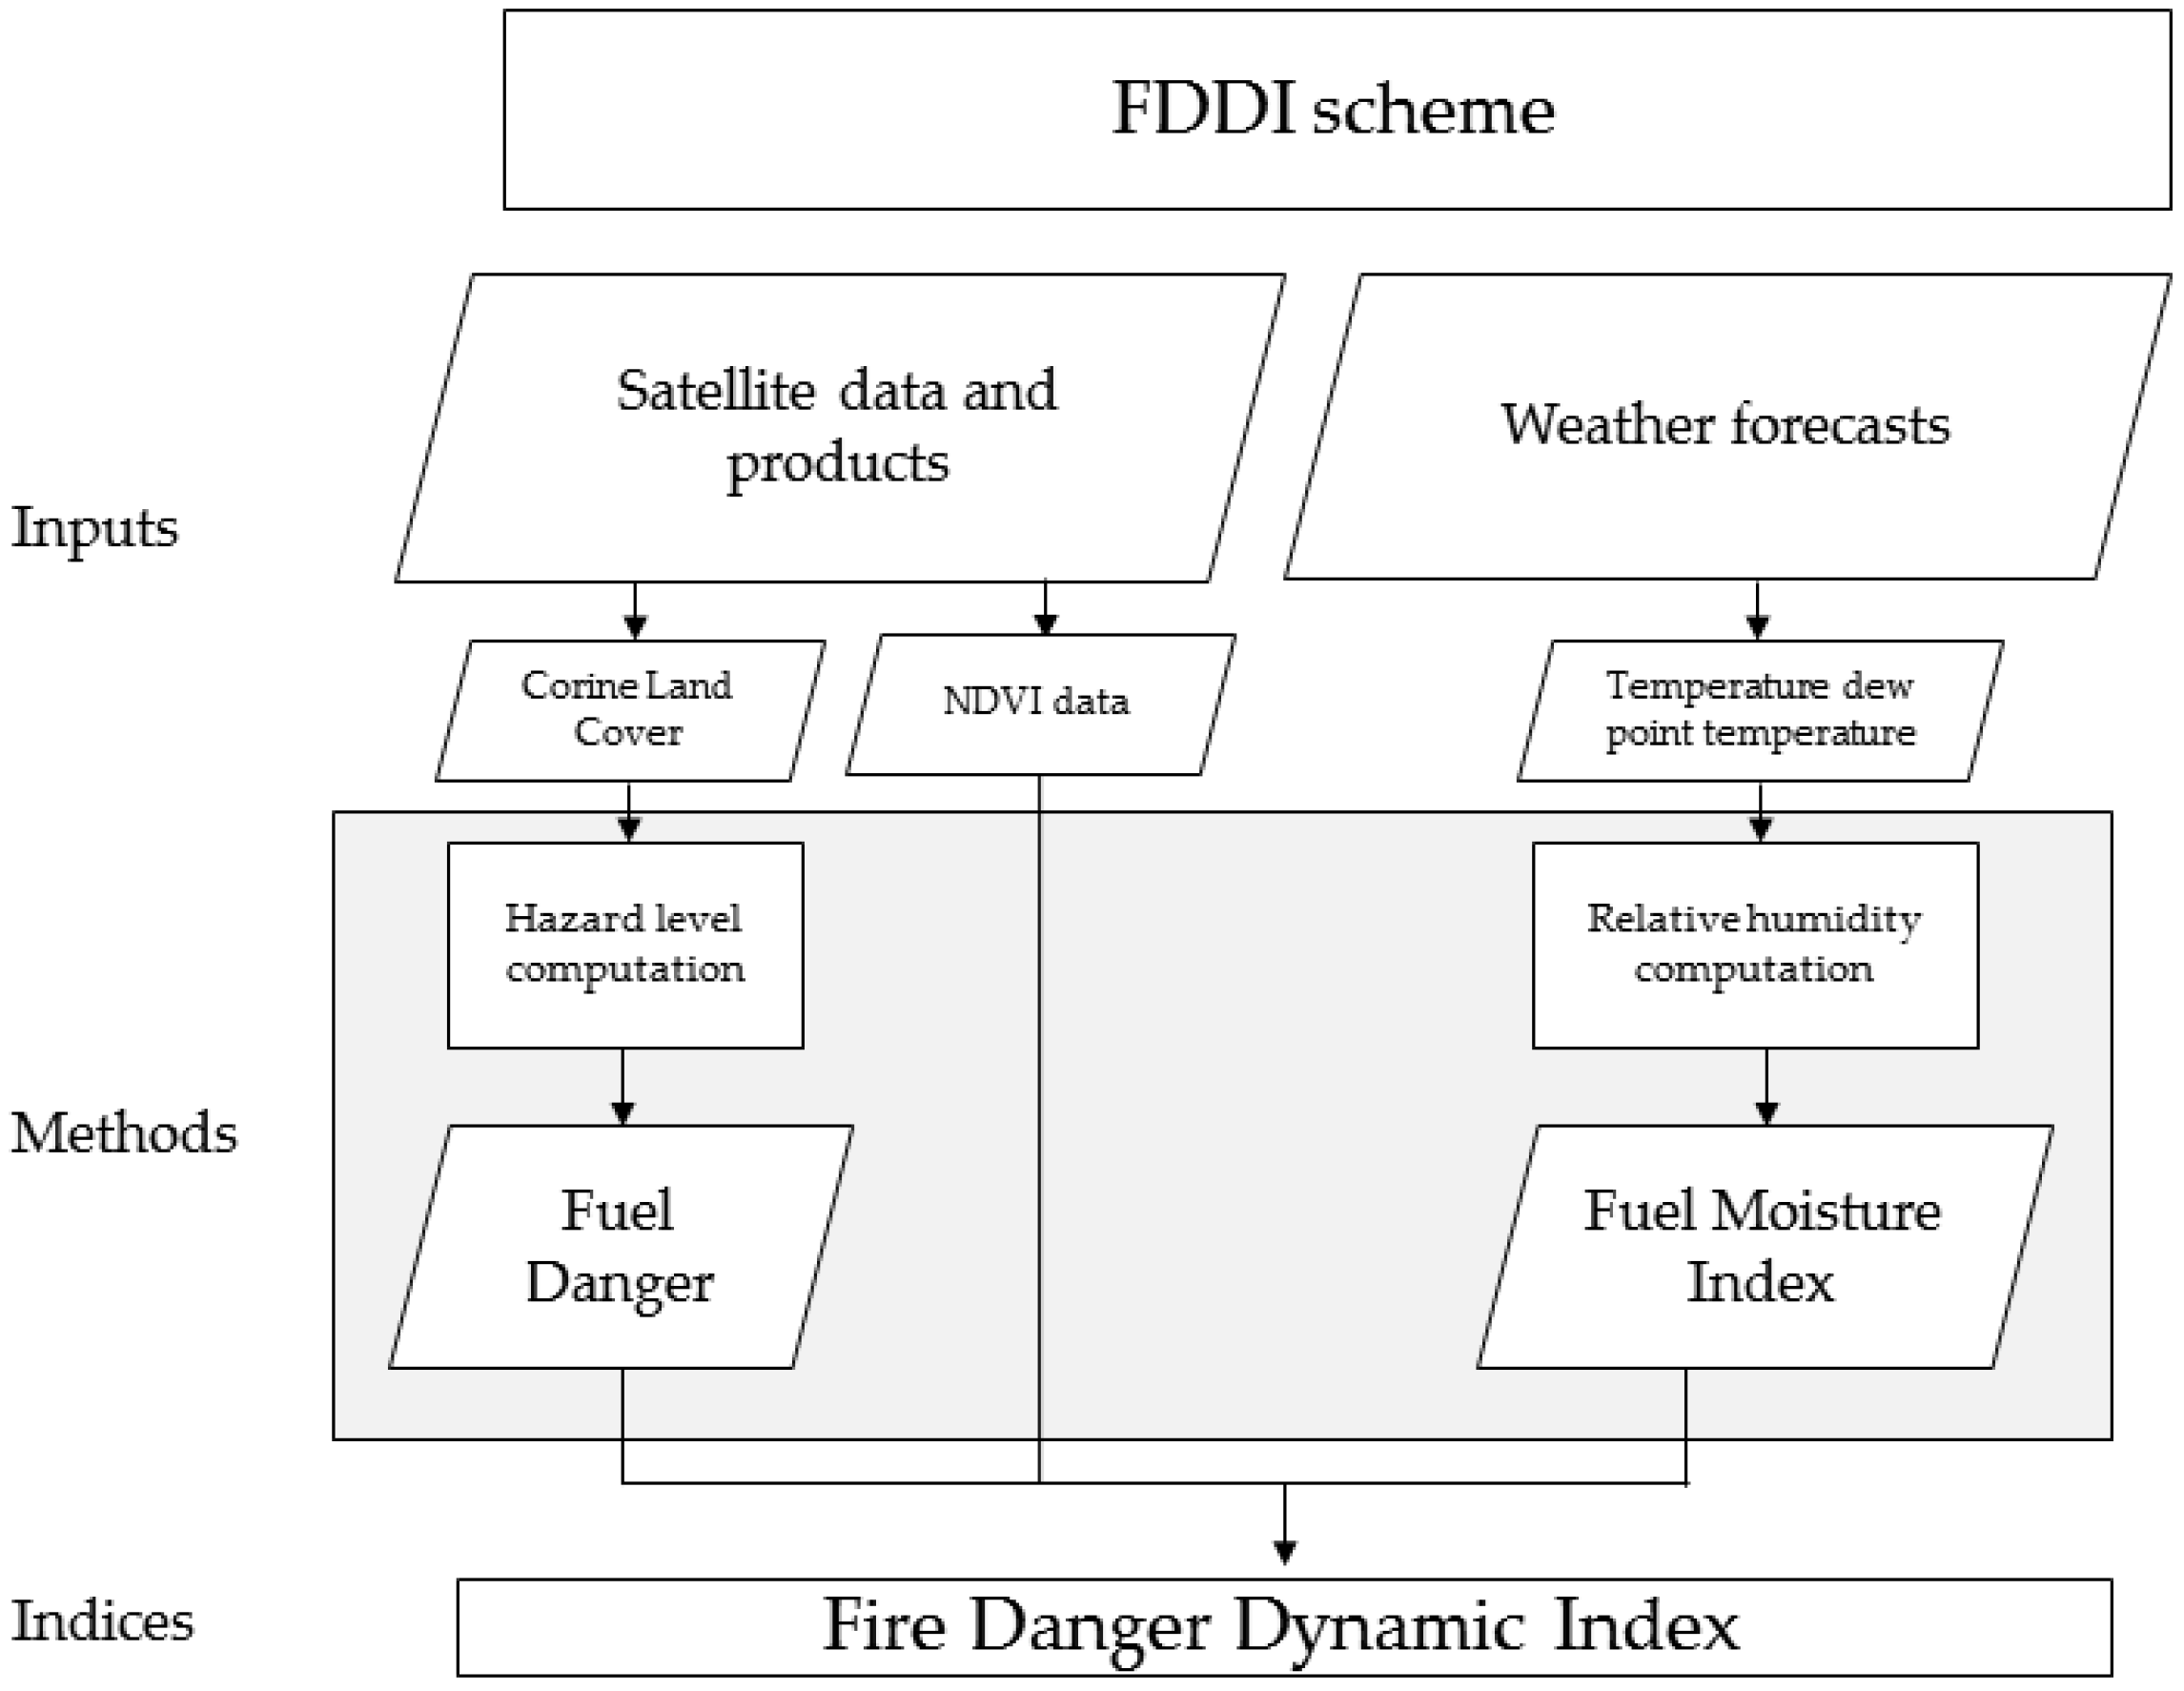
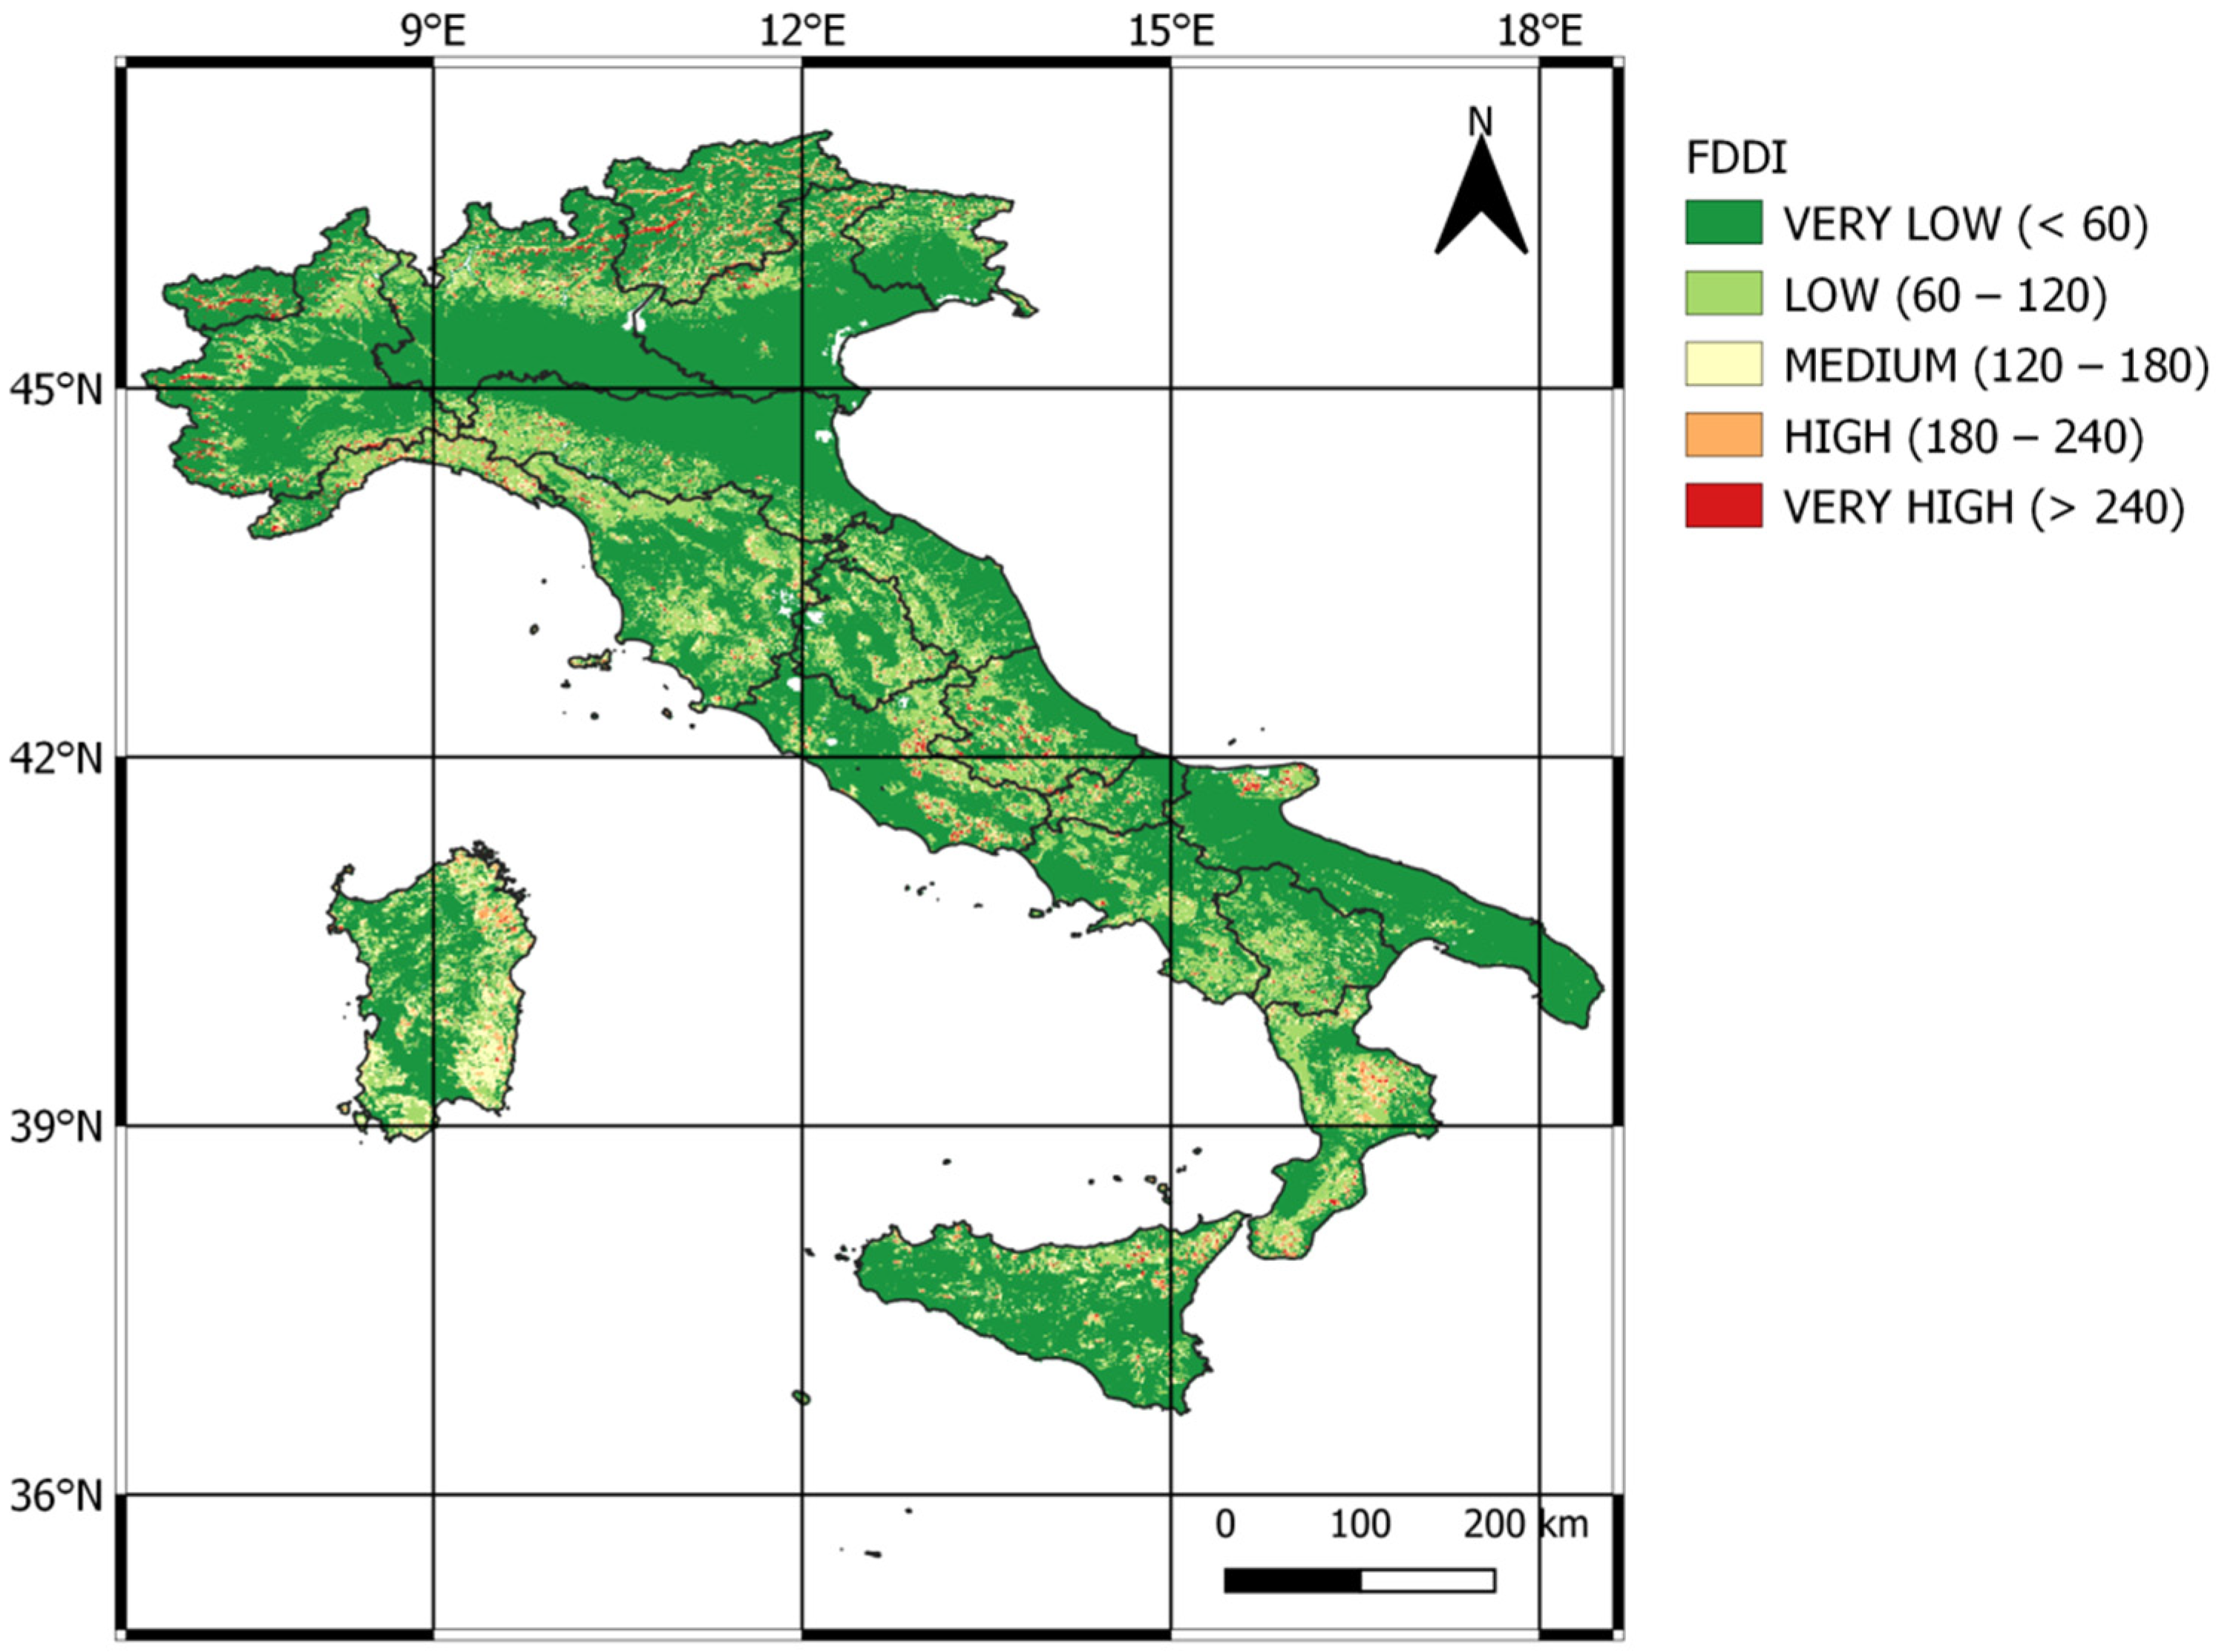
3.2.2. The Fire Danger Dynamic Index
- Fuel Moisture Index (FMI), derived from meteorological forecast data;
- NDVD index (decadal value of NDVI);
- Fuel Danger (FD).
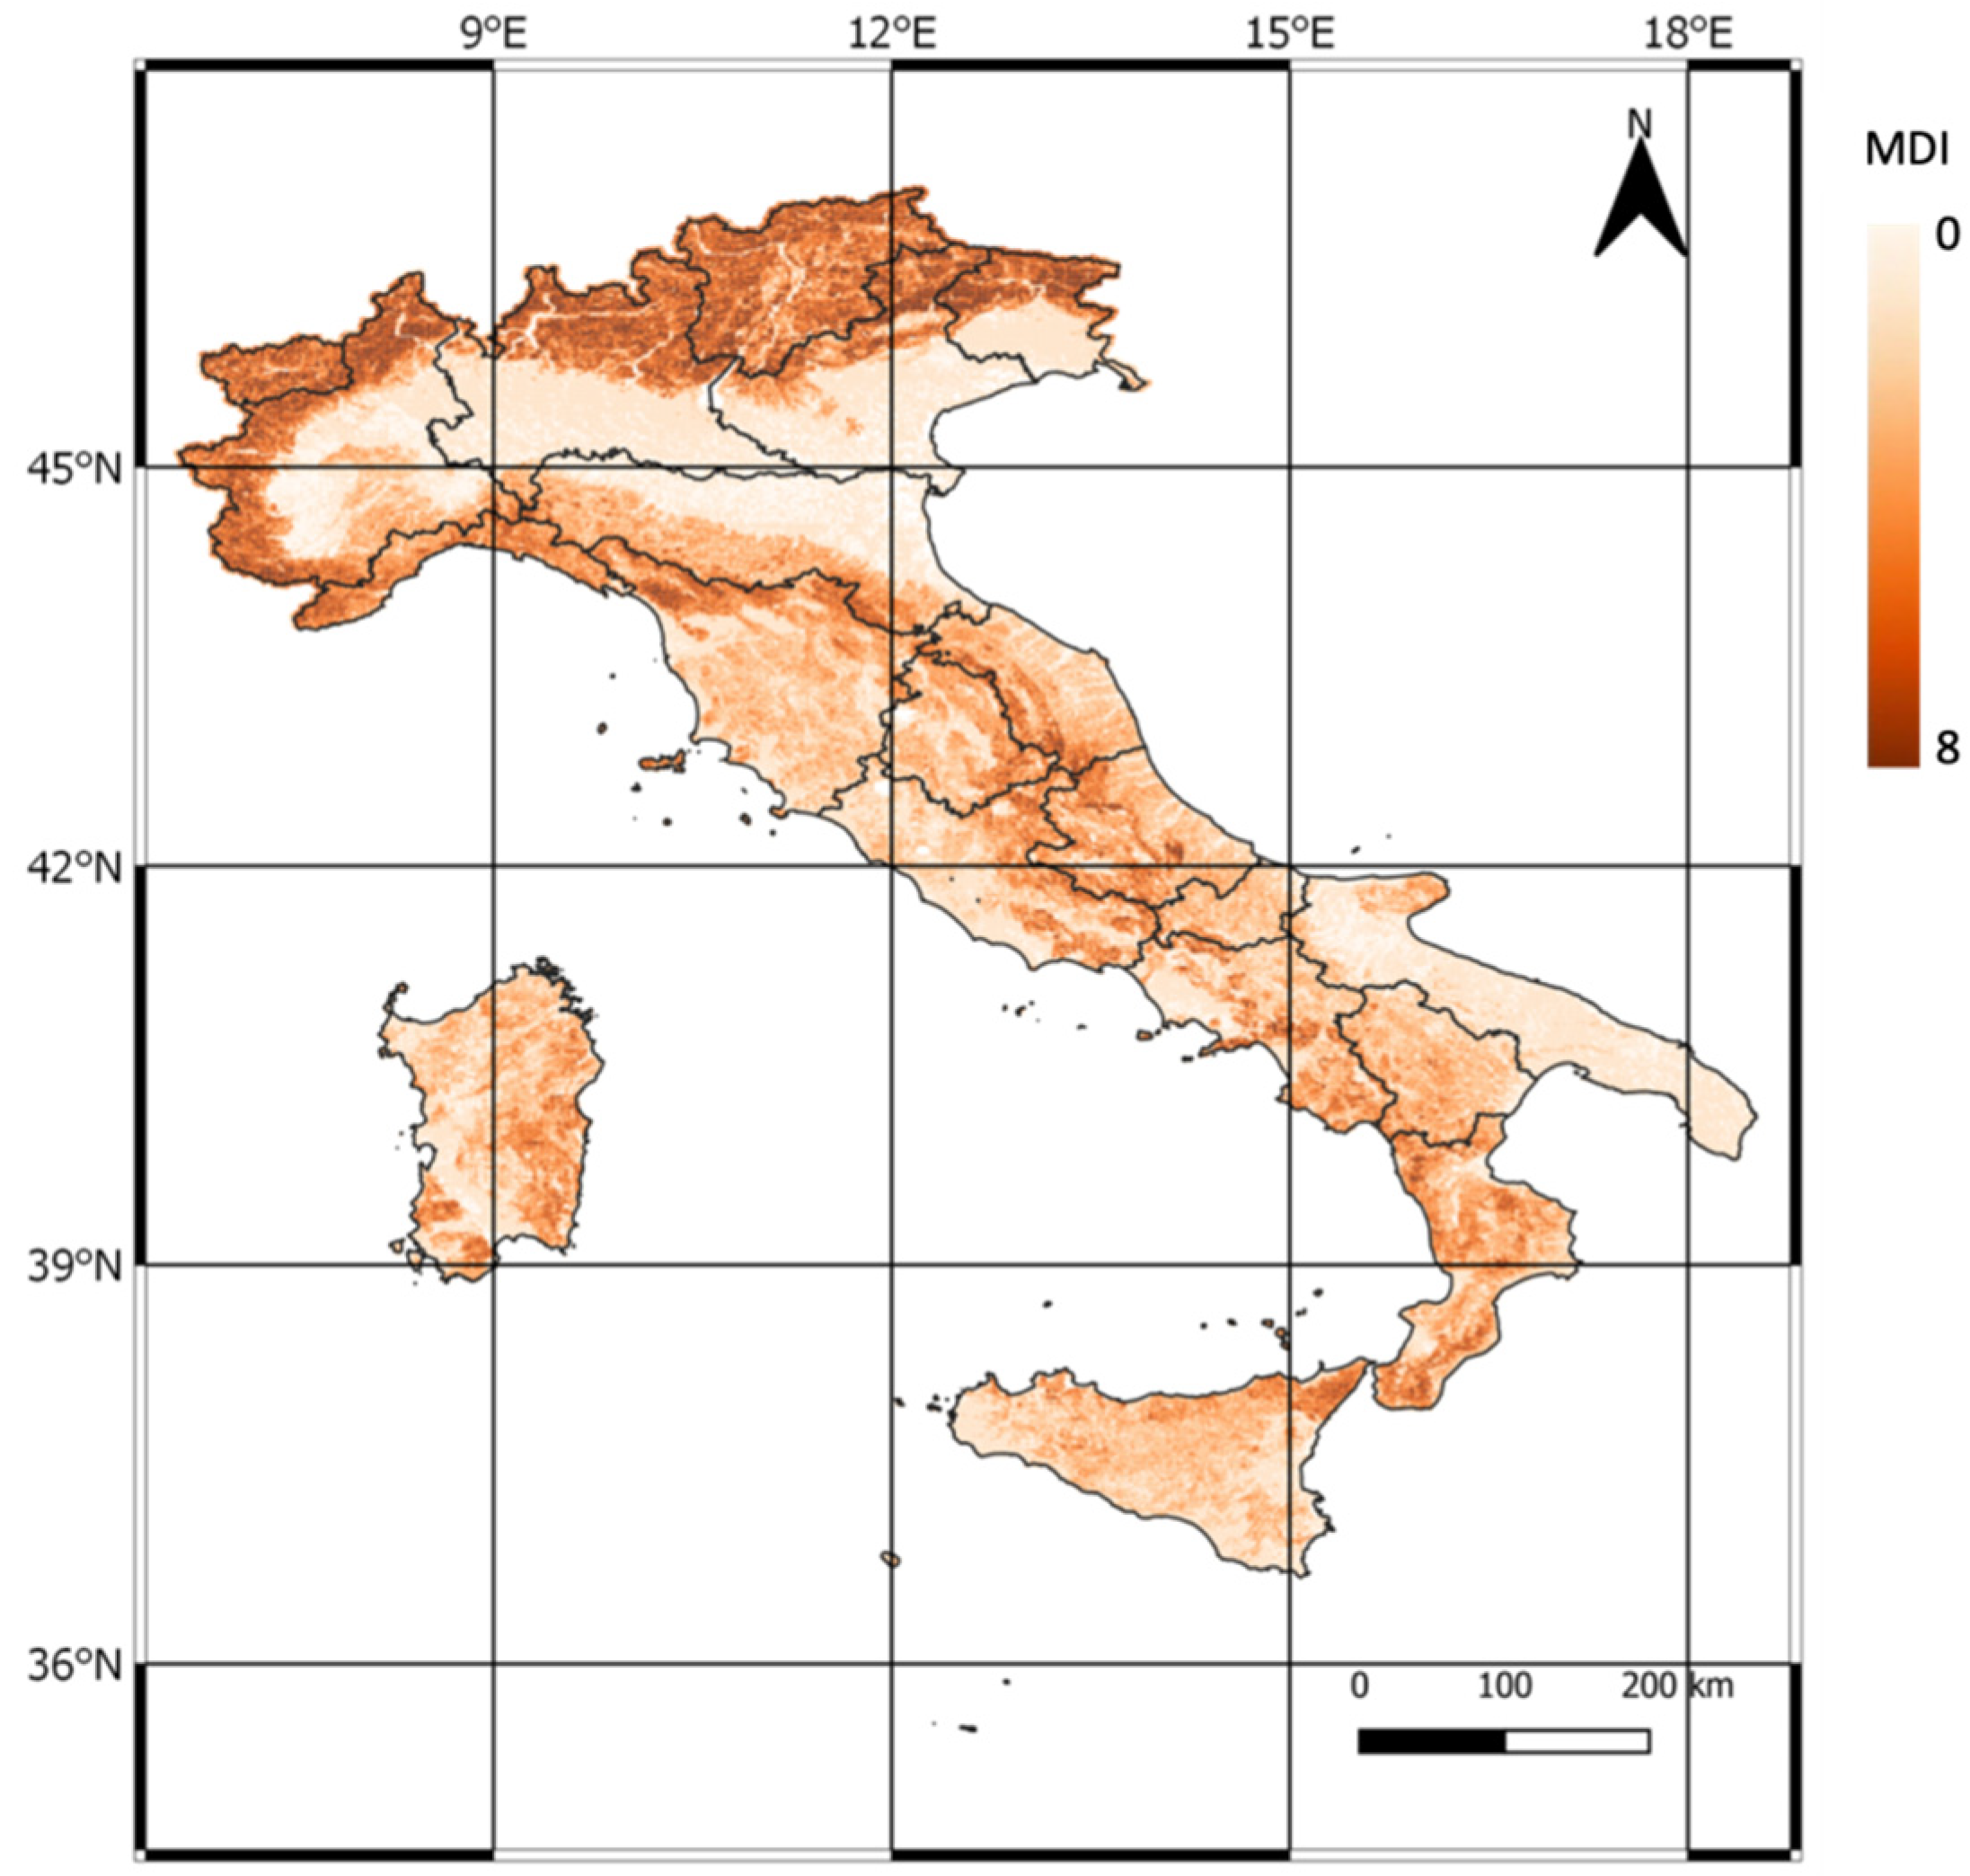
3.2.3. The Morphological Danger Index
- the slope determines an increase in the speed of propagation, and thus the danger correlated to the event. The inclination of the slopes affects the pre-heating capacity of the fuels by accelerating the combustion process and so the rate of spread of the fire;
- the slope affects the formation of an angle between the surface and the sun’s rays: the closer this is to 90°, the greater the calorific value of the sun’s rays on the ground. Experimental observations [48] estimate that under the same wind conditions, inclinations of up to about 16° increase fire speed by two times, and at inclinations of up to about 30°, by four times;
- the aspect influences the duration of exposure to the solar irradiation, the type of wind, and the temperature and humidity. SW exposures, for instance, suffer from more irradiation than others, heating up more, and thus fuels suffer from greater relative humidity losses. Consequently, the types of vegetation that are present on the slopes most exposed will be more combustible than others.
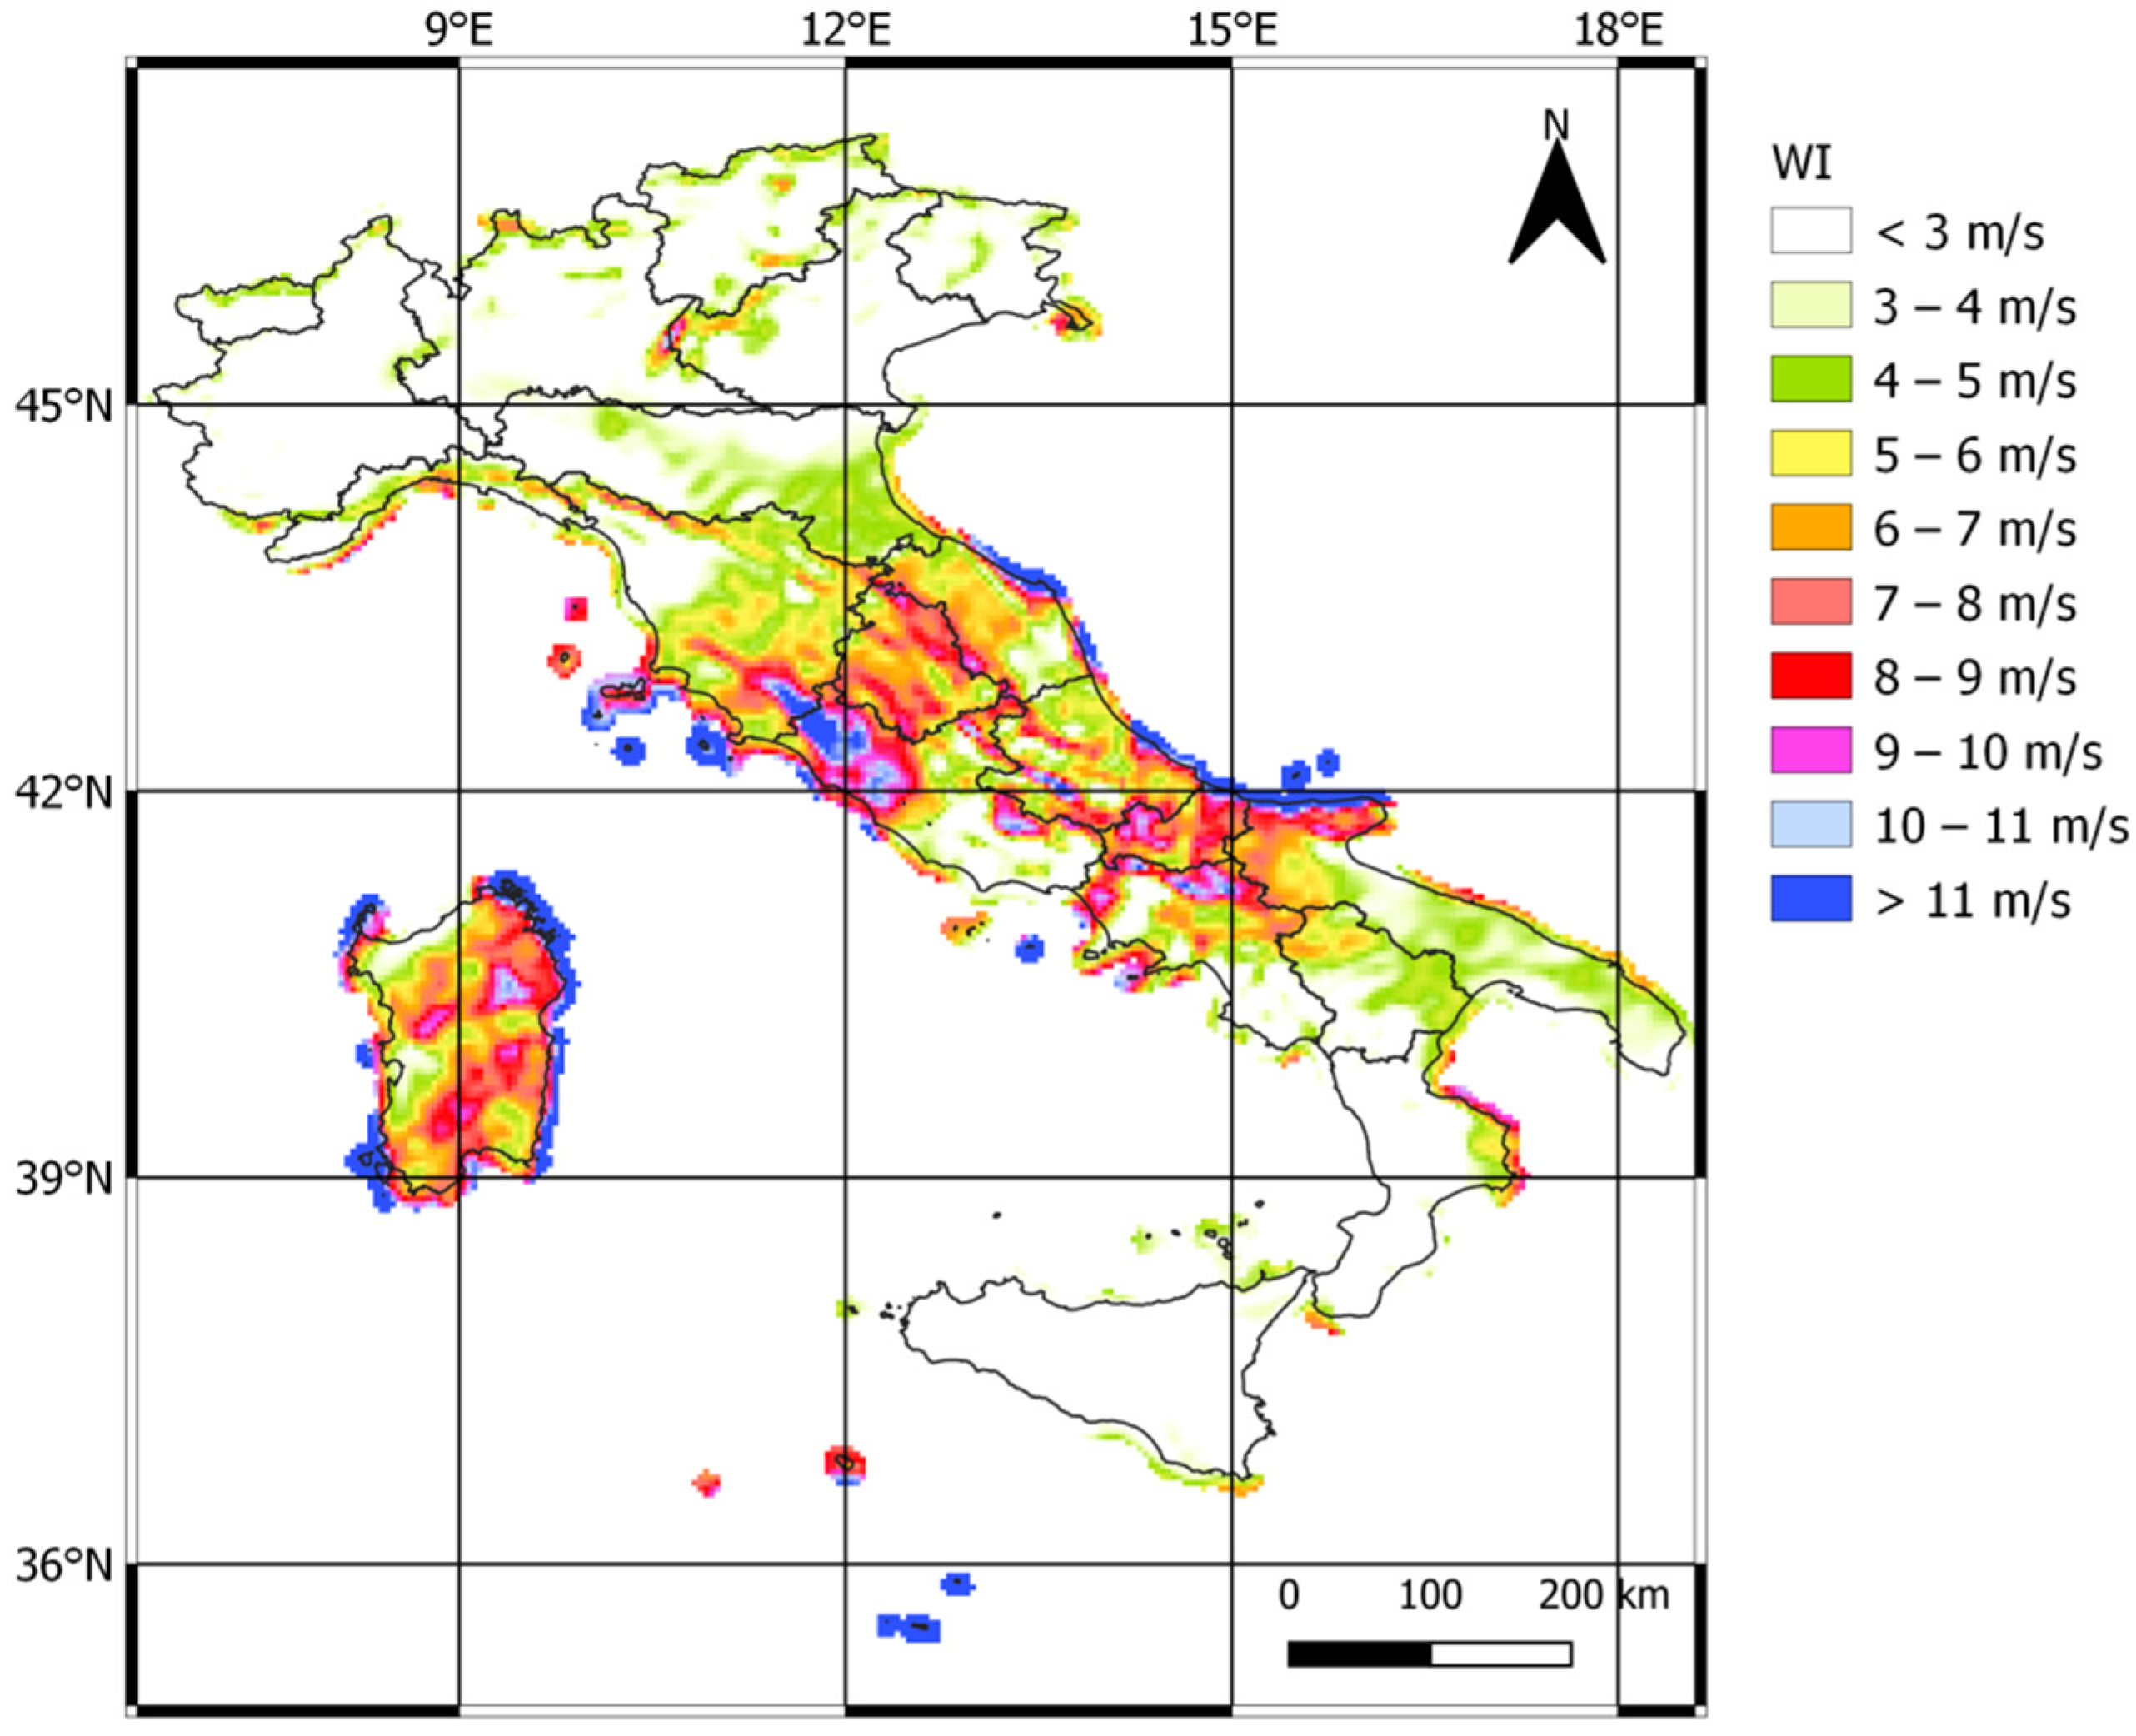
3.2.4. The Wind Intensity
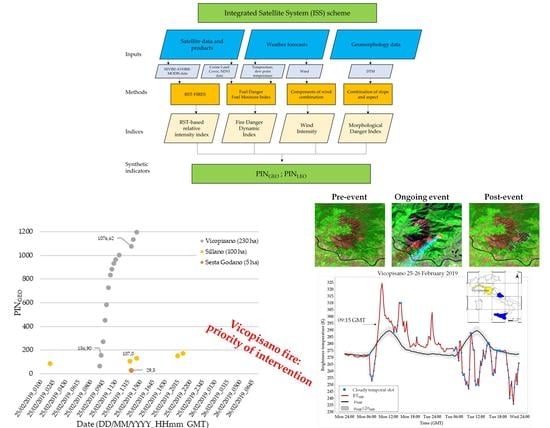
4. Synthetic Indicators
- t0 is the first time slot when thermal anomalies are detected;
- tcurr is the current time slot;
- AI is the area affected by the fire;
- kRST is a weighting factor of the ALICEMIR index;
- ALICEMIR(x,y,t) is the value of the ALICEMIR index, at time t, relating to each SEVIRI anomalous pixel of coordinates (x,y);
- kFDDI is a weighting factor of the FDDI index;
- FDDI(x,y,t) is the value of the FDDI index, at time t, relating to each SEVIRI anomalous pixel of coordinates (x,y);
- NumPT (t) is the number of time slots in which SEVIRI thermal anomalies related to the event are detected from the beginning (t0) up to time t, on the area AI;
- kPT is a weighting factor related to the temporal persistence of SEVIRI thermal anomalies on the area under observation;
- NumAnom(t) is the number of SEVIRI thermal anomalies related to the event from the beginning (t0) to t, over the area AI;
- kES is a weighting factor that accounts for the spatial extension of the thermal anomalies in the area affected by the fire.
- kMDI is a weighting factor of the MDI index;
- MDI (x,y) is the value of the MDI index for each anomalous AVHRR or MODIS pixel (x,y);
- kWI is a weighting factor of the WI index;
- WI (x,y,t) is the value of the WI index for each anomalous AVHRR or MODIS pixel (x,y), at time t.
5. Results
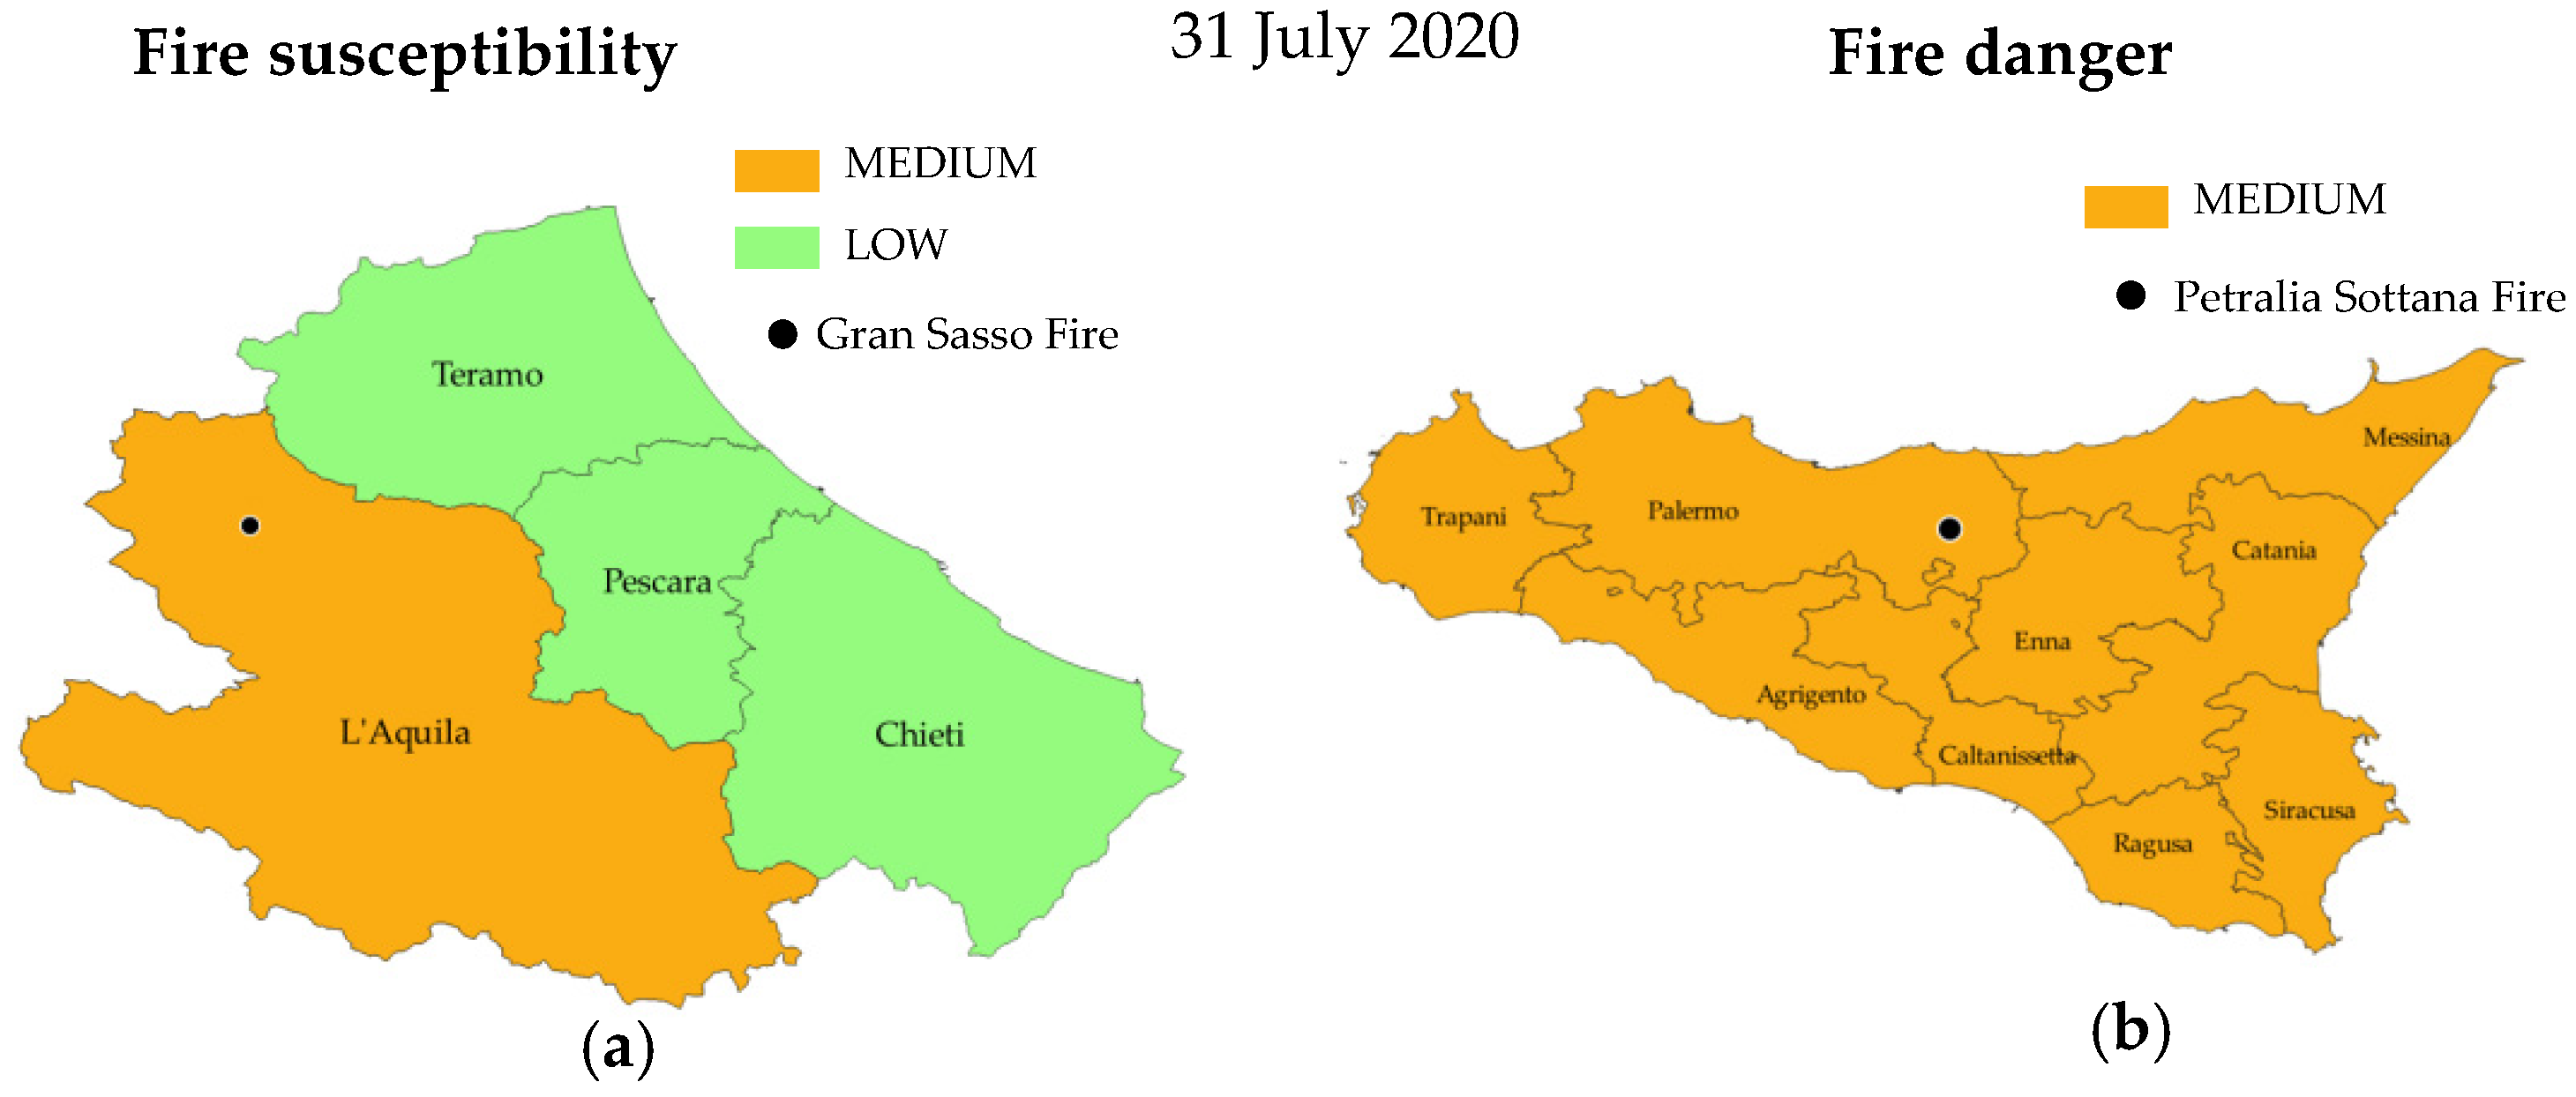
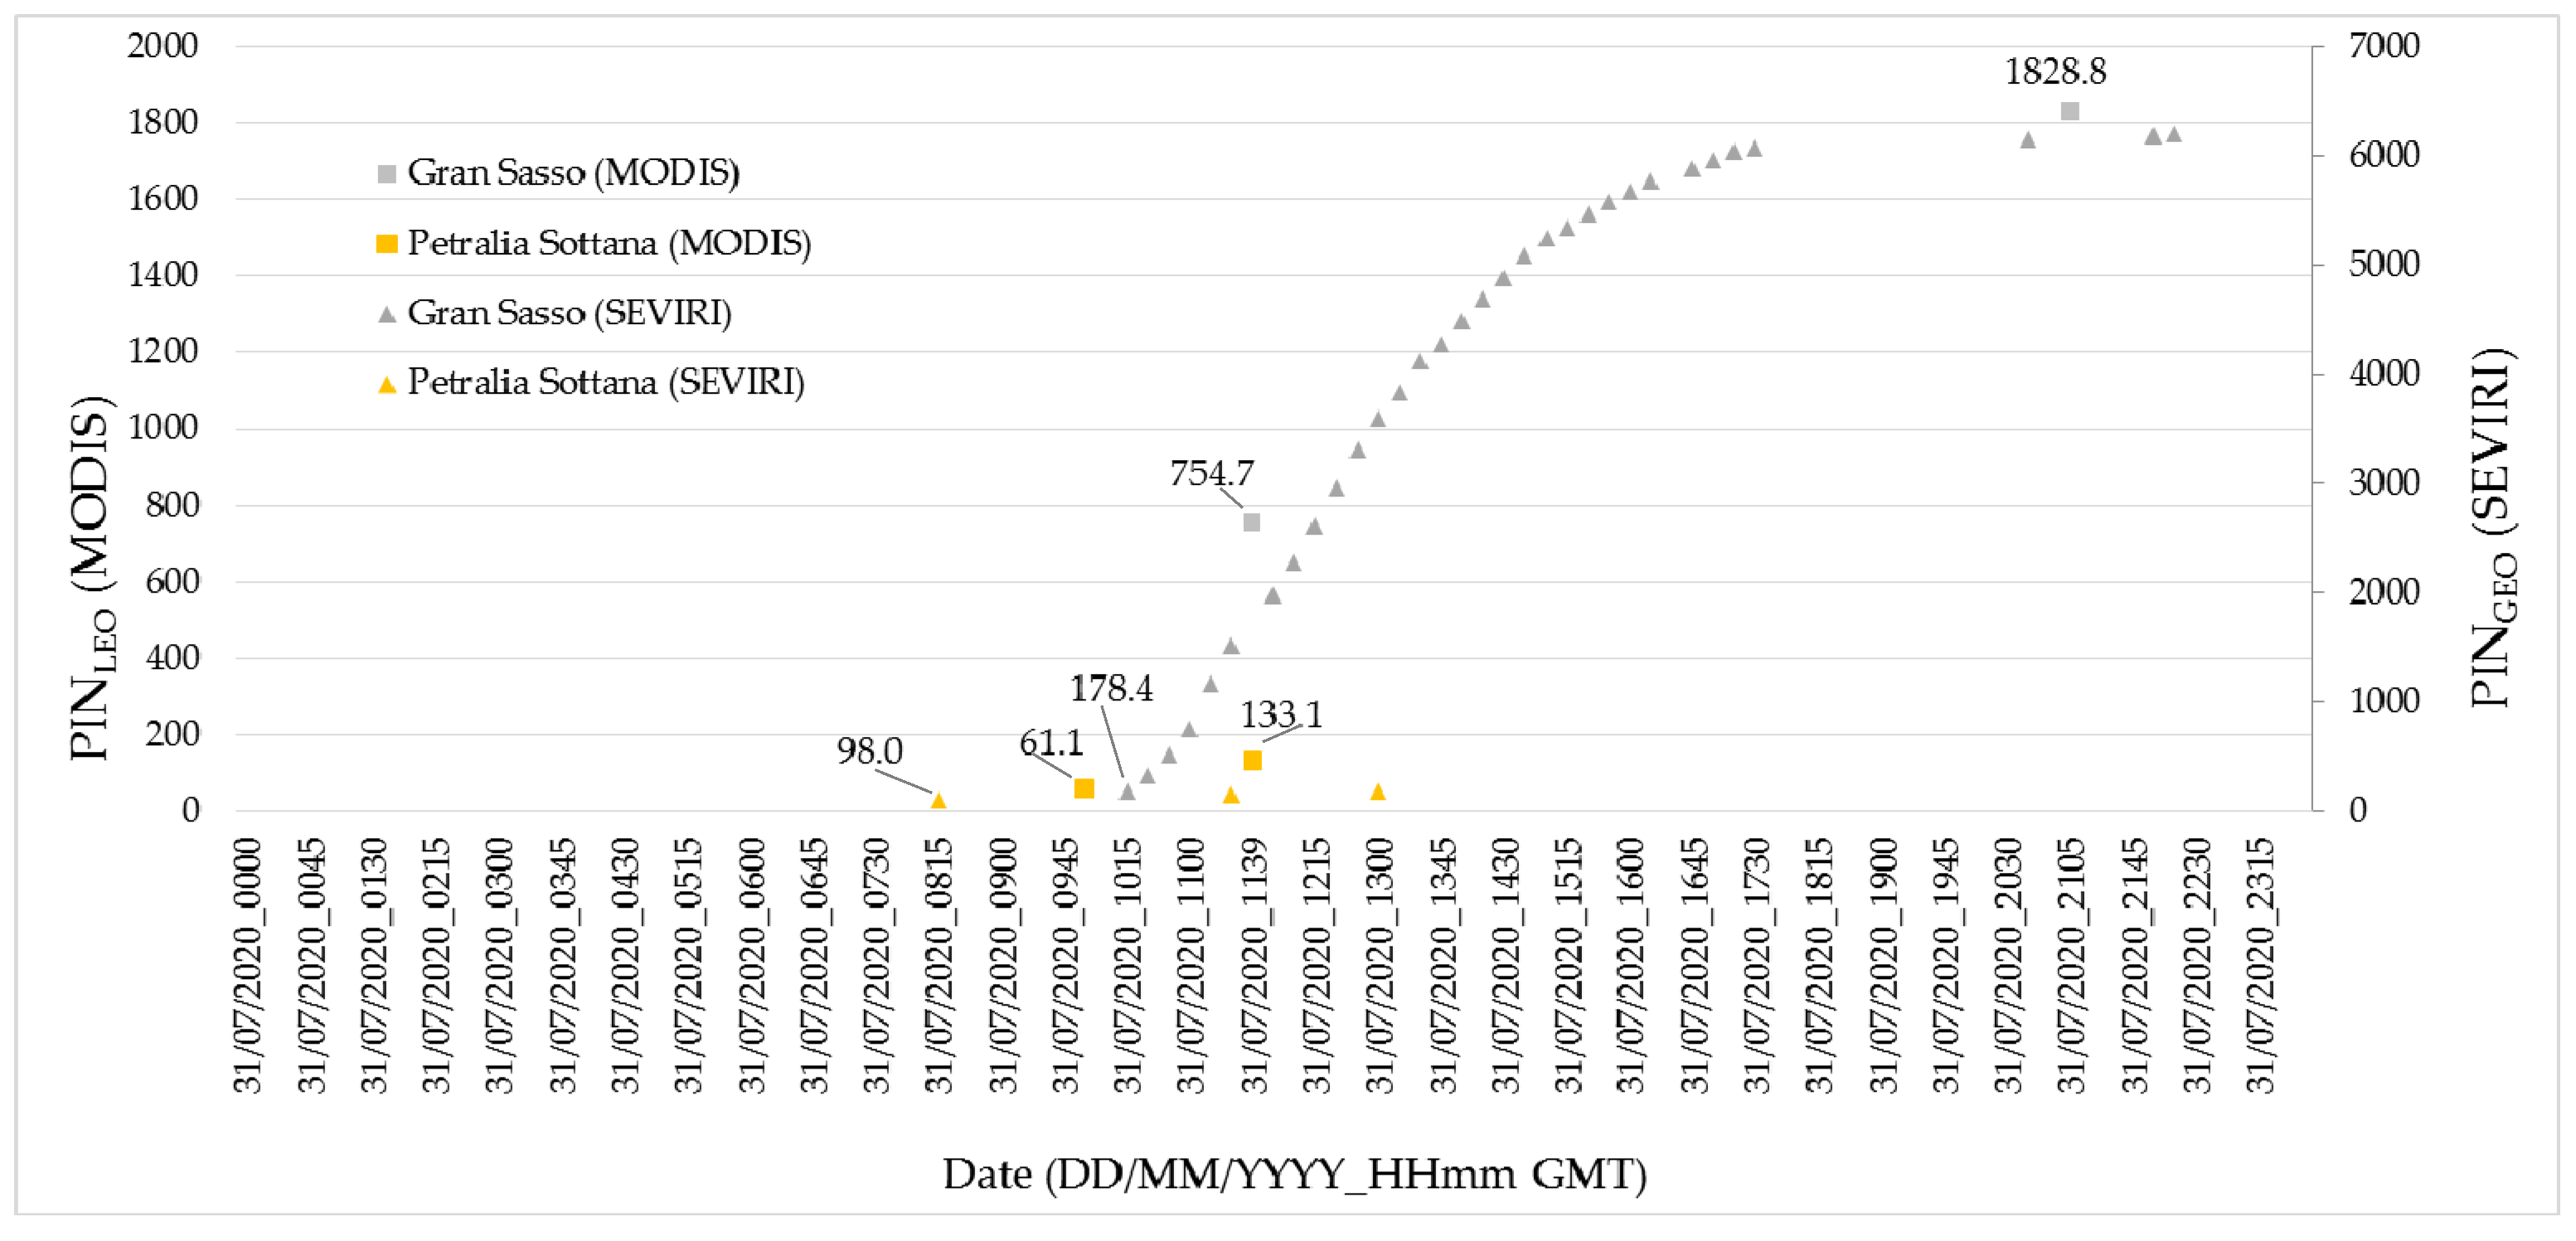
- the FDDI index used in ISS is able to give information on a local scale and with a 1-h update, unlike the forecasts that are used in operational mode by Civil Protection Departments (daily, at a Province level, see Figure 11);
- the use of the FDDI index alone is not enough to establish prioritization if it is not coupled with other indices that are at the basis of the PINs.
6. Discussion
7. Conclusions
- hot spot real-time detection by using the RST-FIRES technique, implemented with multi-mission satellite data (AVHRR, MODIS, SEVIRI);
- evaluation of fire ignition/propagation, for each detected hot spot, by using a simplified index, FDDI, to consider the state of vegetation, the wind intensity (WI), and geomorphological characteristics (MDI) for the area affected by the event;
- construction of synthetic priority indicators, PINGEO and PINLEO, for an immediate (and continuously updated) overview of the situation.
Author Contributions
Funding
Institutional Review Board Statement
Informed Consent Statement
Data Availability Statement
Acknowledgments
Conflicts of Interest
Abbreviations
| AFIS | Advanced Fire Information System |
| AI | Area of Interest |
| ALICE | Absolutely Llocal Index of Change of the Environment |
| AVHRR | Advanced Very High Resolution Radiometer |
| CLC2012 | CORINE Land Cover 2012 |
| COAU | Unified Air Operational Center |
| CORINE | Coordination of Information on the Environment |
| COSMO | Consortium for Small-scale Modeling |
| DTM | Digital Terrain Model |
| DV | Danger Value |
| EDI | Extremal Dependence Index |
| EFFIS | European Forest Fire Information System |
| EOS | Earth Observing System |
| FAST | FSI Fire Alerts System |
| FD | Fuel danger |
| FDDI | Fire Danger Dynamic Index |
| FMI | Fuel Moisture Index |
| FWI | Fire Weather Index |
| GIS | Geographic Information System |
| GRIB | GRIdded Binary |
| ICRIF | Índice Combinado de Risco de Incêndio Florestal |
| INPE | Instituto Nacional de Pesquisas Espaciais |
| ISS | Integrated Satellite System |
| LAMI | Limited Area Model Italy |
| MCDA | Multi-Criterial Decision Analysis |
| MDI | Morphological Danger Index |
| MetOP | Meteorological Operational Satellites |
| MIR | Middle InfraRed |
| MODIS | Moderate Resolution Imaging Spectroradiometer |
| MSG | Meteosat Second Generation |
| MVC | Maximum Value Composite |
| NDVD | NDVI Decadal |
| NDVI | Normalized Difference Vegetation Index |
| NIR | Near InfraRed |
| NOAA | National Oceanic and Atmospheric Administration |
| PIN | Priority Indicators |
| PINGEO | PIN for geostationary satellites |
| PINLEO | PIN for polar satellites |
| POD | Probability Of Detection |
| RST | Robust Satellite Techniques |
| RST-FIRES | Robust Satellite Techniques for FIRES detection and monitoring |
| SEVIRI | Spinning Enhanced Visible and InfraRed Imager |
| SWIR | Short Wave InfraRed |
| TIR | Thermal InfraRed |
| VIIRS | Visible Infrared Imaging Radiometer Suite |
| VIS | Visible |
| WI | Wind Intensity |
Appendix A

| Class | FDDI Value | Occurrence Zone | Description |
|---|---|---|---|
| 1 | FDDI ≤ 60 | No-fire occurrence zone | Low probability fire events |
| 2 | 60 < FDDI ≤ 120 | ||
| 3 | 120 < FDDI ≤ 180 | ||
| 4 | 180 < FDDI ≤ 240 | Fire occurrence zone | High probability fire events |
| 5 | FDDI > 240 |
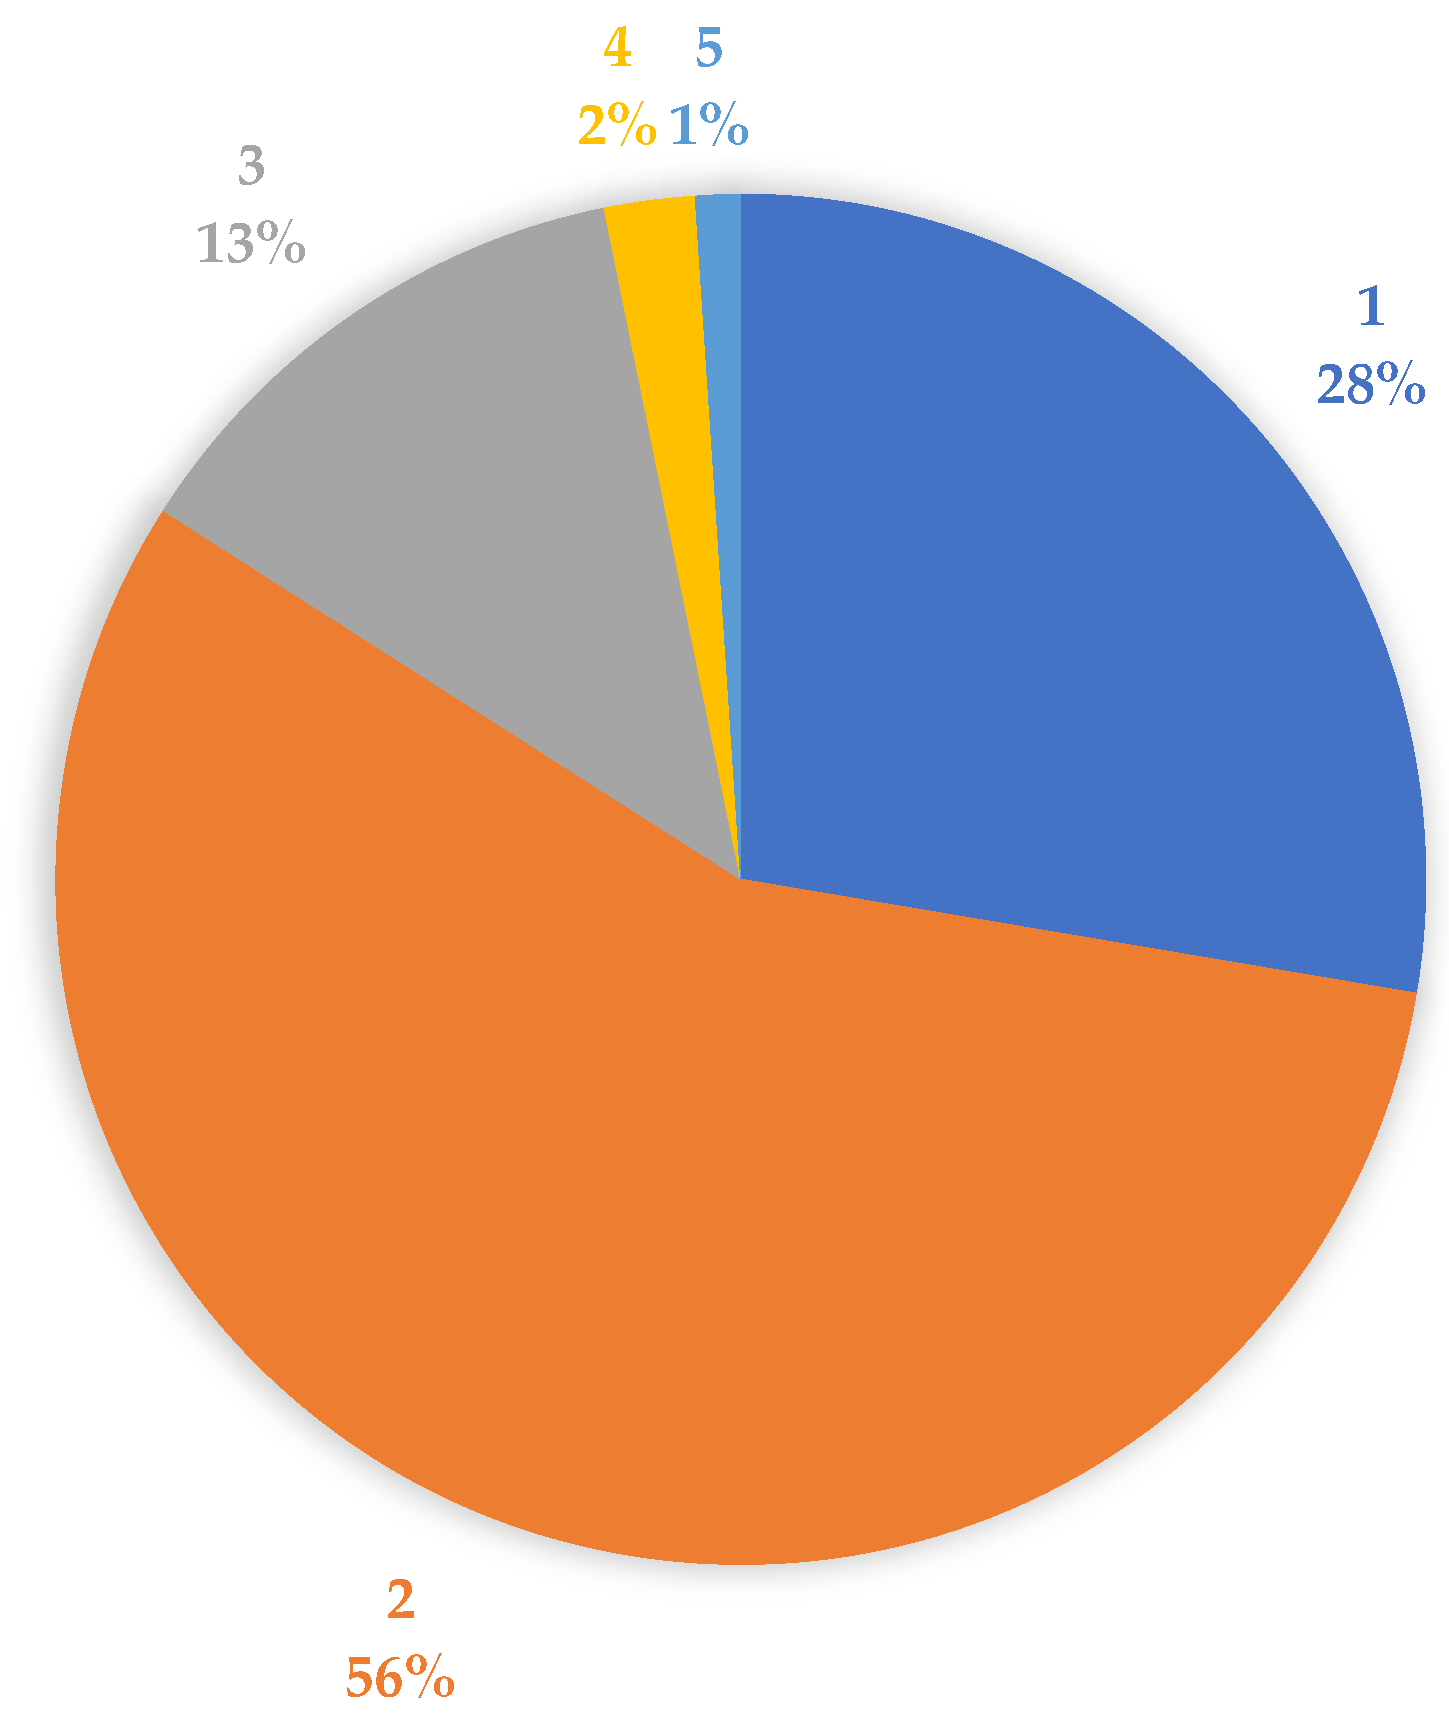
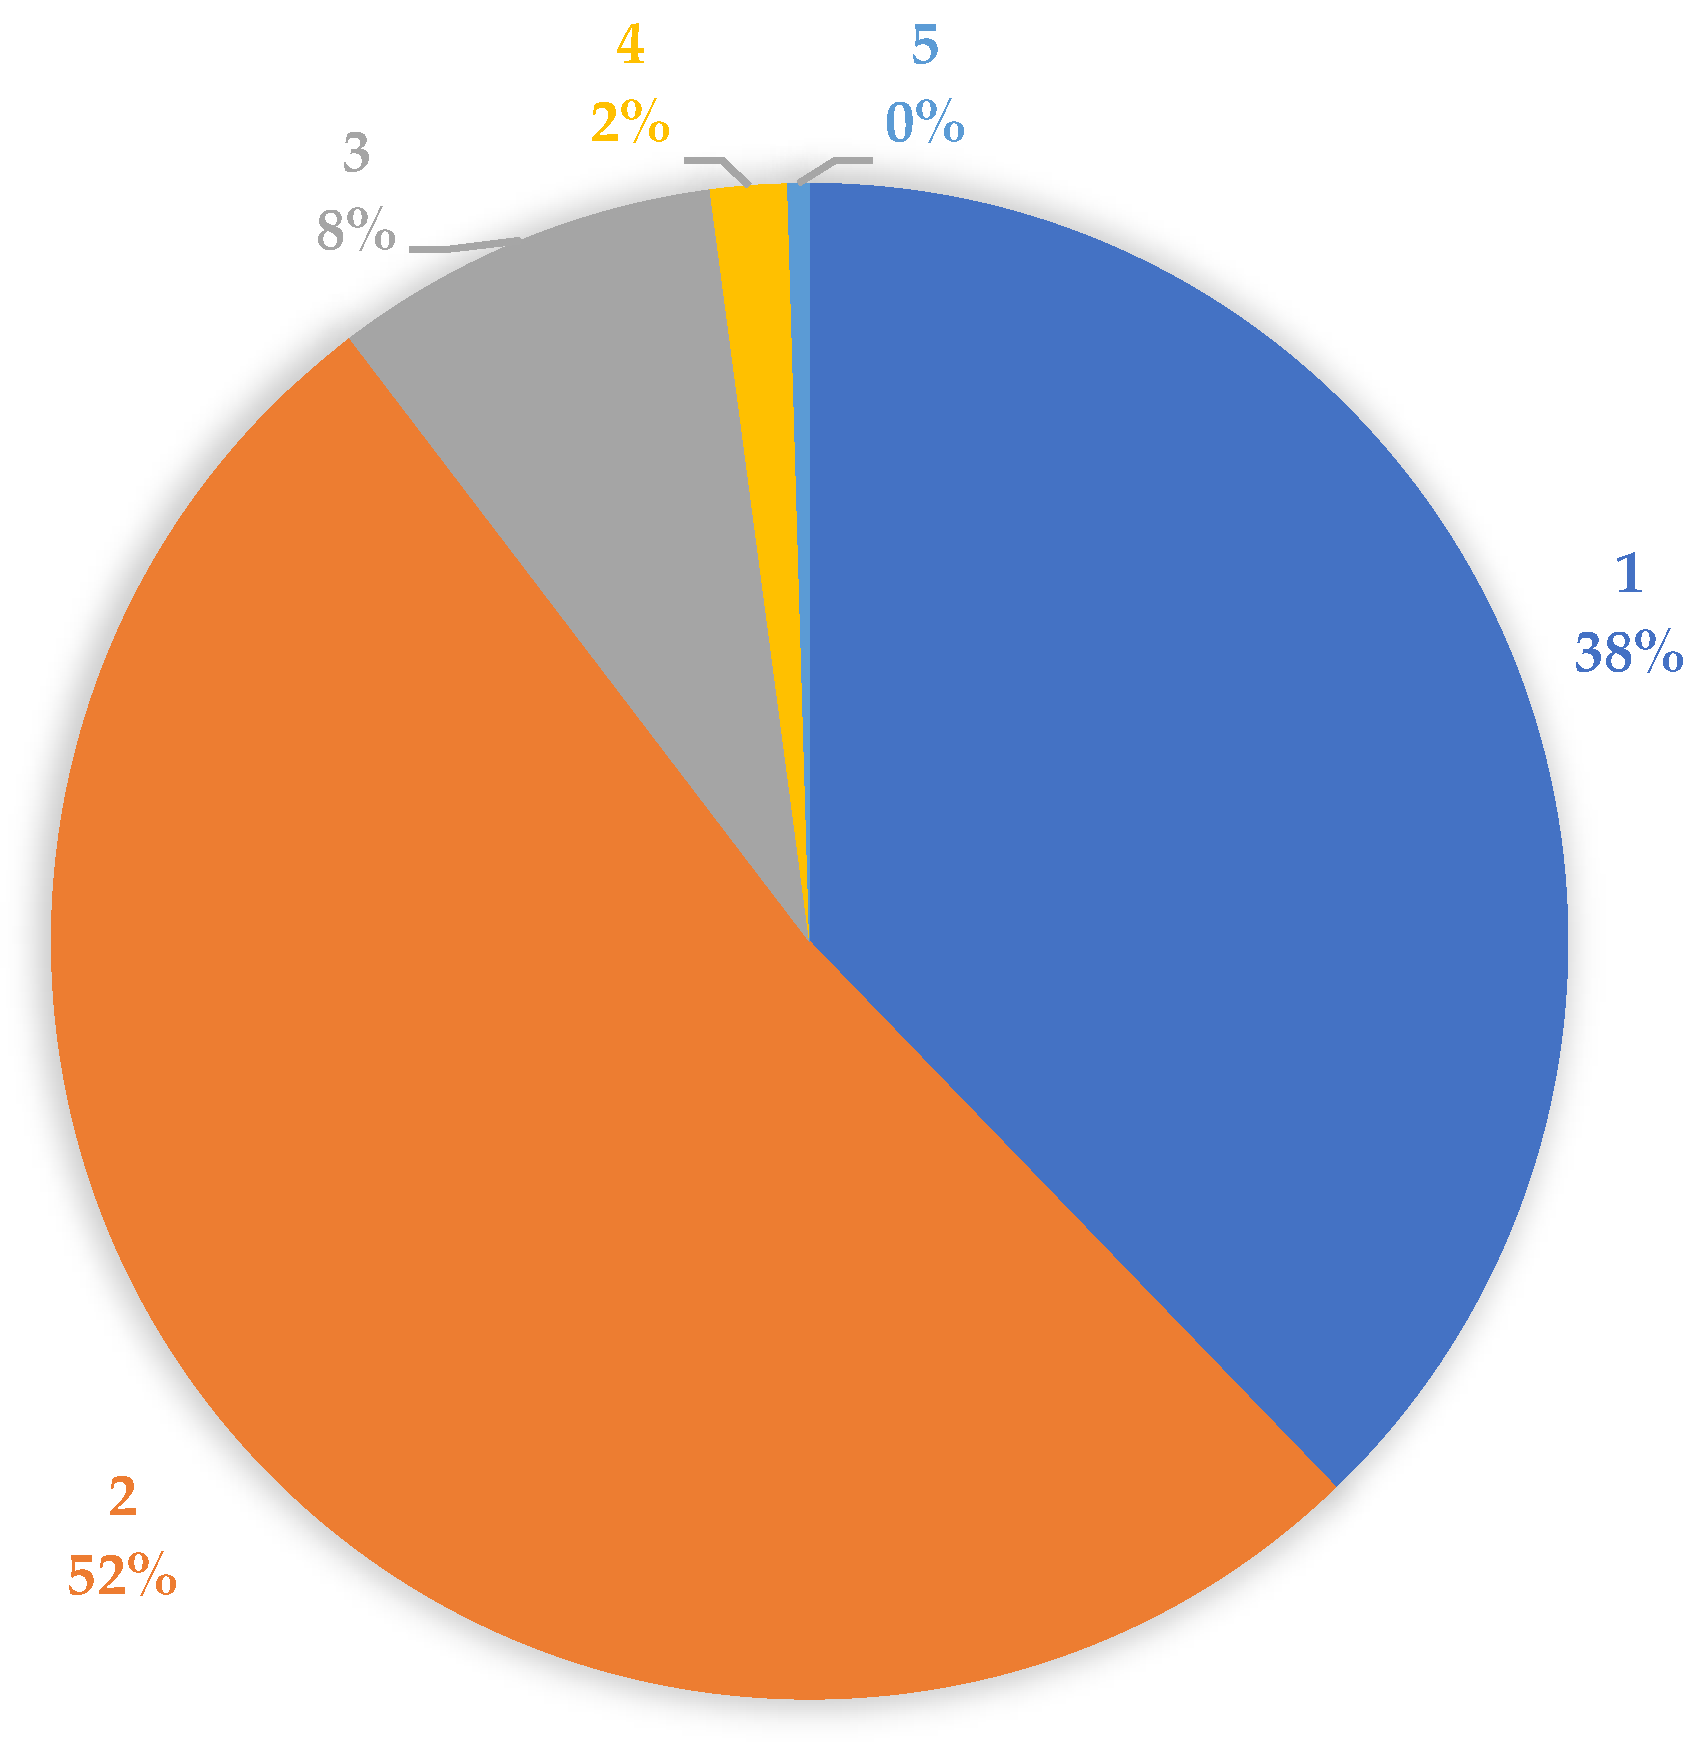
- 97% (91 fires) belong to the non-fire occurrence zone (classes 1–2–3);
- 3% (3 fires) belong to the fire occurrence zone (classes 4–5).

- 86,586 pixels (about 98%) belong to classes 1, 2, and 3 (no-fire occurrence zones);
- 1854 pixels (about 2%) belong to classes 4 and 5 (fire occurrence zones).

References
- Food and Agriculture Organization of the United Nations (FAO). Fire Management—Global Assessment 2006. A Thematic Study Prepared in the Framework of the Global Forest Resources Assessment 2005; FAO Forestry Paper 151; FAO: Rome, Italy; Available online: https://www.fao.org/3/a0969e/a0969e00.htm (accessed on 1 November 2021).
- Neary, D.G.; Ryan, K.C.; DeBano, L.F. Wildland Fire in Ecosystems: Effects of Fire on Soils and Water; General Technical Report RMRS-GTR-42; Department of Agriculture, Forest Service, Rocky Mountain Research Station: Ogden, UT, USA, 2005; Volume 4, p. 250. [CrossRef] [Green Version]
- Jhariya, M.K.; Raj, A.K. Effects of wildfires on flora, fauna and physico-chemical properties of soil—An overview. J. Appl. Nat. Sci. 2014, 6, 887–897. Available online: https://core.ac.uk/download/pdf/158352765.pdf (accessed on 1 November 2021).
- Vaks, A.; Mason, A.J.; Breitenbach, S.F.M.; Kononov, A.M.; Osinzev, A.V.; Rosensaft, M.; Borshevsky, A.; Gutareva, O.S.; Henderson, G.M. Palaeoclimate evidence of vulnerable permafrost during times of low sea ice. Nature 2020, 577, 221–225. [Google Scholar] [CrossRef] [PubMed]
- Greenpeace. Massive Forest Fires in Siberia Is a Climate Emergency. Available online: https://www.greenpeace.org/international/press-release/23660/massive-forest-fires-in-siberia-is-a-climate-emergency/ (accessed on 26 March 2020).
- CareOurEarth (COE). Over 37.2 Million Hectares Scorched By Wildfires Around the World in 2019. Available online: https://www.careourearth.com/over-37-million-hectares-scorched-by-wildfires-around-the-world-in-2019/ (accessed on 25 March 2020).
- Bishop, J. Burnt Assets: The 2019–2020 Australian Bushfires; WWF: Sydney, Australia, 2020; p. 34. [Google Scholar]
- Hughes, L.; Steffen, W.; Mullins, G.; Dean, A.; Weisbrot, E.; Rice, M. Summer of Crisis; Climate Council of Australia Limited: Potts Point, Australia, 2020; p. 34. [Google Scholar]
- Richards, L.; Brew, N.; Smith, L. 2019–20 Australian Bushfires—Frequently Asked Questions: A Quick Guide; Research Paper Series, 2019–2020; Parliament of Australia, Department of Parliamentary Services: Canberra, Australia, 2020; p. 12.
- Academy of Australian Science (AAS). The Australian Bushfires—Why They Are Unprecedented. Available online: www.science.org.au/news-and-events/news-and-media-releases/australian-bushfires-why-they-are-unprecedented (accessed on 20 March 2020).
- Maretti, C.C.; Riveros, S.J.C.; Hofstede, R.; Oliveira, D.; Charity, S.; Granizo, T.; Alvarez, C.; Valdujo, P.; Thompson, C. State of the Amazon: Ecological Representation in Protected Areas and Indigenous Territories; WWF Living Amazon (Global) Initiative: Brasilia, Brazil; Quito, Ecuador, 2014; p. 82. [Google Scholar]
- Food and Agriculture Organization of the United Nations (FAO). Global Forest Resources Assessment 2015; FAO: Rome, Italy; Available online: https://www.fao.org/forest-resources-assessment/past-assessments/fra-2015/en/ (accessed on 1 November 2021).
- Lizundia-Loiola, J.; Pettinari, M.L.; Chuvieco, E. Temporal Anomalies in Burned Area Trends: Satellite Estimations of the Amazonian 2019 Fire Crisis. Remote Sens. 2020, 12, 151. [Google Scholar] [CrossRef] [Green Version]
- Wooster, M.J.; Roberts, G.J.; Giglio, L.; Roy, D.; Freeborn, P.; Boschetti, L.; Justice, C.; Ichoku, C.; Schroeder, W.; Davies, D.; et al. Satellite remote sensing of active fires: History and current status, applications and future requirements. Remote Sens. Environ. 2021, 267, 112694. [Google Scholar] [CrossRef]
- Filizzola, C.; Corrado, R.; Marchese, F.; Mazzeo, G.; Paciello, R.; Pergola, N.; Tramutoli, V. RST-FIRES, an exportable algorithm for early-fire detection and monitoring: Description, implementation, and field validation in the case of the MSG-SEVIRI sensor. Remote Sens. Environ. 2017, 192, e2–e25. [Google Scholar] [CrossRef]
- Zhou, W.; Zhou, Y.; Wang, S.; Zhao, Q. Early warning for grassland fire danger in North China using remote sensing. In Proceedings of the International Geoscience and Remote Sensing Symposium (IGARSS03), Toulouse, France, 21–25 July 2003; pp. 2505–2507. Available online: https://0-ieeexplore-ieee-org.brum.beds.ac.uk/stamp/stamp.jsp?arnumber=1294373 (accessed on 1 November 2021).
- Leblon, B. Monitoring Forest Fire Danger with Remote Sensing. Nat Hazards 2005, 35, 343–359. [Google Scholar] [CrossRef]
- Gillespie, T.W.; Chu, J.; Frankenberg, E.; Thomas, D. Assessment and prediction of natural hazards from satellite imagery. Prog. Phys. Geogr. 2007, 31, 459–470. [Google Scholar] [CrossRef] [PubMed] [Green Version]
- San Miguel-Ayanz, J.; Carlson, J.D.; Alexander, M.; Tolhurst, K.; Morgan, G.; Sneeuwjagt, R.; Dudley, M. Current Methods to Assess Fire Danger Potential. In Wildland Fire Danger Estimation and Mapping. The Role of Remote Sensing Data; Chuvieco, E., Ed.; World Scientific Publishing: Singapore, 2003; pp. 21–61. [Google Scholar]
- Chowdhury, E.H.; Hassan, Q.K. Operational perspective of remote sensing-based forest fire danger forecasting systems. ISPRS J. Photogramm. Remote Sens. 2015, 104, 224–236. [Google Scholar] [CrossRef]
- Chuvieco, E. Wildland Fire Danger Estimation and Mapping: The Role of Remote Sensing; World Scientific Publishing: Singapore, 2003; Volume 4, p. 280. [Google Scholar] [CrossRef]
- Keane, R.E.; Mincemoyer, S.E.; Schmidt, K.M.; Long, D.G.; Garner, J.L. Mapping Vegetation and Fuels for Fire Management on the Gila National Forest Complex; General Technical Report RMRS-GTR-46-CD; USDA Forest Service, Rocky Mountain Research Station: Ogden, UT, USA, 2000. [CrossRef] [Green Version]
- Riaño, D.; Chuvieco, E.; Salas, J.; Palacios-Orueta, A.; Bastarrika, A. Generation of fuel type maps from Landsat TM images and ancillary data in Mediterranean ecosystems. Can. J. For. Res. 2002, 32, 1301–1315. [Google Scholar] [CrossRef]
- European Forest Fire Information System EFFIS. Available online: https://effis.jrc.ec.europa.eu/ (accessed on 1 November 2021).
- Queimadas Instituto Nacional de Pesquisas Espaciais (INPE). Available online: https://queimadas.dgi.inpe.br/queimadas/portal (accessed on 1 November 2021).
- McFerren, G.; Frost, P. The Southern African advanced fire information system. In Proceedings of the 6th International Information Systems for Crisis Response and Management (ISCRAM) Conference, Gothenburg, Sweden, 10–13 May 2009; pp. 1–6. [Google Scholar]
- AFIS Map Viewer. Available online: https://viewer.afis.co.za/map/ (accessed on 1 November 2021).
- Kumar, S.; Chaudhary, C.; Biswas, T.; Ghosh, S.; Ashutosh, S. Identification of Fire Prone Forest Areas Based on GIS Analysis of Archived Forest Fire Points Detected in the Last Thirteen Years; Technical information series; Forest Survey of India. Ministry of Environment, Forest & Climate Change, Government of India: Dehradun, India, 2019; Volume 1. Available online: http://www.indiaenvironmentportal.org.in/files/file/technical-information-series.pdf (accessed on 1 November 2021).
- FSI Fire Alert System (FAST), Version 3.0. Available online: http://fsiforestfire.gov.in/ (accessed on 1 November 2021).
- Barbosa, M.R.; Sícoli Seoane, J.C.; Guimarães Buratto, M.; Santana de Oliveira Dias, L.; Carvalho Raivel, J.P.; Lobos Martins, F. Forest Fire Alert System: A Geo Web GIS prioritization model considering land susceptibility and hotspots—A case study in the Carajás National Forest, Brazilian Amazon. Int. J. Geogr. Inf. Syst. 2010, 24, 873–901. [Google Scholar] [CrossRef]
- Bugalho, L.; Pessanha, L. The forest fire risk index (ICRIF) operational processing and validation. In Proceedings of the 4th International Wildland Fire Conference, Seville, Spain, 13–17 May 2007; Available online: http://citeseerx.ist.psu.edu/viewdoc/download?doi=10.1.1.587.8123&rep=rep1&type=pdf (accessed on 1 November 2021).
- Stocks, B.J.; Lawson, B.D.; Alexander, M.E.; Van Wagner, C.E.; McAlpine, R.S.; Lynham, T.J.; Dube, D.E. The Canadian Forest Fire Danger Rating System: An Overview. For. Chron. 1989, 65, 450–457. [Google Scholar] [CrossRef]
- Sharples, J.J.; McRae, R.H.D.; Weber, R.O.; Gill, A.M. A simple index for assessing fire danger rating. Environ. Model. Softw. 2009, 24, 764–774. [Google Scholar] [CrossRef]
- Bertani, R.; Blasi, C.; Biondi, E.; Bovio, G.; Camia, A.; Capogna, F.; Corona, P.; Cullotta, S.; Esposito, A.; Fabiani, M.L.; et al. Incendi E Complessità Ecosistemica—Dalla Pianificazione Forestale Al Recupero Ambientale; Blasi, C., Bovio, G., Corona, P., Marchetti, M., Maturani, A., Eds.; Ministero dell’Ambiente e Tutela del Territorio: Italia, Rome; Società Botanica Italianal: Florence, Italy, 2004; p. 353. Available online: https://www.mite.gov.it/sites/default/files/archivio/allegati/aib/incendi_e_complessita_ecosistemica.pdf (accessed on 1 November 2021).
- San-Miguel-Ayanz, J.; Durrant, T.; Boca, R.; Maianti, P.; Libertá, G.; Artés-Vivancos, T.; Oom, D.; Branco, A.; de Rigo, D.; Ferrari, D.; et al. Forest Fire in Europe, Middle East and North Africa 2019; EUR30402 EN; JRC122115; Publications Office of the European Union: Luxembourg, 2020. [Google Scholar] [CrossRef]
- Marchese, F.; Mazzeo, G.; Filizzola, C.; Coviello, I.; Falconieri, A.; Lacava, T.; Paciello, R.; Pergola, N.; Tramutoli, V. Issues and Possible Improvements in Winter Fires Detection by Satellite Radiances Analysis: Lesson Learned in Two Regions of Northern Italy. IEEE J. Sel. Top. Appl. Earth Obs. Remote Sens. 2017, 10, 3297–3313. [Google Scholar] [CrossRef]
- The European Organisation for the Exploitation of Meteorological Satellites (EUMETSAT). Normalised Difference Vegetation Index: Product Guide; Doc. No. EUM/TSS/USR/14/770105, v1A e-signed; EUMETSAT: Darmstadt, Germany, 2015; Available online: https://www-cdn.eumetsat.int/files/2020-04/pdf_ndvi_pg.pdf (accessed on 1 November 2021).
- Smets, B.; Jacobs, T.; Swinnen, E.; Toté, C.; Wolfs, D. Gio Global Land Component—Lot I: ”Operation of the Global Land Component”, Framework Service Contract N° 388533 (JRC), 30/01/2018, issue I2.31. Product User Manual: Normalized Difference Vegetation Index (NDVI)—Collection 1 km, version 2.2. Available online: https://land.copernicus.eu/global/sites/cgls.vito.be/files/products/GIOGL1_PUM_NDVI1km-V2.2_I2.31.pdf (accessed on 1 November 2021).
- Marsigli, C.; Boccanera, F.; Montani, A.; Paccagnella, T. The COSMO-LEPS mesoscale ensemble system: Validation of the methodology and verification. Nonlinear Process. Geophys. 2005, 12, 527–536. [Google Scholar] [CrossRef] [Green Version]
- Mazzeo, G.; Marchese, F.; Filizzola, C.; Pergola, N.; Tramutoli, V. A Multi-Temporal Robust Satellite Technique (RST) for Forest Fire Detection. In Proceedings of the 2007 International Workshop on the Analysis of Multi-temporal Remote Sensing Images, Leuven, Belgium, 18–20 July 2007. [Google Scholar] [CrossRef]
- Baldassarre, G.; Benigno, G.; Corrado, R.; Coviello, I.; Filizzola, C.; Lacava, T.; Marchese, F.; Mazzeo, G.; Paciello, R.; Pergola, N.; et al. Assessment of the Robust Satellite Technique (RST) in Real Time Detection of Summer Fires. In Proceedings of the Fifth International Workshop on the Analysis of Multitemporal Remote Sensing Images, Groton, CT, USA, 28–30 July 2009; Civco, D.L., Ed.; pp. 216–223. [Google Scholar]
- Mazzeo, G.; Baldassarre, G.; Corrado, R.; Filizzola, C.; Genzano, N.; Marchese, F.; Paciello, R.; Pergola, N.; Tramutoli, V. Assessment of a Robust Satellite Technique for Forest Fire Detection and Monitoring by Using a Total Validation Approach. In Proceedings of the 33rd International Symposium on Remote Sensing of Environment (ISRSE33), Stresa, Italy, 4–8 May 2009; pp. 607–610. [Google Scholar]
- Filizzola, C.; Baldassarre, G.; Benigno, G.; Corrado, R.; Coviello, I.; Lacava, T.; Marchese, F.; Mazzeo, G.; Paciello, R.; Pergola, N.; et al. Automatic RST-Based System for a Rapid Detection of Fires. In Proceedings of the VI International Conference on Forest Fire Research (ICFFR), Coimbra, Portugal, 15–18 November 2010; Viegas, D.X., Ed.; Available online: http://www.researchgate.net/profile/Francesco_Marchese2/publication/234055644_Automatic_RST-based_system_for_a_rapid_detection_of_fires/links/54818e200cf22525dcb621a5.pdf (accessed on 1 November 2021).
- Marchese, F.; Corrado, R.; Filizzola, C.; Mazzeo, G.; Paciello, R.; Pergola, N.; Tramutoli, V. On the Potential of Robust Satellite Techniques (RST-FIRES) for Forest Fire Detection and Monitoring. In Proceedings of the VI International Conference on Forest Fire Research (ICFFR), Coimbra, Portugal, 15–18 November 2010; Viegas, D.X., Ed.; Available online: https://www.researchgate.net/publication/234055645_On_the_potential_of_Robust_Satellite_Techniques_RST-FIRES_for_forest_fire_detection_and_monitoring.pdf (accessed on 1 November 2021).
- Tramutoli, V. Robust AVHRR Techniques (RAT) for environmental monitoring: Theory and applications. In Proceedings of the SPIE 3496, Earth Surface Remote Sensing II, Barcelona, Spain, 11 December 1998; pp. 101–113. [Google Scholar] [CrossRef]
- Tramutoli, V. Robust Satellite Techniques (RST) for natural and environmental hazards monitoring and mitigation: Ten years of successful applications. In Proceedings of the 9th International Symposium on Physical Measurements and Signatures in Remote Sensing XXXVI (7/W20), Beijing, China, 17–19 October 2005; pp. 792–795. [Google Scholar]
- Tramutoli, V. Robust Satellite Techniques (RST) for natural and environmental hazards monitoring and mitigation: Theory and applications. In Proceedings of the 2007 International Workshop on the Analysis of Multi-Temporal Remote Sensing Images, Leuven, Belgium, 18–20 July 2007. [Google Scholar] [CrossRef]
- Marzano, R.; Bovio, G.; Guglielmet, E.; Jappiot, M.; Lampin, C.; Dauriac, F.; Deshayes, M.; Salas, J.; Aguado, I.; Martínez, J.; et al. Common Methods for Mapping the Wildland Fire Danger; EUFIRELAB: Euro-Mediterranean Wildland Fire Laboratory, a “wall-less” Laboratory for Wildland Fire Sciences and Technologies in the Euro-Mediterranean Region. Deliverable D-08-05; HAL Inrea: Bangalore, India, 2004. [Google Scholar]
- San-Miguel-Ayanz, J.; Durrant, T.; Boca, R.; Maianti, P.; Libertá, G.; Artés-Vivancos, T.; Oom, D.; Branco, A.; de Rigo, D.; Ferrari, D.; et al. Forest Fires in Europe, Middle East and North Africa 2020; EUR 30862 EN; JRC126766; Publications Office of the European Union: Luxembourg, 2021. [Google Scholar] [CrossRef]
- Toscana Notizie. DIRETTA–Incendi in Garfagnana e sui Monti Pisani. Available online: https://www.toscana-notizie.it/-/diretta-incendi-in-garfagnana-e-sui-monti-pisani (accessed on 1 November 2021).
- Pisa Today. Incendio sul Serra: Il Monte Brucia Ancora. Available online: https://www.pisatoday.it/cronaca/incendio-monte-serra-vicopiano-25-febbraio-2019.html (accessed on 1 November 2021).
- SerchioinDiretta.it. Vasto Rogo nei Boschi di Careggine. Available online: https://www.serchioindiretta.it/garfagnana/2019/02/24/vasto-rogo-nei-boschi-di-careggine/90933/ (accessed on 1 November 2021).
- Il Tirreno—Lucca. Grosso Incendio tra Castelnuovo e Careggine. Available online: https://iltirreno.gelocal.it/lucca/cronaca/2019/02/24/news/grosso-incendio-tra-castelnuovo-e-careggine-1.30039154 (accessed on 1 November 2021).
- La Gazzetta della Spezia. Sesta Godano, Bruciano oltre 5 Ettari di Bosco. Available online: https://www.gazzettadellaspezia.it/cronaca/item/94766-sesta-godano-bruciano-oltre-5-ettari-di-bosco (accessed on 1 November 2021).
- Copernicus Climate Change Service. Summer 2020 Heatwaves. Available online: https://climate.copernicus.eu/sites/default/files/inline-images/C3S_ESOTC20_heatwaves_Fig1_branded.png (accessed on 14 December 2021).
- Centro Funzionale Protezione Civile Abruzzo. Fire Susceptibility for 31 July 2020. Available online: http://allarmeteo.regione.abruzzo.it/segnalazioni/7230/previsione-incendi-per-il-giorno-31-luglio-2020 (accessed on 14 December 2021).
- Protezione Civile Regione Sicilia. Fire and Heatwave Warning for 31 July 2020. Available online: https://www.protezionecivilesicilia.it/tinymce/js/tinymce/source/Rischio%20Incendi%20e%20Ondate%20di%20calore/Avviso%20Rischio%20Incendi%20e%20Ondate%20di%20calore%20n.%20150%20del%2030.07.2020.pdf (accessed on 14 December 2021).
- Il Centro. Incendio Devasta Oltre 100 Ettari di Pineta. Available online: https://www.ilcentro.it/l-aquila/incendio-devasta-oltre-100-ettari-di-pineta-1.2473224 (accessed on 14 December 2021).
- La Repubblica. Palermo, Incendio sulla Montagna di Petralia Sottana: Fiamme Alimentate dallo Scirocco. Available online: https://palermo.repubblica.it/cronaca/2020/07/31/foto/palermo_incendio_sulla_montagna_di_petralia_sottana_fiamme_alimentate_dallo_scirocco-263360078/1/ (accessed on 14 December 2021).
- European Union. Decision (EU) 2019/420 of the European Parliament and of the Council of 13 March 2019, amending Decision No 1313/2013/EU on a Union Civil Protection Mechanism. Off. J. Eur. Union L 77I 2019, 62, 1–15. Available online: https://eur-lex.europa.eu/legal-content/EN/TXT/PDF/?uri=CELEX:32019D0420&from=EN (accessed on 1 November 2021).
- European Commission. Communication from the Commission to the European Parliament, the European Council, the Council, the European Economic and Social Committee and the Committee of the Regions; COM (2019) 640 Final, The European Green Deal; European Commission: Brussels, Belgium, 2019; Available online: https://eur-lex.europa.eu/resource.html?uri=cellar:b828d165-1c22-11ea-8c1f-01aa75ed71a1.0002.02/DOC_1&format=PDF (accessed on 1 November 2021).
- Coles, S.; Heffernan, J.; Tawn, J. Dependence measures for extreme value analyses. Extremes 1999, 2, 339–365. [Google Scholar] [CrossRef]
- Ferro, C.A.; Stephenson, D.B. Extremal dependence indices: Improved verification measures for deterministic forecasts of rare binary events. Weather Forecast. 2011, 26, 699–713. [Google Scholar] [CrossRef] [Green Version]
- Di Giuseppe, F.; Pappenberger, F.; Wetterhall, F.; Krzeminski, B.; Camia, A.; Libertá, G.; San Miguel, J. The Potential Predictability of Fire Danger Provided by Numerical Weather Prediction. J. Appl. Meteorol. Climatol. 2016, 55, 2469–2491. Available online: https://journals.ametsoc.org/view/journals/apme/55/11/jamc-d-15-0297.1.xml (accessed on 1 November 2021).
- Stephenson, D.; Casati, B.; Ferro, C.; Wilson, C. The extreme dependency score: A non-vanishing measure for forecasts of rare events. Meteorol. Appl. 2008, 15, 41–50. [Google Scholar] [CrossRef]


| K | CLC CODE | CLC CLASS (Ak) | Hazard Level (Dk) |
|---|---|---|---|
| 1 | 111 | Continuous urban fabric | 1 |
| 2 | 112 | Discontinuous urban fabric | 1 |
| 3 | 121 | Industrial or commercial units | 1 |
| 4 | 122 | Road and rail networks and associated land | 1 |
| 5 | 123 | Port areas | 1 |
| 6 | 124 | Airports | 1 |
| 7 | 131 | Mineral extraction sites | 1 |
| 8 | 132 | Dump sites | 1 |
| 9 | 133 | Construction sites | 1 |
| 10 | 141 | Green urban areas | 1 |
| 11 | 142 | Sport and leisure facilities | 1 |
| 12 | 211 | Non-irrigated arable land | 10 |
| 13 | 212 | Permanently irrigated land | 5 |
| 14 | 213 | Rice fields | 1 |
| 15 | 221 | Vineyards | 1 |
| 16 | 222 | Fruit trees and berry plantations | 1 |
| 17 | 223 | Olive groves | 5 |
| 18 | 231 | Pastures | 10 |
| 19 | 241 | Annual crops associated with permanent crops | 7 |
| 20 | 242 | Complex cultivation patterns | 10 |
| 21 | 243 | Land principally occupied by agriculture, with significant areas of natural vegetation | 10 |
| 22 | 244 | Agro-forestry areas | 15 |
| 23 | 311 | Broad-leaved forest | 25 |
| 24 | 312 | Coniferous forest | 70 |
| 25 | 313 | Mixed forest | 30 |
| 26 | 321 | Natural grasslands | 15 |
| 27 | 322 | Moors and heathland | 50 |
| 28 | 323 | Sclerophyllous vegetation | 50 |
| 29 | 324 | Transitional woodland-shrub | 100 |
| 30 | 331 | Beaches, dunes, sands | 1 |
| 31 | 332 | Bare rocks | 1 |
| 32 | 333 | Sparsely vegetated areas | 5 |
| 33 | 335 | Glaciers and perpetual snow | 0 |
| 34 | 411 | Inland marshes | 10 |
| 35 | 412 | Peat bogs | 10 |
| 36 | 421 | Salt marshes | 5 |
| 37 | 422 | Salines | 1 |
| 38 | 511 | Water courses | 1 |
| Slope (in °) (Weight 70%) | Aspect (in °) (Weight 30%) | ||
|---|---|---|---|
| Classes | DV | Classes | DV |
| 0–5 5–10 10–15 15–20 20–25 25–30 30–35 >35 | 1 2 3 4 5 6 7 8 | 0–22.5 and 337.5–360 22.5–67.5 292.5–337.5 67.5–112.5 247.5–292.5 112.5–157.5 202.5–247.5 157.5–202.5 | 1 2 3 4 5 6 7 8 |
| Place and Data DD/MM/YY | Burned Area (ha) | SEVIRI | AVHRR | MODIS | ISS | ||||
|---|---|---|---|---|---|---|---|---|---|
| ALICEMIR (Min–Max) | No. RST Thermal Anomalies | ALICEMIR (Min–Max) | No. RST Thermal Anomalies | ALICEMIR (Min–Max) | No. RST Thermal Anomalies | ALICEMIR (Min–Max) | Total No. RST Thermal Anomalies | ||
| Careggine (LU) 24 February 2019 | 20 | 1.6–13.2 | 22 | 2.8–6.3 | 3 | - | - | 1.6–13.2 | 25 |
| Passo della Bocchetta (GE) 24–25 February 2019 | 10 | 2.1–4.8 | 3 | 4.7–11.6 | 4 | - | - | 2.1–11.6 | 7 |
| Sillano (LU) 25–26 February 2019 | 100 | 2.4–18.3 | 9 | 2.7–10.7 | 17 | 3.8 | 1 | 2.4–18.3 | 27 |
| Vicopisano (PI) 25–26 February 2019 | 230 | 4.3–29.8 | 133 | 3.9–16.8 | 7 | 6.9–7.2 | 2 | 3.9–29.8 | 142 |
| Sesta Godano (SP) 25 February 2019 | 5 | 4.7 | 1 | - | - | - | - | 4.7 | 1 |
| Place and Data DD/MM/YY | SEVIRI | MODIS | ISS | |||
|---|---|---|---|---|---|---|
| ALICEMIR (Min–Max) | No. RST Thermal Anomalies | ALICEMIR (Min–Max) | No. RST Thermal Anomalies | ALICEMIR (Min–Max) | Total No. RST Thermal Anomalies | |
| Gran Sasso (AQ) 31 July 2020 | 1.8–12.9 | 88 | 4.2–21.7 | 17 | 1.8–21.7 | 105 |
| Petralia Sottana (PA) 31 July 2020 | 2.3–5.8 | 5 | 8.0–14.0 | 3 | 2.3–14.0 | 8 |
Publisher’s Note: MDPI stays neutral with regard to jurisdictional claims in published maps and institutional affiliations. |
© 2022 by the authors. Licensee MDPI, Basel, Switzerland. This article is an open access article distributed under the terms and conditions of the Creative Commons Attribution (CC BY) license (https://creativecommons.org/licenses/by/4.0/).
Share and Cite
Mazzeo, G.; De Santis, F.; Falconieri, A.; Filizzola, C.; Lacava, T.; Lanorte, A.; Marchese, F.; Nolè, G.; Pergola, N.; Pietrapertosa, C.; et al. Integrated Satellite System for Fire Detection and Prioritization. Remote Sens. 2022, 14, 335. https://0-doi-org.brum.beds.ac.uk/10.3390/rs14020335
Mazzeo G, De Santis F, Falconieri A, Filizzola C, Lacava T, Lanorte A, Marchese F, Nolè G, Pergola N, Pietrapertosa C, et al. Integrated Satellite System for Fire Detection and Prioritization. Remote Sensing. 2022; 14(2):335. https://0-doi-org.brum.beds.ac.uk/10.3390/rs14020335
Chicago/Turabian StyleMazzeo, Giuseppe, Fortunato De Santis, Alfredo Falconieri, Carolina Filizzola, Teodosio Lacava, Antonio Lanorte, Francesco Marchese, Gabriele Nolè, Nicola Pergola, Carla Pietrapertosa, and et al. 2022. "Integrated Satellite System for Fire Detection and Prioritization" Remote Sensing 14, no. 2: 335. https://0-doi-org.brum.beds.ac.uk/10.3390/rs14020335