Article

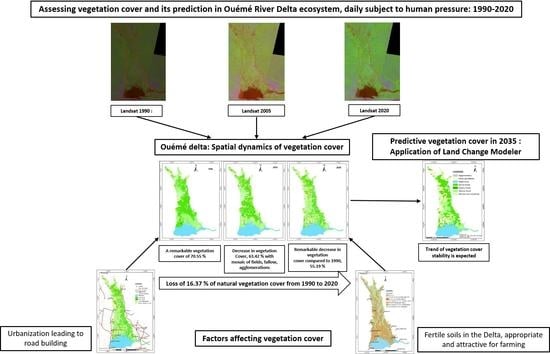
Spatial Dynamics and Predictive Analysis of Vegetation Cover in the Ouémé River Delta in Benin (West Africa)

by
Abdel Aziz Osseni
1,
Hubert Olivier Dossou-Yovo
2,*,
Gbodja Houéhanou François Gbesso
1,
Toussaint Olou Lougbegnon
3 and
Brice Sinsin
2
1
Horticultural Research and Management of Green Spaces Unit of Laboratory of Plant, Horticultural and Forest Sciences, School of Horticulture and Management of Green Spaces, National University of Agriculture, Ketou P.O. Box 43, Benin
2
Faculty of Agronomic Sciences (FSA), Laboratory of Applied Ecology, University of Abomey-Calavi, Godomey P.O. Box 1974, Benin
3
Forestry and Bioresources Conservation Research Unit of Laboratory of Plant, Horticultural and Forestry Sciences, School of Tropical Forestry, National University of Agriculture, Ketou P.O. Box 43, Benin
*
Author to whom correspondence should be addressed.
Remote Sens. 2022, 14(23), 6165; https://0-doi-org.brum.beds.ac.uk/10.3390/rs14236165
Submission received: 18 October 2022 / Revised: 21 November 2022 / Accepted: 28 November 2022 / Published: 5 December 2022
(This article belongs to the Special Issue Advances in Remote Sensing for Environmental Monitoring)

Abstract

:
The vegetation cover of the Ouémé Delta constitutes a biodiversity hotspot for the wetlands in southern Benin. However, the overexploitation of natural resources in addition to the intensification of agricultural practices led to the degradation of the natural ecosystems in this region. The present work aims to reconstruct, using remote sensing, the spatial dynamics of land use in the Ouémé Delta in order to assess the recent changes and predict the trends in its vegetation cover. The methodology was based on remote sensing and GIS techniques. Altogether, this process helped us carry out the classification of Landsat images for a period of 30 years (stating year 1990, 2005, and 2020) via the Envi software. The spatial statistics resulting from this processing were combined using ArcGIS software to establish the transition matrices in order to monitor the conversion rates of the land cover classes obtained. Then, the prediction of the plant landscape by the year 2035 was performed using the “Land Change Modeler” extension available under IDRISI. The results showed seven (07) classes of occupation and land use. There were agglomerations, mosaics of fields and fallow land, water bodies, dense forests, gallery forests, swamp forests, and shrubby wooded savannahs. The observation of the vegetation cover over the period of 15 years from 1990 to 2005 showed a decrease from 71.55% to 63.42% in the surface area of the Ouémé Delta. A similar trend was noticed from 2005 to 2020 when it reached 55.19%, entailing a loss of 16.37% of the surface area of natural habitats in 30 years. The two drivers of such changes are the fertility of alluvial soils for agriculture along and urbanization. The predictive modeling developed for 2035 reveals a slight increase in the area of dense forests and shrubby wooded savannas, contrary to the lack of significant decrease in the area of gallery forests and swamp forests. This is key information that is expected to be useful to both policy and decision makers involved in the sustainable management and conservation of natural resources in the study area.

Graphical Abstract

1. Introduction

In Benin, Ouémé is the longest river, and its delta extends to nearly 90 km with a fairly large flood zone of more than 9000 km2 [1]. This delta zone is located on sedimentary soil loaded with alluvium, which is transported from upstream of the river, and hosts a diversity of plant communities [2]. These are dense forests and gallery forests, swamp forests, and other plant formations that represent various wetland ecosystems [3]. Regarding the topography of the region, there are low slopes offering large areas that favor agriculture because of the soil fertility [1,4]. This potential fertility attracts people who not only overexploit forest resources including the non-timber forest products but also intensify the use of fertile soils for farming in order to supply the growing demand for food and other basic products [5]. Moreover, the Ouémé Delta supports several socio-economic activities, including fishing, livestock breeding and grazing, trade, and transportation by local communities [2]. Consequently, an increasing demographic pressure, fishing techniques, and agricultural practices, which are associated with climatic hazards, cause many environmental problems including pollution and ecosystem degradation [6]. In addition, the river Delta, as the natural receptacle of the river, accumulates all the wastes from the exploitation and management activities of its watershed [7]. This leads to the pollution of water and the degradation of soil [8], the environment, and natural formations, thus precipitating land use changes and the loss of biodiversity [9,10]. Such a loss will affect humans since local populations in Benin are known to collect both woody and herbaceous species from their natural environment for the treatment of various health conditions [11,12,13]. These issues raise questions about the sustainability of natural resource management as well as the conservation systems and the availability of present and future services that partly depend on plant communities [14].
There is evidence for a diversity of investigations on vegetation changes across the globe [15,16], but the novelty and originality of the present study is that it focuses on the delta of the longest river of Benin Republic, which has never been researched before with respect to its vegetation cover. Indeed, quantifying how vegetation changes over years is very critical to Earth systems. In fact, plants play a key role in the global water [17] and carbon cycles [16], which could affect the Earth’s climate. It is important to monitor the plant cover in order to reflect on the mechanisms of its management to ensure the balance between land use and the availability of ecosystem services [18]. This can be carried out through the collection of field data for the establishment of basic indicators with which to assess land use [19]. However, unfortunately, the exploitation of quantitative and qualitative field data is very costly and sometimes impossible when study areas are difficult to access. These data are sometimes unavailable in the existing databases when assessing past levels of land occupation and use [20]. Nowadays, however, there are spatial approaches, including earth observation by satellite remote sensing and geographic information sciences, that help overcome these data collection difficulties [21,22]. These disciplines use modern techniques for collecting and processing spatial data with relatively satisfactory precision [23]. For example, they enable the reconstruction of spaces from satellite images and the study of their dynamics with various levels of detail [24,25]. They also offer the possibility of analyzing, modeling, and mapping the phenomena studied [26]. Despite these scientific advances, very few studies have focused on earth observation in the Ouémé Delta, and, more specifically, on its vegetation cover [27]. The few studies available on land use in this sensitive geographical zone provide little information on the past dynamics of plant formations as a support for spatial reconstruction and predictive landscape analysis [28,29,30]. Using satellite image analysis for vegetation and land cover assessment, Nababa et al. [31] documented the cover dynamics and mangrove degradation in the Niger Delta region. This helped them predict the land cover of the study area in the coming years. Elsewhere and more recently, Venter et al. [32] made a comparison of dynamic world, world cover, and Esti land cover based on image analysis and ascertained aggregate changes in the ecosystem. Similarly, in Nigeria, Uchegbulam et al. [33] extracted statistics that showed that cultivation, built-up area, exposed soil, secondary regrowth, and water bodies increased between 2002 and 2014. In line with such studies and to fill the gap in the scientific knowledge on the Ouémé Delta region, the present research was undertaken, which focuses on assessing the spatial dynamics and predictive analysis of the plant landscape. Thus, it can serve as a scientific basis for both policy writers and decision makers at various levels, particularly those involved in the development of municipalities sharing the Ouémé Delta, for the conservation of biodiversity and sustainable water management. In other words, although various studies have been undertaken worldwide using the same method, the great importance of the present study is the fact that it focuses on a humid ecosystem that has not been studied before despite the daily exploitation of such a ecosystem meaning human pressure. Moreover, the scientific validation of this study shown through the methodology described below proves that it is worth disseminating the outputs. The predictive analysis is not only innovative since it leads to scientific opinions on the future of vegetation, but it is also greatly expected to be valued by political leaders and other stakeholders involved in ecosystem management in Benin Republic in the present context of climate change and biodiversity loss.

2. Materials and Methods
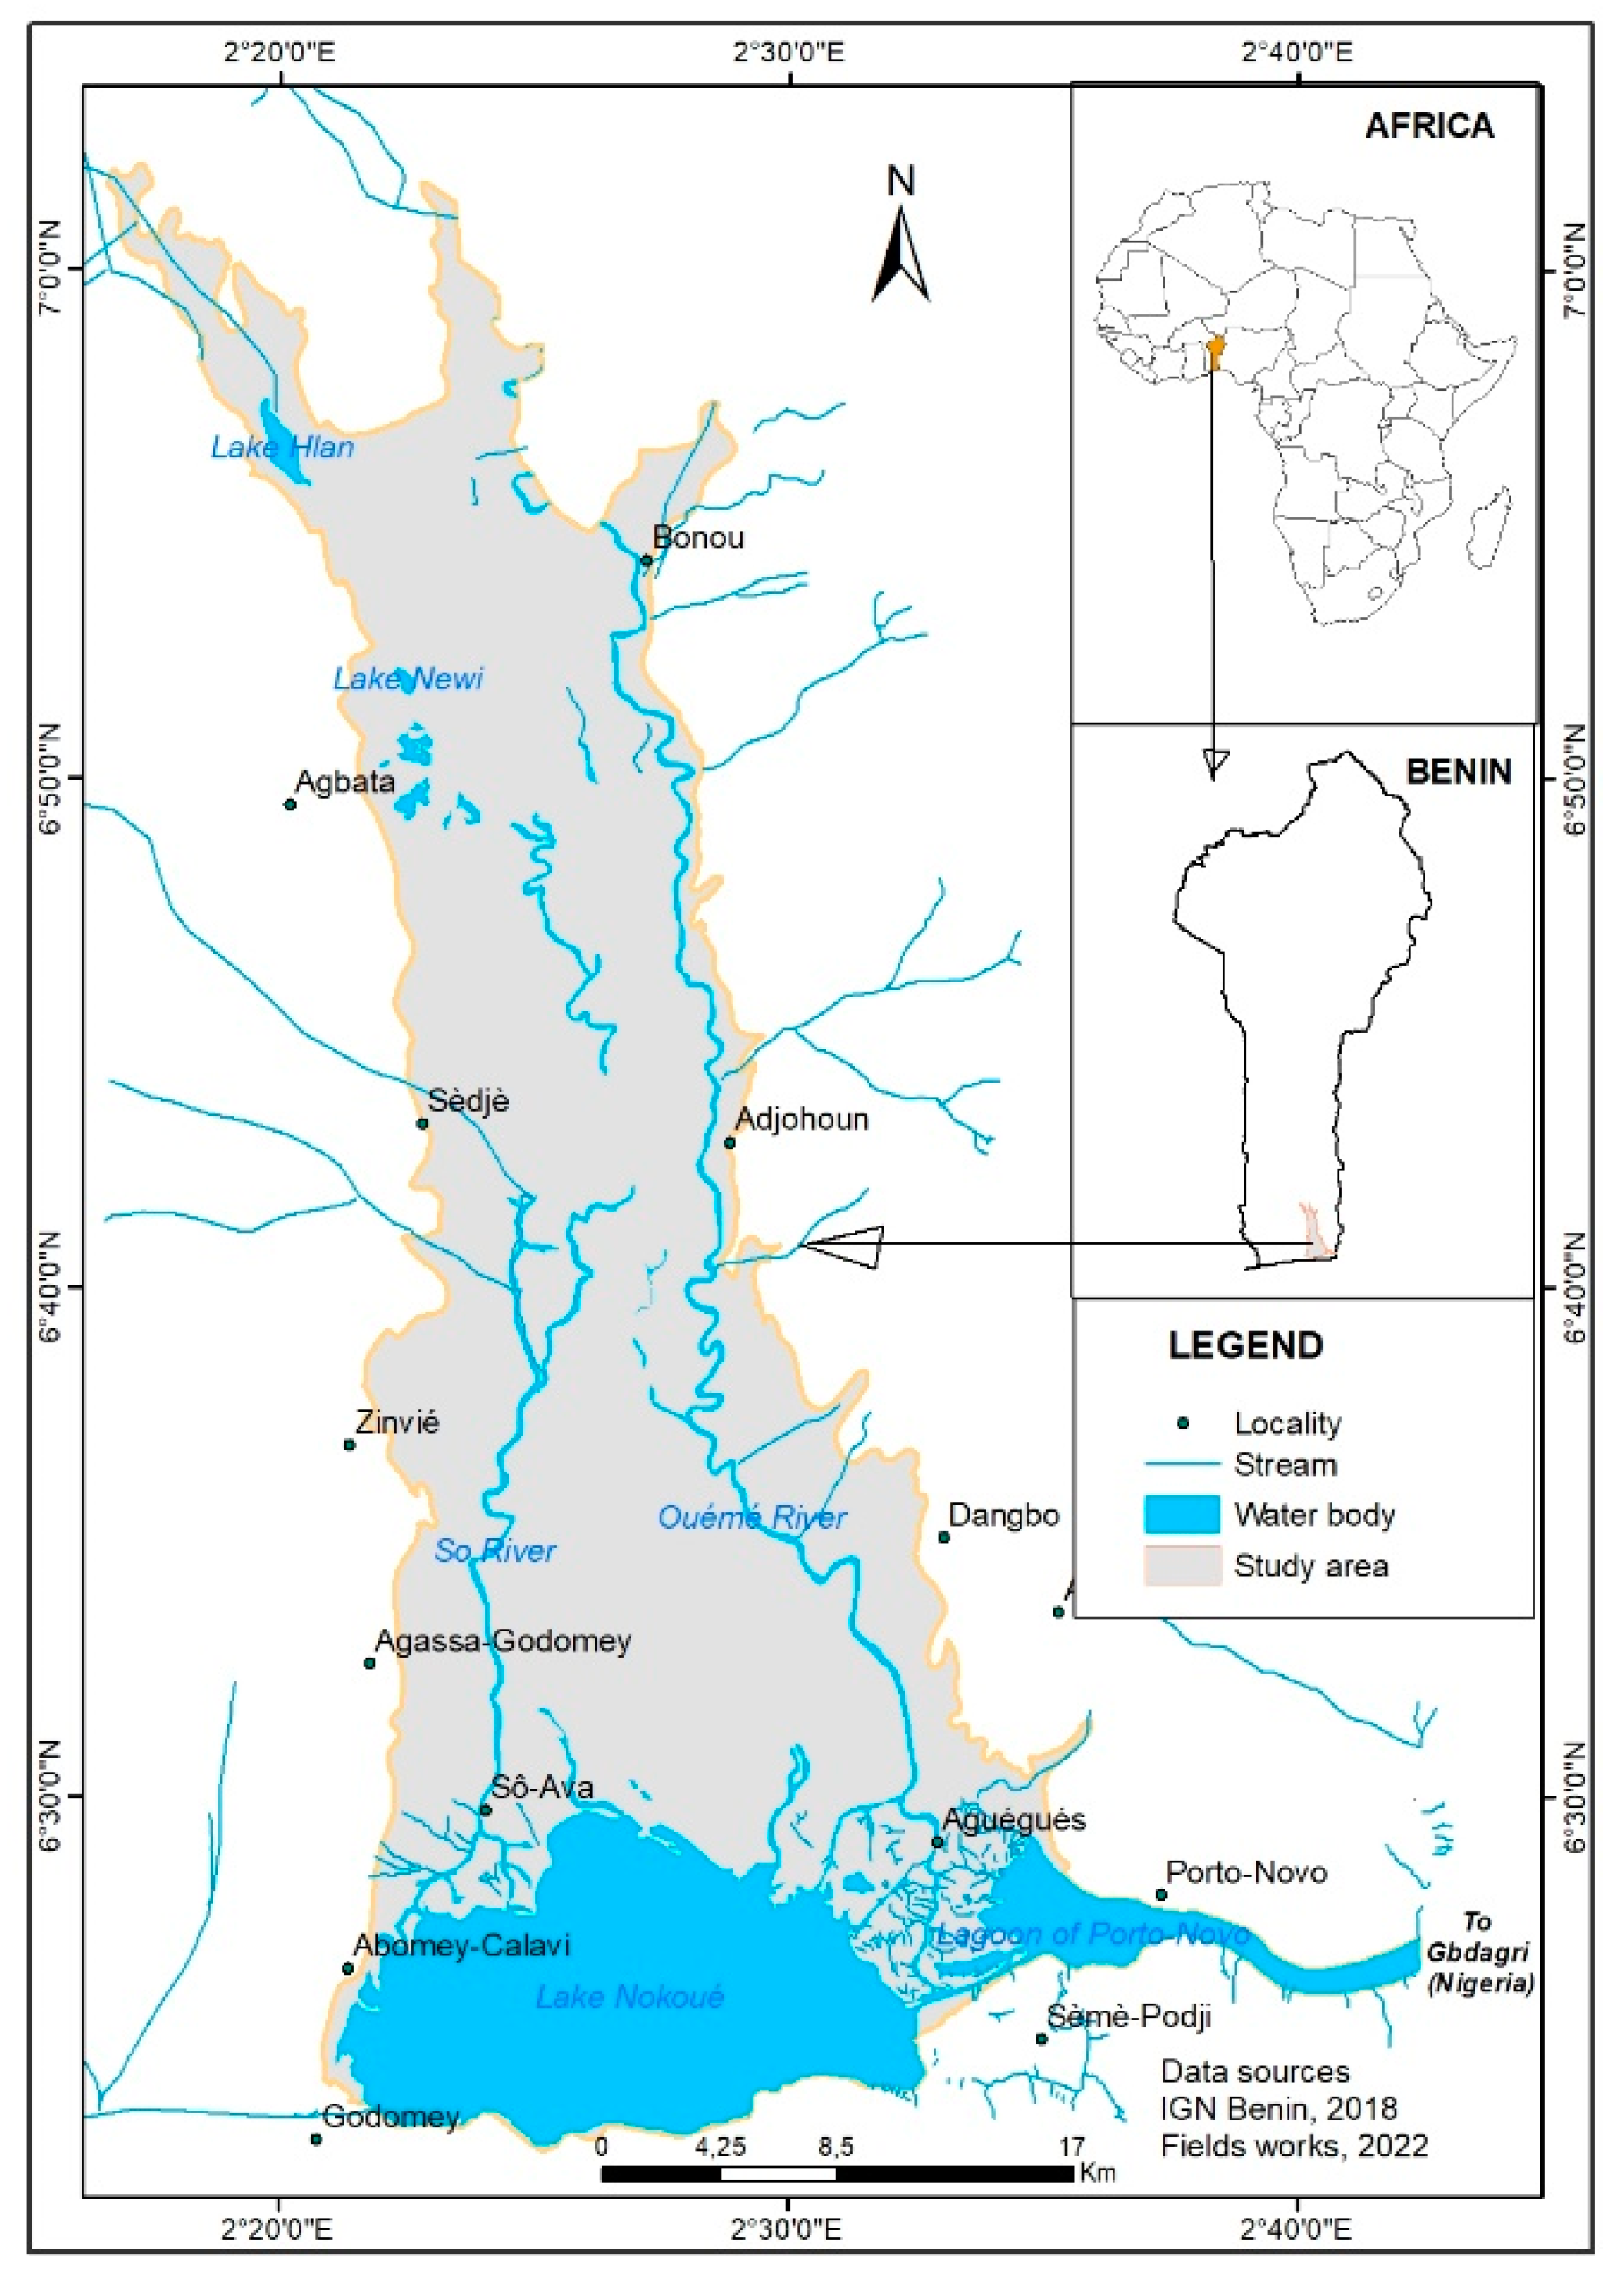
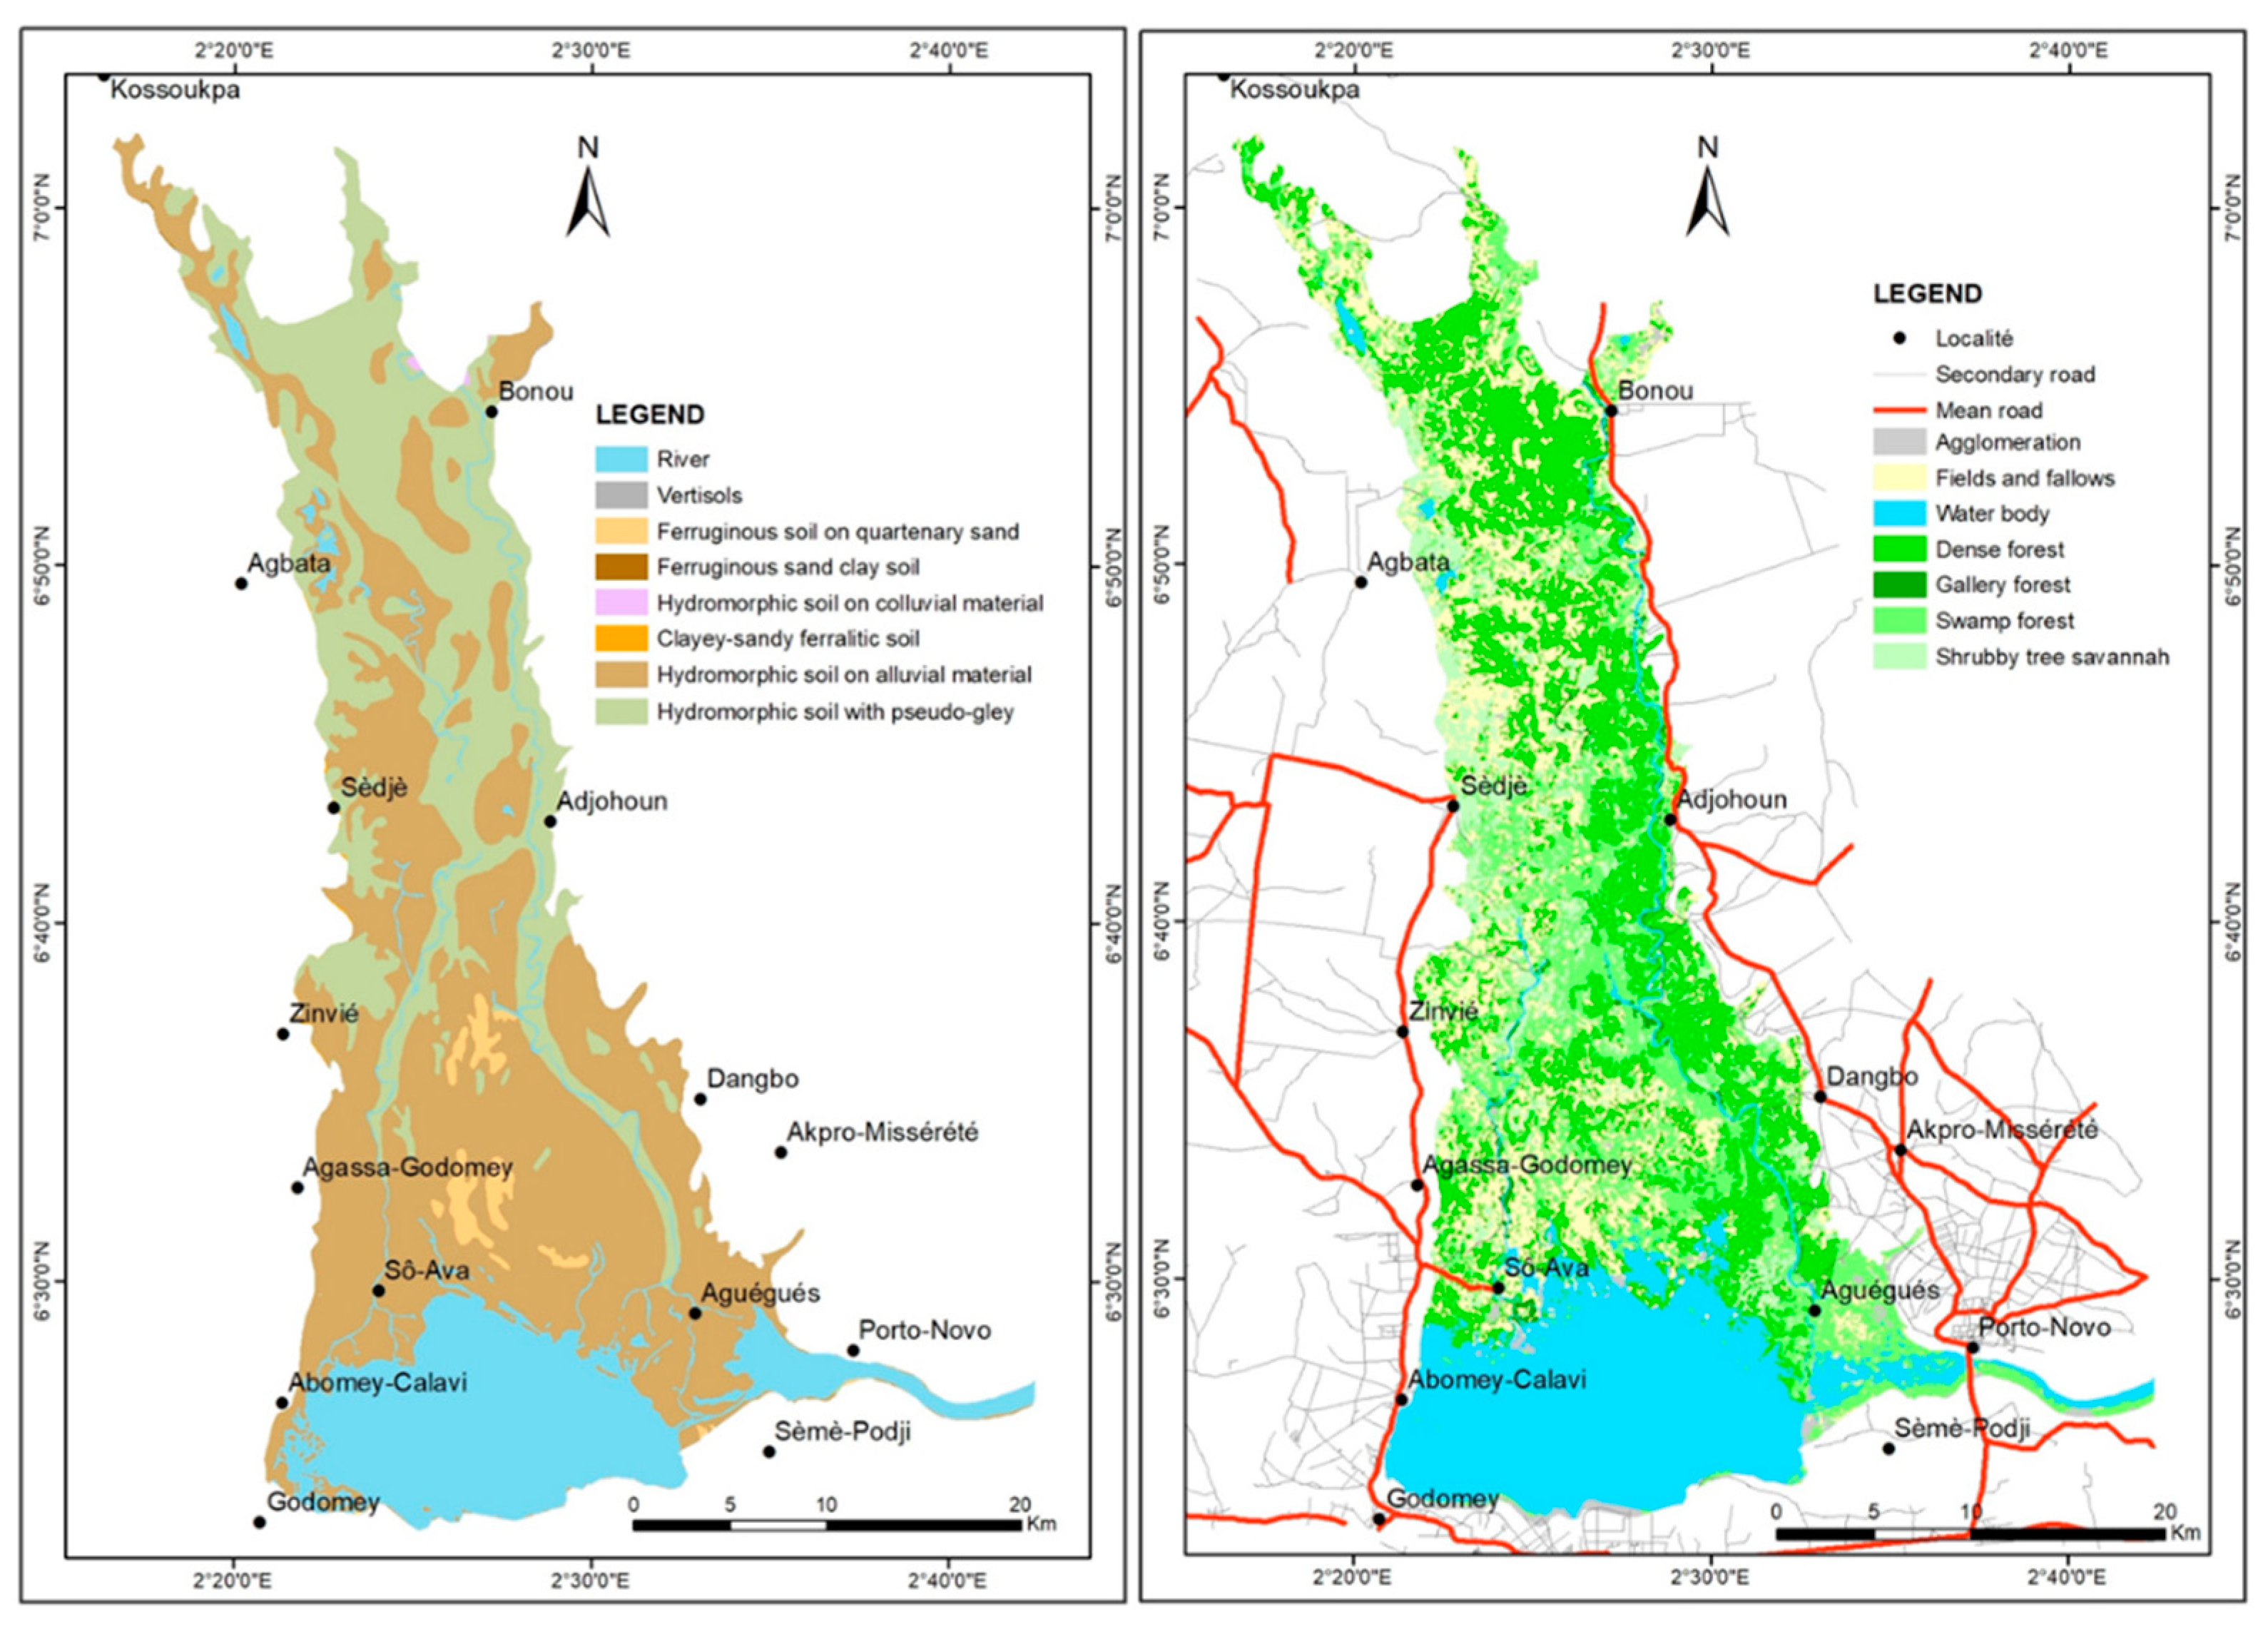
2.1. Study Area

The Ouémé Delta is located in southeast of Benin between latitudes 6°25’N and 7°20’N and longitudes 2°15’E and 2°35’E (Figure 1). The delta covers an area of approximately 9000 km2 [1], which expands according to the seasons and other climatic events. In the framework of this study, and although the flood area varies according to the season, we located the limits with the dwellers’ assistance. Calculations gave a flood area around 10,230 km2.
The soil of the Ouémé Delta is soft, sedimentary ground with little accentuated relief, which favors the spreading and the wandering of waters, erosion, and alluvial soil deposits that extend over 90 km to its outlet in the lake and lagoon areas (Lake Nokoué and lagoon of Porto-Novo), which are separated from the Atlantic Ocean by a coastal strip [1]. The Delta belongs to the Guineo-Congolian phytochorological region, with an annual rainfall ranging from 900 to 1300 mm, two rainy seasons, and two dry seasons [34]. The hydrographic system of the Ouémé Delta is made up of a confluence formed with the Zou in the north from which it has established a floodplain. Downstream of this confluence, the river runs along exposed land to the east, leaving only the floodplains to the west. The Sô River, which stems from Lake Hlan, flows parallel to the Ouémé to Lake Nokoué. This space is shared by the municipalities of Abomey-Calavi, Cotonou, Sèmè-Podji, Porto-Novo, Bonou, Adjohoun, Dangbo, Aguégués, Sô-Ava, Zogbodomè, Toffo, and Zè, whose estimated population is 1,571,290 inhabitants [35]. The vegetation consists of swamp forests, dense and gallery forests, tree and shrub savannahs, and agroecosystems [36]. The main activities generating income in the study area are agriculture, fishing, animal husbandry, hunting, logging, wood and plant collection, sand extraction, and the processing of agricultural products [2]. The absence of regulation in such activities represents the most important cause of degradation of the Ouémé Delta ecosystem.

2.2. Data and Methods Used to Assess the Dynamics of Vegetation Cover in the Ouémé Delta

The study of the dynamics of the vegetation cover in the Ouémé Delta was carried out by combining several data sources. Thus, the topographic maps of southern Benin on the scale of 1/200,000 were explored to geolocate the frame of reference and identify the environmental drivers in the study area. Then, the Landsat satellite images available via open access were examined to select the scenes 191–56 and 192–55 over three periods, namely, 1990 (TM), 2005 (ETM+), and 2020 (OLI), in order to extract the land use classes and areas. These images were chosen according to the dry season period to limit phenological contrasts [37,38]. There is a need to highlight that using spectral variables of remote-sensing data, particularly medium spatial resolution imagery, has a long history [39], and studies based on medium-resolution images should not be seen as less important since their outputs serve various comparative studies. In addition to these imagery data, field surveys were carried out for sampling and validation of the mapping procedure.
The processing of the satellite images was performed in several steps, including a pre-processing, which took into account the assembly of the scenes covering the limits of the Ouémé Delta in the form of a mosaic. Since the study area covers two scenes of Landsat imagery, it was necessary to construct a mosaic. Thus, in order to maintain uniform illumination conditions on the scenes assembled before interpretation, an enhancement was made [40]. A photo-interpretation was undertaken after the preprocessing in order to determine the land use classes by creating digital layers of control points on the image. Then, colored compositions in true colors were computed by combining the appropriate bands based on the type of image. The colored composition in true colors was chosen to make the images realistic because of the strong knowledge of the study environment. At this step, the radiometric values of the pixels eased the identification of the land cover classes, confirmed by the digital layer of control points recorded in the field. The supervised classification of the image followed this step, performed with the use of the Maximum Likelihood algorithm, which is based on the principle of calculating the probability of a pixel belonging to a given class. A total of seven land cover classes were discriminated with reference to the land cover classification from the national forest inventory [36]. For each of these classes, training plots were delimited according to the size of the classes, with a random distribution throughout the study area. Then, a ground-truth mission was established from a sampling of 30 points per class for the validation of the classification. A confusion matrix was generated to assess the quality of the classification regarding its overall accuracy and according to Kappa statistics. Specifically, Kappa values are categorized into four groups: less than 0.40, which is a weak agreement; from 0.41 to 0.60, meaning moderate agreement; between 0.61 and 0.80, representing substantial agreement; and greater than 0.80, meaning strong agreement [28]. The Kappa coefficient is also widely used for the validation of image processing [41]. In other words, the family of Kappa indices of agreement are used to compare a map’s observed classification accuracy relative to the expected accuracy of baseline maps that can have two types of randomness (random distribution of the quantity of each category and random spatial allocation of the categories), and the use of the Kappa indices has become common practice in remote sensing and other fields [42]. Image processing was performed using Envi software package 5.3. Finally, the data from the digital processing were vectorized and exported to Arcmap package 10.7 to be integrated into the Geographical Information System (GIS), where the plant cover and the other land use units were mapped. The extraction of the appropriate areas then followed.

2.3. Analysis of the Dynamics of the Vegetation Cover in the Ouémé Delta from 1990 to 2020

The evolution of the plant cover in the Ouémé Delta was described by comparing the areas of the types of plant formations identified and discriminated for each of the satellite images for the period of 30 years from 1990 to 2005 and 2005 to 2020. The changes in areas observed regarding the vegetation and other land cover units have been highlighted by the transition matrix, which translates the forms of conversion that each land cover class has undergone between two dates. The transition matrix consists of x rows and y columns, in which the transformations are from rows to columns. The number x of rows of the matrix indicates the number of classes present at date t1, while the number y of columns of the matrix indicates the number of classes converted at date t2. As for the diagonal, it provides information on the area classes that have remained unchanged over time. The different matrices were obtained from the overlapping of the maps of 1990–2005, 2005–2020, and then 1990–2020. Finally, a comparison was made between the average areas of the landscape classes and the number of corresponding polygons to assess the process of change in the vegetation cover during the observation period.
To better ascertain the causes of the spatial dynamics of vegetation cover in the Ouémé Delta from 1990 to 2020, explanatory variables were used [43,44]. These variables are of two types: static variables, which are stable over time, and dynamic variables, which change over time. The static and dynamic variables often used are distances to roads, waterways, slopes and altitudes, type of soil, population density, road density, and building density [45]. In the framework of this study, the type of soil was considered as a static variable to explain the accessibility and expansion of agricultural land, while the densification of the road network from topographic backgrounds between 1993 and 2018 was the dynamic variable that served to show the effect of the proximity of large agglomerations on the perimeter of the Ouémé Delta [46]. The soils were used as parameters because Badin et al. (1955) [47] proved that the soils of the lower Ouémé valley are humid and have good chemical and biological fertility. Regarding the road network, its consideration was due to the fact that its densification is a consequence of urbanization [48]. It promotes the opening up of production areas while strengthening economic exchanges.

2.4. Prediction of Future Changes in Vegetation Cover in the Ouémé Delta by 2035

The analysis of future changes in vegetation cover in the Ouémé Delta was based on predictive modelling. Several models exist for that purpose, among which the “Land Change Modeler” (LCM) model, which is available through the IDRISI software package 17.0, was tested for the study of changes in land occupation or use [49]. In the context of the present study, the scenario predicted for 2035 constitutes the stability of the areas of vegetation cover or, in the best case, their increase. Thus, the model was first calibrated from previous cartographic data (1990 and 2005) in order to simulate land use in the Ouémé Delta in 2020. Furthermore, the calibration helped improve the concordance of the outputs of the model with the data for adjustments on the parameters considered in the model [50]. The outputs of this simulation were compared to the mapping of land cover observed in the same year and obtained from the supervised classification. Then, the surface areas of the simulated land cover classes were compared with those observed from a chi-square (χ2) test at 0.05 level of significance to assess the similarity with the classification results of the 2020 reference map [42]. The strong correlation between the surface areas of the simulated and observed land cover classes was the only condition that made it possible to validate the model and compute the simulation for 2035.
The modeling process was divided into four modules which were used for the quantitative estimation of transitions, probabilities, distribution of changes, and reproduction of landscape characteristics. Thus, initially, the reference maps (2005 and 2020) were imported into the IDRISI software to determine the probabilities of change in the land cover classes in 2035. After this step, the number of land use classes of the reference maps has been clarified to facilitate their automatic comparison and to determine the probable transitions. Then, the integration of the explanatory variables was performed on the basis of the available data. These are soil types and distances to roads and built-up areas that are among the determining factors of the anthropization of the delta [51]. Finally, thanks to the linking and combination of explanatory factors and changes that have occurred between the two reference maps (2005–2020), the model produces, via a statistical method, probability maps of potential changes projected over the next fifteen years. These probability maps were generated by the neural network by combining a transition map with the explanatory variables of these changes [52]. The areas considered by each type of transition are quantified by examining whether or not they belong to the same class on the two reference dates; then, the changes are localized in order to generate a predictive land cover map. This step was carried out by using a cellular automaton that simulates the previously identified changes and allocates them in space.
There is a need to highlight that although the Land Change Modeler has some limitations, it remains a strong scientific tool that is highly used to simulate the changes in land cover. For instance, Leta et al. (2021) [42] applied it to assess the spatiotemporal dynamics of upper Nil basin by analyzing Landsat images. Moreover, Anand and Oinam (2020) [53] predicted the land cover of Manipur River basin (around 5063 km2) based on the same method. In a rapidly urbanizing south China, Hasan et al. (2020) [48] recently applied the same method to assess the land use change for the years 2005, 2010, and 2017. In addition to the studies reported above, many years ago, Václavík and Rogan (2009) [54] applied the Land Change Modeler to assess the land cover change in a study area of 5012 km2, which is significantly less than the surface of Ouémé River Delta. All these studies confirm that the model is deeply applicable to our research. In other words, these studies show the scientific validation of our method despite relatively small surface.

3. Results

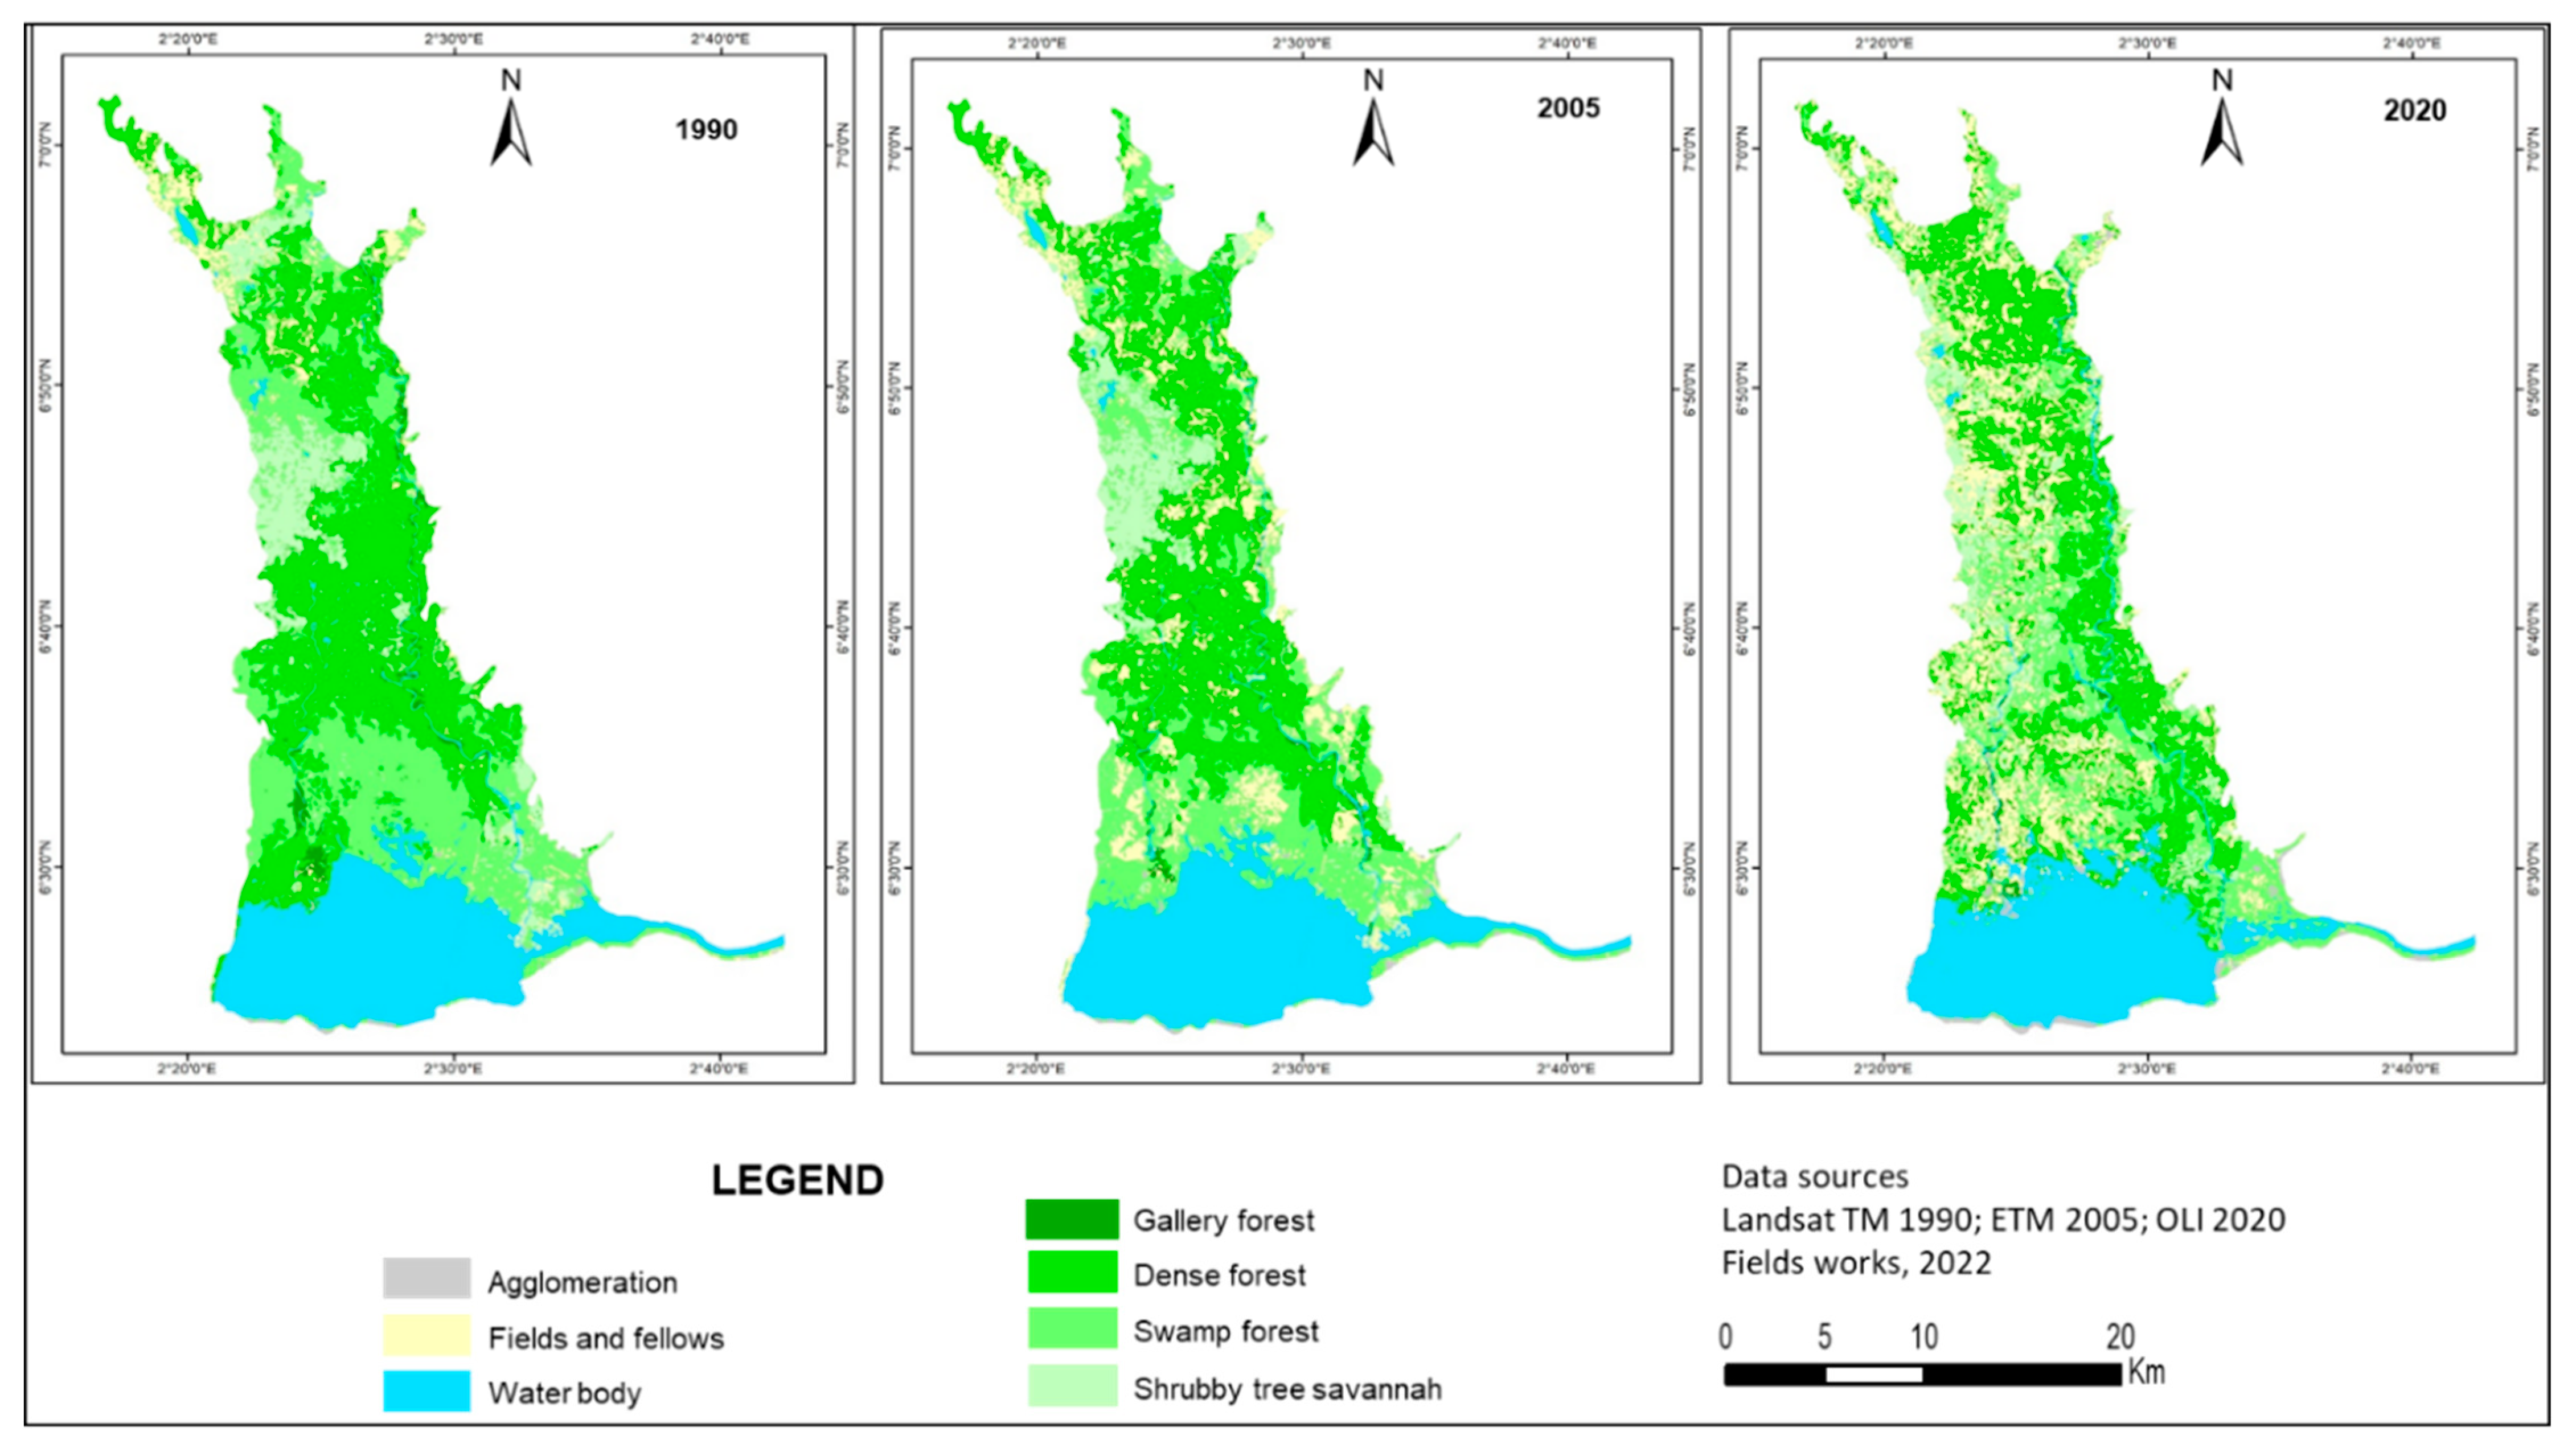
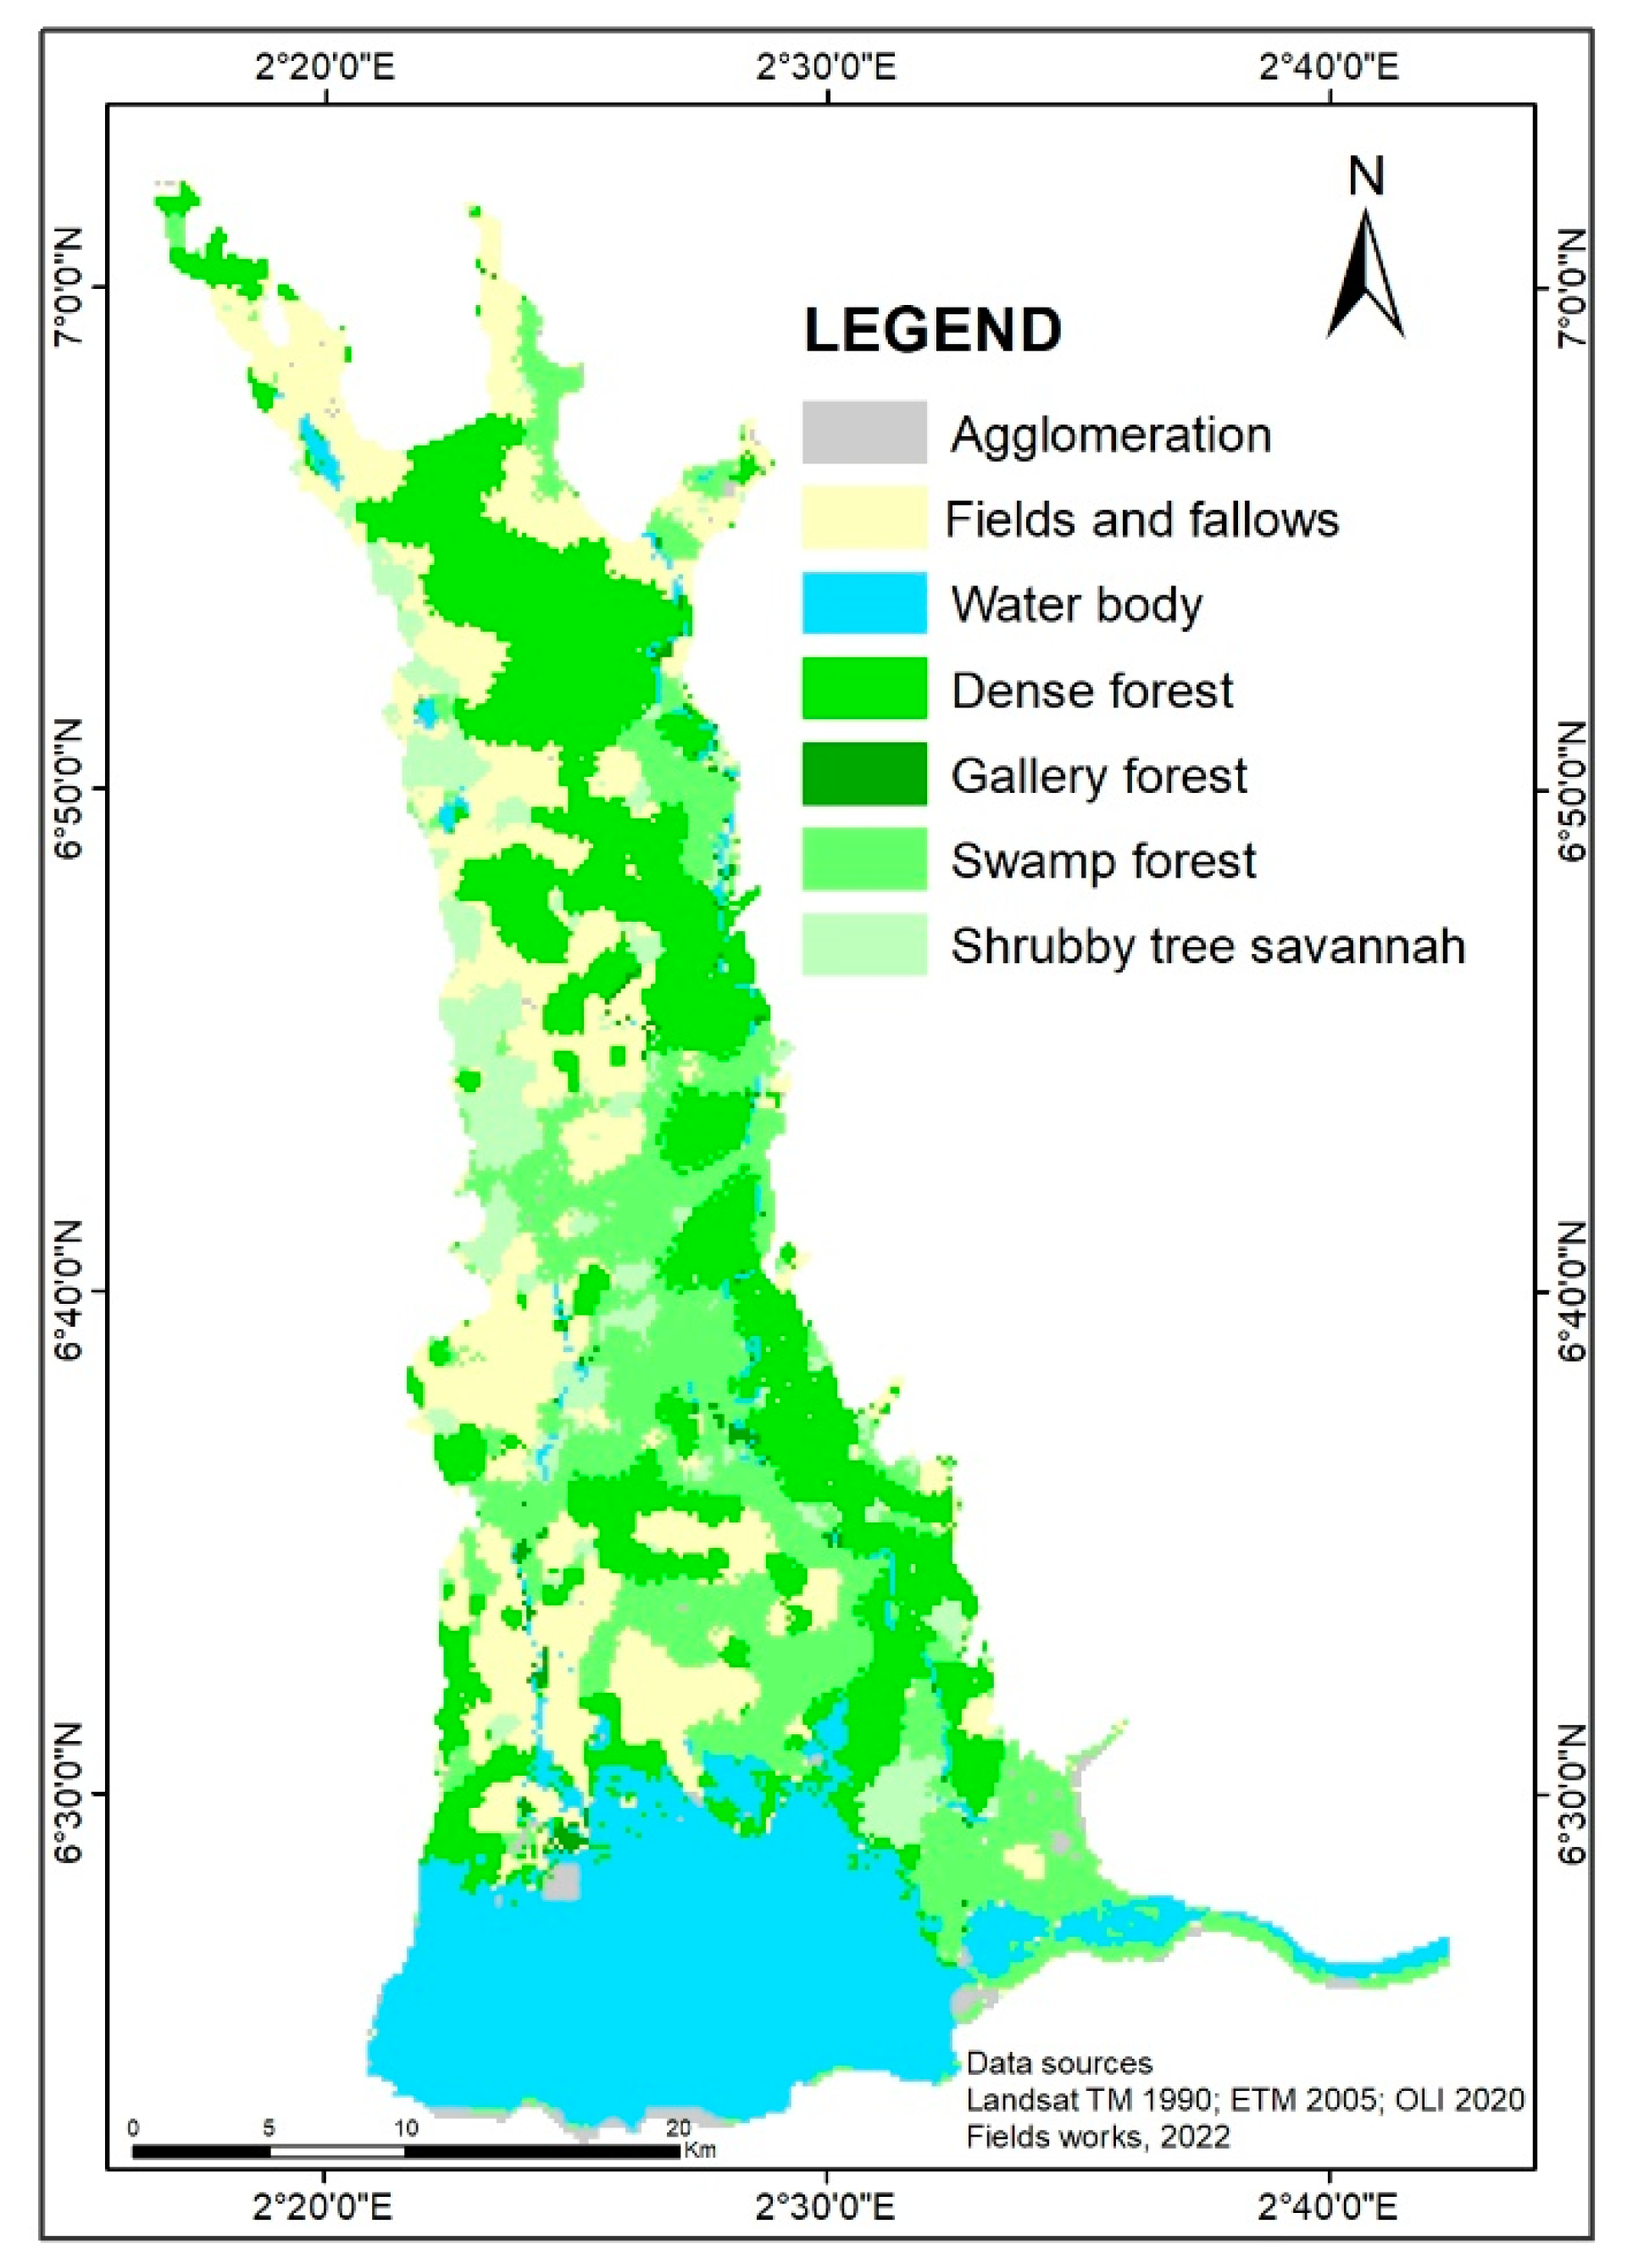
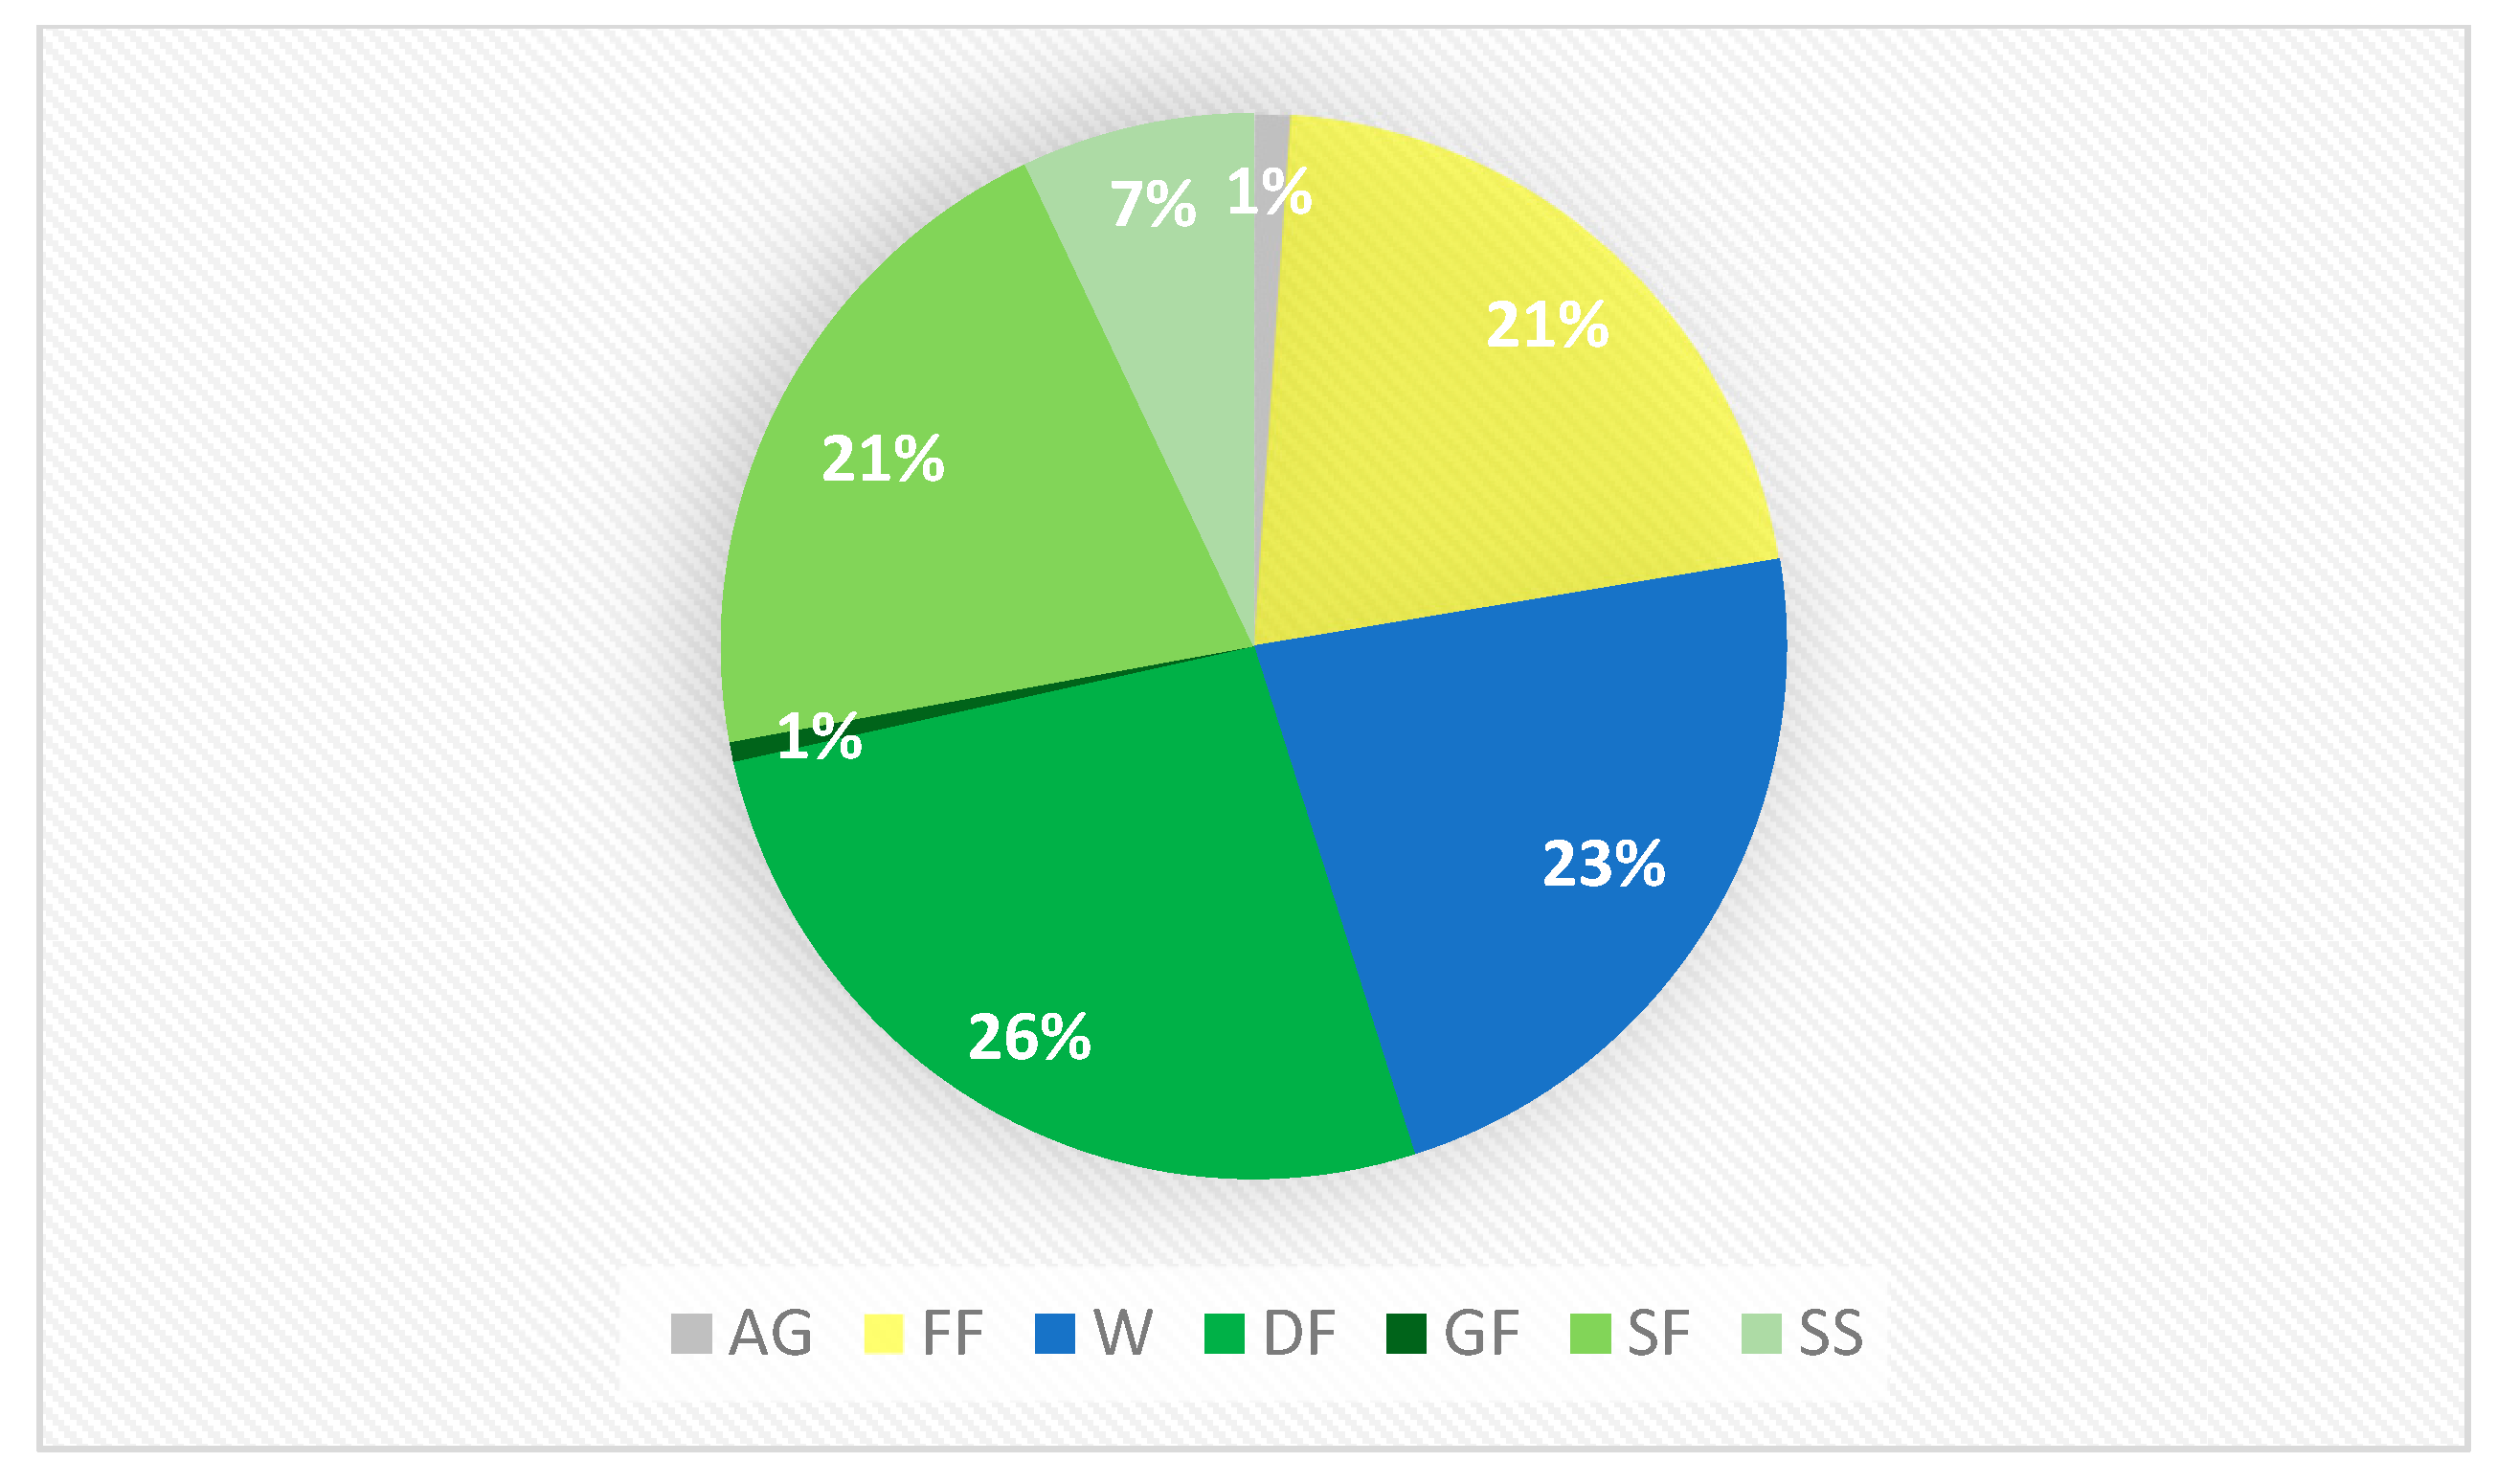
3.1. Mapping of the Dynamics of the Vegetation Cover in the Ouémé Delta from 1990 and 2020

The mapping of the vegetation cover dynamics in the Ouémé Delta carried out from the supervised classification of Landsat images from the years 1990, 2005, and 2020 revealed that the kappa values and the global precision, i.e., the overall image classification accuracy, were 0.84 and 88.95%, respectively, for 1990 (Table 1). These kappa statistics and the classification accuracy derived from the generated confusion matrices. Similarly, these values were 0.86 and 89.82% for 2005, while the image processing of 2020 exhibited 0.86 for the kappa index and a slightly more improved value of 90.17% for the overall accuracy. These statistics confirmed that the quality of the classification was ideal for the three years of observation.
This first finding allows for the mapping of the dynamics of the vegetation cover in the Ouémé Delta (Figure 2). This map highlights seven (07) distinct classes of occupation and land use such as agglomerations; mosaics of fields, fallow land, and water bodies; and natural vegetation types comprising dense forests, gallery forests, swamp forests, and shrubby wooded savannahs. The analysis of the different maps indicates a morphological change in all land cover units over the observation period. With regard to the plant cover, it occupied a large part of the surface area of the Deltaic zone in 1990 but has been infiltrated by fields and fallow land, represented by spots whose size increased considerably between 2005 and 2020.
In fact, statistics from the different analyses (Figure 3) indicate that in 1990, dense forests covered the largest area and extended over 33,768.9 ha, representing 33.1% of the total delta area. They were followed by the swamp forests with 29,291.2 ha (28.63%) and the waterbody that covered 51,584.2 ha (23.64%). The other classes of land cover in the same year were shrubby wooded savannas with 9017.08 ha (8.81%), mosaics of fields and fallows with 4395.84 ha (4.3%), gallery forests with 1116.12 ha (1.09%), and settlements with 537.5 ha (0.53%). In terms of spatial dynamics, all natural formations have regressed over the observation period. Thus, dense forests decreased to 29.39% in 2005, and then to 26.15% in 2020. Regarding the swamp forests, they decreased to 25.94% in 2005 and 21.36% in 2020. Tree and shrub savannahs decreased to 7.72% in 2005 and 7.01% in 2020. Similarly, gallery forests decreased to 0.69% in 2005, and then to 0.67% in 2020. The greatest losses were recorded for swamp forests (7.27%) and dense forests (6.86%). On the other hand, the water body remained almost stable, while the areas of mosaics of field and fallow lands together and agglomerations increased by 7.59% and 1.12%, respectively, in 2005, and then by 8.56% and 1.42% in 2020. We note from this description that the vegetation cover represented 71.55% of the surface area of the Ouémé Delta in 1990, while it decreased to 63.42% in 2005 and 55.19% in 2020, representing a loss of 16.37% of the area of natural formations over a period of 30 years.

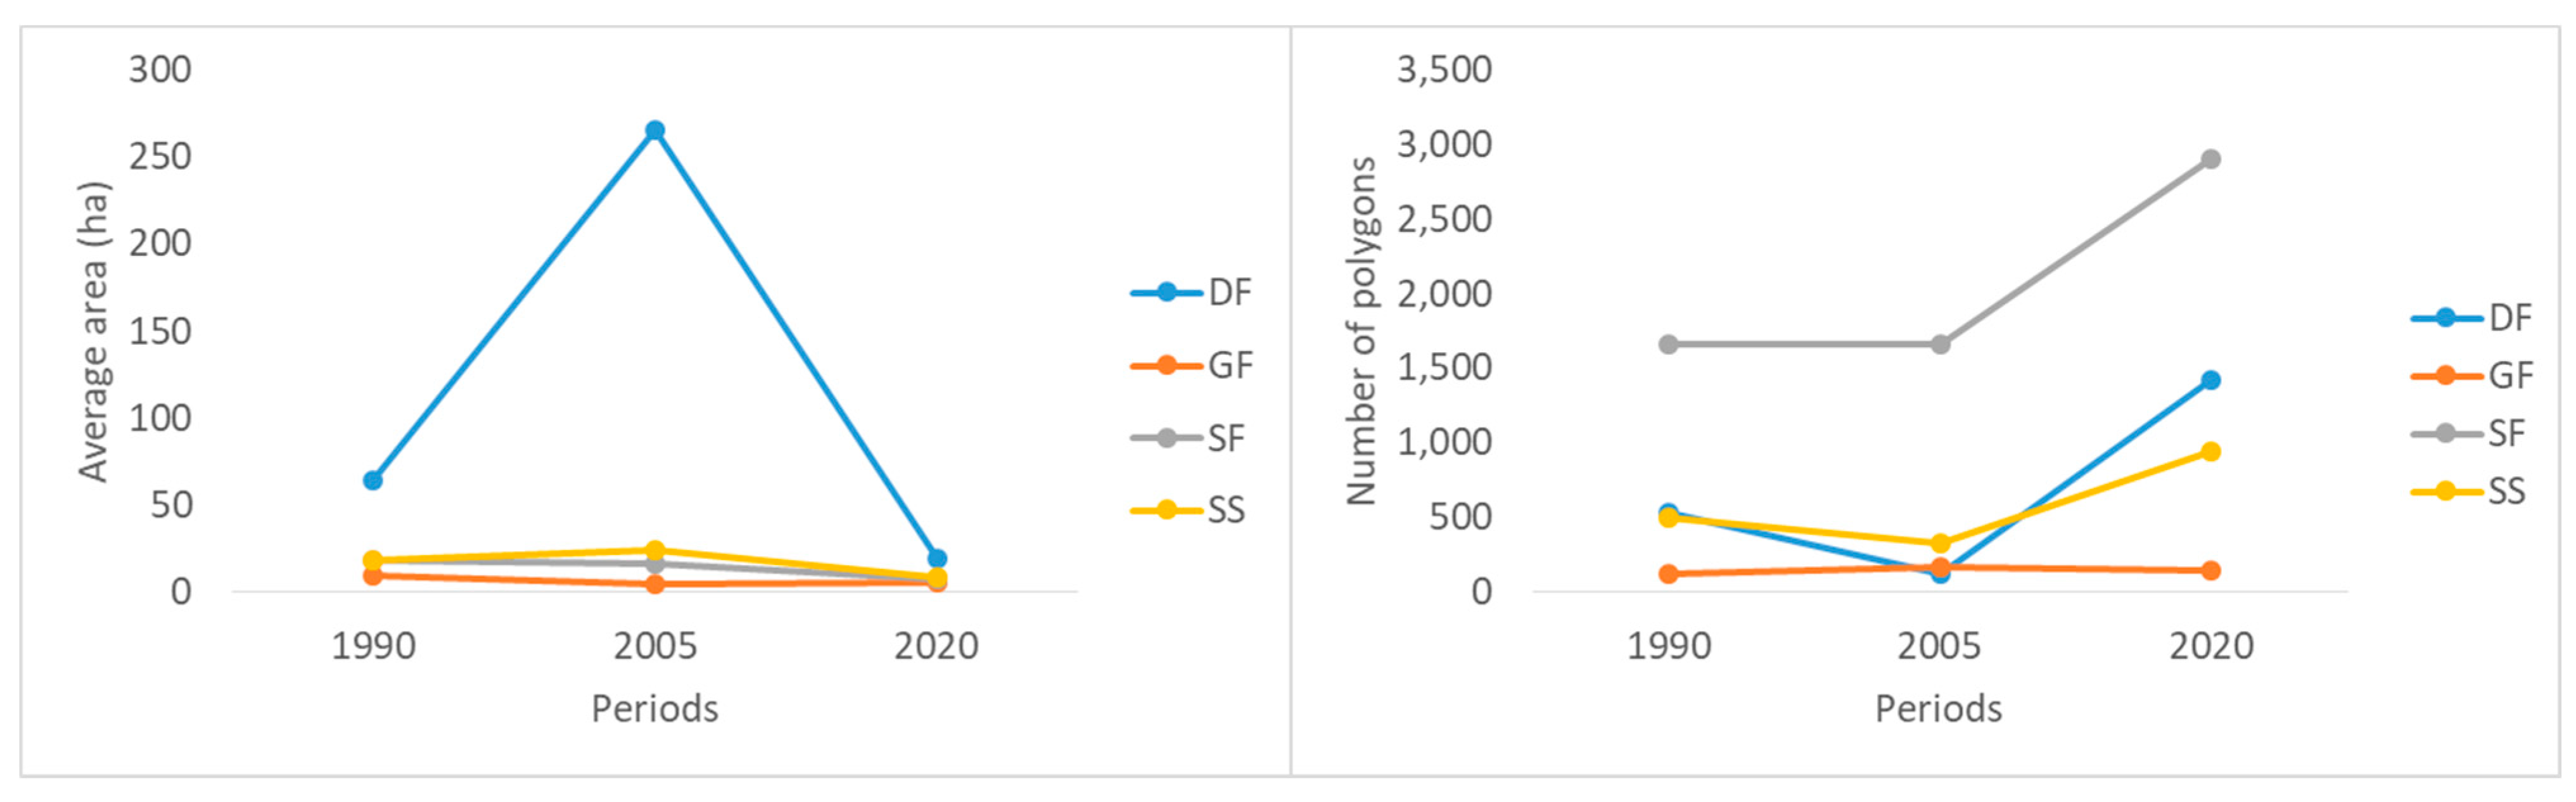
3.2. Analysis of the Transformations of the Vegetation Cover in the Ouémé Delta from 1990 to 2020

The spatial transformations that the types of natural formations have undergone in the Ouémé River Delta and the proportions of areas that have remained stable are described in this section. Thus, the statistics from the transition tables for the entire observation period (1990–2020) revealed that the areas of all land cover classes changed over time, with an average conversion rate of 7.96% per class. During this period, the cumulative gains and losses of land cover units (Table 2) revealed a 20.08% increase against a 35.68% loss, while 44.22% of the areas remained stable. However, this overall trend varied over time. Moreover, between 1990 and 2005, the cumulative gains and losses of the statistics highlighted in Table 3 exhibited an average spatial conversion rate of 2.98%, resulting from 6.47% progression and 14.40% regression, which is indicative of a high degree of stability of the areas of approximately 79.12%. On the other hand, during the period from 2005 to 2020, significant spatial changes were noticed in the landscape, with a 30.65% loss and 23.84% gain in area against 45.50% stability (Table 4). The average spatial conversion rate of 7.78% proves the rapid transition in the vegetation landscape of the Ouémé Delta. We also noted that the mosaics of fields and fallows have clearly increased in area in contrast to plant formations. Specifically, the vegetation cover decreased fairly between 1990 and 2005, before declining between 2005 and 2020.
Concerning the mode of conversion of the plant cover, the analysis of the evolution of the average area of the classes and the number of polygons per class according to the observation periods are shown in Table 5. Specifically, the average area and the number of polygons per class does not vary in the same way over the period. From 1990 to 2005, while these two variables increased for the agglomerations and the mosaics of fields and fallow land, then for the shrubby tree savannahs, they exhibited different trends in the other types of land cover, which is indicative of fragmentations as small areas are glued together to show a low average area. Similarly, between 2005 and 2020, agglomerations, mosaics of fields and fallow land, dense forests, swamp forests, and shrubby wooded savannahs showed an increasing number of polygons while their average surface area decreased. Specifically, the mode of conversion of natural formations (Figure 4) shows that between 2005 and 2020 there was a decline in the average area of dense forests, swamp forests, and tree-shrub savannahs as their number of polygons increased. The considerable increase in polygons at the level of dense forests is the consequence of the strong anthropization observed between 2005 and 2020 in the environment, which created many openings in the closed formations. This indicates that the spatial dynamics are characterized by the fragmentation of these three vegetation types over the past fifteen years.

3.3. Drivers of the Dynamics of the Vegetation Cover in the Ouémé Delta

Several factors shape the plant dynamics in the Ouémé River Delta, of which the proximity of roads and the type of soil seem to play a potential role. These factors induced the expansion of socio-economic activities. In other words, urban development and agriculture were identified as the main factors causing the anthropization of the natural formations throughout the Ouémé Delta. Furthermore, the road network around the Ouémé Delta in 1993 was 1,119.13 km long, which increased to 2,055.76 km in 2018, representing an 83.66% increase in a period of 25 years. This indicates a densification of the roads, especially the secondary roads that provide access to the fertile lands in the delta and connect the farming lands (Figure 5). Similarly, the overlapping of the soil type and land use maps shows hydromorphic soils on alluvial and pseudo-gley material with a large area and 94.87% of habitats consisting of wooded-shrub savannahs and 94.92% consisting of mosaics of fields and fallows in 2020. The analysis also indicates that it is on these two types of soil that the intensity of the changes was noticeable from 1990 to 2020. The proximity of the roads and the type of soil are, therefore, key factors determining the spatial dynamics of the vegetation cover in the Ouémé Delta during the recent 30 years.

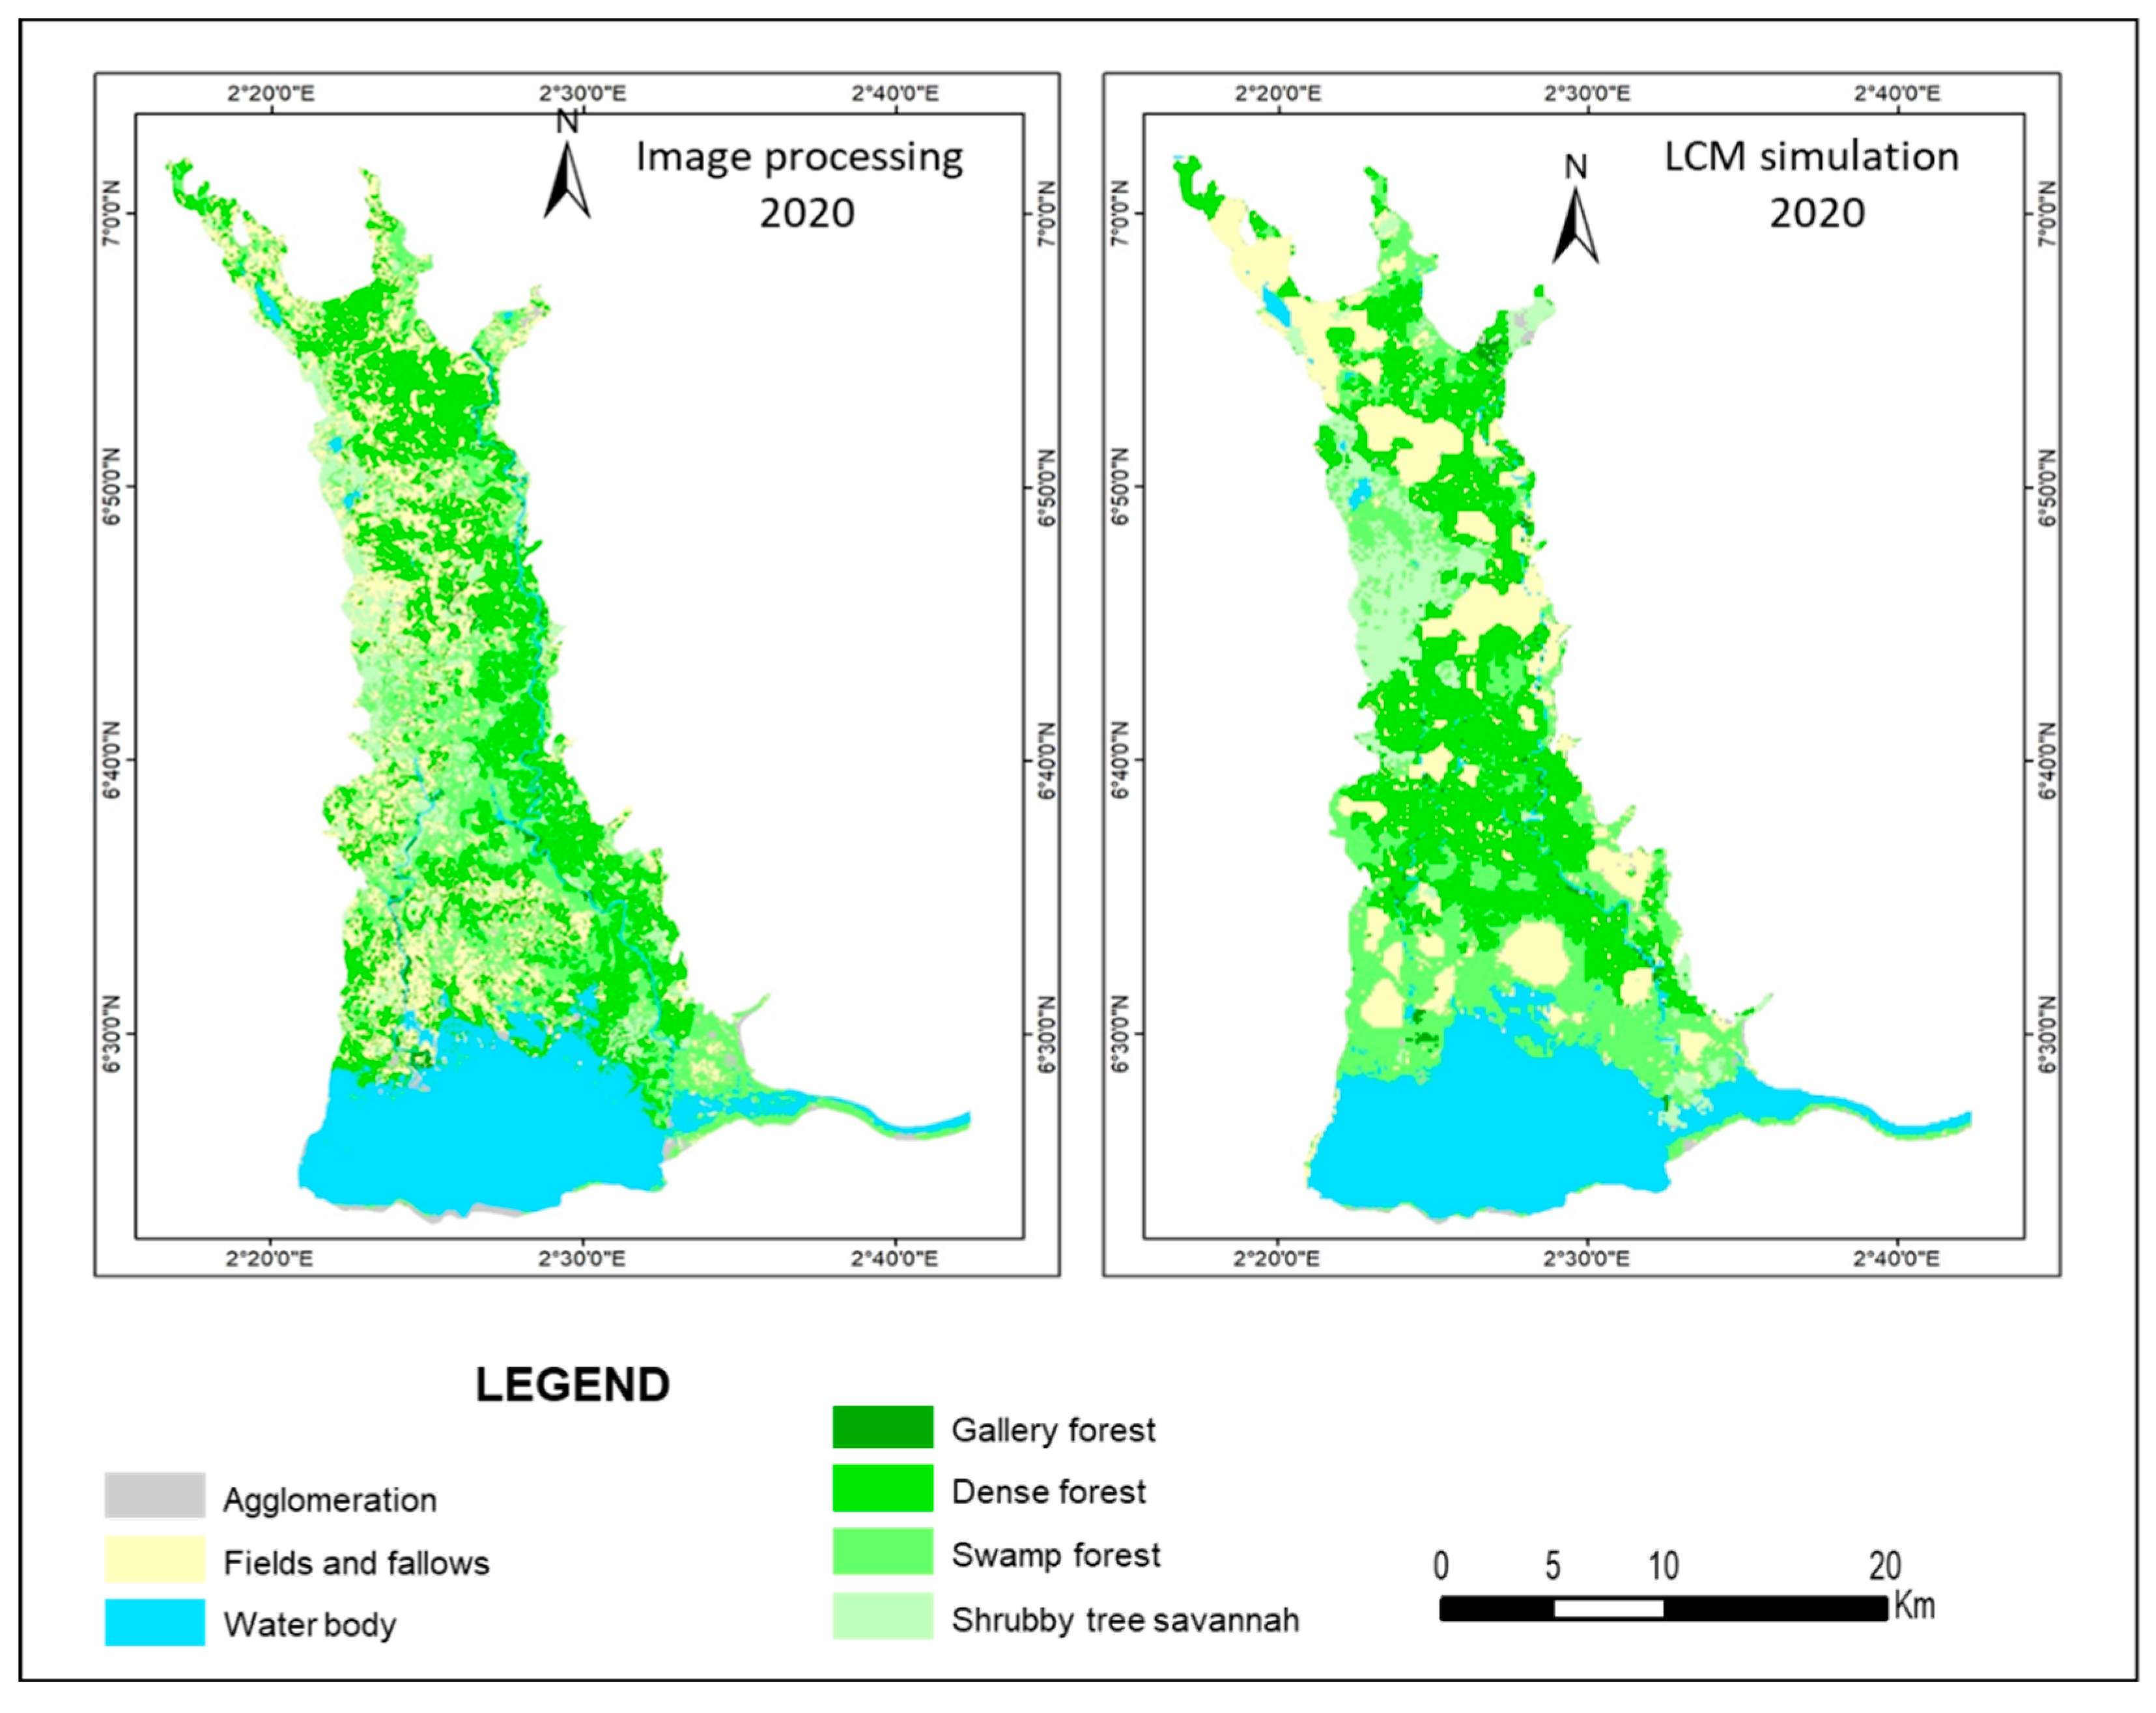
3.4. Predictive Mapping of Vegetation Cover in the Ouémé Delta by 2035

Prior to the predictive mapping, a simulation was computed for the 2020 land cover in order to compare it to the processed image of the same year. The accuracy of this test served as a basis for the validation of the model used and to predict the land cover in the year 2035. Thus, Figure 6 shows a map comparing the land cover resulting from image processing of 2020 and a simulation applied from the previous images (1990 and 2005). According to the transition matrices in Table 2 and Table 3, the vegetation cover was well-maintained between 1990 and 2005 before degrading considerably between 2005 and 2020. Regarding the 2020 simulation developed from images from 1990 and 2020, it was normal to notice this trend of maintaining dense forests in the simulation. This justifies the difference observed between classification and simulation, showing mosaic of fields and fallows with aggregation of their classes. However, the areas of these two analyses (Table 6) were quite similar, even if the highest dissimilarity was 3.16%, which was the case for fields and fallows. The Chi Square test performed—due to the relatively low number of land use units (7)—to assess the similarity between the image processing and modeling of the vegetation cover in 2020 reveals a high degree of significance (p < 0.0001). This served to validate the model and justify its use for the prediction of the vegetation cover in 2035.
Based on this test of the model, the simulation of the landscape in the Ouémé Delta by 2035 predicts the maintenance of the seven land cover classes (Figure 7). Thus, the model indicates a decrease in the area of gallery forests by 0.08% and that of swamp forests by 0.53%. As for dense forests and shrubby savannahs, an increase in their areas of 0.26% and 0.05%, respectively, is predicted. Meanwhile, dense forests, swamp forests, mosaics of fields and fallows, and the water body. Each of these classes will have an area estimated at more than 20% of the Delta’s area. In addition, all the natural formations will extend to approximately 55% of the total area of the Delta (Figure 8). The small variation in area predicted for 2035 indicates the possible stability of the vegetation cover since the probabilities of change associated with all classes were less than 0.5. These were 0.38 for dense forests, 0.12 for gallery forests, and 0.25 for swamp forests and shrubby wooded savannas (Table 7).

4. Discussion

4.1. Spatial Configuration of the Vegetation Cover in the Ouémé Delta from 1990 and 2020

It is important to highlight that the availability of satellite images was important for the present study. However, the assessment of the accuracy of the processing of these images was also fundamental for the validation of the mapping procedure. The kappa index and the overall precision used to meet this requirement are recommended decision parameters in all studies using spatial remote-sensing data [55]. Thus, the high values that emerge from these two parameters after image processing come from a certain number of prerequisites, including the quality of the images and the high level of light contrast obtained in image parameterization [42]. In addition, knowledge of the study area and the relatively small number of land cover classes have facilitated the achievement of good performance in the overall accuracy of image classification [56].
Although seven classes of land use have been identified in the Ouémé Delta (agglomerations, fields and fallow land, bodies of water, dense forests, gallery forests, swamp forests, and shrubby tree savannah), it is possible to increase the number of land cover classes to provide more details on the landscape sub-entities. For example, for future studies, scientists can identify mangroves, plantations, and bare soil, All of them sub-entities proposed in certain land cover typology studies in West African wetlands [27,57]. However, this entails risks of class confusion that can weaken the accuracy of mapping [28]. These risks are inherent at the low resolution of the images used (28.5 m), which constitutes a spatial detail-level constraint in remote sensing [58]. However, the description of land cover obtained in this study relates to that used by Houeto et al. [59] and Brun et al. [29] in the Ramsar 1018 wetland, where the Ouémé Delta is included. The vegetation cover thus described, comprising dense forests, gallery forests, swamp forests, and shrubby wooded savannahs, is characteristic of wetlands [60], which dominated the landscape of the Delta in 1990. This vegetation cover in the Delta declined until the year 2020. This represents a loss of vegetation cover and, therefore, biological diversity in the Delta over a period of 30 years, which was influenced by fragmentation and mutations. These factors have been mentioned as causes of loss of vegetation cover in other studies [30,61]. All dense forests, swamp forests, and shrubby wooded savannahs have undergone these changes, which are induced by the high demand for agricultural land [62]. This is a spatial hazard corresponding to the anthropization of natural formations described by Abdus et al. [63]. Moreover, a similar observation was made in several studies on land use, which confirmed the regression of vegetation cover into farms and fallows [29,64,65].

4.2. Analysis of the Causes and Manifestations of the Vegetation Cover Dynamics in the Ouémé Delta

The degradation of the vegetation landscape in the wetlands south of the Sahara is often caused by the anthropization process generated by urbanization and economic activities [66]. As the Ouémé Delta is an area of sediment accumulation, it is coveted for its fertile land, forest resources, and the fish wealth of its water bodies [67]. It thus generates many socio-economic activities that maintain life in the neighboring village communities [68]. Unfortunately, these activities are not controlled, leading to the overexploitation of natural resources, including plant cover [69]. This explains the increasing pressure on plant formations that fragment or turn into fields and fallow land [10]. Among the factors that better explain these changes, the proximity of the roads and the soil type have proven to be decisive with respect to the information collected in the field. Moreover, the mapping and superposition of these variables confirmed their level of influence on the localization of landscape changes. The region’s hydromorphic soils on alluvial and pseudo-gley material occupy a large area and constitute the support of the wooded shrub savannahs. These fertile soils, which are increasingly in demand by populations for agriculture, explain the fragmentation and replacement of plant formations by agriculture [61]. At the same time, the road network developing around the delta facilitates the density of production activities and the exploitation of in situ resources [68]. Added to this is the rapid demographic growth in the communities bordering the delta, which are among the most populated in Benin [35]. This leads to pressure on resources; the expansion of agglomerations, fields, and fallow land; and the loss of plant formations [70]. In other words, this pressure is generated by increasing urbanization in the region through the development of income-generating activity areas, the emergence of agricultural product markets, and their connections [71,72]. Thus, there is a need to increase awareness among the inhabitants regarding the sustainable management of the delta’s resources. Elsewhere, the drivers of land cover change in Central and Eastern Europe were reported to be a decreased need for intensive agriculture, the shift to the ecological management of forested areas, and increasing urbanization [66]. While assessing the land use and land cover of the Marikina sub-watershed in the Philippines, Abino et al. [73] reported significant changes indicated by the increase in agricultural area, whereas forests and grasslands remained unchanged.

4.3. Predictive Mapping of the Vegetation Cover in the Ouémé Delta

The successful management of space requires the development of a management plan based on territorial forecasting [62]. Predictive mapping offers the possibility of considering probable land uses in the future in order to plan for resource sustainability [69,74]. Such an approach has been implemented in the Ouémé Delta for the reconstitution of land cover between 1990, 2005, and 2020, in order to predict that of 2035. The LCM model used for this purpose was seen as statistically effective [16]. It is important to highlight that the application of the LCM model does not necessary require the use of linear or non-linear analysis depending on the number of land use units obtained.
This test was necessary to better calibrate the model so as to obtain a future projection as close as possible to reality [25,66], and the reliability of the land cover prediction in the present study lies in the level of satisfaction of the comparison of the simulation with the classification of 2020. Thus, the land cover obtained for 2035 indicates that vegetation will cover approximately 55% of the total area of the delta, similar to 2020. This indicates the probable stability of the vegetation cover in the future. However, gallery forests and swamp forests will continue to lose their area, but at a very slow rate of decline and with the stability of their vegetation. This scenario will only be possible when population growth is controlled [29] along with the intensity of socioeconomic activities [75]; such assumptions require a fairly rigorous and skillfully designed strategic policy. Similarly, it would be necessary to apply sustainable resource management measures in the study area [76], as non-timber forest products collected from the wild by local populations [77] and even herbaceous species exploited for medicinal purposes require sustainable management and the application of conservation tools [13].
Our study is the first to be undertaken on the Ouémé River Delta, even though the area has always been highly exploited for various purposes. It is supposed to motivate many other studies on this ecosystem as reported throughout the paper. We are confident that the use of these medium-resolution Landsat satellite images offers the advantage of letting any scientist interested by such studies check and verify our results and learn more about the application of the Land Change Modeler. These are medium-resolution images that provide essential information on the land use change in the region. This publication will further motivate high-resolution image studies so that a comparison can be performed to ascertain likely differences. In fact, Xu et al. [78] stated the great significance of using remote-sensing data to understand the interactive coupling mechanism between urbanization and eco-environmental quality so as to achieve the goal of urban sustainable development; thus, the outputs of the present research are innovative since they will also contribute to sustainable development goals. Studies of vegetation cover, land use change, and the predictive analysis of vegetation serve to determine the areas that are in need of the definition of suitable mitigation measures and strategies towards the sustainable management of wetlands [73]. Regarding all these examples, predictive studies on vegetation constitute a potential decision tool.

5. Conclusions

This research reveals that the vegetation cover in the Ouémé Delta is made up of dense forests, gallery forests, swamp forests, and wooded and shrubby savannahs. These ecosystems, which were dominant in 1990, have regressed spatially and over time under the influence of anthropogenic pressure. The modes of class conversion were dominated by fragmentation, which was especially accentuated between 2005 and 2020. The main cause of this process was the demographic growth around the Delta, which led to the development of extensive agriculture, thus precipitating the loss of vegetation cover in favor of mosaics of fields and fallow land. Faced with this situation, a territorial forecast developed through a simulation of the future dynamics of land use in the study area revealed a decrease in the rate of progression of the mosaics of fields and fallow land and the probable stability of the region’s vegetation cover. This future trend remains a simulation and will only be realistic if natural resource conservation efforts are made by stakeholders. In this context, this study can serve as pioneer research and can motivate many other investigations, which will result in the wider characterization of the potential regarding biodiversity and ecological connectivity in the Ouémé Delta from the perspective of sustainable exploitation. Further studies in the Delta can focus on the following topics:
1.
The phytosociological study of the various plant formations;
2.
Developing an inventory of the woody species of the various plant formations and the dendrometric characteristics of the main species;
3.
Constructing an inventory of fertility indicator species along the Ouémé Delta;
4.
The investigation of medicinal and food species that are protected in agricultural lands;
5.
Developing a database on the ecosystem services provided by the Ouémé River Delta.
With regard to the last point, the authors suggest investigating the ethnomedicinal and food uses of the plants collected from the plant formations of the delta as well as the medicinal and food uses of snails, mushrooms, and other non-timber forest products in the delta. Awareness projects on the importance of conserving natural ecosystems and, therefore, biological diversity are required for the inhabitants of the Ouémé Delta.

Author Contributions

A.A.O.: is the originator of this research, wrote the proposal and submitted it for validation, and oversaw data collection, analysis, and article writing. H.O.D.-Y.: contributed to the proposal validation by providing editing and technical proposals and contributed to data analysis, article writing, and submission as corresponding author. G.H.F.G.: contributed to the proposal validation, article writing, and editing. T.O.L.: contributed to the proposal validation, the article writing, and editing. B.S.: Head and supervisor, gave the final approval of the research proposal and read, edited, and approved the final version of this paper before its submission. All authors have read and agreed to the published version of the manuscript.

Funding

This research received no external funding.

Data Availability Statement

All data used in the framework of this research are available throughout the paper. However, all authors confirm their availability to provide any technical assistance in the framework of similar investigations no matter where they would be undertaken.

Acknowledgments

The authors are grateful to the local farmers, fisherman, herdsmen, and hunters who indicated the former limits of the Delta. They are also thankful to the scientists working at the United States Geological Studies (USGS) for the satellite images made available online by this institute. Phil Harris (a retired Professor from Coventry university, UK) is thanked for his valuable comments and editing of this paper.

Conflicts of Interest

The authors declare no conflict of interest.

References

  1. Colombani, J.; Sircoulon, J.; Moniod, F.; Rodier, J. Monographie du Delta de l’Ouémé; ORSTOM: Paris, France, 1972; 591p. [Google Scholar]
  2. Azonnakpo, O.V.; Azonnakpo, J.P.; Agbossou, E.K.; Aminou, T. Inventaire des activités menées dans le Delta de l’Oueme et sources de pollution de l’eau. Int. J. Progress. Sci. Technol. 2020, 20, 376–390. [Google Scholar]
  3. Xu, T.; Weng, B.; Yan, D.; Wang, K.; Li, X.; Bi, W.; Li, M.; Cheng, X.; Liu, Y. Wetlands of international importance: Status, threats, and future protection. Int. J. Environ. Res. Public Health 2019, 16, 1818. [Google Scholar] [CrossRef] [PubMed] [Green Version]
  4. Gbénou, P. Evaluation Participative du Système de Riziculture Intensive dans la Basse Vallée de l’Ouémé au Bénin. Ph.D. Thesis, de l’Université d’Abomey-Calavi, Cotonou, Bénin, 2013; 214p. [Google Scholar]
  5. Alimi, R.M.; Gbedomon, R.C.; Bekpa-Kinhou, A.M.; Biaou, C.; Egboou, P.B. Etude de Base Pour la Formulation de Projet Sur L’élevage Transhumant Dans la Basse et la Moyenne Vallée de l’Ouémé (Corridor Bénin-Nigéria); Rapport D’étude: Bénin, Nigeria, 2015; 112p. [Google Scholar]
  6. Udoka, U.P.; Opara, A.I.; Nwankwor, G.I.; Ebhuoma, O.O. Mapping Land Use and Land Cover in parts of the Niger Delta for Effective Planning and Administration. Int. J. Sci. Eng. Res. 2015, 6, 274–281. [Google Scholar]
  7. Adechina, R.A.; Kelome, N.C.; Chouti, W.; Hounkpe, J.B.; Randriana, N.R.F. Fractionnement géochimique des éléments traces métalliques (Etm) dans les sédiments du Delta de l’Ouémé au Bénin. Eur. Sci. J. 2018, 14, 358–371. [Google Scholar] [CrossRef] [Green Version]
  8. Khloud, A.; Enar, A.A.; El Baroudy, M.S.; Shokr, A.; Menoufia, J. Assessment and mapping land degradation in some areas of north Nile DeltaDelta, using new techniques. Soil Sci. 2021, 6, 265–274. Available online: https://mjss.journals.ekb.eg/ (accessed on 2 November 2022).
  9. Orimoloye, I.R.; Kalumba, A.M.; Mazinyo, S.P.; Nel, W. Geospatial analysis of wetland dynamics: Wetland depletion and biodiversity conservation of Isimangaliso Wetland, South Africa. J. King Saud Univ. 2020, 32, 90–96. [Google Scholar] [CrossRef]
  10. Thonfeld, F.; Steinbach, S.; Muro, J.; Hentze, K.; Games, I.; Näschen, K.; Kauzeni, P.F. The impact of anthropogenic land use change on the protected areas of the Kilombero catchment, Tanzania. J. Photogramm. Remote Sens. 2020, 168, 41–55. [Google Scholar] [CrossRef]
  11. Dossou-Yovo, H.O.; Vodouhè, F.G.; Sinsin, B. Ethnomedicinal survey of mangrove plant species used as medicine from Ouidah to Granp-Popo Districts, Southern Benin. Am. J. Ethnomed. 2017, 4, 1–6. [Google Scholar]
  12. Dossou-Yovo, H.O.; Kindomihou, V.; Vodouhè, F.G.; Sinsin, B. Assessment of the diversity of medico-magic knowledge on four herbaceous species in Benin. Sci. World J. 2021, 2021, 6650704. [Google Scholar] [CrossRef]
  13. Dossou-Yovo, H.O.; Vodouhè, F.G.; Kaplan, A.; Sinsin, B. Application of Ethnobotanical Indices in the Utilization of Five Medicinal Herbaceous Plant Species in Benin, West Africa. Diversity 2022, 14, 612. [Google Scholar] [CrossRef]
  14. Padonou, E.A.; Gbai, N.I.; Kolawole, M.A.; Idohou, R.; Toyi, M. How far are mangrove ecosystems in Benin (West Africa) conserved by the Ramsar Convention? Land Use Policy 2021, 108, 105583. [Google Scholar] [CrossRef]
  15. Zhu, Z.; Fu, Y.; Woodcock, C.E.; Olofsson, P.; Vogelmann, J.E.; Holden, C.; Wang, M.; Dai, S.; Yu, Y. Including land cover change in analysis of greenness trends using all available Landsat 5, 7, and 8 images: A case study from Guangzhou, China (2000–2014). Remote Sens. Environ. 2016, 185, 243–257. [Google Scholar] [CrossRef] [Green Version]
  16. Chen, J.M.; Ju, W.; Ciais, P.; Viovy, N.; Liu, R.; Liu, Y.; Lu, X. Vegetation structural change since 1981 significantly enhanced the terrestrial carbon sink. Nat. Commun. 2019, 10, 4259. [Google Scholar] [CrossRef] [PubMed] [Green Version]
  17. Ma, N.; Szilagyi, L.; Zhang, Y. Calibration-Free complementary relationship estimates terrestrial evapotranspiration globally. Water Resour. Res. 2021, 57, e2021WR029691. [Google Scholar] [CrossRef]
  18. Mandishona, E.; Knight, J. Inland wetlands in Africa: A review of their typologies and ecosystem services. Prog. Phys. Geogr. 2022, 46, 03091333221075328. [Google Scholar] [CrossRef]
  19. Marega, O.; Emeterio, J.L.S.; Fall, A.; Andrieu, J. Cartographie par télédétection des variations spatio-temporelles de la couverture végétale spontanée face à la variabilité pluviométrique au Sahel: Approche multiscalaire. Physio-Géo 2021, 16, 1–8. [Google Scholar] [CrossRef]
  20. Patil, S.D.; Gu, Y.; Dias, F.S.A.; Stieglitz, M.; Turk, G. Predicting the spectral information of future land cover using machine learning. Int. J. Remote Sens. 2017, 38, 5592–5607. [Google Scholar] [CrossRef] [Green Version]
  21. Murray, A.T. Advances in location modeling: GIS linkages and contributions. J. Geogr. Syst. 2010, 12, 335–354. [Google Scholar] [CrossRef]
  22. Kwan, C.; Gribben, D.; Ayhan, B.; Bernabe, S.; Plaza, A. An accurate vegetation and non-vegetation differentiation approach based on land cover classification. Remote Sens. 2020, 12, 3880. [Google Scholar] [CrossRef]
  23. Skidmore, A.K.; Coops, N.C.; Neinavaz, E.; Ali, A.; Schaepman, M.E.; Paganini, M.; Kissling, W.D.; Vihervaara, P.; Darvishzadeh, R.; Feilhauer, H.; et al. Priority list of biodiversity metrics to observe from space. Nat. Ecol. Evol. 2021, 5, 896–906. [Google Scholar] [CrossRef]
  24. Mohsen, M.; Ezzeldin, K.S.; El-Alfy, H.A.; Abdel-Gawad, M.; Abd-Elmaboud, E. Land Use Changes in the Eastern Nile Delta Region; Egypt Using Multi-temporal Remote Sensing Techniques. Int. J. Sci. Eng. Res. 2016, 7, 78–98. [Google Scholar]
  25. Wang, J.; Zhang, J.; Xiong, N.; Liang, B.; Wang, Z.; Cressey, E.L. Spatial and Temporal Variation, Simulation and Prediction of Land Use in Ecological Conservation Area of Western Beijing. Remote Sens. 2022, 14, 1452. [Google Scholar] [CrossRef]
  26. Weng, Q. Land use change analysis in the Zhujiang Delta of China using satellite remote sensing, GIS and stochastic modelling. J. Environ. Manag. 2002, 64, 273–284. [Google Scholar] [CrossRef] [Green Version]
  27. MCVDD (Ministère du Cadre de Vie et du Développement Durable). Plan D’aménagement et de Gestion de la Réserve de Biosphère de la Basse Vallée de l’Ouémé (RB-BVO); MCVDD: Cotonou, Bénin, 2020; 144p. [Google Scholar]
  28. Chalifoux, S.; Nastev, M.; Lamontagne, C.; Latirovic, R.; Fernandes, R. Cartographie de l’occupation et de l’utilisation du sol par imagerie satellitaire Landsat en hydrogéologie. Télédétection 2006, 6, 9–17. [Google Scholar]
  29. Brun, L.E.; Djego, J.G.; Gibigaye, M.; Tente, B. Dynamique de l’occupation du sol dans les zones humides de la commune d’Allada au Sud-Bénin (Sites Ramsar 1017 Et 1018). Eur. Sci. J. 2018, 14, 59–77. [Google Scholar] [CrossRef]
  30. Jaziri, B. Analyse cartographique et paysagère des transformations spatiales du couvert forestier des Mogods (Tunisie septentrionale). Physio-Géo 2020, 15, 1–27. [Google Scholar] [CrossRef]
  31. Nababa, I.I.; Symeonakis, E.; Koukoulas, S.; Higginbottom, T.P.; Cavan, G.; Marsden, S. Land cover dynamics and mangrove degradation in the Niger Delta region. Remote Sens. 2020, 12, 3619. [Google Scholar] [CrossRef]
  32. Venter, Z.S.; Barton, D.N.; Chakraborty, T.; Simensen, T.; Singh, G. Global 10 m Land Use Land Cover Datasets: A Comparison of Dynamic World, World Cover and Esri Land Cover. Remote Sens. 2022, 14, 4101. [Google Scholar] [CrossRef]
  33. Uchegbulam, O.; Ameloko, A.A.; Omo-Irabor, O.O. Effect of cloud cover on land use land cover dynamics using remotely sensed data of western Niger Delta, Nigeria. J. Appl. Sci. Environ. Manag. 2021, 25, 799–804. [Google Scholar] [CrossRef]
  34. Adomou, A.C. Vegetation Patterns and Environmental Gradients in Benin. Implications for Biogeography and Conservation. Ph.D. Thesis, University of Wageningen, Wageningen, The Netherlands, 2005; p. 135, ISBN 90-8504-308-5. [Google Scholar]
  35. INSAE (Institut National de la Statistique et de L’Analyse Economique). Effectifs de la Population des Villages et Quartiers de Ville du Bénin; RGPH 4, Rapport d’étude; INSAE: Cotonou, Bénin, 2016; 88p. [Google Scholar]
  36. DFRN (Direction des Forêts et Ressources Naturelles). Présentation Des Résultats de L’inventaire Forestier National; MAPS-DFS-CENATEL: Cotonou, Bénin, 2007; 28p. [Google Scholar]
  37. Justice, C.O.; Townshend, J.R.G.; Holben, B.N.; Tucker, C.J. Analysis of the phenology of global vegetation using meteorological satellite data. Int. J. Remote Sens. 1985, 6, 1271–1318. [Google Scholar] [CrossRef]
  38. Simonetti, E.; Simonetti, D.; Preatoni, D. Phenology-Based Land Cover Classification Using Landsat 8-Time Series; Technical Reports; Scientific and Technical Research Series; Publications Office of the European Union: Luxembourg, 2014; 57p. [Google Scholar]
  39. Izadi, S.; Sohrabi, H. Using Bayesian Kriging and satellite images to estimate above-ground biomass of Zagros mountainous forests. In Forest Resources Resilience and Conflicts; Elsevier: Amsterdam, The Netherlands, 2021; pp. 193–201. [Google Scholar]
  40. Leboeuf, A.; Samson, M.P.; Paquet, A. Guide d’interprétation des mosaïques d’images satellite Landsat. In Ministère des Forêts, de la Faune et des Parcs Secteur des forêts; Rapport d’étude; Partenariat Données Québec: Québec, QC, Canada, 2015; 22p. [Google Scholar]
  41. Pontius, J.R.G.; Millones, M. Death to Kappa: Birth of Quantity Disagreement and Allocation Disagreement for Accuracy Assessment. Int. J. Remote Sens. 2011, 32, 4407–4429. [Google Scholar] [CrossRef]
  42. Leta, M.K.; Demissie, T.A.; Tränckner, J. Modeling and prediction of land use land cover change dynamics based on Land Change Modeler (LCM) in Nashe Watershed, upper Blue Nile basin, Ethiopia. Sustainability 2021, 13, 3740. [Google Scholar] [CrossRef]
  43. Mas, J.F.; Perez-Vega, A.; Clarke, K.C. Assessing simulated land use/cover maps using similarity and fragmentation indices. Ecol. Complex 2012, 11, 38–45. [Google Scholar] [CrossRef]
  44. Gashaw, T.; Tulu, T.; Argaw, M.; Worqlul, A.W. Evaluation and prediction of land use/land cover changes in the Andassa watershed, Blue Nile Basin, Ethiopia. Environ. Syst. Res. 2017, 6, 17. [Google Scholar] [CrossRef] [Green Version]
  45. Maestripieri, N.; Paegelow, M. Validation spatiale de deux modèles de simulation: L’exemple des plantations industrielles au Chili. Cybergeo Eur. J. Geogr. 2022. [Google Scholar] [CrossRef]
  46. Mas, J.F.; Kolb, M.; Houet, T.; Paegelow, M.; Olmedo, M.T. Éclairer le choix des outils de simulation des changements des modes d’occupation et d’usages des sols. Une approche comparative. Rev. Int. De Géomatique 2011, 21, 405–430. [Google Scholar] [CrossRef]
  47. Badin, B.; Achimi, L.; Kodjia, L. Les Sols de la Vallée de l’Ouémé, Secteur Azohourissè et Bodjè; ORSTOM: Paris, France, 1955; 42p. [Google Scholar]
  48. Hasan, S.; Shi, W.; Zhu, X.; Abbas, S.; Khan, H.U.A. Future simulation of land use changes in rapidly urbanizing South China based on Land Change Modeler and Remote Sensing Data. Sustainability 2020, 12, 4350. [Google Scholar] [CrossRef]
  49. Mas, J.F.; Kolb, M.; Paegelow, M.; Olmedo, M.T.; Houet, T. Inductive pattern-based land use/cover change models: A comparison of four software packages. Environ. Model. Softw. 2014, 51, 94–111. [Google Scholar] [CrossRef] [Green Version]
  50. Pontius, R.G. Comparison of Categorical Maps. Photogramm. Eng. Remote Sens. 2000, 66, 1011–1016. [Google Scholar]
  51. Megahed, Y.; Cabral, P.; Silva, J.; Caetano, M. Land cover mapping analysis and urban growth modelling using remote sensing techniques in greater Cairo region. Int. J. Geo-Inf. 2015, 4, 1750–1769. [Google Scholar] [CrossRef] [Green Version]
  52. Mishra, V.N.; Rai, P.K. A remote sensing aided multi-layer perceptron-Markov chain analysis for land use and land cover change prediction in Patna district (Bihar). India Arab. J. Geosci. 2016, 9, 249. [Google Scholar] [CrossRef]
  53. Anand, V.; Oinam, B. Future land use land cover prediction with special emphasis on urbanization and wetlands. Remote Sens. Lett. 2020, 11, 225–234. [Google Scholar] [CrossRef]
  54. Václavík, T.; Rogan, J. Identifying trends in land use/land cover changes in the context of post-socialist transformation in central Europe: A case study of the greater Olomouc region Czech Republic. GISci. Remote Sens. 2009, 46, 54–76. [Google Scholar] [CrossRef] [Green Version]
  55. Sitthi, A.; Nagai, M.; Dailey, M.; Ninsawat, S. Exploring land use and land cover of geotagged social-sensing images using Naive Bayes Classifier. Sustainability 2016, 8, 921. [Google Scholar] [CrossRef] [Green Version]
  56. Barima, Y.S.S.; Assale, A.A.Y.; Vignal, M.; Andreieu, J.; Godron, M. Caractérisation post conflits armés des perturbations dans la forêt classée du Haut-Sassandra en Côte d’Ivoire. Afr. Sci. 2016, 12, 66–82. [Google Scholar]
  57. Mayaux, P.; Bartholome, E.; Massart, M.; Van Cutsem, C.; Nonguierma, A.C.; Diallo, O.; Pretorius, C.; Thompson, M.; Cherlet, M.; Pekel, J.-F.; et al. Carte de L’occupation du Sol de l’Afrique; Commission Européenne: Luxembourg, 2003; 54p. [Google Scholar]
  58. Desjardins, R.; Cavayas, F. Possibilités et limites des images satellites TM LANDSAT en matière d’occupation du sol: Le cas de Montréal (Québec). Cah. De Géographie Du Québec 1991, 35, 137–151. [Google Scholar] [CrossRef] [Green Version]
  59. Houeto, O.F.; Akpassonou, C.P.; Tete, R. Cartographie des Forêts Sacrées des Sites Ramsar 1017 et 1018 du Bénin. Rapport Avant-Projet d’étude pour la Restauration et de Gestion des Forêts Sacrées des Sites Ramsar 1017 et 1018 du Bénin; Rapport d’étude; ITTO: Cotonou, Bénin, 2013; 81p. [Google Scholar]
  60. Diedhiou, I.; Catherine, M.; Oumar, S.; Tidiane, S. Cartographier par télédétection l’occupation du sol et ses changements. EchoGéo 2020, 54. [Google Scholar] [CrossRef]
  61. Adade, R.; Nyarko, B.K.; Aheto, D.W.; Osei, K.N. Fragmentation of wetlands in the south eastern coastal savanna of Ghana. Reg. Stud. Mar. Sci. 2017, 12, 40–48. [Google Scholar] [CrossRef]
  62. Assoma, V.T.; Yao, N.A.; Dio, J.S.; Jourda, J.P. Apport de la télédétection et d’un SIG à la cartographie des changements de l'occupation du sol dans le bassin versant de la Lobo en Côte d'Ivoire. Physio-Géo 2021, 16, 107–126. [Google Scholar] [CrossRef]
  63. Abdus, S.; Xiangzheng, D.; Siqi, J.; Dongdong, C. Scenario-Based Simulation on Dynamics of Land-Use-Land-Cover Change in Punjab Province, Pakistan. Sustainability 2017, 9, 1285. [Google Scholar]
  64. Ayanlade, A.; Proske, U. Assessing wetland degradation and loss of ecosystem services in the Niger Delta, Nigeria. Mar. Freshw. Res. 2016, 67, 828–836. [Google Scholar] [CrossRef]
  65. Mamane, B.; Amdou, G.; Barrage, M.; Comby, J.; Ambouta, J.M.K. Dynamique spatio-temporelle d’occupation du dans la Réserve Totale de Faune de Tamou dans un contexte de la variabilité climatique (Ouest du Niger). Int. J. Biol. Chem. Sci. 2018, 12, 1667–1687. [Google Scholar] [CrossRef]
  66. Agbanou, T.; Paegelow, M.; Toko, T.; Tente, B. Modélisation des changements d’occupation des terres en Région soudanienne au Nord-Ouest du Benin. Eur. Sci. J. 2018, 4, 248–266. [Google Scholar]
  67. Chikou, A. Etude de la Démographie et de L’exploitation Halieutique de Six Espèces de Poissons-Chats (Teleostei, Siluriformes) dans le Delta de l’Ouémé au Bénin. Ph.D. Thesis, Université de Liège, Liège, Belgium, 2006; 459p. [Google Scholar]
  68. Langan, C.; Farmer, J.; Rivington, M.; Smith, J.U. Tropical wetland ecosystem services assessments in East Africa: A review of approaches and challenges. Environ. Model. Softw. 2018, 102, 260–273. [Google Scholar] [CrossRef]
  69. Dar, S.; Bhat, S.; Rashid, I.; Dar, S.A. Current Status of Wetlands in Srinagar City: Threats, Management Strategies, and Future Perspectives. Front. Environ. Sci. 2020, 7, 199. [Google Scholar] [CrossRef] [Green Version]
  70. Xu, Q.; Pguo, P.; Jin, M.; Qi, J. Multi-scenario landscape ecological risk assessment based on Markov–FLUS composite model. Geomat. Nat. Hazards Risk 2021, 12, 1448–1465. [Google Scholar] [CrossRef]
  71. Mo, W.; Wang, Y.; Zhang, Y.; Zhuang, D. Impacts of road network expansion on landscape ecological risk in a megacity, China: A case study of Beijing. Sci. Total Environ. 2017, 574, 1000–1011. [Google Scholar] [CrossRef] [Green Version]
  72. Farooq, A.; Xie, M.; Stoilova, S.; Ahmad, F.; Guo, M.; Williams, E.J.; Gahlot, V.K.; Yan, D.; Issa, A.M. Transportation planning through GIS and multicriteria analysis: Case study of Beijing and XiongAn. J. Adv. Transp. 2018, 2018, 2696037. [Google Scholar] [CrossRef] [Green Version]
  73. Abino, A.C.; Kim, S.Y.; Na Jang, M.; Lee, Y.J.; Chung, J.S. Assessing land use and land cover of the Marikina sub-watershed, Philippines. For. Sci. Technol. 2014, 11, 65–75. [Google Scholar] [CrossRef] [Green Version]
  74. Dixon, A.; Wood, A.; Hailu, A. Wetlands in Ethiopia: Lessons from 20 years of Research, Policy and Practice. Wetlands 2021, 41, 20. [Google Scholar] [CrossRef]
  75. Munishi, S.; Jewitt, G. Degradation of Kilombero Valley Ramsar wetlands in Tanzania. Phys. Chem. Earth 2019, 112, 216–227. [Google Scholar] [CrossRef]
  76. Ilboudo, A.; Soulama, S.; Hien, E.; Zombre, P. Perceptions paysannes de la dégradation des ressources naturelles des bas-fonds en zone soudano-sahélienne: Cas du sous bassin versant du Nakanbé-Dem au Burkina Faso. Int. J. Biol. Chem. Sci. 2020, 14, 883–895. [Google Scholar] [CrossRef]
  77. Vodouhè, F.G.; Dossou-Yovo, H.O.; Chadaré, F.J.; Gélinas, N.; Assogbadjo, A.E.; Coulibaly, O. Valuing the potential of no-timber forest products in financial valuation of savannah formation in soudanian region. Univers. J. Agric. Res. 2016, 4, 183–197. [Google Scholar] [CrossRef]
  78. Xu, D.; Yang, F.; Yu, L.; Zhou, Y.; Li, H.; Ma, J.; Huang, J.; Wei, J.; Xu, Y.; Zhang, C.; et al. Quantization of the coupling mechanism between eco-environmental quality and urbanization from multisource remote sensing data. J. Clean. Prod. 2021, 321, 128948. [Google Scholar] [CrossRef]
Figure 1. Geographical location of the Ouémé Delta.
Remotesensing 14 06165 g001
Figure 2. Maps of the evolution of the vegetation cover in the Ouémé Delta between 1990, 2005, and 2020.
Remotesensing 14 06165 g002
Figure 3. Variation in areas of land cover classes in the Ouémé Delta between 1990 and 2020. AG: Agglomeration; FF: Fields and fallows; W: Water; DF: Dense forest; GF: Gallery forest; SF: Swamp forest; SS: Shrubby tree savannah.
Remotesensing 14 06165 g003
Figure 4. Evolution of the average area and the number of polygons based on the observation periods. DF: Dense forest; GF: Gallery forest; SF: Swamp forest; SS: Shrubby tree savannah.
Remotesensing 14 06165 g004
Figure 5. Maps of the spatial distribution of soil types 1976 (left) and road network 2018 (right) in the Ouémé Delta.
Remotesensing 14 06165 g005
Figure 6. Comparative mapping of the 2020 classification and simulation.
Remotesensing 14 06165 g006
Figure 7. Predictive mapping of the vegetation cover of the Ouémé Delta in 2035.
Remotesensing 14 06165 g007
Figure 8. Simulated areas of land use units in the Ouémé Delta in 2035. AG: Agglomeration; FF: Fields and fallows; W: Water; DF: Dense forest; GF: Gallery forest; SF: Swamp forest; SS: Shrubby tree savannah.
Remotesensing 14 06165 g008
Table 1. Statistical validation of image-processing results.
Parameters199020052020
Kappa Index0.840.860.86
Overall accuracy (%)88.9589.8290.17
DecisionIdealIdealIdeal
Table 2. Transition matrix of land cover units (%) between 1990 and 2020.
1990–2020AGFFWDFGFSFSSTotal (2020)
AG0.190.070.010.090.010.130.010.53
FF0.021.610.101.190.020.890494.33
W0.180.1621.190.470.021.470.0623.56
DF0.127.430.6612.400.359.642.5433.14
GF0.010.360.220.220.090.160.041.09
SF0.528.430.948.990.137.142.3028.46
SS0.062.420162.930.031.701.608.90
Total (1990)1.0920.4823.2926.290.6621.147.05100.00
AG: Agglomeration; FF: Fields and fallows; W: Water; DF: Dense forest; GF: Gallery forest; SF: Swamp forest; SS: Shrubby tree savannah.
Table 3. Transition matrix of land occupation units (%) between 1990 and 2005.
1990–2005AGFFWDFGFSFSSTotal (2005)
AG0.470.000.000.000.000.060.000.53
FF0.003.780.000.000.050.080.424.33
W0.000.0223.450.000.020.080.0023.57
DF0.003.690.1025.340.083.900.0433.15
GF0.010.100.020.010.410.470.061.09
SF0.074.130.393.060.0519.521.2028.42
SS0.140.140.001.090.071.326.158.91
Total (1990)0.6911.8523.9629.500.6925.447.87100.00
AG: Agglomeration; FF: Fields and fallows; W: Water; DF: Dense forest; GF: Gallery forest; SF: Swamp forest; SS: Shrubby tree savannah.
Table 4. Transition matrix of landscape units (%) between 2005 and 2020.
2005–2020AGFFWDFGFSFSSTotal (2020)
AG0.220.100.010.100.020.220.020.69
FF0.113.800.283.970.062.421.2111.85
W0.200.2221.360.640.021.470.0523.96
DF0.066.390.1911.440.249.092.1029.50
GF0.010.140.130.150.080.140.030.69
SF0.437.271.158.110.226.611.6525.44
SS0.072.540.181.890.011.201.997.87
Total (2005)1.0920.4623.3026.290.6621.147.05100.00
AG: Agglomeration; FF: Fields and fallows; W: Water; DF: Dense forest; GF: Gallery forest; SF: Swamp forest; SS: Shrubby tree savannah.
Table 5. Evolution of the average area and the number of polygons according to the observation periods.
Types of Land Cover199020052020
Number ofAverageNumber ofAverageNumber ofAverage
PolygonsArea (ha)PolygonsArea (ha)PolygonsArea (ha)
AG1962.742512.821348.53
FF5408.14111210.9323388.95
W24598.65237103.56137173.57
DF53263.47113265.68141718.87
GF1239.071654.261404.88
SF166117.63166415.7829047.52
SS49618.1732624.209397.63
AG: Agglomeration; FF: Fields and fallows; W: Water; DF: Dense forest; GF: Gallery forest; SF: Swamp forest; SS: Shrubby tree savannah.
Table 6. Comparative statistics of areas for model validation.
Type of Land CoverClassified Area 2020Simulated Area 2020Difference (%)
ha%ha%
AG1143.421.12712.090.700.42
FF20,923.7020.4517,691.9017.303.16
W23,777.0023.2424,677.5024.13−0.89
DF26,748.1026.1527,377.4026.77−0.62
GF684.440.67651.950.640.03
SF21,851.5021.3623,230.6022.71−1.35
SS7172.677.017959.397.78−0.77
AG: Agglomeration; FF: Fields and fallows; W: Water; DF: Dense forest; GF: Gallery forest; SF: Swamp forest; SS: Shrubby tree savannah.
Table 7. Probability of changes from one class to another.
Land CoverAGFFWDFGFSFSS
AG0.310.120.020.130.020.320.05
FF0.000.310.020.330.000.190.10
W0.000.000.890.020.000.060.00
DF0.000.210.000.380.000.300.07
GF0.000.200.190.230.120.190.04
SF0.010.280.040.320.000.250.06
SS0.000.320.020.230.000.150.25
AG: Agglomeration; FF: Fields and fallows; W: Water; DF: Dense forest; GF: Gallery forest; SF: Swamp forest; SS: Shrubby tree savannah.
Publisher’s Note: MDPI stays neutral with regard to jurisdictional claims in published maps and institutional affiliations.

