
Feature-Based Approach to Change Detection of Small Objects from High-Resolution Satellite Images


1
Department of Geoinformatic Engineering, Inha University, Incheon 22212, Korea
2
Defense Division, Satrec Initiative, Daejeon 34054, Korea
*
Author to whom correspondence should be addressed.
Remote Sens. 2022, 14(3), 462; https://0-doi-org.brum.beds.ac.uk/10.3390/rs14030462
Submission received: 14 December 2021
/
Revised: 9 January 2022
/
Accepted: 17 January 2022
/
Published: 19 January 2022
(This article belongs to the Special Issue Image Change Detection Research in Remote Sensing)
Abstract
:This paper proposes a new approach to small-object change detection from high-resolution satellite images. We propose using feature points that can be quickly extracted from satellite images as a suitable unit of change for small objects and to reduce false alarms. We can perform feature-based change detection by extracting features from previous and recent images and by estimating change based on change magnitude of the features. We estimate the magnitude by calculating pixel-based change magnitude, and counting the ratio of changed pixels around the extracted features. We apply feature matching and determine matched features as unchanged ones. The remaining feature points are judged as changed or unchanged based on their change magnitude. We tested our approach with three Kompsat-3A image sets with a ground sampling distance of 50 cm. We showed that our approach outperformed the pixel-based approach by producing a higher precision of 88.7% and an accuracy of 86.1% at a fixed false alarm rate of 10%. Our approach is unique in the sense that the feature-based approach applying computer vision methods is newly proposed for change detection. We showed that our feature-based approach was less noisy than pixel-based approaches. We also showed that our approach could compensate for the disadvantages of supervised object-based approaches by successfully reducing the number of change candidates. Our approach, however, could not handle featureless objects, and may increase the number of undetected objects. Future studies will handle this issue by devising more intelligent schemes for merging pixel-based and feature-based change detection results.
1. Introduction
Spatial and temporal resolutions of satellite images have been greatly improved due to continuous development of space technologies and several innovative satellite constellation programs [1,2,3] aiming for near real-time earth observation for defense, security, etc. Accordingly, interest in the application of satellite images has increased with the expectation of abundant high-resolution image acquisitions. The improved spatial resolution brings a diversity of observable objects. Improved temporal resolution offers various new applications based on detection of changes in time-series satellite images. While change detection from satellite images has focused on changes in relatively large areas, such as land use and land cover [4,5,6,7], forest [8,9], disaster damaged area [10,11], wetland [12], and coastal areas [13]. The improved spatial and temporal resolutions should enable change detection of small objects such as vehicles, roads [14], and buildings [15,16,17]. Traditional change detection research has limited observable objects due to the resolution limit of satellite sensors. We wish to conduct a change detection study on small objects including vehicles using high-resolution satellite images. Due to the agile nature of small objects of interest, change in this paper mainly means appearance and disappearance between previous and recent images.
Change detection can be classified by the unit of change determination. Traditionally, changes are estimated on individual image pixels (pixel-based approaches) or a group of pixels (object-based approaches) [18,19,20,21]. Pixel-based approaches estimate change magnitude per pixel between time-series images by comparing brightness numbers of a pixel and its neighbors, and determine changed pixels by thresholding the change magnitude. Object-based approaches [22] define objects by grouping image pixels with similar properties or by using pre-determined templates [4,5]. Changes are estimated by considering pixel-based change magnitude and intrinsic group properties [23,24]. Recently, Wen et al. [25] introduced object-based change detection using various features as change detection units: textural, deep, object-based and angular. Textural features included grey level correlation [26,27], morphological profiles [28,29,30], and Gabor and wavelet features [31]. Deep features refer to change analysis units in convolutional neural networks [14,32]. Angular features use surface geometry factors such as elevation and observation angles [33,34]. While pixel-based approaches can determine change intuitively and quickly [19,20], they may generate noisy results and be vulnerable to radiometric and geometric consistency in time-series images. Object-based approaches can overcome the problems of pixel-based approaches [22,23]. However, they require additional processing for object extraction and analysis [24]. In addition, traditional object-based approaches have been applied mostly to large-sized objects.
In this paper, we aim to develop a method for change detection of small objects that can overcome the problems of pixel-based and object-based approaches. To achieve this, we propose the use of feature points, often referred to as interest points or keypoints [35,36], as change detection units. They can be extracted automatically and without heavy image computation [35,36], and matched with each other through various feature matching techniques [37,38,39]. We can perform feature-based change detection by extracting feature points from previous and recent images and by estimating their change magnitude. We estimate the change magnitude of feature points by calculating pixel-based change magnitude first and counting the ratio of changed pixels around the extracted features. We also apply feature matching, and classify matched feature points as unchanged. This should reduce false alarms. The remaining feature points are judged as changed or unchanged based on their change magnitude.
Our approach is unique in the sense that change detection based on feature points is being newly proposed, while there have been previous studies combining change detection with matching at the patch [40], image [41] and multi-scale level [42]. It is presumed that small objects have distinctive brightness patterns, and hence, produce feature points. Feature point analysis should represent the change in status of small objects better than pixel analysis. We expect our feature-based approach to be less noisy than pixel-based approaches, since feature points are less sensitive to geometric errors between previous and recent images. We tried this approach as an attempt to compensate for the disadvantages of highly time-consuming approaches. It is very difficult to apply computationally expensive supervised, segmentation, and classification approaches [43,44] to every changed pixel [25]. Applying such an approach to changed features should be more feasible. We expect that our feature-based approach is able to represent object changes without supervision to some extent.
The organization of this paper is as follows. Section 2 describes the workflow of the proposed feature-based change detection. Section 3 describes the dataset, study area and preparation of ground truth data used for the experiments. Section 4 reports the results of feature-based change detection and discusses their performance in comparison to a pixel-based approach. Section 5 concludes the findings of this paper, along with limitations and future research directions.
2. Feature Point-Based Change Detection Method
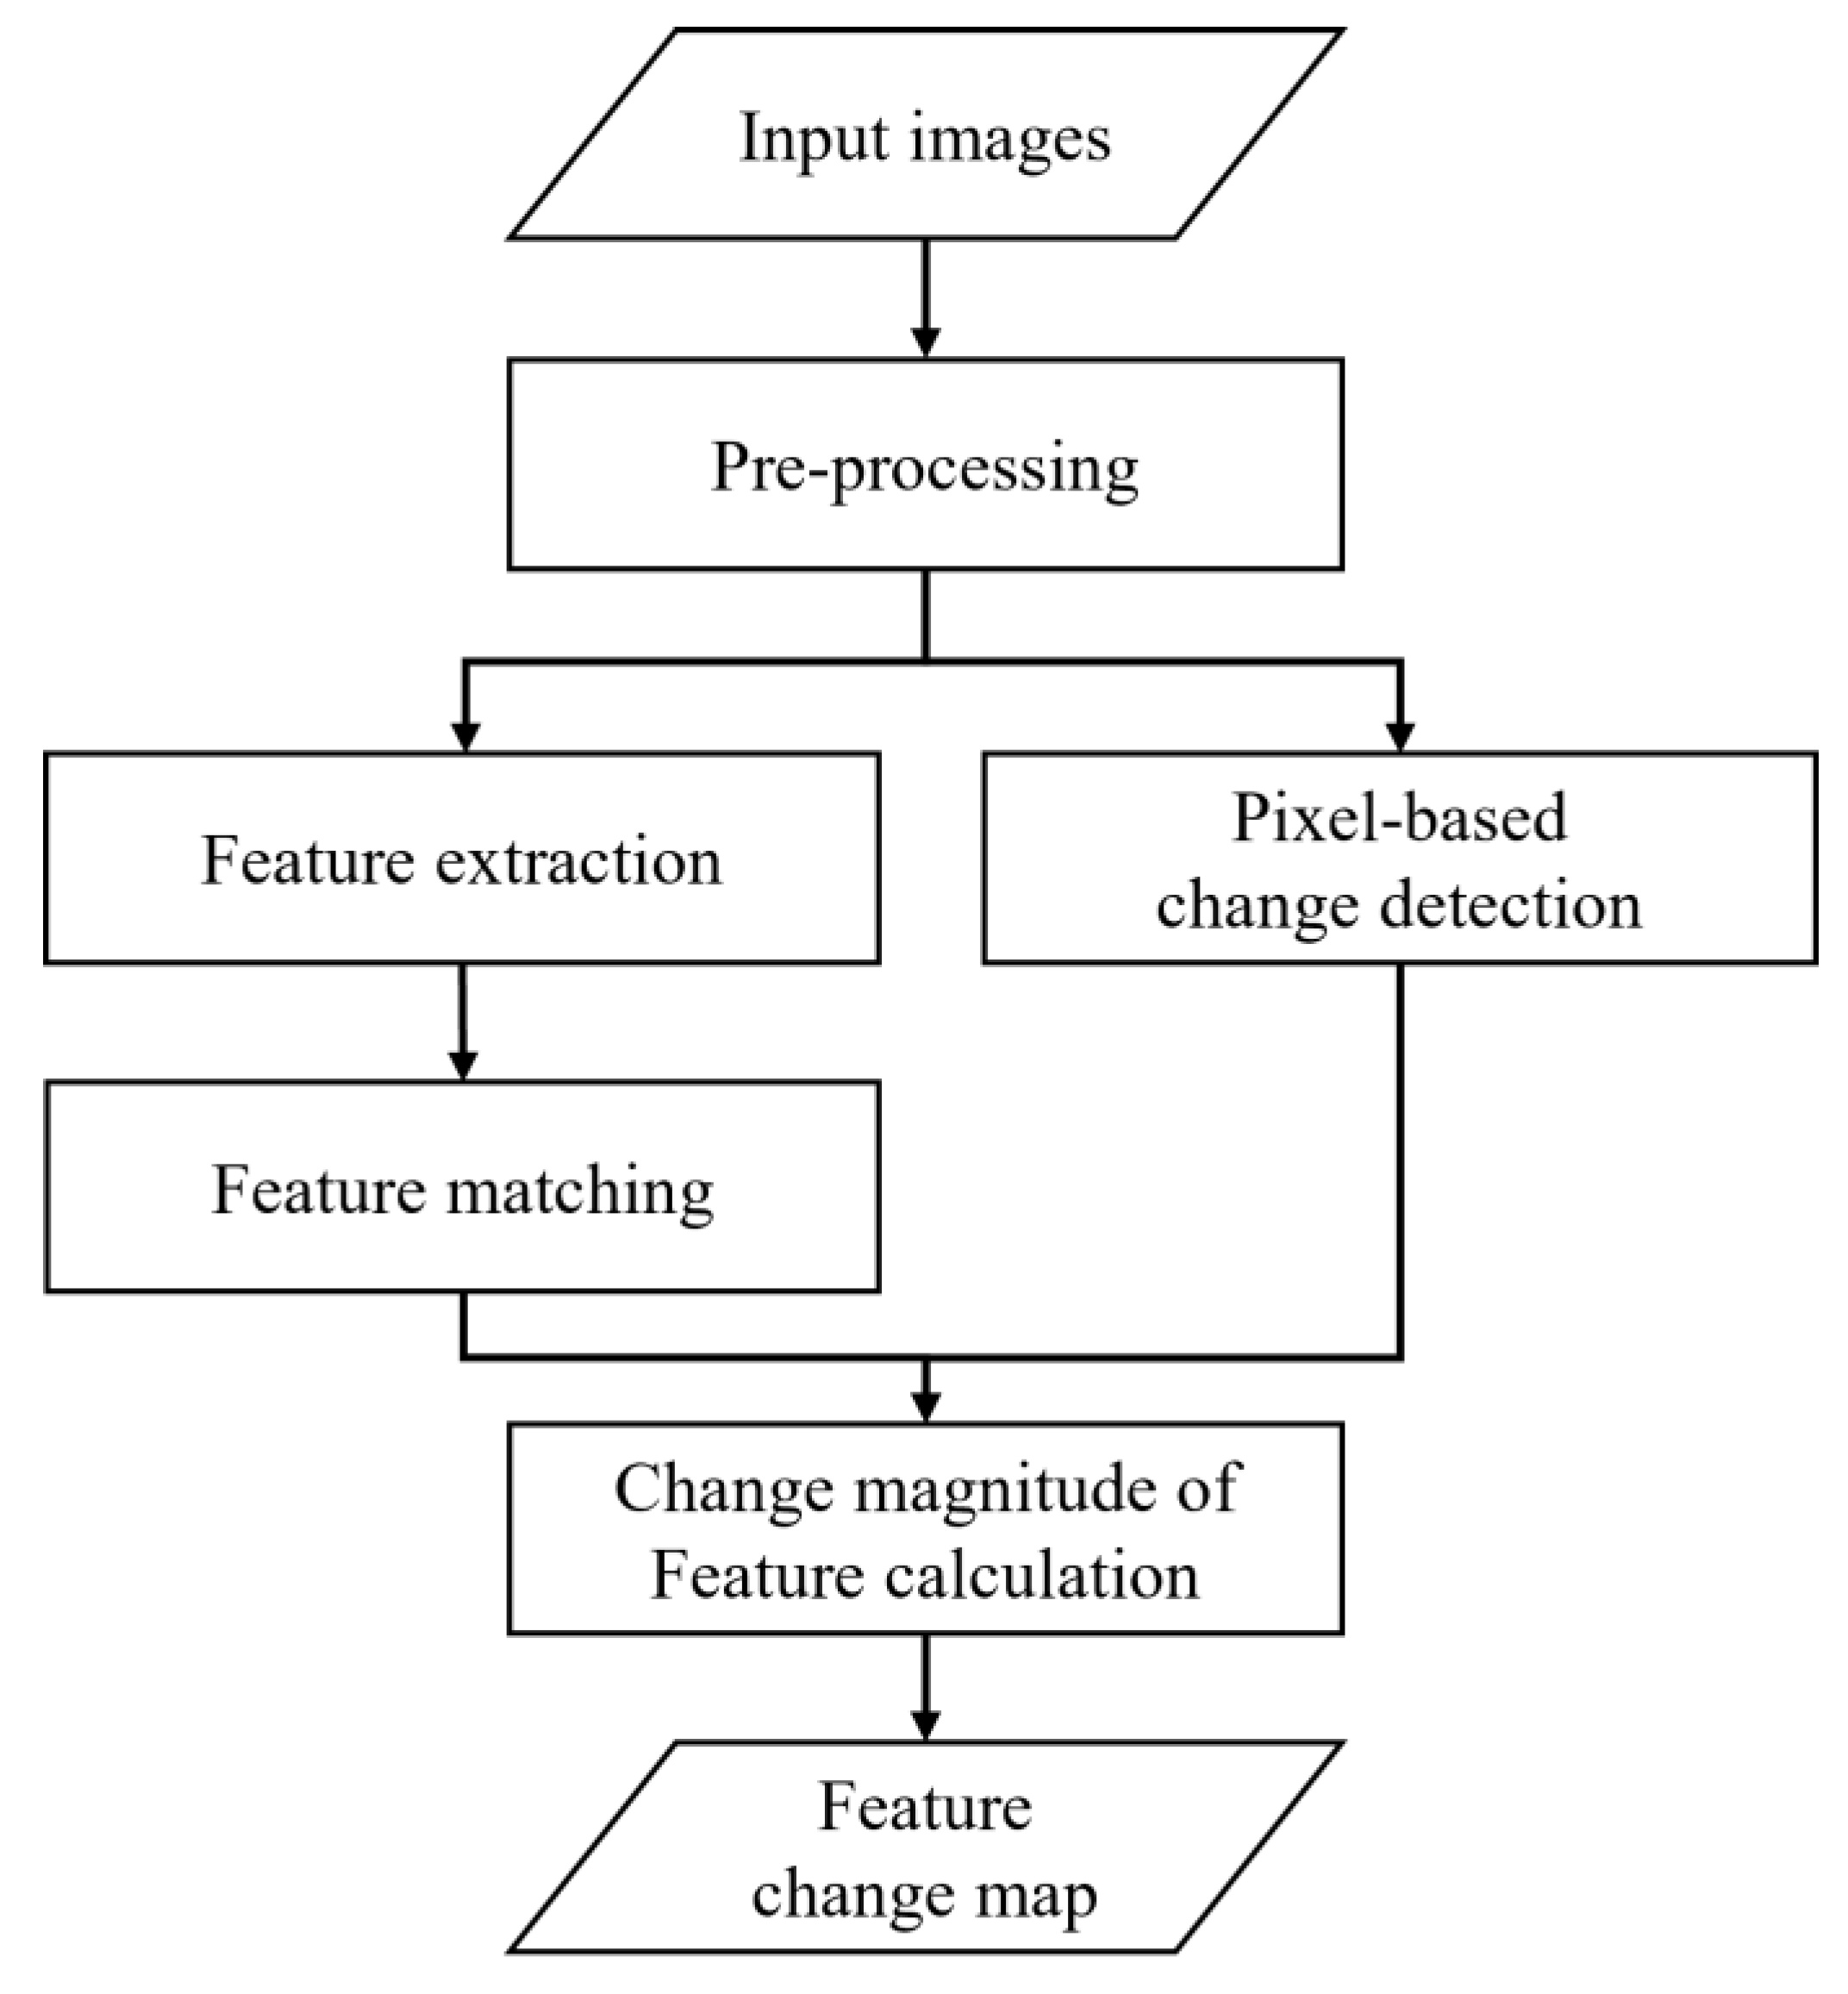
This section explains the feature-based, unsupervised change detection proposed in this paper. Figure 1 shows the processing sequence of our method. We perform pre-processing on input satellite images, extract feature points from them, and apply feature matching. Concurrently, we apply pixel-based change detection. The two processing sequences are merged by creating change magnitudes of the features. Finally, changed features are determined.
2.1. Pre-Processing
Pre-processing is essential to accurate change detection results. We perform ortho-rectification on input satellite images using Ground Control Points (GCPs) and a Digital Elevation Model (DEM) to remove pixel location errors and relief displacement due to surface elevation. For this paper, we used Kompsat-3A images with a ground sampling distance (GSD) of 50 cm. For ortho-rectification, we used GCPs extracted from the National Integrated Control Point Database of the National Geographic Information Institute (NGII) of the Government of Korea, with an expected accuracy of several centimeters, and the National 5 m Grid DEM generated and maintained by NGII [45]. It is expected that rectified image grids are aligned with each other to accuracies within two pixels. After rectification, sub-images were extracted from previous and recent images to carry out the change detection experiments.
The images used in this paper include a panchromatic band and pan-sharpened multispectral blue, green, red, and near-infrared bands. For feature extraction and matching, the panchromatic band was used. For pixel-based change analysis, the pan-sharpened multispectral bands were used.
2.2. Feature Extraction
Feature points used in this paper are the points that have distinctive texture patterns, such as abrupt brightness changes in their vicinity. Feature points are regarded as a means to describe an arbitrary object, and they have been used to find corresponding points of the same object through matching [37,38,39]. In this paper, we wish to check whether they can be a useful unit of change for small objects. We used Scale-Invariant Feature Transform (SIFT) [35] and the Accelerated-KAZE (AKAZE) algorithm for extracting feature points [36]. SIFT can extract features robust to image rotation, affine transformation, and scale [46]. It constructs a scale space using a Gaussian kernel, generates a Difference of Gaussian (DoG), and localizes feature points by eliminating low-contrast points. AKAZE uses a nonlinear diffusion filter to remove noise and highlight edge areas and detect feature points as points with the maximum response of a Hessian-based filter [36]. The brightness values of ortho-rectified panchromatic bands were re-scaled from 16 bits to 8 bits, and feature extractors were applied. Through this processing, a lot of features were generated from previous and recent images. In many cases, multiple features at very close distances were extracted from a single object. For some very small objects, no features were extracted. However, to check the capability of feature-based change detection, we did not apply additional post-processing to filter out these multiple features or to amend objects without features.
2.3. Feature Matching
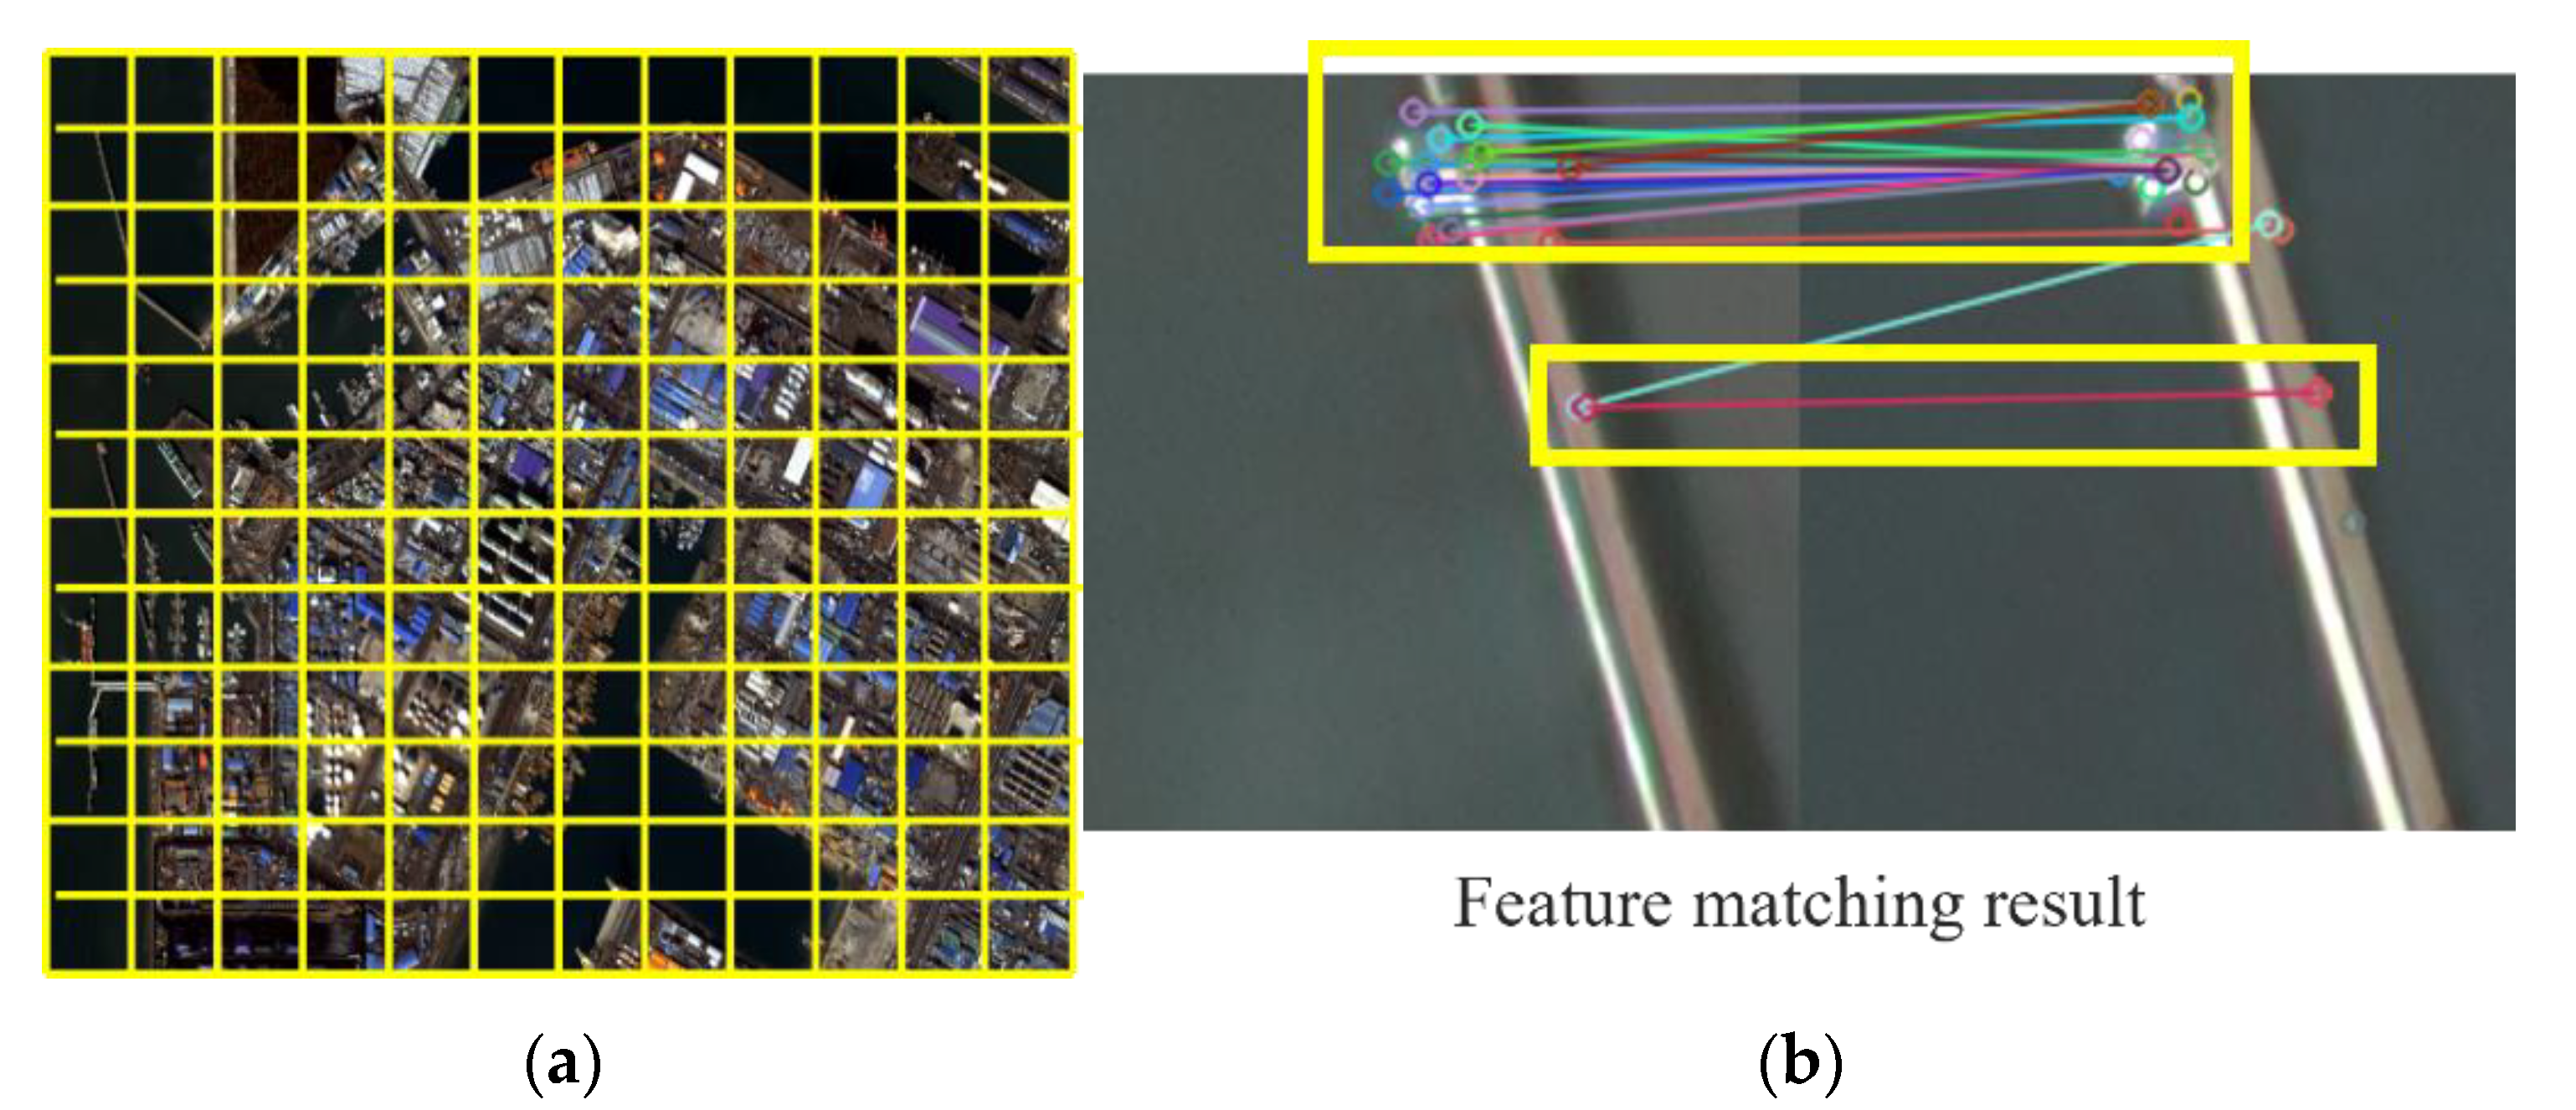
After feature extraction, we perform feature matching. Our purpose is to classify matched features whose pixel distance is within a small threshold in previous and recent images as unchanged, and remove them from further analysis. Matching performed over the entire image may produce false matches. Therefore, we divide the whole image into small sections called buckets, and limit feature matching to within each corresponding bucket. Figure 2a shows how an image is divided into buckets. Feature points within a bucket of a previous image are compared only with the feature points of the corresponding bucket from a recent image. Figure 2b is the result of feature matching within a bucket. The circles in the left and right images in Figure 2b are feature points extracted and lines connecting them show match results between feature points. Matched features are shown as the same color. The yellow boxes show successfully matched features.
Feature matching is executed with brute force-based K Nearest Neighbors (KNN) [47]. KNN matching searches k pairs of feature points by matching one feature point to k feature points. Since matching is performed on multi-temporal ortho-images, the positions between matched feature points should be the same or similar for unchanged objects. Therefore, when the pixel distance between matched feature points is smaller than a threshold, we can determine the feature points as the points from the same unchanged object. They are classified as unchanged and removed from follow-up change analysis.
2.4. Pixel-Based Change Analysis
After the pre-processing step, as shown in Figure 1, a pixel-based change detection process is carried out in parallel with feature extraction and matching. For generation of a pixel-based change magnitude map, we use the Multivariate Alteration Detection (MAD) algorithm [48,49,50,51], which is a well-known pixel change analyzer. Here, we restate its principle for the completeness of this paper. The MAD generates transformed images W and P from images X and Y having n spectral bands as in Equation (1).
where and are the brightness values of each band in images X and Y, respectively, and and are the transformation coefficients for images X and Y, respectively. The transformation coefficients are calculated by the covariance among the original images X and Y and the correlation between the transformed images W and P to maximize the deviation between two images [48,49]. The MAD calculates changes as the difference between transformed images W and P, as shown in Equation (3). The MAD is invariant to changes in gain and offset settings in measuring devices and to linear radiometric and atmospheric correction schemes [49].
The changed area can be highlighted and detected by maximizing the deviation. For this paper, The MAD was applied to the green, red, and near infra-red bands of the Kompsat-3A images.
After change magnitude generation, changed pixels are determined by thresholding the change magnitude. Determination of the optimal threshold value is of great importance for accuracy and performance in change detection. In this paper, our focus is on proposing feature-based change detection and checking its performance with respect to pixel-based approaches. Therefore, we used various threshold values repeatedly, and checked the performance of change detection per threshold. For a given threshold, a pixel-based change map was generated and delivered for the next process of feature-based change analysis.
2.5. Feature-Based Change Analysis
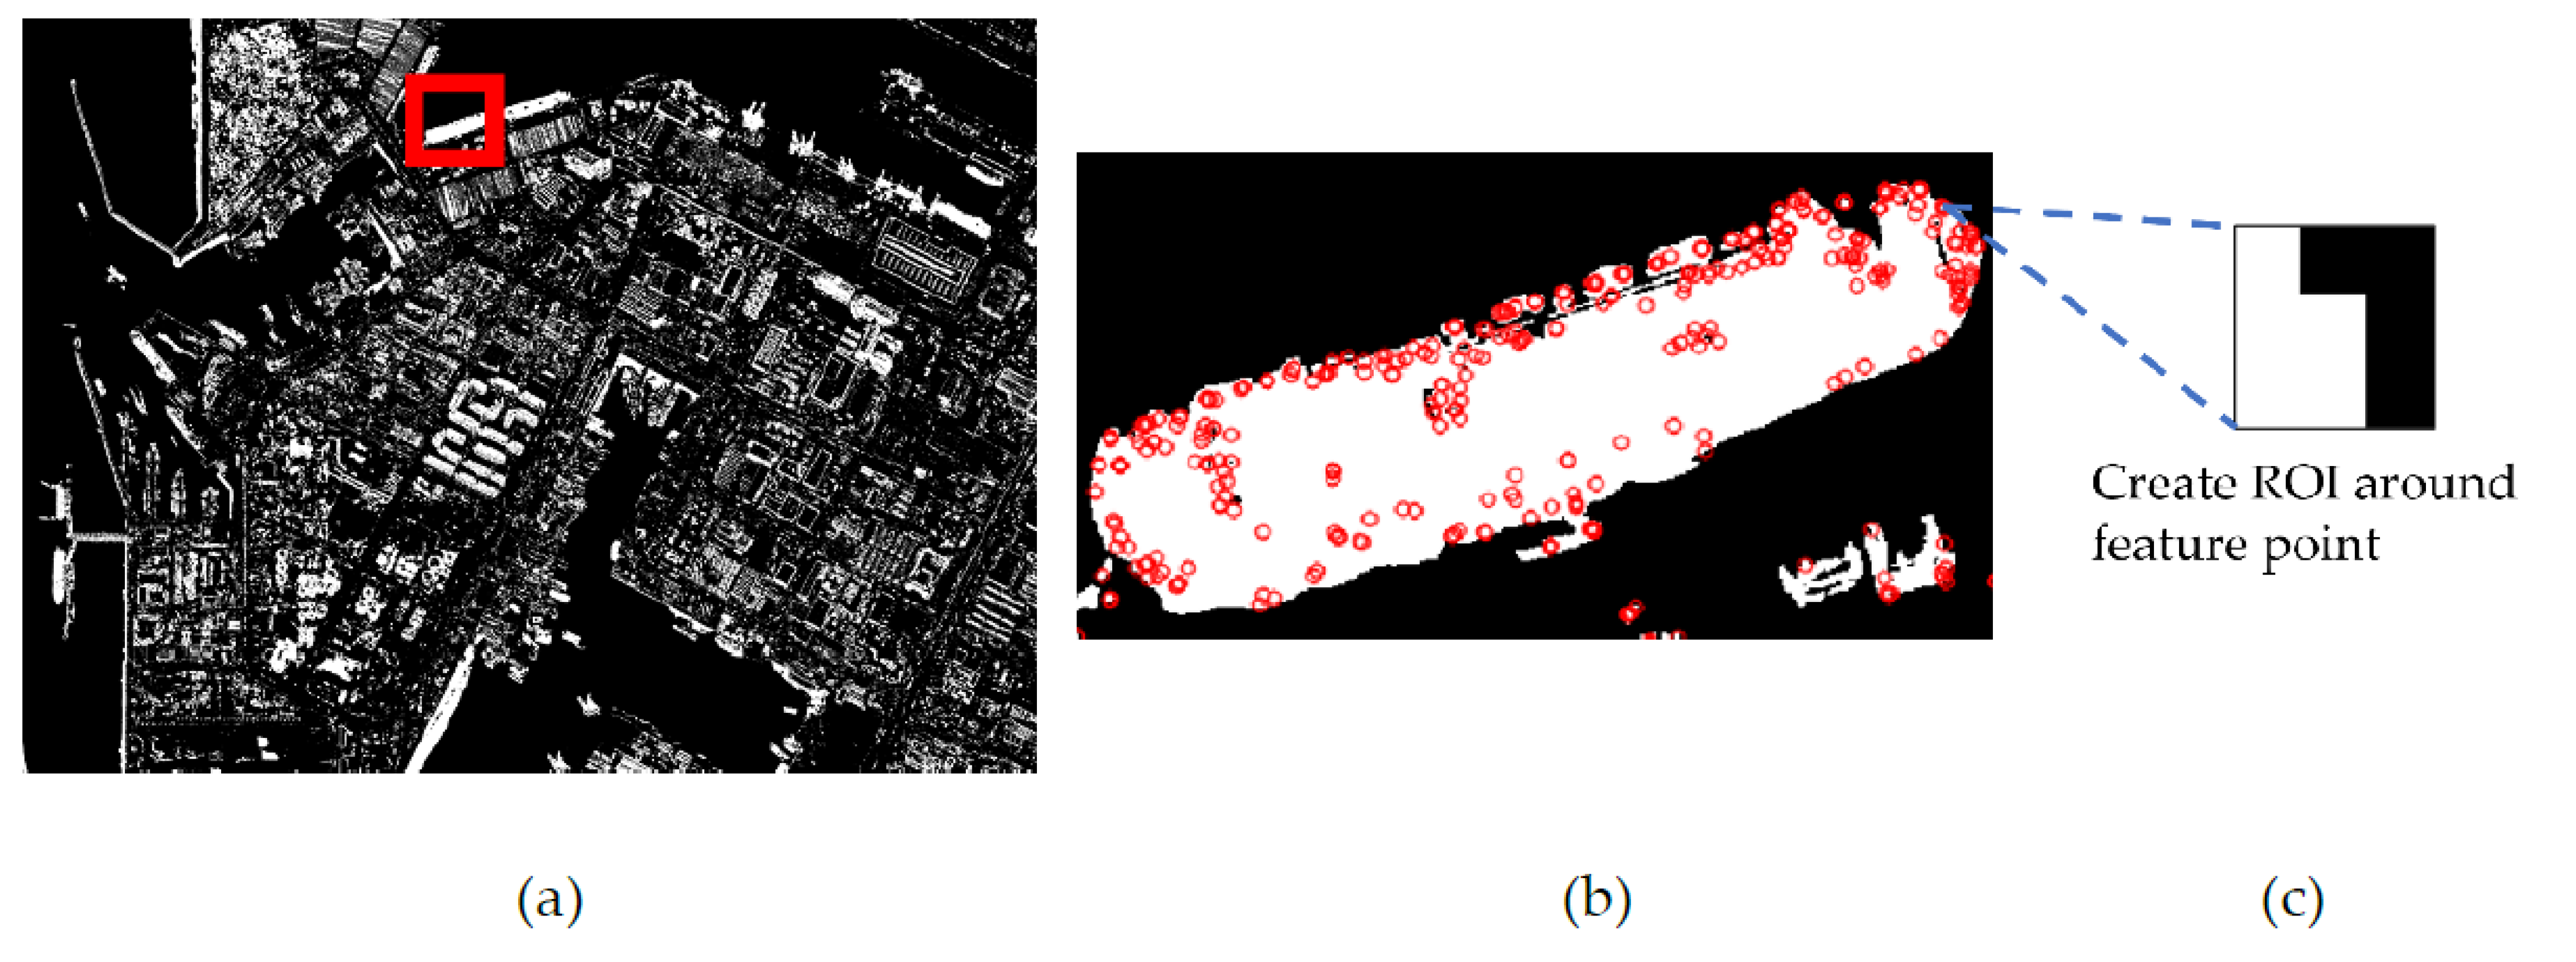
Feature-based change analysis is carried out using the unmatched feature points and a pixel-based change map. A region of interest (ROI) of a small pixel size, say 3 × 3 pixels, is defined at a feature point as its center. The ratio of changed pixels to all pixels within the ROI is calculated. This ratio can represent the magnitude of change or the probability of change for the feature point. This ratio can be analyzed further for optimal change detection performance. In this paper, we set a ratio of 0.5 as the threshold of change for the sake of simplicity and to focus on the theme of the paper. Figure 3 shows the process of classifying changed feature points using one ROI. Figure 3a shows a pixel-based change map over a test site. Figure 3b is an enlarged sub-image around a ship, and Figure 3c is a selected ROI showing changed pixels in white and unchanged pixels in black.
2.6. Performance Analysis
For performance analysis, we manually measured the boundaries of changed objects and unchanged objects. They were used as references to analyze the performance of change detection. Accuracy, precision, recall, false alarm rate, F1-score, and Area Under the Curve (AUC) were used as performance indices. Accuracy is the ratio of correctly classified groups—true positive (TP) and true negative (TN)—versus all groups, including incorrectly classified groups—false positive (FP) and false negative (FN). In this paper, positive is the decision that change occurred. Precision is the ratio of true positives to all detected changes (TP and FP). The recall is the ratio of true positives to all changed references (TP and FN). The false alarm rate is the ratio of false positives to all unchanged references (FP and TN). F1-score is the weighted average of precision and recall. Performance indices were calculated using Equations (4)–(8) [6,15,17].
An AUC [27] value is calculated as the area under the Receiver Operating Characteristic (ROC) curve [34], which represents the relationship between the values for normalized recall and false alarm rate. When the false alarm value is low and the recall value is high, detection performance is good. Therefore, a higher AUC value indicates good performance. For this paper, AUC was calculated from the ranges between zero and 0.1 false alarms to compare feature-based and pixel-based change detectors in low-false-alarm regions.
3. Dataset and Study Area
For the experiments, we used three Kompsat-3A image sets taken over Incheon, Chilgok, and Seoul in South Korea. Table 1 shows the image acquisition dates for previous and recent images within the image sets. The time difference between previous and recent images was less than 10 days to minimize brightness changes due to seasonal differences.
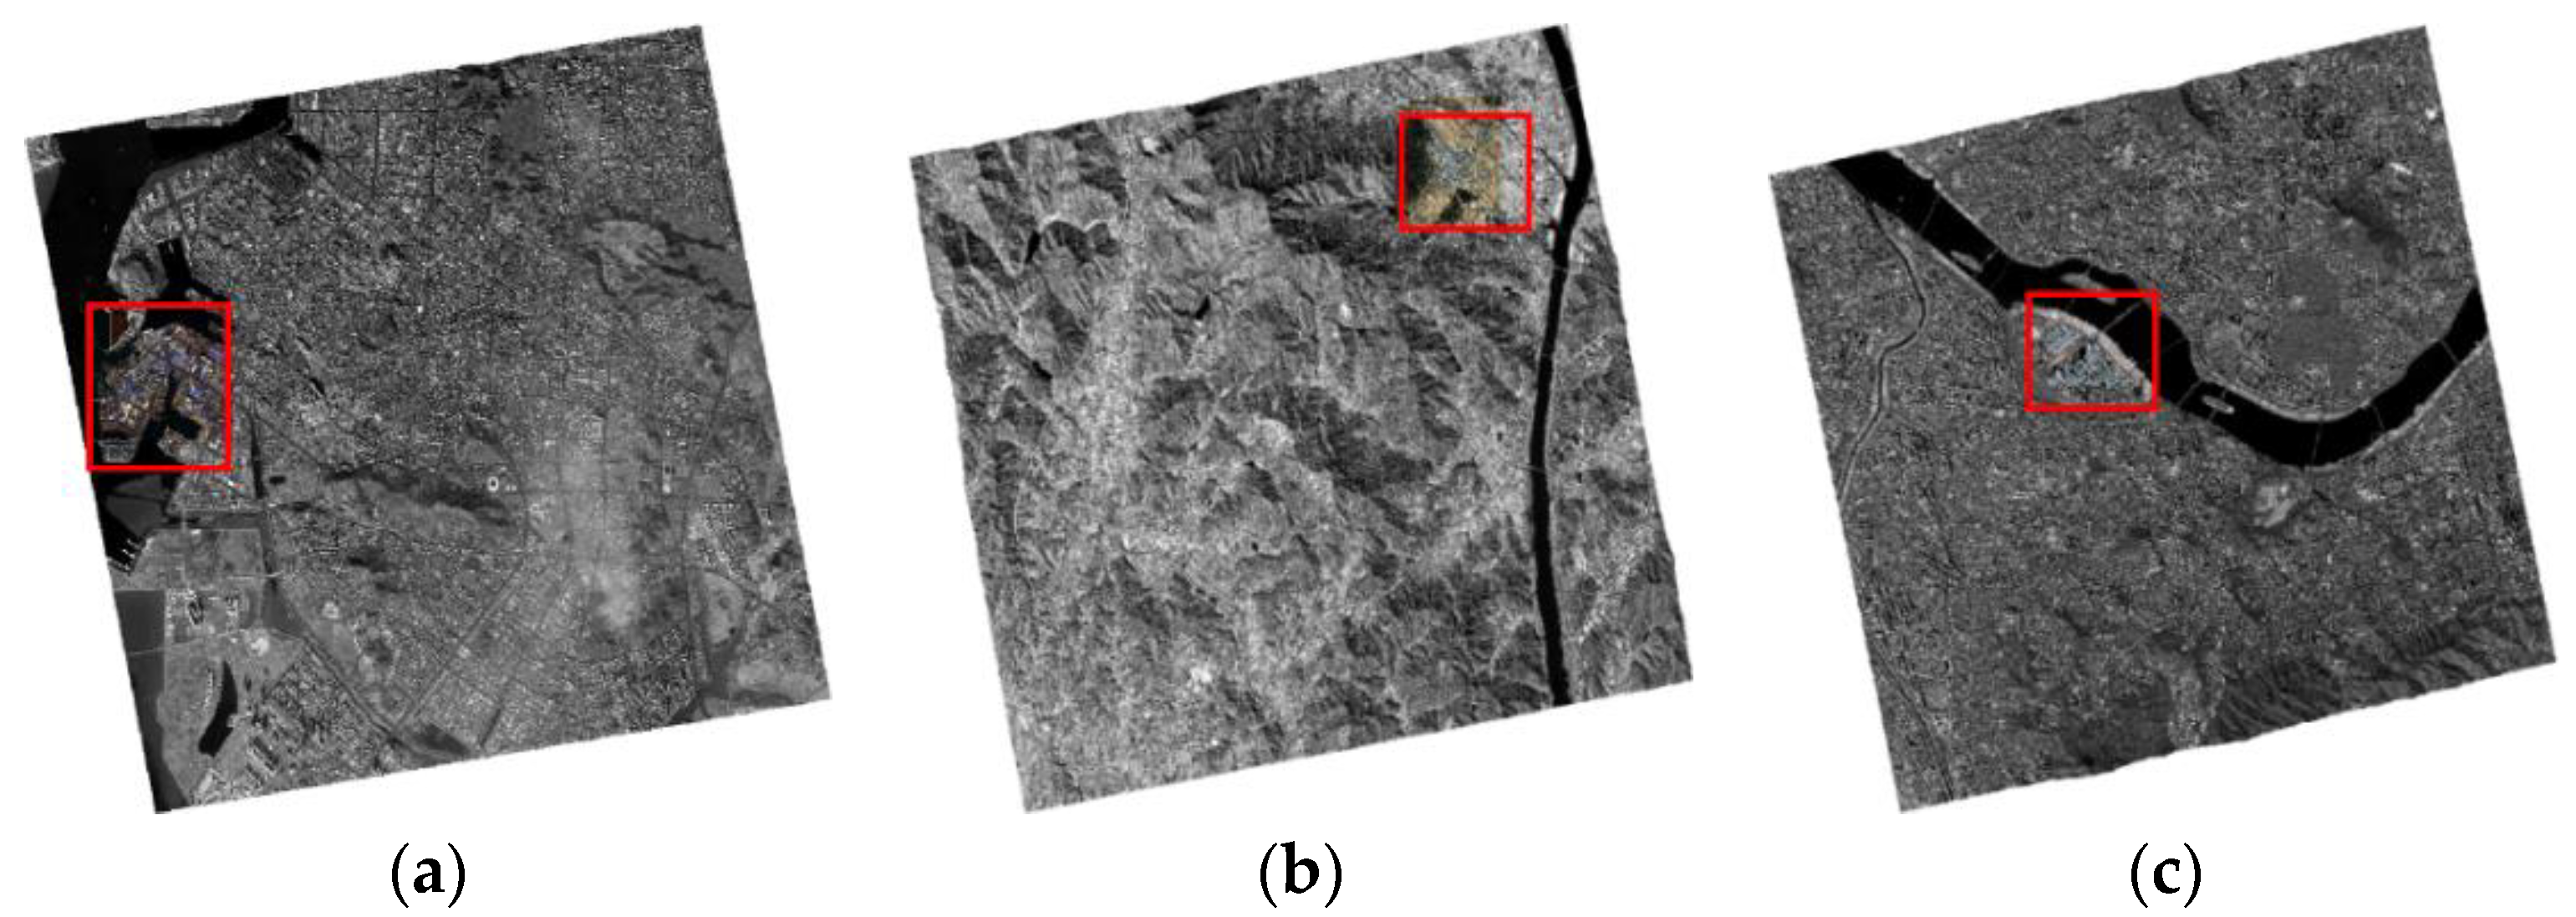
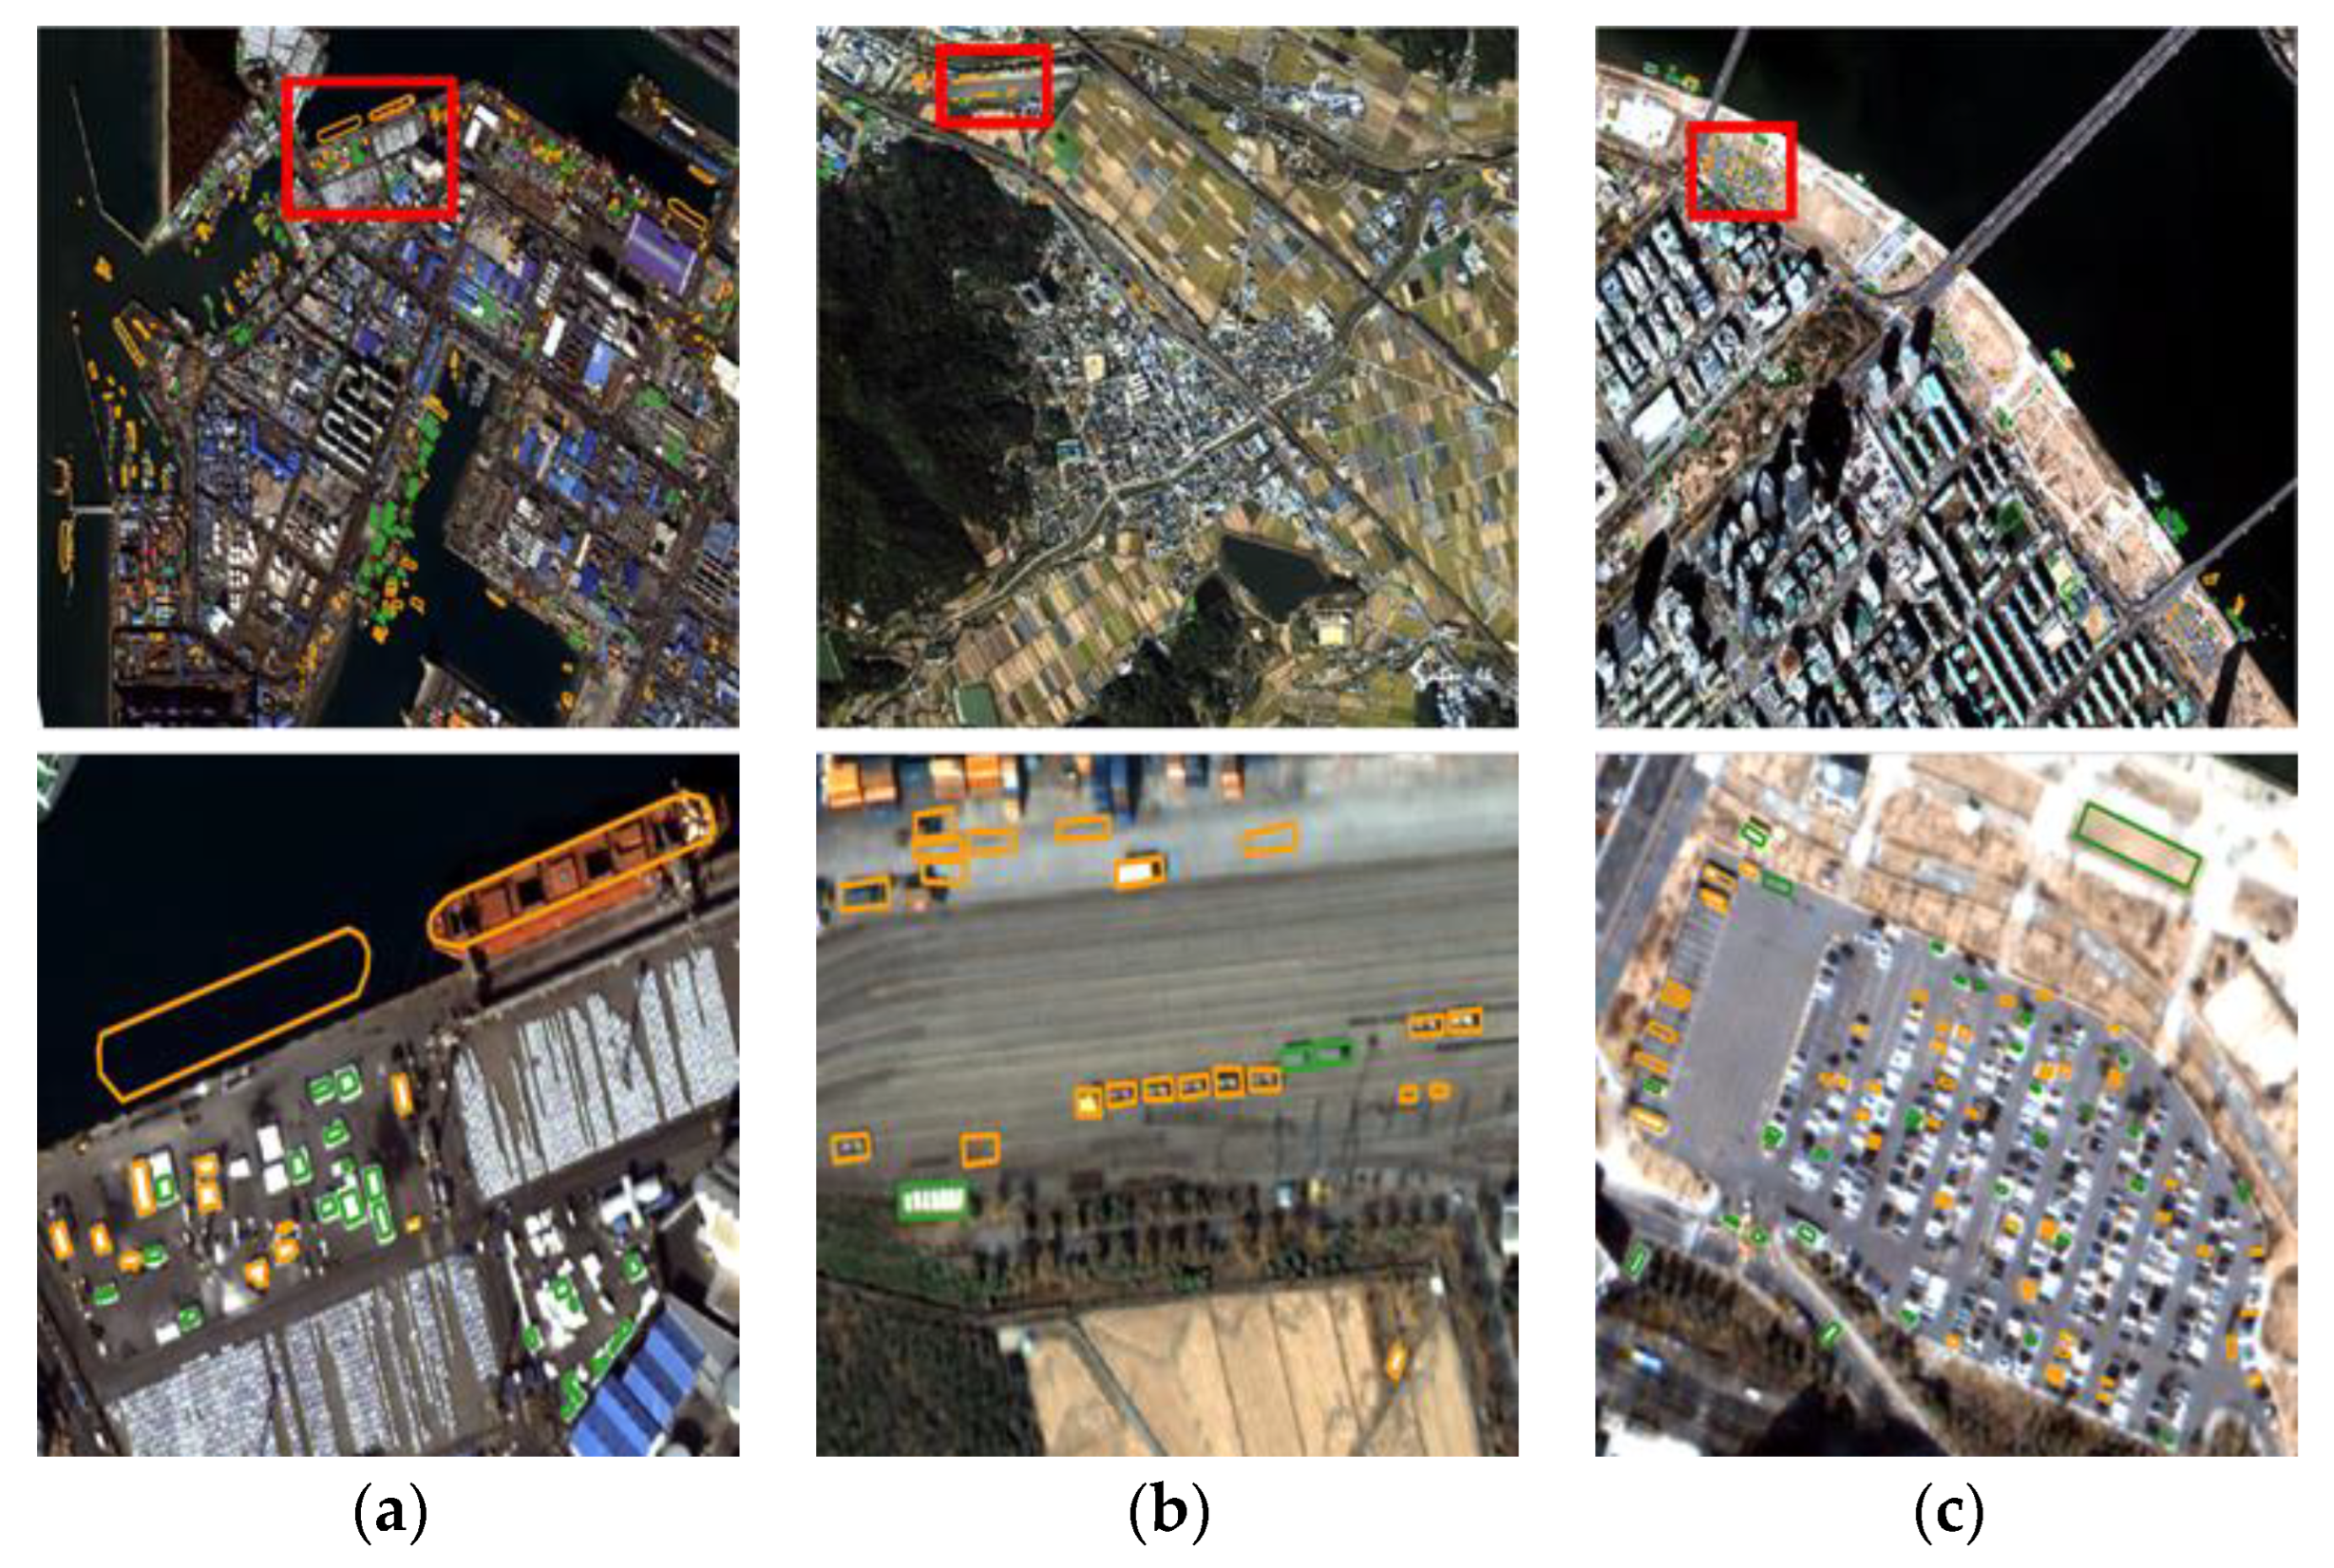
Figure 4 shows the images used for the experiments. The areas selected for study from each dataset had many changed and unchanged small objects, such as buses, trucks, ships, and containers. Study areas are marked with red boxes in Figure 4. From the Incheon images, one coastal area was selected. From the Chilgok images, one rural area was selected. From the Seoul images, one downtown area along the Han River was selected. The previous and recent images of each study area are shown in Figure 5.
From each dataset, changed and unchanged small reference objects were extracted by manually digitizing the object boundaries. Since there were a lot of small objects within the test sites, we could not extract all of them. We extracted some representative objects with clear object boundaries widely distributed within the test areas. Extracted reference objects are shown in Figure 6. Objects marked in orange are the changed reference objects, and those marked in green are the unchanged reference objects. The extracted objects range from relatively large sizes, such as ships and containers, to small sizes, such as trucks and small vehicles. To increase the number of unchanged reference objects, the roofs of small buildings were included. Table 2 shows the quantity of reference objects and their average sizes in pixels and in square meters. The average changed object size in Incheon was larger than other sites due to the very large ships docked in the harbor. The average unchanged object size in Chilgok is larger than the others because agricultural fields were included as unchanged references.
4. Results and Discussions
This section describes the results of feature-based change detection experiments carried out on the three test datasets, compares their performances in comparison to the MAD and discusses the advantages and drawbacks of our proposed approaches.
4.1. Feature Extraction Results
Feature extraction was applied to the test images. Table 3 shows the number of feature points extracted from each test area. The numbers of feature points extracted for changed reference objects and unchanged reference objects are also shown. Please note that features were not extracted from all reference objects. Some small objects without internal texture patterns did not produce features. Among the datasets tested, features were not extracted from 4.1% of the changed reference objects (26 out of 630) with AKAZE, and from 2.3% of the objects (15 out of 630) with SIFT. Changed objects without features decrease the change detection accuracy of our feature-based change detector, and prevent normalized recall from converging to 1. One can improve the feature extractor to reduce the number of featureless objects, and hence, to increase change detection accuracy. In this paper; however, feature-based change detection was tested without additional handling of featureless reference objects.
4.2. Feature Matching Results
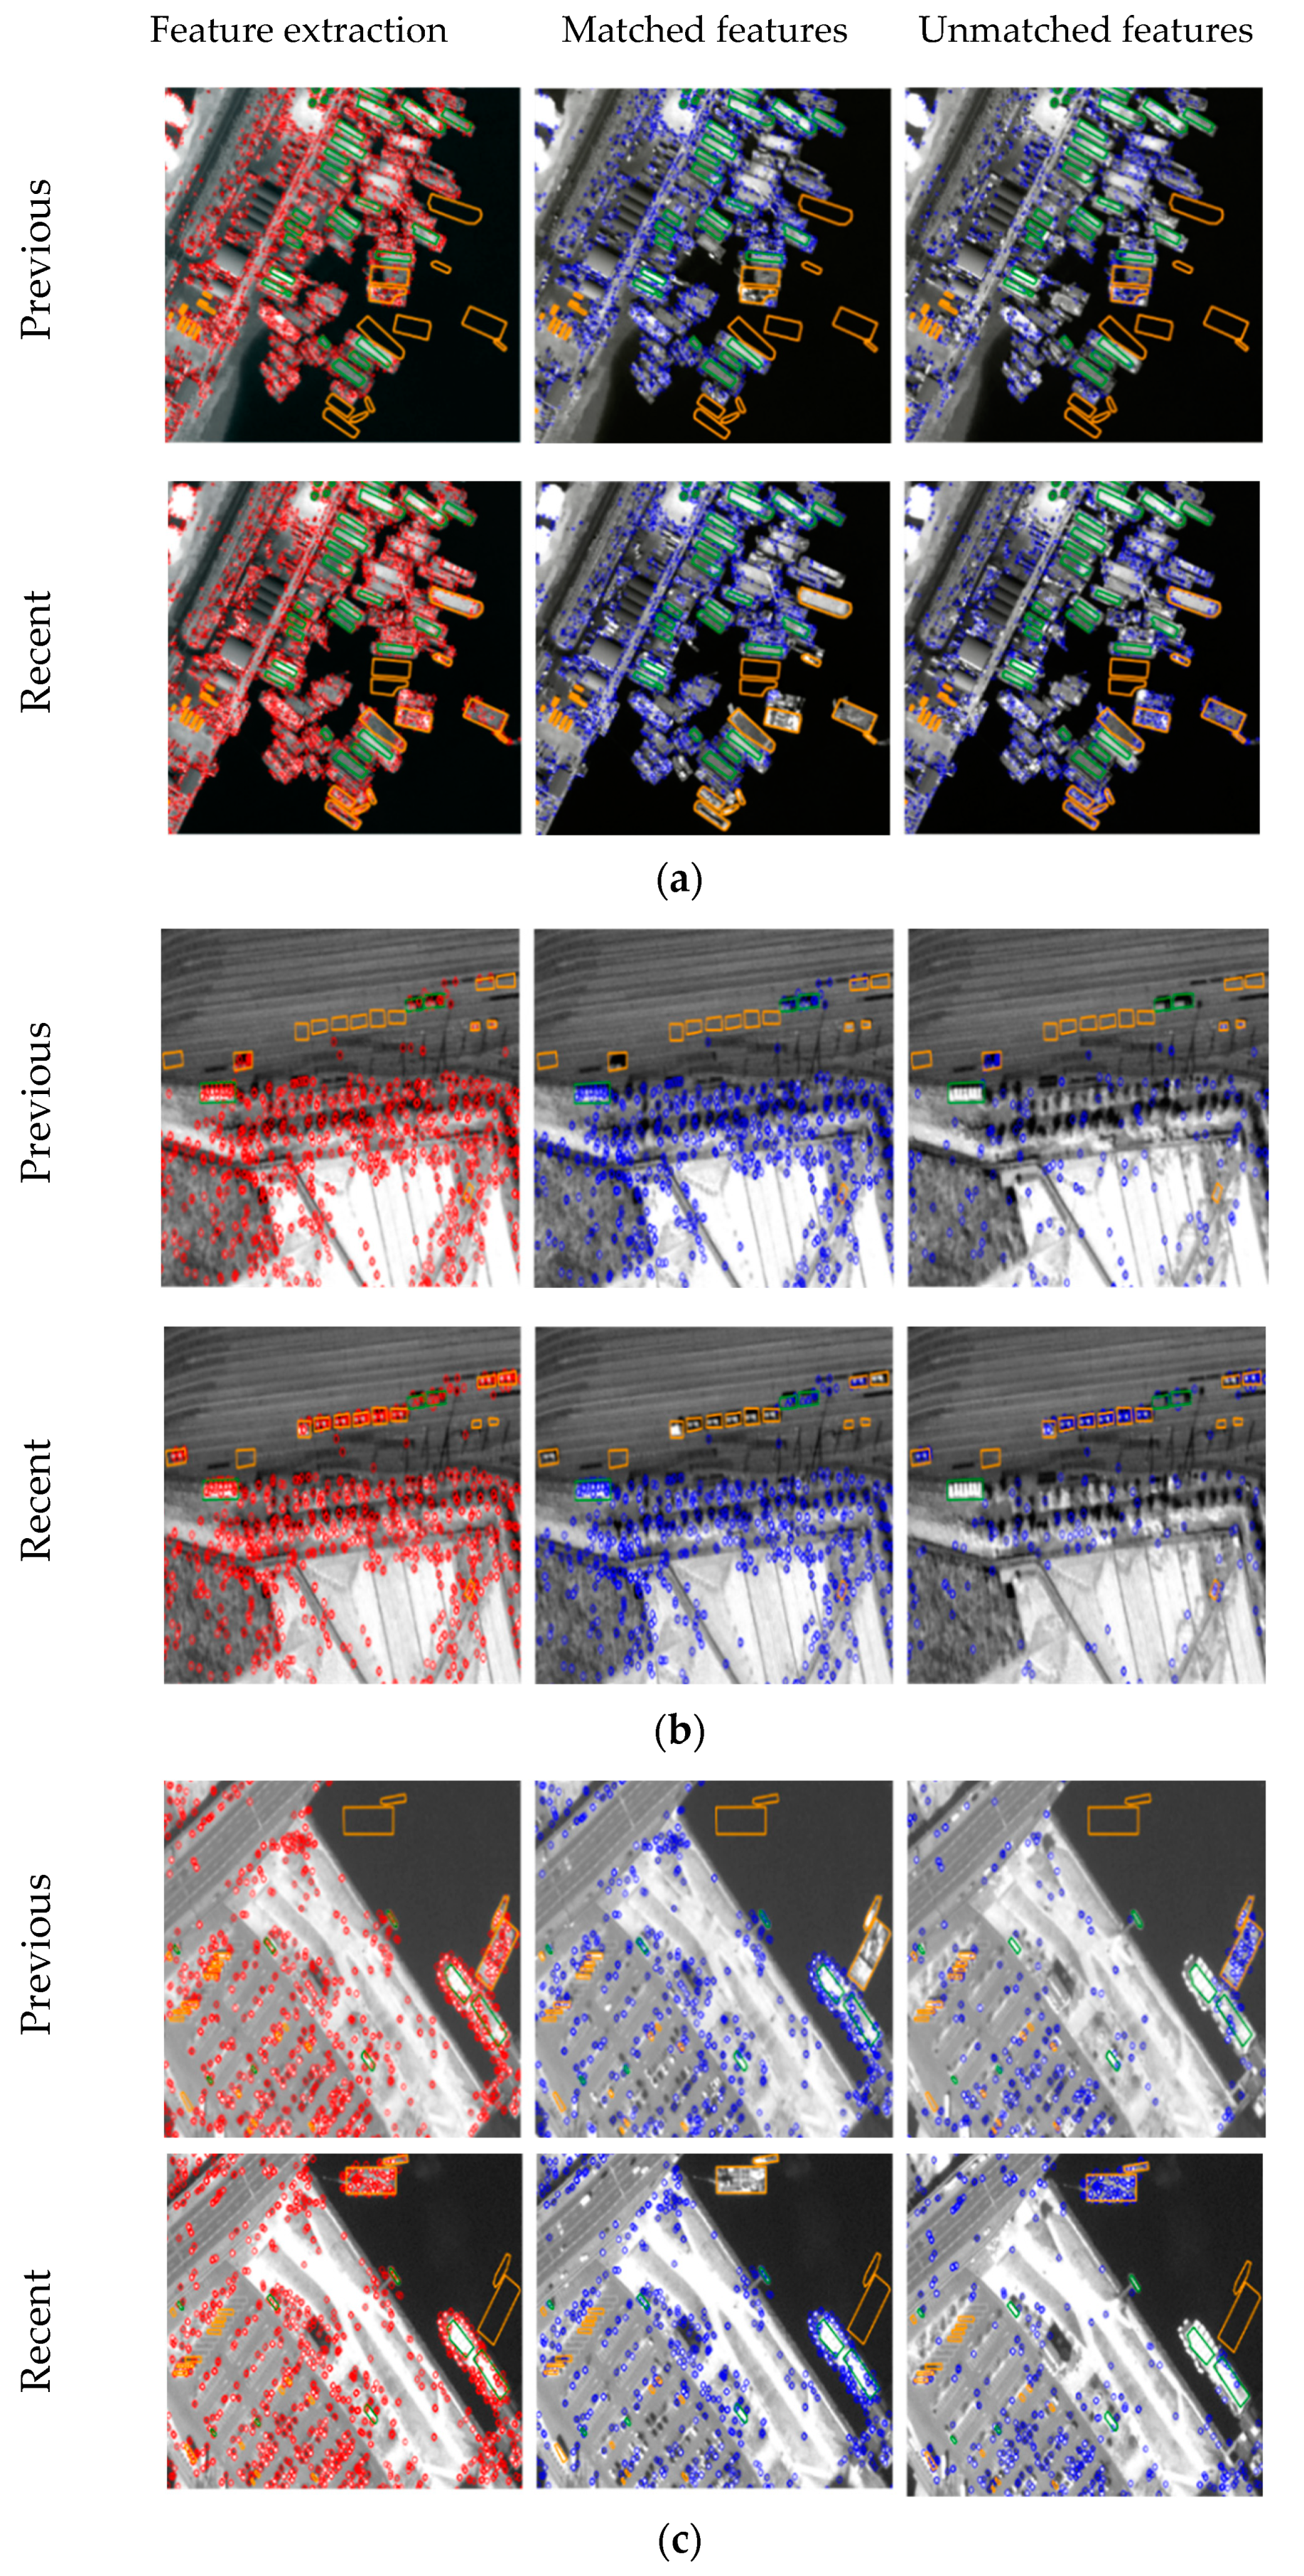
Table 4 shows the results from feature matching. The results were analyzed based on the number and ratio of matched features and those of unmatched features from among features taken from the overall test areas, from changed reference objects, and from unchanged reference objects. The ratio of matched features was about 60% with AKAZE and 54% with SIFT from among the overall features extracted from the test areas. It is very interesting to note that these numbers dropped to about 11% for features from changed reference objects, and that they increased to about 78% with AKAZE and to 68% with SIFT for features from unchanged reference objects. Nearly 90% of features in changed objects were unmatched, whereas 70% to 80% of features in unchanged objects were matched. Feature matching results indicate the status of change in the objects that the features belong to. Therefore, we could treat matched feature points as unchanged and remove them from further analysis.
Figure 7 shows the results from feature extraction and matching with the three test datasets. Within each dataset, feature extraction results (left images), matched features (middle images), and unmatched features (right images) are shown in both previous and recent images. Figure 7 also shows the changed reference objects in orange polygons and the unchanged reference objects in green polygons. We can visually check that features within unchanged objects matched, and that features from changed objects did not match.
4.3. Change Analysis Results
The unmatched features were processed further for change analysis. Pixel-based change magnitude maps were generated for each test dataset by applying the MAD algorithm. Changed pixels were determined by choosing a threshold value for the magnitude of pixel changes. As mentioned before, we performed feature-based change detection experiments repeatedly with various thresholds.
Feature change magnitude was defined as the ratio of changed pixels within the ROIs of the features. Changed features can be determined by choosing an appropriate threshold value for the magnitude of feature change. In this paper, we used ROIs with the size of 3 × 3 pixels and a feature-change threshold value of 0.5. We classified feature points into changed and unchanged features using the threshold.
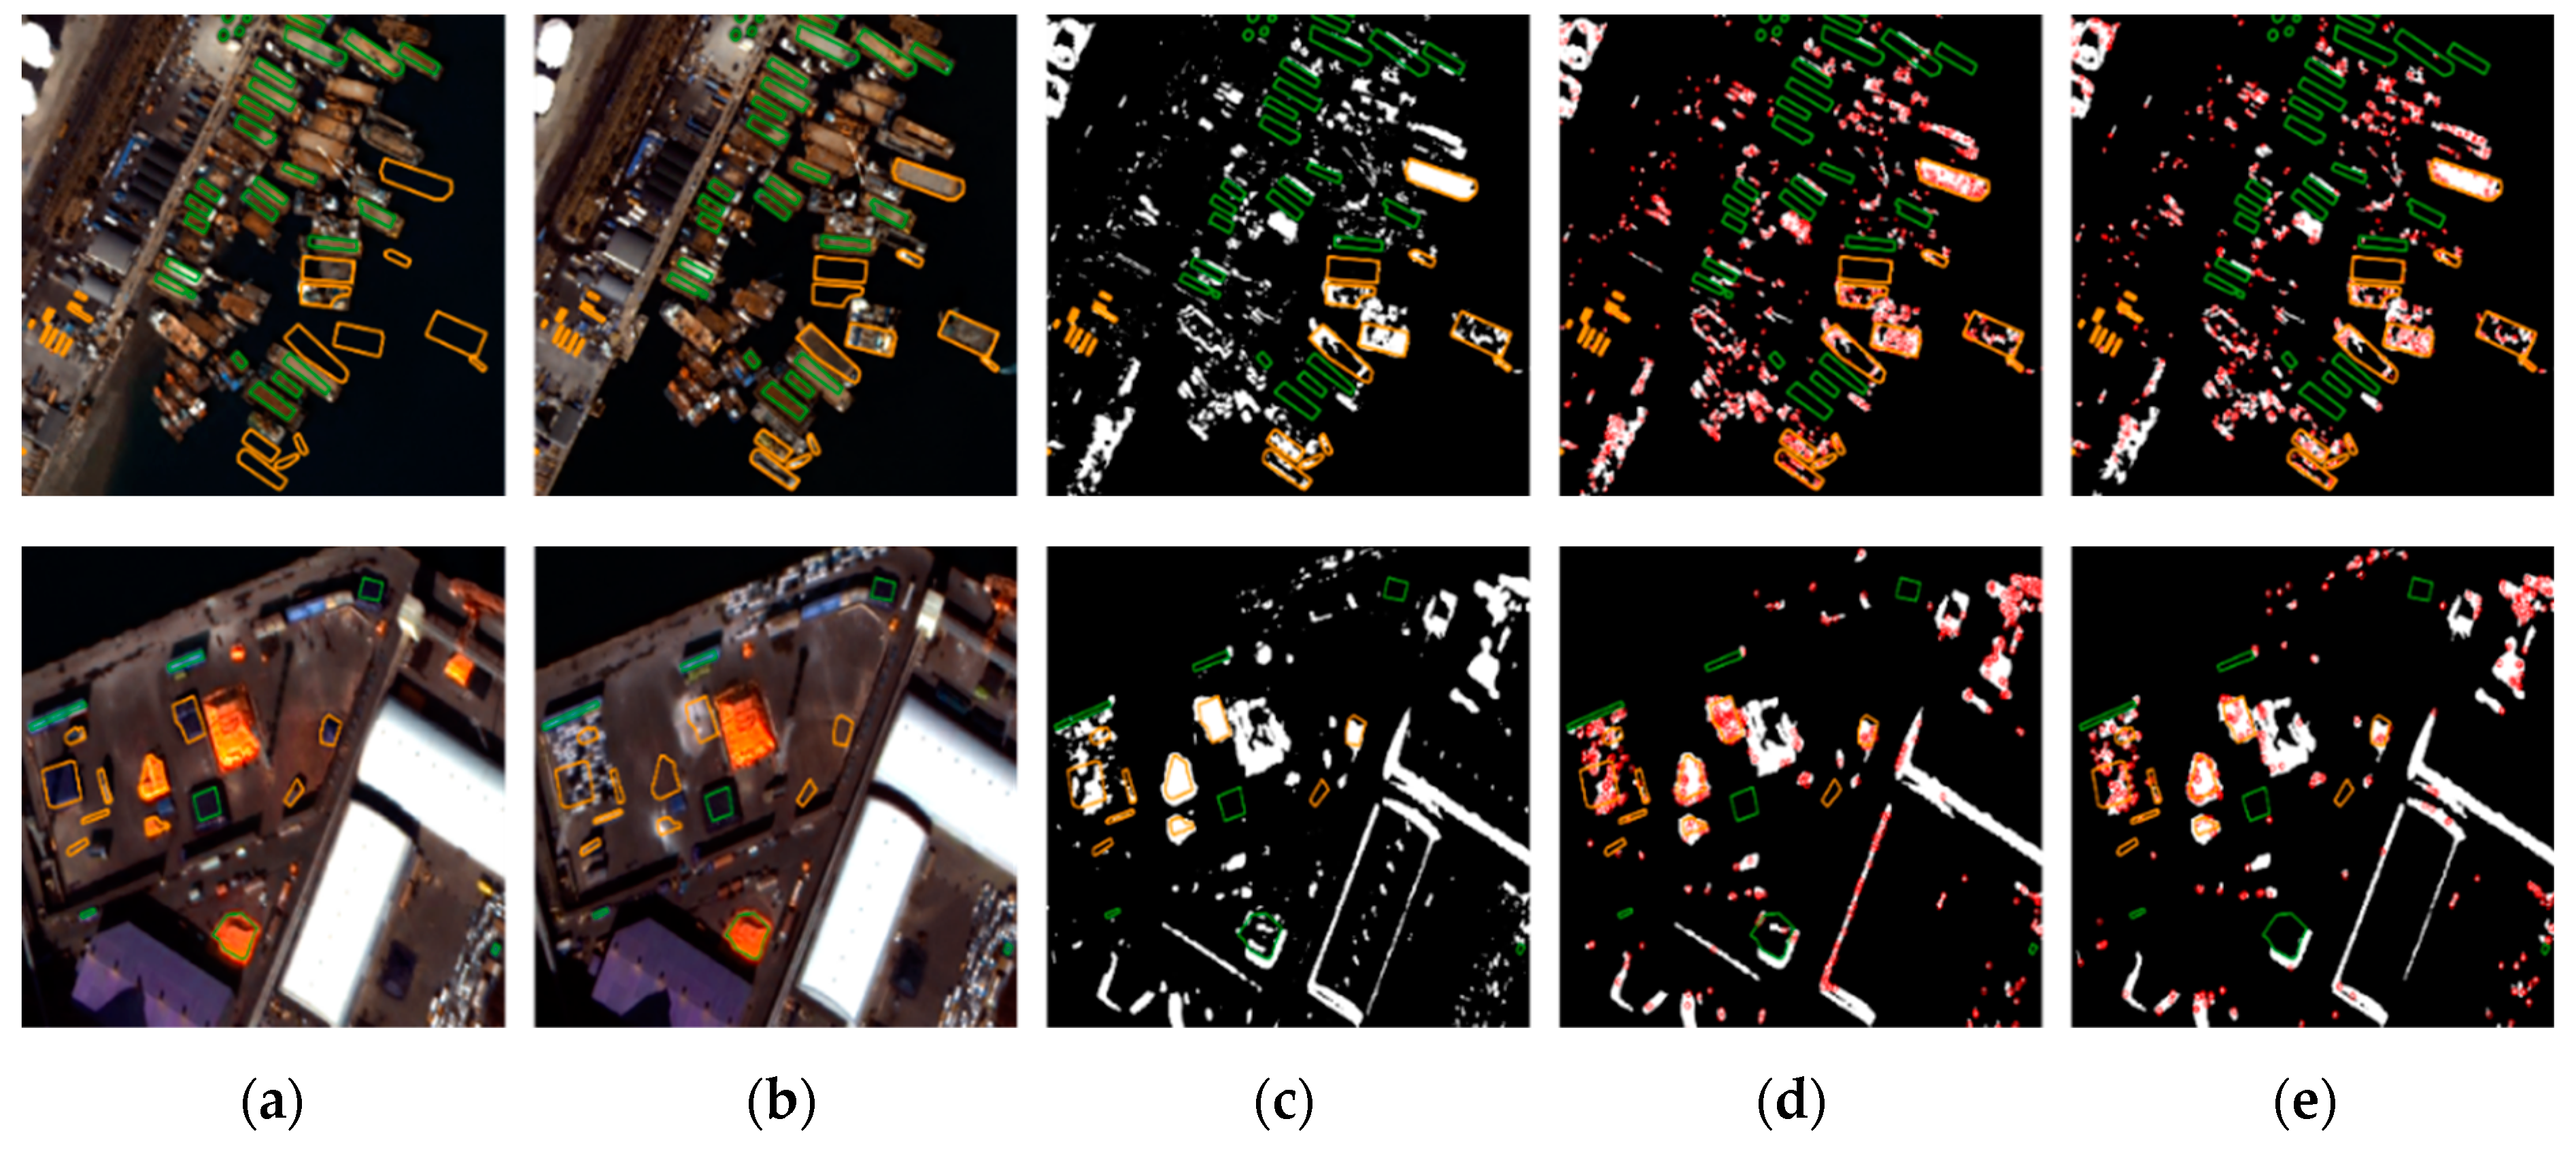
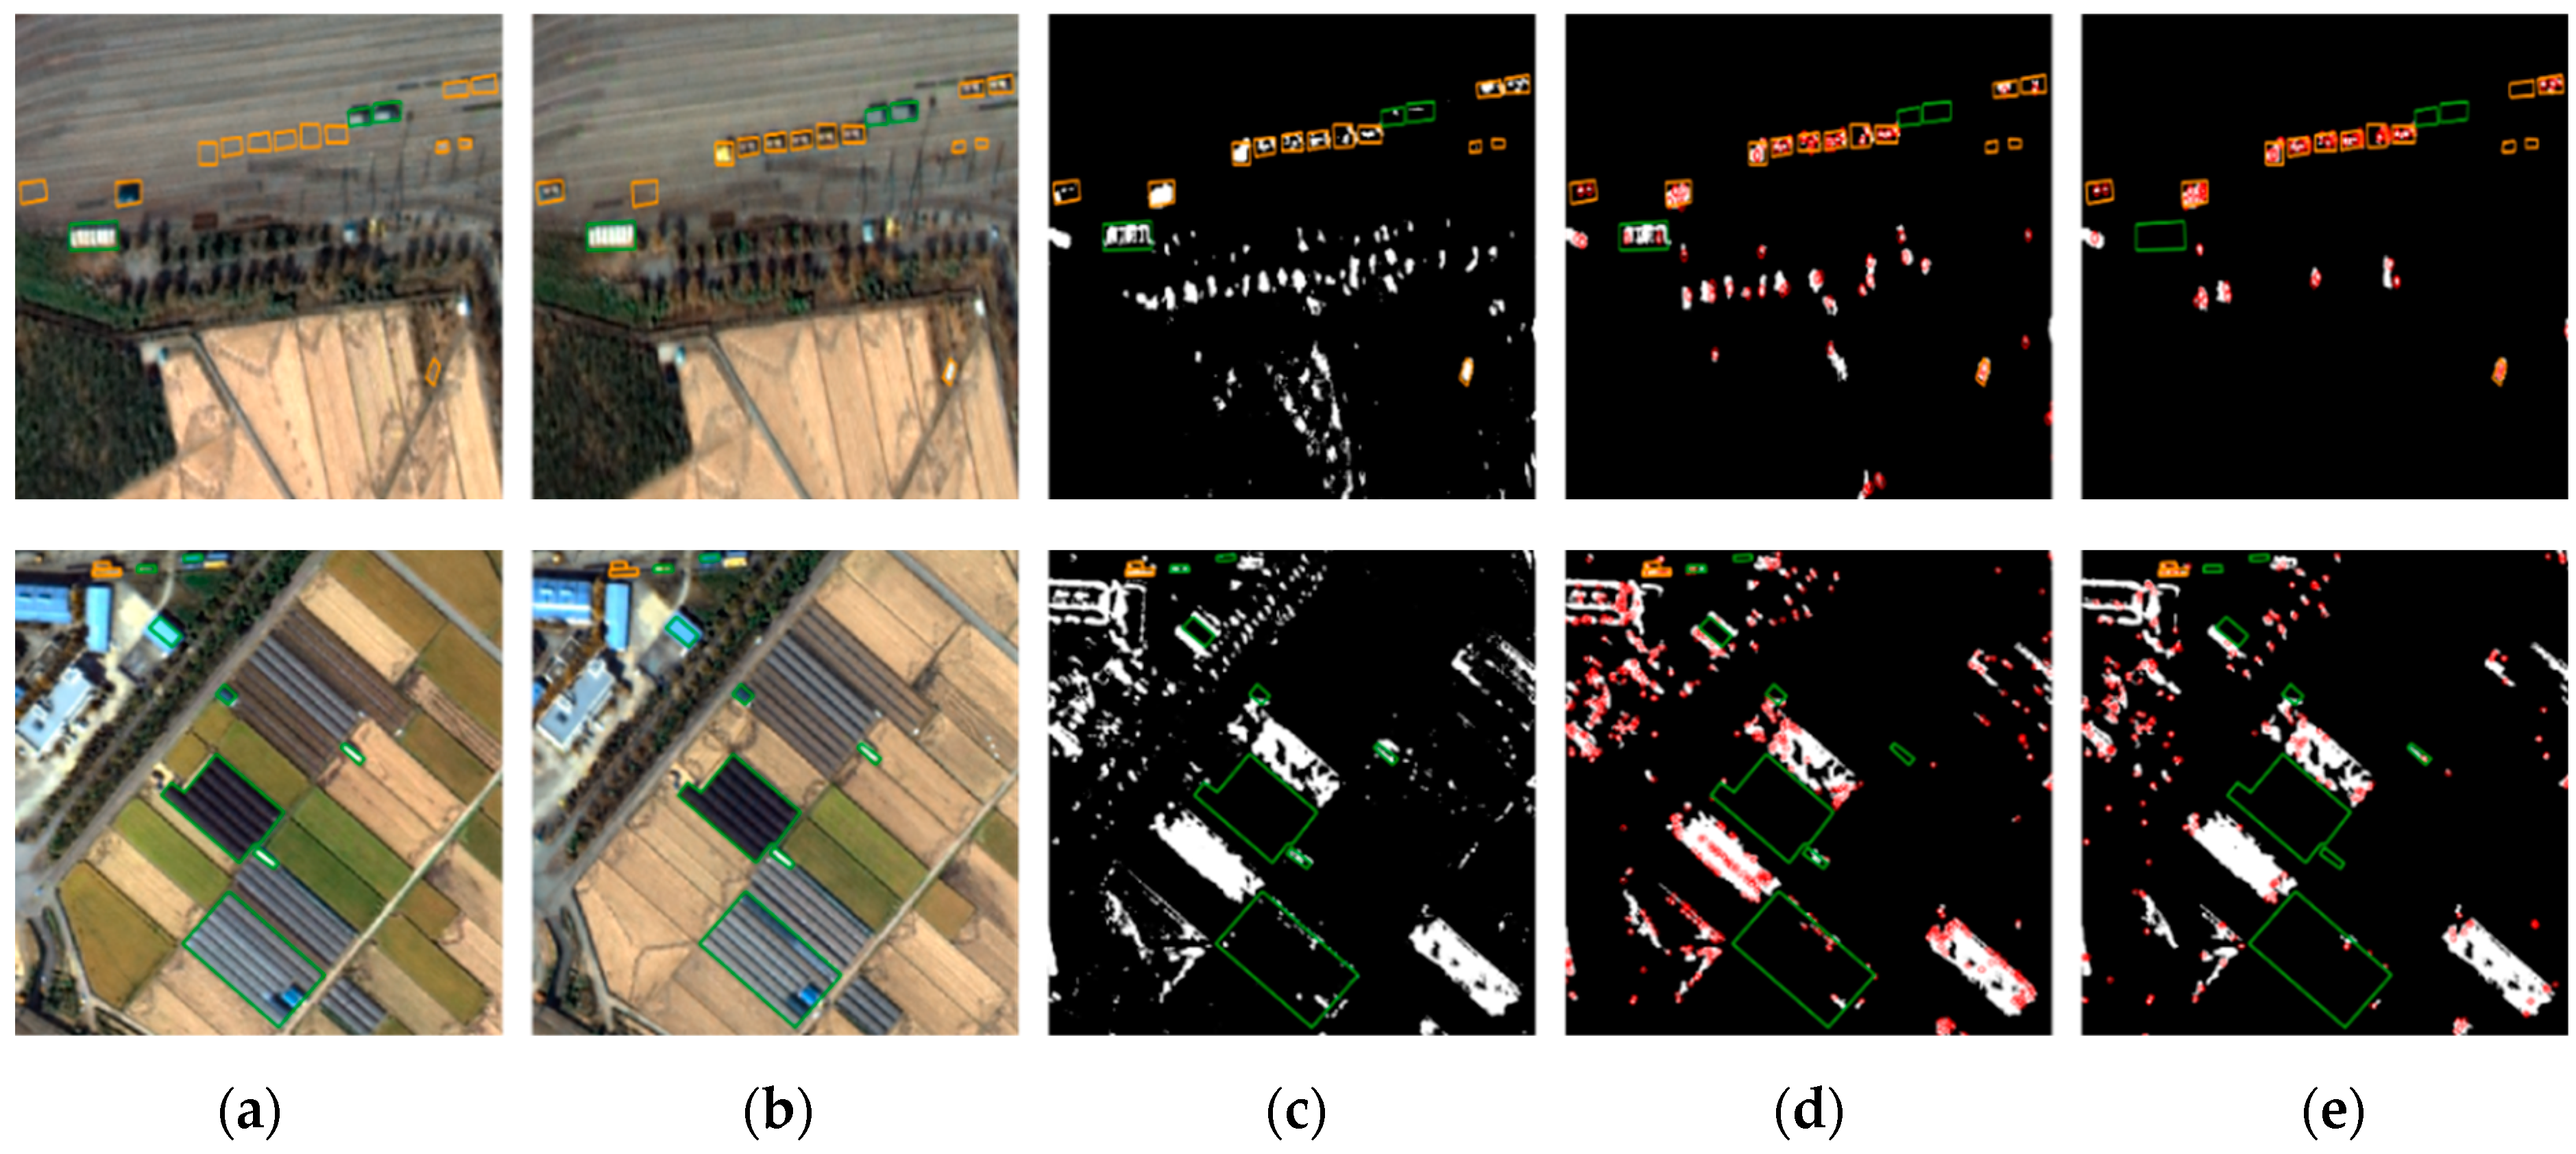
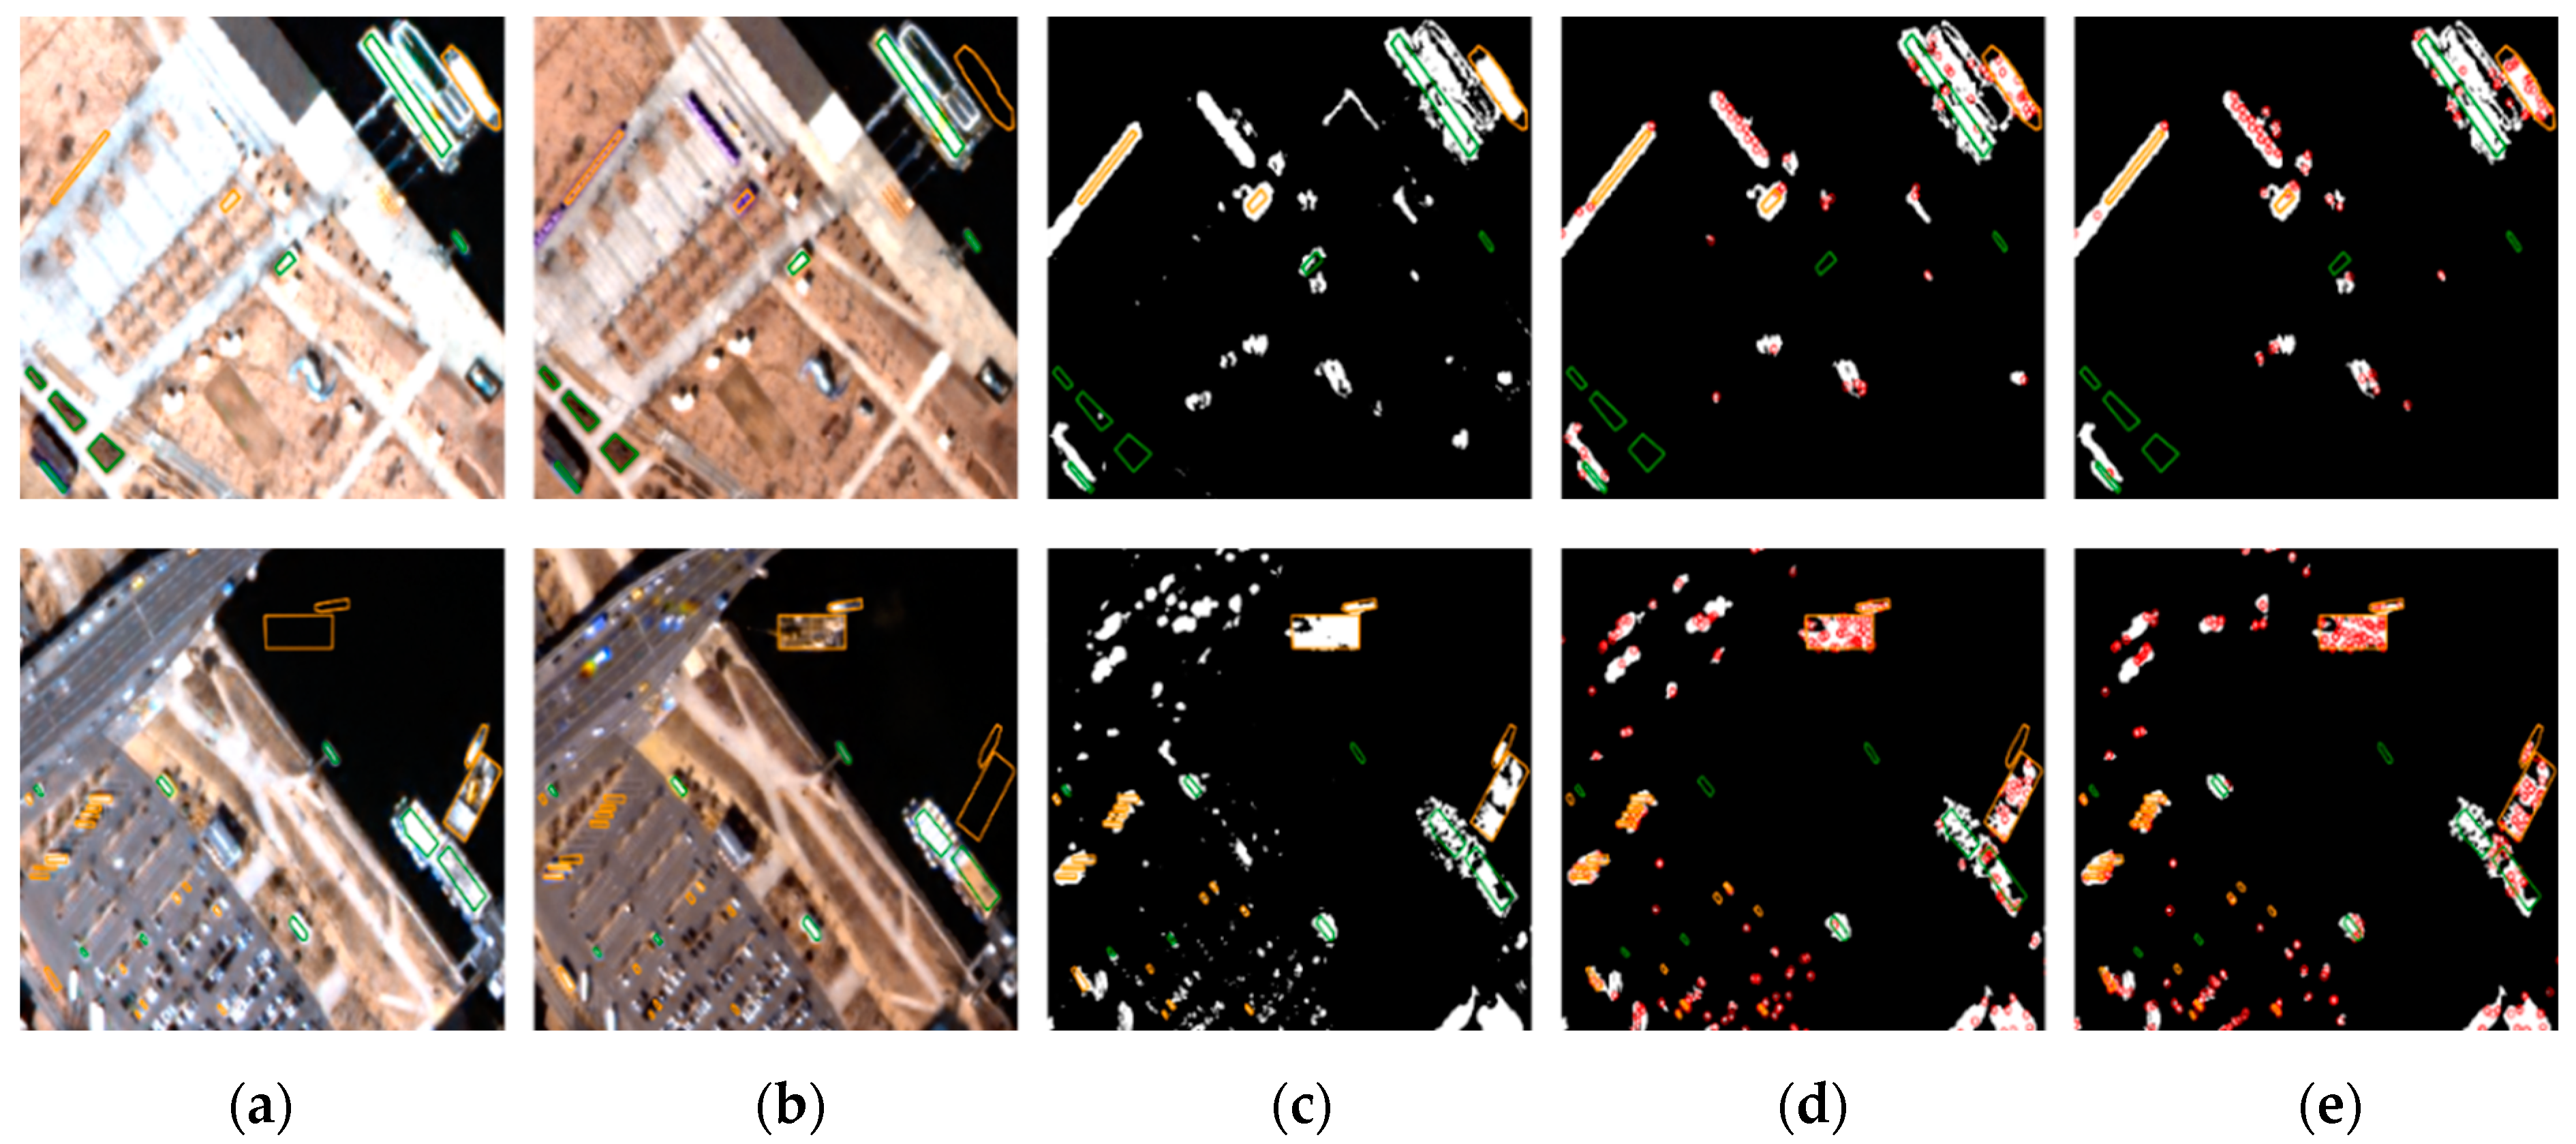
Figure 8, Figure 9 and Figure 10 show original images, pixel-based change maps for a given pixel threshold value, and feature-based change maps overlaid on the pixel-based change maps. The meaning of orange and green polygons is the same as before. We can compare the differences in pixel-based and feature-based change detection results. Many areas judged as changes in the pixel-based approach were determined to be unchanged in the feature-based approach. Feature-based change detection reduced false detection of unchanged objects while maintaining correct detection in changed objects. In Incheon, it was possible to detect changes in ships and shipments, and remove the falsely detected areas of unchanged buildings. In Chilgok and Seoul, it was possible to detect changes in small buses, trucks, and vehicles in parking lots and roads, and to remove errors from unchanged objects and areas of natural change. As mentioned earlier, several featureless changed objects of very small size were not detected. From the images, we can visually confirm that the use of feature points improves change detection performance with small objects, and compensates for the disadvantages of pixel-based approaches.
4.4. Analysis of Change Detection Performance
We analyzed the performance of the proposed feature-based change detection quantitatively, and compared the results with pixel-based change detection. With the pixel-based approach, pixels in the changed and unchanged reference objects were used for performance analysis. We checked whether they were classified as changed or unchanged pixels. With the feature-based approach, features extracted from the reference objects were used for performance analysis. We checked the number of features classified as changed or unchanged features.
ROC curves were generated by repeatedly performing pixel-based and feature-based change detection with various thresholds for pixel-change magnitude. Unlike pixel-based change detection, the feature-based approach does not converge to 1 owing to falsely matched features in changed reference objects. Instead, we generated ROC curves up to the false alarm rate of around 0.2. We compared the performance of feature-based change detection against pixel-based change detection in low-false-alarm regions.
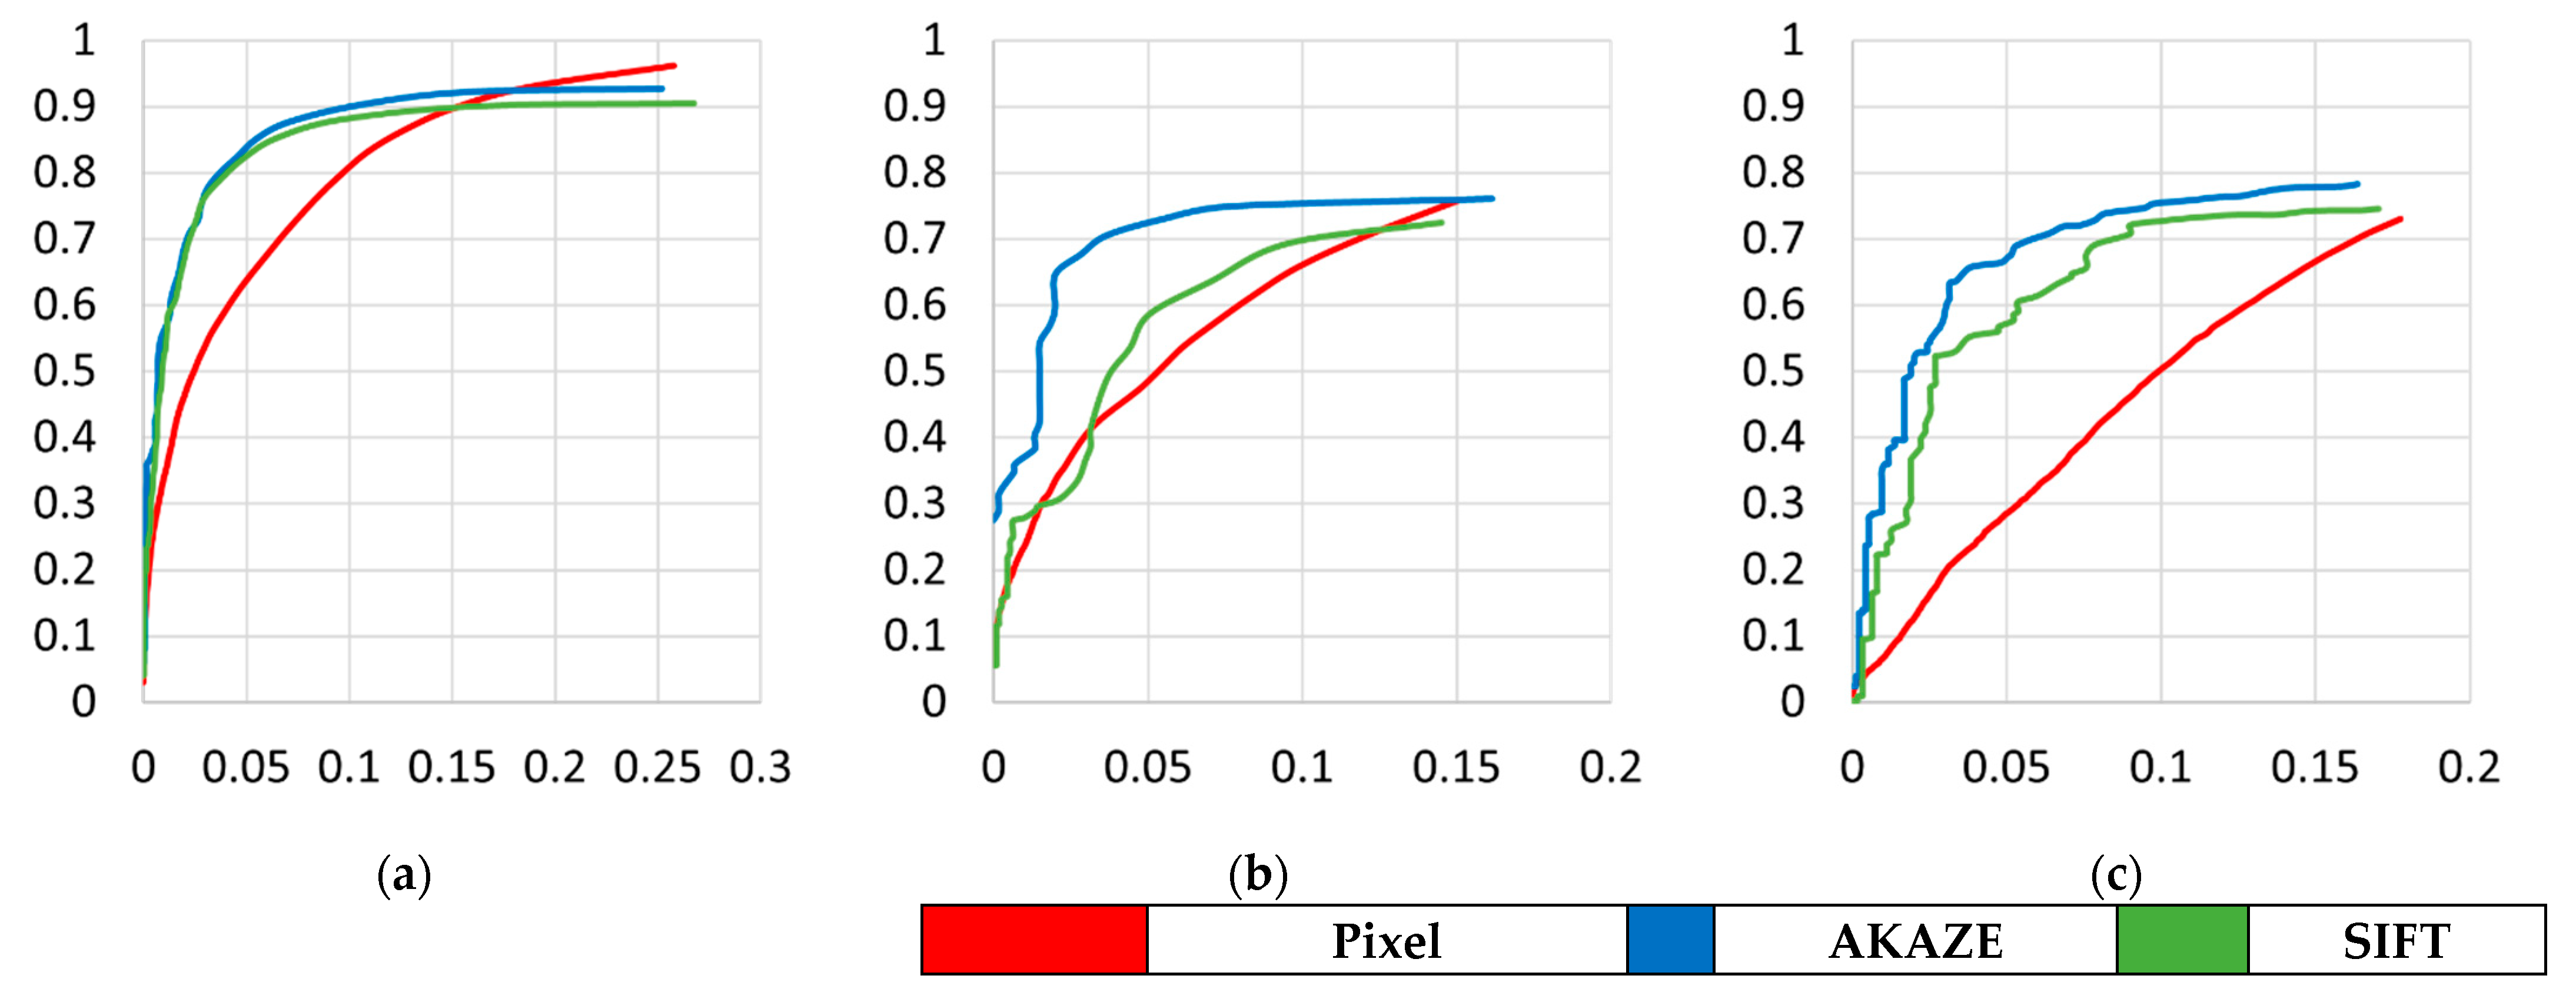
Figure 11 shows the ROC curves for the test areas. We can see that feature-based change detection outperformed pixel-based detection at low false–alarm rates. However, we clarify that one may prefer pixel-based approaches if one needs to detect as many changes as possible, despite high false alarm rates. Table 5 shows the accuracy, precision, false alarm rate, recall, F1-score, and AUC. The first five numbers were estimated by setting the pixel-change threshold value to produce a false alarm rate close to 0.1. The AUC was calculated by accumulating the area under ROC curve for false alarm rates from 0 to 0.1. The numbers in the table also favor feature-based change detection.
In the first performance comparison mentioned above, the number of features was used for feature-based change detection, while the number of pixels was used for pixel-based change detection. As the second performance comparison, we represented the results of feature-based change detection as pixels, and compared the performance against pixel-based change detection. The change map from the pixel-based approach was first segmented into changed regions, and the feature change results were then overlaid on the change regions, as shown in parts (d) and (e) of Figure 8, Figure 9 and Figure 10. The regions with changed features were accepted as the results of feature-based change detection and the regions without changed features were removed from the final results of feature-based change detection. We counted the number of pixels after the removal of the regions without changed features. In this way, the performance of pixel-based and feature-based change detection was compared in the pixel domain. Table 6 shows the performance in the pixel domain using the same threshold value for the pixel-change magnitude. The table shows that precision, accuracy, and false alarms improved under the feature-based approach. Recall decreased slightly due to the problem of featureless changed objects. Nevertheless, our feature-based approach outperformed the pixel-based approach when performance analysis was carried out in the pixel domain.
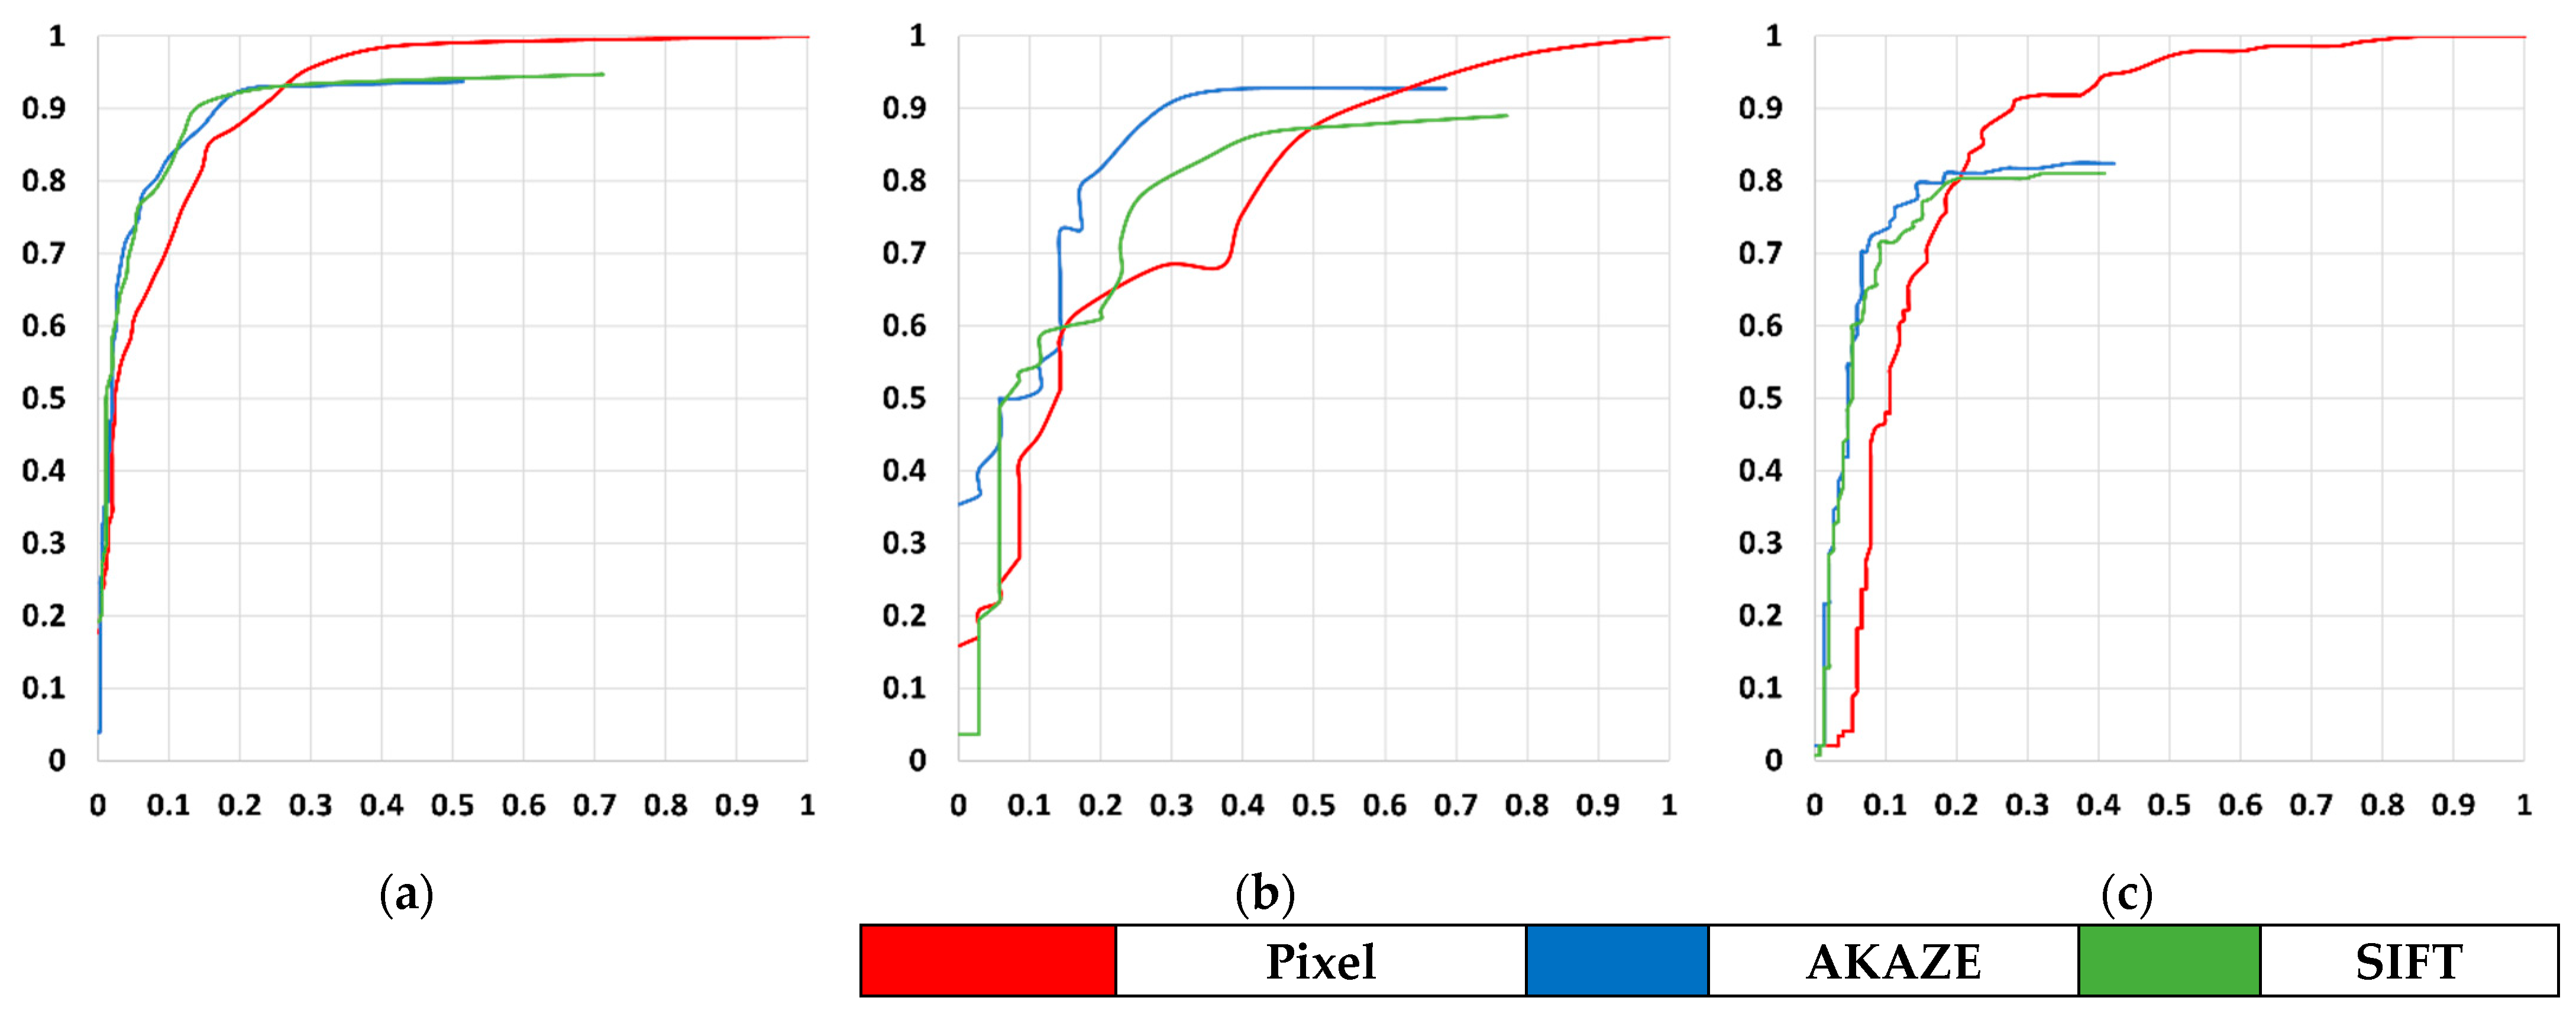
As the final performance comparison, we compared pixel-based and feature-based change detection in the object domain. We checked the number of correctly detected objects among the changed and unchanged reference objects. Since the pixel-based and feature-based approaches we used do not determine changes per object, we instead converted pixel-based and feature-based change detection results into object-based results: if more than half of all the pixels of the reference objects were determined as changes, we considered the objects to be changed. ROC curves were generated based on the number of successfully detected objects. Figure 12 shows the ROC curves. As before, the figure shows that our feature-based approach produced improved recall at the given false alarm rate. Table 7 shows the performance of pixel-based and feature-based change detection in the object domain using the same threshold value for pixel change magnitude. As expected, the false alarm rates decreased in feature-based approaches and precision and accuracy increased.
4.5. Discussion
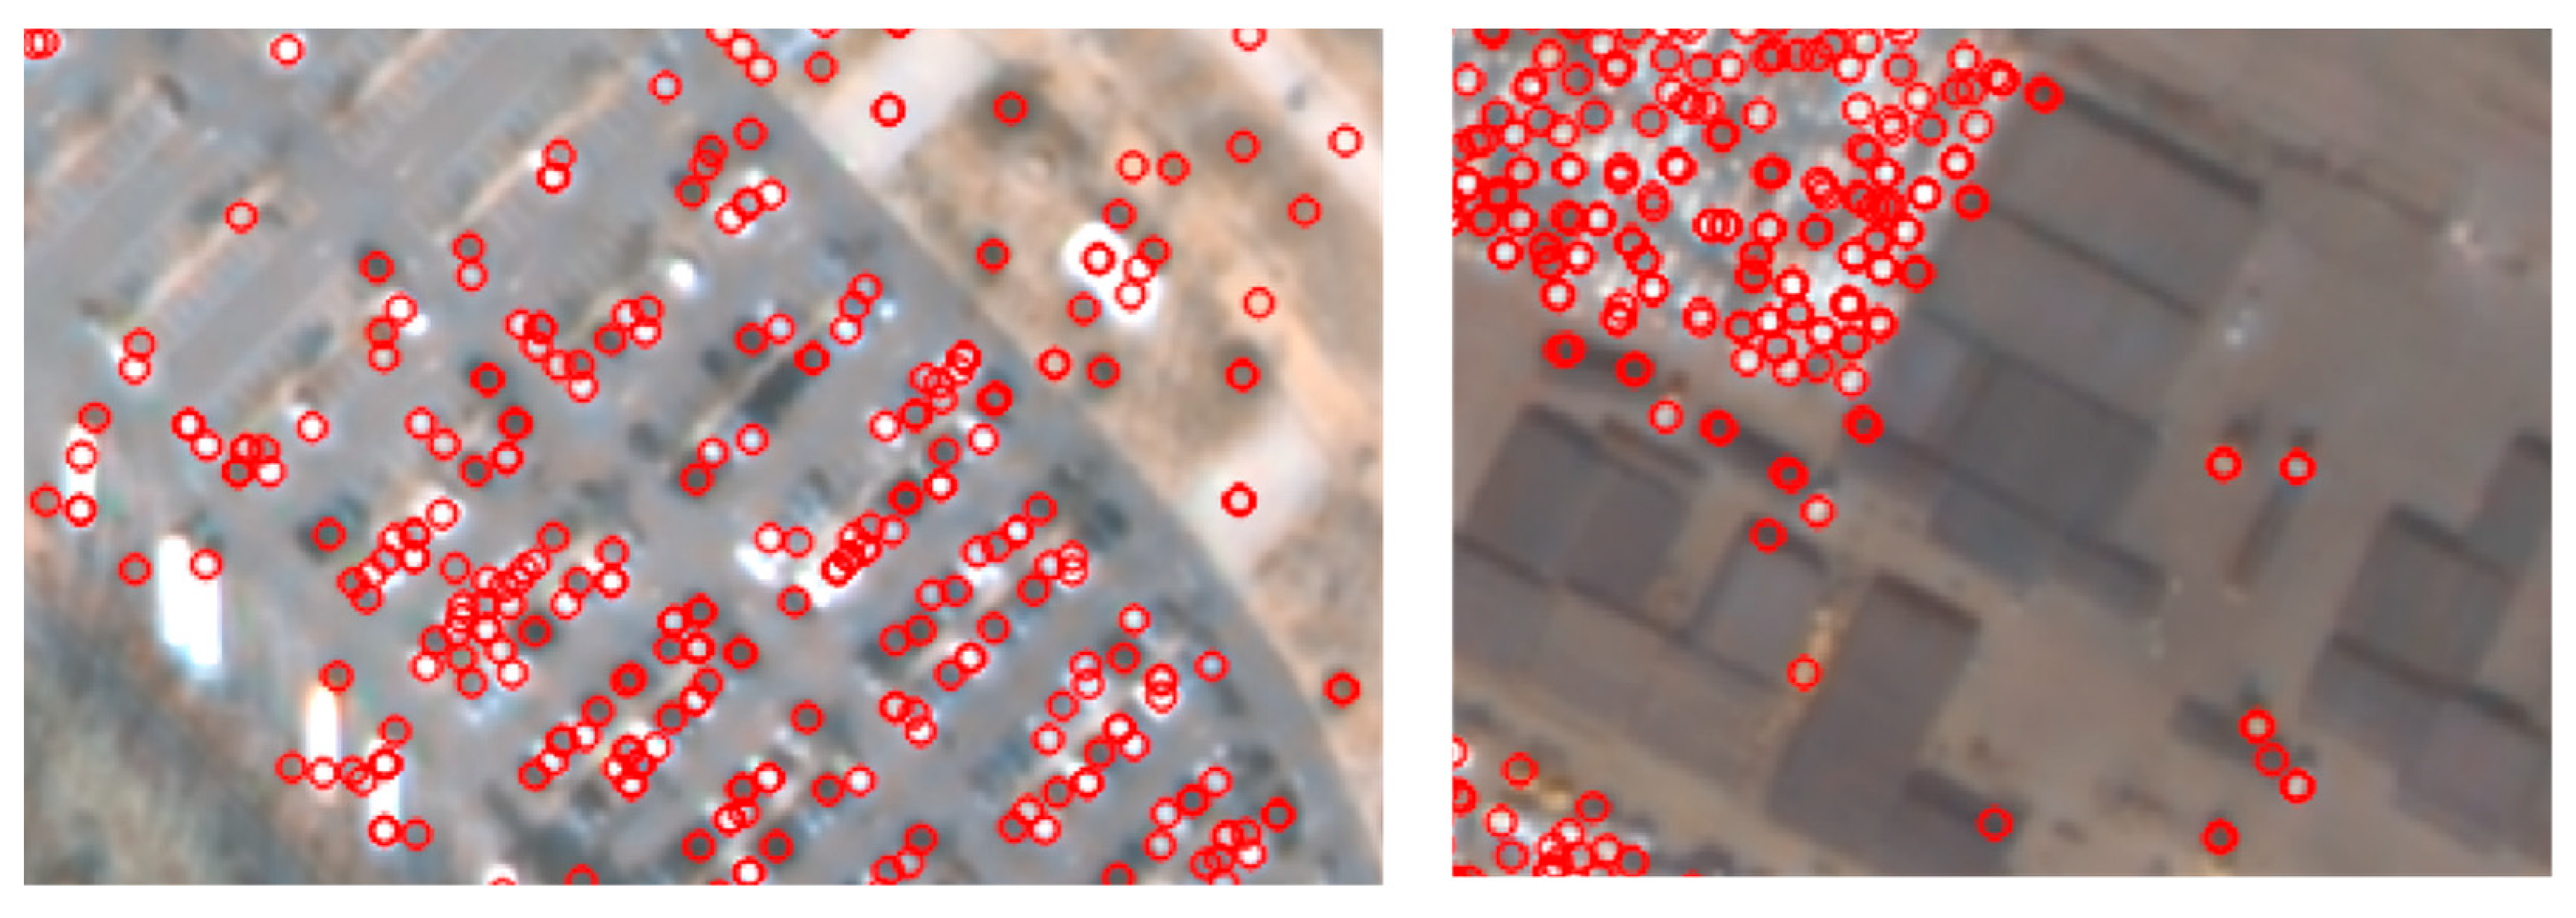
Based on the three performance comparisons, we observed that the feature-based approach outperformed the tested pixel-based approach. By considering features as a unit of change, and by applying feature matching, we could successfully remove many false alarms and noisy changes. We also observed a drawback to our approach, in that it could not handle featureless objects. Feature points (red circles) were not extracted from objects at small sizes or with low contrasts, as shown Figure 13. Since our approach relies on features to decide on change or no change, featureless objects are removed from the decision. This increases omission errors, and hence, decreases precision. This is the reason our approach could not reach a recall of 1 in Figure 11 and Figure 12.
We might address this problem by using pixel-based change detection on featureless objects. In this paper, we used pixel-based change detection simply to calculate the magnitude of feature change. Perhaps we need more intelligent schemes for merging pixel-based and feature-based change detection results. This issue, however, is left as a future research topic. We tested two representative feature extractors, AKAZE and SIFT, for feature-based change detection. We observed that both feature extractors led to the change detection performance in favor of our feature-based approach.
5. Conclusions
In this paper, we proposed a new change detection approach using feature points for detecting small object changes from high-resolution satellite images. We showed that feature points could be pre-classified as changed and unchanged objects through a feature point matching process to decrease false alarm rates. We also showed that feature point-based change analysis could improve change detection performance in terms of changed pixel, changed feature point, and changed object detection. Our test results with three Kompsat-3A image sets confirmed that our approach outperformed a pixel-based approach by producing higher precision and recall at a fixed false alarm rate. For a false alarm rate of 10%, our approach achieved an averaged precision rate of 88.7% and an averaged accuracy of 86.1%, while a pixel-based approach achieved 77.7% and 82.6%, respectively. The time of the research processing was less than 5 min, excluding the pre-processing.
One can classify traditional change detection from satellite images based on the unit of change determination: pixel-based, feature-based, and object-based. Our approach offers a new feature-based approach, which is less noisy than pixel-based approaches and faster than object-based approaches. This may produce clues to small object changes without extensive texture or object analysis compared to existing feature-based or object-based approaches. One may also classify traditional change detection as supervised or unsupervised based on the usage of prior knowledge. Our approach is an unsupervised one, which can be applied as a pre-processor for a sophisticated and time-consuming supervised approach such as deep learning [11,14,27,32] and neural networks [4,6,16]. Major contribution of this paper is that a unique approach of using feature points was proposed for unsupervised change detection.
We also observed the limitation of our approach that it cannot handle featureless objects, because we use features as the only unit of change. We might overcome this problem by implementing more intelligent schemes for merging pixel-based and feature-based change detection results, and by using both merged features and merged pixels as units of change determination. This will be left to future research.
Author Contributions
Investigation, J.S.; Methodology, J.S., W.P. and T.K.; Validation, J.S., W.P. and T.K.; Formal analysis, J.S., W.P. and T.K., Resources, J.S. and T.K., Writing—original draft, J.S. and T.K.; Writing—review & editing, J.S. and T.K. All authors have read and agreed to the published version of the manuscript.
Funding
This research was funded by the Satrec Initiative.
Institutional Review Board Statement
Not applicable.
Informed Consent Statement
Not applicable.
Data Availability Statement
Not applicable.
Conflicts of Interest
The authors declare no conflict of interest.
References
- Planet. Available online: https://www.planet.com/markets/education-and-research/ (accessed on 1 September 2021).
- Earth-i. Available online: https://earthi.space/industries/ (accessed on 1 September 2021).
- MAXAR. Available online: https://www.maxar.com/industries (accessed on 1 September 2021).
- Zhang, C.; Wei, S.; Ji, S.; Lu, M. Detecting large-scale urban land cover changes from very high resolution remote sensing images using CNN-based classification. ISPRS Int. J. Geo-Inf. 2019, 8, 189. [Google Scholar] [CrossRef] [Green Version]
- Silveira, E.M.D.O.; Mello, J.M.D.; Acerbi Júnior, F.W.; Carvalho, L.M.T.D. Object-based land-cover change detection applied to Brazilian seasonal savannahs using geostatistical features. Int. J. Remote Sens. 2018, 39, 2597–2619. [Google Scholar] [CrossRef]
- Cao, C.; Dragićević, S.; Li, S. Land-use change detection with convolutional neural network methods. Environments 2019, 6, 25. [Google Scholar] [CrossRef] [Green Version]
- Bueno, I.T.; Acerbi Junior, F.W.; Silveira, E.M.; Mello, J.M.; Carvalho, L.M.; Gomide, L.R.; Withey, K.; Scolforo, J.R.S. Object-based change detection in the Cerrado biome using landsat time series. Remote Sens. 2019, 11, 570. [Google Scholar] [CrossRef] [Green Version]
- Desclée, B.; Bogaert, P.; Defourny, P. Forest change detection by statistical object-based method. Remote Sens. Environ. 2006, 102, 1–11. [Google Scholar] [CrossRef]
- Housman, I.W.; Chastain, R.A.; Finco, M.V. An evaluation of forest health insect and disease survey data and satellite-based remote sensing forest change detection methods: Case studies in the United States. Remote Sens. 2018, 10, 1184. [Google Scholar] [CrossRef] [Green Version]
- Wang, F.; Xu, Y.J. Comparison of remote sensing change detection techniques for assessing hurricane damage to forests. Environ. Monit. Assess. 2010, 162, 311–326. [Google Scholar] [CrossRef] [PubMed]
- Sublime, J.; Kalinicheva, E. Automatic post-disaster damage mapping using deep-learning techniques for change detection: Case study of the tohoku tsunami. Remote Sens. 2019, 11, 1123. [Google Scholar] [CrossRef] [Green Version]
- Hakdaoui, S.; Emran, A.; Pradhan, B.; Lee, C.W.; Nguemhe Fils, S.C. A collaborative change detection approach on multi-sensor spatial imagery for desert wetland monitoring after a flash flood in Southern Morocco. Remote Sens. 2019, 11, 1042. [Google Scholar] [CrossRef] [Green Version]
- El-Asmar, H.M.; Hereher, M.E. Change detection of the coastal zone east of the Nile Delta using remote sensing. Environ. Earth Sci. 2011, 62, 769–777. [Google Scholar] [CrossRef]
- Peng, D.; Zhang, Y.; Guan, H. End-to-end change detection for high resolution satellite images using improved UNet++. Remote Sens. 2019, 11, 1382. [Google Scholar] [CrossRef] [Green Version]
- ZhiYong, L.; Liu, T.; Benediktsson, J.A.; Falco, N. Land cover change detection techniques: Very-high-resolution optical images: A review. IEEE Geosci. Remote Sens. Mag. 2021, 2–21. [Google Scholar] [CrossRef]
- Wang, Q.; Zhang, X.; Chen, G.; Dai, F.; Gong, Y.; Zhu, K. Change detection based on Faster R-CNN for high-resolution remote sensing images. Remote Sens. Lett. 2018, 9, 923–932. [Google Scholar] [CrossRef]
- Huang, X.; Cao, Y.; Li, J. An automatic change detection method for monitoring newly constructed building areas using time-series multi-view high-resolution optical satellite images. Remote Sens. Environ. 2020, 244, 111802. [Google Scholar] [CrossRef]
- Tewkesbury, A.P.; Comber, A.J.; Tate, N.J.; Lamb, A.; Fisher, P.F. A critical synthesis of remotely sensed optical image change detection techniques. Remote Sens. Environ. 2015, 160, 1–14. [Google Scholar] [CrossRef] [Green Version]
- Zhu, Z. Change detection using landsat time series: A review of frequencies, preprocessing, algorithms, and applications. ISPRS J. Photogramm. Remote Sens. 2017, 130, 370–384. [Google Scholar] [CrossRef]
- Asokan, A.; Anitha, J. Change detection techniques for remote sensing applications: A survey. Earth Sci. Inform. 2019, 12, 143–160. [Google Scholar] [CrossRef]
- Cheng, G.; Han, J. A survey on object detection in optical remote sensing images. ISPRS J. Photogramm. Remote Sens. 2016, 117, 11–28. [Google Scholar] [CrossRef] [Green Version]
- Hussain, M.; Chen, D.; Cheng, A.; Wei, H.; Stanley, D. Change detection from remotely sensed images: From pixel-based to object-based approaches. ISPRS J. Photogramm. Remote Sens. 2013, 80, 91–106. [Google Scholar] [CrossRef]
- Blaschke, T.; Hay, G.J.; Kelly, M.; Lang, S.; Hofmann, P.; Addink, E.; Feitosa, R.Q.; Van der Meer, F.; Van der Werff, H.; Van Coillie, F.; et al. Geographic object-based image analysis–towards a new paradigm. ISPRS J. Photogramm. Remote Sens. 2014, 87, 180–191. [Google Scholar] [CrossRef] [Green Version]
- Xiao, P.; Yuan, M.; Zhang, X.; Feng, X.; Guo, Y. Cosegmentation for object-based building change detection from high-resolution remotely sensed images. IEEE Trans. Geosci. Remote Sens. 2017, 55, 1587–1603. [Google Scholar] [CrossRef]
- Wen, D.; Huang, X.; Bovolo, F.; Li, J.; Ke, X.; Zhang, A.; Benediktsson, J.A. Change Detection from Very-High-Spatial-Resolution Optical Remote Sensing Images: Methods, applications, and future directions. IEEE Geosci. Remote Sens. Mag. 2021, 2–35. [Google Scholar] [CrossRef]
- Tan, K.; Jin, X.; Plaza, A.; Wang, X.; Xiao, L.; Du, P. Automatic change detection in high-resolution remote sensing images by using a multiple classifier system and spectral–spatial features. IEEE J. Sel. Top. Appl. Earth Obs. Remote Sens. 2016, 9, 3439–3451. [Google Scholar] [CrossRef]
- Yu, H.; Yang, W.; Hua, G.; Ru, H.; Huang, P. Change detection using high resolution remote sensing images based on active learning and Markov random fields. Remote Sens. 2017, 9, 1233. [Google Scholar] [CrossRef] [Green Version]
- Dalla Mura, M.; Benediktsson, J.A.; Bovolo, F.; Bruzzone, L. An unsupervised technique based on morphological filters for change detection in very high resolution images. IEEE Geosci. Remote Sens. Lett. 2008, 5, 433–437. [Google Scholar] [CrossRef]
- Tang, Y.; Huang, X.; Zhang, L. Fault-tolerant building change detection from urban high-resolution remote sensing imagery. IEEE Geosci. Remote Sens. Lett. 2013, 10, 1060–1064. [Google Scholar] [CrossRef]
- Huang, X.; Zhu, T.; Zhang, L.; Tang, Y. A novel building change index for automatic building change detection from high-resolution remote sensing imagery. Remote Sens. Lett. 2014, 5, 713–722. [Google Scholar] [CrossRef]
- Wei, C.; Zhao, P.; Li, X.; Wang, Y.; Liu, F. Unsupervised change detection of VHR remote sensing images based on multi-resolution Markov Random Field in wavelet domain. Int. J. Remote Sens. 2019, 40, 7750–7766. [Google Scholar] [CrossRef]
- Hou, B.; Wang, Y.; Liu, Q. Change detection based on deep features and low rank. IEEE Geosci. Remote Sens. Lett. 2017, 14, 2418–2422. [Google Scholar] [CrossRef]
- Huang, X.; Chen, H.; Gong, J. Angular difference feature extraction for urban scene classification using ZY-3 multi-angle high-resolution satellite imagery. ISPRS J. Photogramm. Remote Sens. 2018, 135, 127–141. [Google Scholar] [CrossRef]
- Tian, J.; Reinartz, P.; d’Angelo, P.; Ehlers, M. Region-based automatic building and forest change detection on Cartosat-1 stereo imagery. ISPRS J. Photogramm. Remote Sens. 2013, 79, 226–239. [Google Scholar] [CrossRef]
- Lowe, D.G. Distinctive image features from scale-invariant keypoints. Int. J. Comput. Vis. 2004, 60, 91–110. [Google Scholar] [CrossRef]
- Alcantarilla, P.F.; Solutions, T. Fast explicit diffusion for accelerated features in nonlinear scale spaces. IEEE Trans. Patt. Anal. Mach. Intell. 2011, 34, 1281–1298. [Google Scholar]
- Li, Y.; Zhou, J. Fast and effective image copy-move forgery detection via hierarchical feature point matching. IEEE Trans. Inf. Forensics Secur. 2018, 14, 1307–1322. [Google Scholar] [CrossRef]
- Guo, F.; Yang, J.; Chen, Y.; Yao, B. Research on image detection and matching based on SIFT features. In Proceedings of the 2018 3rd International Conference on Control and Robotics Engineering (ICCRE), Nagoya, Japan, 20–23 April 2018; pp. 130–134. [Google Scholar]
- Gesto-Diaz, M.; Tombari, F.; Gonzalez-Aguilera, D.; Lopez-Fernandez, L.; Rodriguez-Gonzalvez, P. Feature matching evaluation for multimodal correspondence. ISPRS J. Photogramm. Remote Sens. 2017, 129, 179–188. [Google Scholar] [CrossRef]
- Gong, J.; Hu, X.; Pang, S.; Li, K. Patch matching and dense CRF-based co-refinement for building change detection from Bi-temporal aerial images. Sensors 2019, 19, 1557. [Google Scholar] [CrossRef] [Green Version]
- Nebiker, S.; Lack, N.; Deuber, M. Building change detection from historical aerial photographs using dense image matching and object-based image analysis. Remote Sens. 2014, 6, 8310–8336. [Google Scholar] [CrossRef] [Green Version]
- Zhou, Y.; Song, Y.; Cui, S.; Zhu, H.; Sun, J.; Qin, W. A Novel Change Detection Framework in Urban Area Using Multilevel Matching Feature and Automatic Sample Extraction Strategy. IEEE J. Sel. Top. Appl. Earth Obs. Remote Sens. 2021, 14, 3967–3987. [Google Scholar] [CrossRef]
- Hossain, M.D.; Chen, D. Segmentation for Object-Based Image Analysis (OBIA): A review of algorithms and challenges from remote sensing perspective. ISPRS J. Photogramm. Remote Sens. 2019, 150, 115–134. [Google Scholar] [CrossRef]
- Kavzoglu, T. Increasing the accuracy of neural network classification using refined training data. Environ. Model. Softw. 2009, 24, 850–858. [Google Scholar] [CrossRef]
- Yoon, S.; Son, J.; Park, H.; Seo, J.; Lee, Y.; Ban, S.; Choi, J.; Kim, B.; Lee, H.J.; Lee, K.; et al. CAS 500-1/2 Image Utilization Technology and System Development: Achievement and Contribution. Korean J. Remote Sens. 2020, 36, 867–879. [Google Scholar]
- Tareen, S.A.K.; Saleem, Z. A comparative analysis of SIFT, SURF, KAZE, AKAZE, ORB, and BRISK. In Proceedings of the 2018 International Conference on Computing, Mathematics and Engineering Technologies (iCoMET), Sukkur, Pakistan, 3–4 March 2018; pp. 1–10. [Google Scholar]
- de Lima, R.; Cabrera-Ponce, A.A.; Martinez-Carranza, J. Parallel hashing-based matching for real-time aerial image mosaicking. J. Real Time Image Process. 2021, 18, 143–156. [Google Scholar] [CrossRef]
- Nielsen, A.A.; Conradsen, K.; Simpson, J.J. Multivariate alteration detection (MAD) and MAF postprocessing in multispectral, bitemporal image data: New approaches to change detection studies. Remote Sens. Environ. 1998, 64, 1–19. [Google Scholar] [CrossRef] [Green Version]
- Nielsen, A.A. The regularized iteratively reweighted MAD method for change detection in multi-and hyperspectral data. IEEE Trans. Image process. 2007, 16, 463–478. [Google Scholar] [CrossRef] [Green Version]
- Du, B.; Wang, Y.; Wu, C.; Zhang, L. Unsupervised scene change detection via latent Dirichlet allocation and multivariate alteration detection. IEEE J. Sel. Appl. Earth Obs. Remote Sens. 2018, 11, 4676–4689. [Google Scholar] [CrossRef]
- Migas-Mazur, R.; Kycko, M.; Zwijacz-Kozica, T.; Zagajewski, B. Assessment of Sentinel-2 images, support vector machines and change detection algorithms for bark beetle outbreaks mapping in the Tatra mountains. Remote Sens. 2021, 13, 3314. [Google Scholar] [CrossRef]
Figure 1.
Workflow of the proposed feature-based change detection method.

Figure 2.
Feature point matching using a bucket: (a) bucketing the entire image, and (b) feature matching results in one bucket.
Figure 2.
Feature point matching using a bucket: (a) bucketing the entire image, and (b) feature matching results in one bucket.

Figure 3.
The process of feature-based change analysis: (a) a pixel-based change map; (b) the distribution of features within the marked area of the pixel-based change map; and (c) one ROI of 3 × 3 pixels defined on a feature point.
Figure 3.
The process of feature-based change analysis: (a) a pixel-based change map; (b) the distribution of features within the marked area of the pixel-based change map; and (c) one ROI of 3 × 3 pixels defined on a feature point.

Figure 4.
Study areas in Kompsat-3A images used. Red boxes indicate the areas for (a) Incheon, (b) Chilgok, and (c) Seoul.
Figure 4.
Study areas in Kompsat-3A images used. Red boxes indicate the areas for (a) Incheon, (b) Chilgok, and (c) Seoul.

Figure 5.
Previous images (top row) and recent images (bottom row) over the study areas from (a) Incheon, (b) Chilgok, and (c) Seoul.
Figure 5.
Previous images (top row) and recent images (bottom row) over the study areas from (a) Incheon, (b) Chilgok, and (c) Seoul.

Figure 6.
Examples of changed reference objects (marked in orange) and unchanged objects (marked in green) from (a) Incheon, (b) Chilgok, and (c) Seoul.
Figure 6.
Examples of changed reference objects (marked in orange) and unchanged objects (marked in green) from (a) Incheon, (b) Chilgok, and (c) Seoul.

Figure 7.
Feature extraction and matching results for (a) Incheon, (b) Chilgok, and (c) Seoul.

Figure 8.
Comparison of pixel-based and feature point-based change detection results for Incheon: (a) before images, (b) after images, (c) pixel-based results, and feature-based results using (d) SIFT, and (e) AKAZE.
Figure 8.
Comparison of pixel-based and feature point-based change detection results for Incheon: (a) before images, (b) after images, (c) pixel-based results, and feature-based results using (d) SIFT, and (e) AKAZE.

Figure 9.
Comparison of pixel-based and feature point-based change detection results for Chilgok: (a) before images, (b) after images, (c) pixel-based results, and feature-based results using (d) SIFT, and (e) AKAZE.
Figure 9.
Comparison of pixel-based and feature point-based change detection results for Chilgok: (a) before images, (b) after images, (c) pixel-based results, and feature-based results using (d) SIFT, and (e) AKAZE.

Figure 10.
Comparison pixel-based and feature point-based change detection results for Seoul: (a) before images, (b) after images, (c) pixel-based results, and feature-based results using (d) SIFT, and (e) AKAZE.
Figure 10.
Comparison pixel-based and feature point-based change detection results for Seoul: (a) before images, (b) after images, (c) pixel-based results, and feature-based results using (d) SIFT, and (e) AKAZE.

Figure 11.
The ROC curves for pixel-based and feature point-based change in (a) Incheon, (b) Chilgok, and (c) Seoul. X-axis represents false alarm rate and Y-axis recall.
Figure 11.
The ROC curves for pixel-based and feature point-based change in (a) Incheon, (b) Chilgok, and (c) Seoul. X-axis represents false alarm rate and Y-axis recall.

Figure 12.
The ROC curves for pixel-based and feature point-based approaches with respect to the number of object changes in (a) Incheon, (b) Chilgok, and (c) Seoul. X-axis represents false alarm rate and Y-axis recall.
Figure 12.
The ROC curves for pixel-based and feature point-based approaches with respect to the number of object changes in (a) Incheon, (b) Chilgok, and (c) Seoul. X-axis represents false alarm rate and Y-axis recall.

Figure 13.
Enlarged feature-point extraction results.


Table 1.
Temporal specifications of the Kompsat-3A image sets.
| Study Area | Incheon | Chilgok | Seoul |
|---|---|---|---|
| Acquisition dates of previous images | 18.01.19 | 18.10.24 | 17.02.23 |
| Acquisition dates of recent images | 18.01.27 | 18.11.01 | 17.02.24 |
Table 2.
The quantity and sizes of reference objects.
| Incheon | Chilgok | Seoul | |
|---|---|---|---|
| Number of changed objects | 400 | 82 | 149 |
| Number of unchanged objects | 350 | 35 | 152 |
| Average size of changed objects (pixels/m2) | 660/165 | 196/49 | 90/23 |
| Average size of unchanged objects (pixels/m2) | 398/100 | 1114/278 | 266/66 |
Table 3.
Results of feature extraction.
| Study Area | Extractor Type | Number of Extracted Features | References with Features/ Total Reference Objects | |||
|---|---|---|---|---|---|---|
| From the Total Area | From Changed References | From Unchanged References | Changed | Unchanged | ||
| Incheon | AKAZE | 389,192 | 4972 | 2216 | 383/400 | 283/350 |
| SIFT | 642,565 | 5743 | 3321 | 390/400 | 336/350 | |
| Chilgok | AKAZE | 617,735 | 523 | 601 | 82/82 | 35/35 |
| SIFT | 954,061 | 448 | 1111 | 82/82 | 35/35 | |
| Seoul | AKAZE | 136,619 | 608 | 954 | 139/148 | 138/152 |
| SIFT | 123,946 | 449 | 634 | 143/148 | 139/152 | |
| Total | AKAZE | - | - | - | 604/630 | 456/537 |
| SIFT | - | - | - | 615/630 | 510/537 | |
Table 4.
Feature matching results.
| Study Area | Extractor Type | Overall | In Changed References | In Unchanged References | |||
|---|---|---|---|---|---|---|---|
| Unmatched | Matched | Unmatched | Matched | Unmatched | Matched | ||
| Incheon | AKAZE | 171,782 | 217,410 | 4614 | 358 | 558 | 1658 |
| SIFT | 314,575 | 327,990 | 5226 | 517 | 1231 | 2090 | |
| Chilgok | AKAZE | 220,090 | 397,645 | 398 | 125 | 97 | 504 |
| SIFT | 413,291 | 540,770 | 334 | 114 | 305 | 806 | |
| Seoul | AKAZE | 66,391 | 70,228 | 476 | 132 | 156 | 798 |
| SIFT | 66,779 | 57,167 | 335 | 114 | 108 | 526 | |
| Total | AKAZE | 40.07% | 59.93% | 89.92% | 10.08% | 21.51% | 78.49% |
| SIFT | 46.18% | 53.82% | 88.78% | 11.22% | 32.45% | 67.55% | |
Table 5.
Performance of pixel-based and feature-based change detection in the reference objects.
| Study Area | Method | Precision | Accuracy | False Alarms | Recall | F1 | AUC_0.1 |
|---|---|---|---|---|---|---|---|
| Incheon | Pixel | 0.9354 | 0.8519 | 0.1088 | 0.8311 | 0.8801 | 0.0682 |
| AKAZE | 0.9499 | 0.9009 | 0.1069 | 0.9045 | 0.9266 | 0.0850 | |
| SIFT | 0.9404 | 0.8896 | 0.0967 | 0.8816 | 0.9100 | 0.0741 | |
| Chilgok | Pixel | 0.7674 | 0.8247 | 0.0715 | 0.5729 | 0.6560 | 0.0464 |
| AKAZE | 0.8950 | 0.8425 | 0.0765 | 0.7495 | 0.8158 | 0.0814 | |
| SIFT | 0.7851 | 0.8454 | 0.0702 | 0.6362 | 0.7028 | 0.0491 | |
| Seoul | Pixel | 0.6271 | 0.8010 | 0.1004 | 0.5059 | 0.5600 | 0.0280 |
| AKAZE | 0.8159 | 0.8393 | 0.1090 | 0.7582 | 0.7860 | 0.0680 | |
| SIFT | 0.8363 | 0.8283 | 0.1009 | 0.7283 | 0.7786 | 0.0537 | |
| Mean | Pixel | 0.7766 | 0.8259 | 0.0936 | 0.6366 | 0.6987 | 0.0475 |
| AKAZE | 0.8869 | 0.8609 | 0.0975 | 0.8041 | 0.8428 | 0.0781 | |
| SIFT | 0.8539 | 0.8544 | 0.0893 | 0.7487 | 0.7971 | 0.0590 |
Table 6.
Performance of change detection results in the pixel domain.
| Study Area | Method | Precision | Accuracy | False Alarms | Recall | F1 |
|---|---|---|---|---|---|---|
| Incheon | Pixel | 0.9488 | 0.7972 | 0.0746 | 0.7295 | 0.8248 |
| AKAZE | 0.9659 | 0.7994 | 0.0480 | 0.7189 | 0.8243 | |
| SIFT | 0.9584 | 0.7970 | 0.0592 | 0.7211 | 0.8230 | |
| Chilgok | Pixel | 0.7059 | 0.8283 | 0.1210 | 0.7053 | 0.7056 |
| AKAZE | 0.8358 | 0.8693 | 0.0556 | 0.6870 | 0.7541 | |
| SIFT | 0.7756 | 0.8520 | 0.0826 | 0.6933 | 0.7321 | |
| Seoul | Pixel | 0.5677 | 0.7955 | 0.1948 | 0.7664 | 0.6522 |
| AKAZE | 0.6430 | 0.8300 | 0.1337 | 0.7215 | 0.6800 | |
| SIFT | 0.6074 | 0.8131 | 0.1544 | 0.7156 | 0.6571 | |
| Mean | Pixel | 0.7408 | 0.8070 | 0.1301 | 0.7337 | 0.7275 |
| AKAZE | 0.8149 | 0.8329 | 0.0791 | 0.7091 | 0.7528 | |
| SIFT | 0.7805 | 0.8207 | 0.0987 | 0.7100 | 0.7374 |
Table 7.
Performance of change detection results in the object domain.
| Study Area | Domain | Changed Object | Unchanged Object | Precision | Accuracy | False Alarm | Recall | F1 | ||
|---|---|---|---|---|---|---|---|---|---|---|
| Correctly Detected | Miss Detected | Correctly Detected | False Detected | |||||||
| Incheon | Pixel | 291 | 109 | 313 | 37 | 0.8053 | 0.8872 | 0.1057 | 0.7275 | 0.7995 |
| AKAZE | 300 | 100 | 330 | 20 | 0.8400 | 0.9375 | 0.0571 | 0.7500 | 0.8333 | |
| SIFT | 278 | 122 | 335 | 15 | 0.8173 | 0.9488 | 0.0429 | 0.6950 | 0.8023 | |
| Chilgok | Pixel | 62 | 20 | 21 | 14 | 0.7094 | 0.8158 | 0.4000 | 0.7561 | 0.7848 |
| AKAZE | 67 | 15 | 28 | 7 | 0.8120 | 0.9054 | 0.2000 | 0.8171 | 0.8590 | |
| SIFT | 64 | 18 | 26 | 9 | 0.7692 | 0.8767 | 0.2571 | 0.7805 | 0.8258 | |
| Seoul | Pixel | 126 | 22 | 116 | 36 | 0.8067 | 0.7778 | 0.2368 | 0.8514 | 0.8129 |
| AKAZE | 108 | 40 | 138 | 14 | 0.8200 | 0.8852 | 0.0921 | 0.7297 | 0.8000 | |
| SIFT | 104 | 44 | 138 | 14 | 0.8067 | 0.8814 | 0.0921 | 0.7027 | 0.7820 | |
| Mean | Pixel | - | - | - | - | 0.7738 | 0.8269 | 0.2475 | 0.7783 | 0.7991 |
| AKAZE | - | - | - | - | 0.8240 | 0.9094 | 0.1164 | 0.7656 | 0.8308 | |
| SIFT | - | - | - | - | 0.7977 | 0.9023 | 0.1307 | 0.7261 | 0.8034 | |
Publisher’s Note: MDPI stays neutral with regard to jurisdictional claims in published maps and institutional affiliations. |
© 2022 by the authors. Licensee MDPI, Basel, Switzerland. This article is an open access article distributed under the terms and conditions of the Creative Commons Attribution (CC BY) license (https://creativecommons.org/licenses/by/4.0/).
Share and Cite
MDPI and ACS Style
Seo, J.; Park, W.; Kim, T. Feature-Based Approach to Change Detection of Small Objects from High-Resolution Satellite Images. Remote Sens. 2022, 14, 462. https://0-doi-org.brum.beds.ac.uk/10.3390/rs14030462
AMA Style
Seo J, Park W, Kim T. Feature-Based Approach to Change Detection of Small Objects from High-Resolution Satellite Images. Remote Sensing. 2022; 14(3):462. https://0-doi-org.brum.beds.ac.uk/10.3390/rs14030462
Chicago/Turabian StyleSeo, Junghoon, Wonkyu Park, and Taejung Kim. 2022. "Feature-Based Approach to Change Detection of Small Objects from High-Resolution Satellite Images" Remote Sensing 14, no. 3: 462. https://0-doi-org.brum.beds.ac.uk/10.3390/rs14030462
Note that from the first issue of 2016, this journal uses article numbers instead of page numbers. See further details here.