Article

Efficient Identification and Monitoring of Landslides by Time-Series InSAR Combining Single- and Multi-Look Phases

1
Shaanxi Key Laboratory of Earth Surface and Environmental Carrying Capacity, College of Urban and Environmental Sciences, Northwest University, Xi’an 710127, China
2
Insitute of Earth Surface System and Hazards, College of Urban and Environmental Sciences, Northwest University, Xi’an 710127, China
3
College of Geomatics, Xi’an University of Science and Technology, Xi’an 710127, China
*
Author to whom correspondence should be addressed.
Submission received: 26 January 2022 / Revised: 17 February 2022 / Accepted: 18 February 2022 / Published: 20 February 2022

Abstract

:
Identification and monitoring of unstable slopes across wide regions using Synthetic Aperture Radar Interferometry (InSAR) can further help to prevent and mitigate geological hazards. However, the low spatial density of measurement points (MPs) extracted using the traditional time-series InSAR method in topographically complex mountains and vegetation-covered slopes makes the final result unreliable. In this study, a method of time-series InSAR analysis using single- and multi-look phases were adopted to solve this problem, which exploited single- and multi-look phases to increase the number of MPs in the natural environment. Archived ascending and descending Sentinel-1 datasets covering Zhouqu County were processed. The results revealed that nine landslides could be quickly identified from the average phase rate maps using the Stacking method. Then, the time-series InSAR analysis with single- and multi-look phases could be used to effectively monitor the deformation of these landslides and to quantitatively analyze the magnitude and dynamic evolution of the deformation in various parts of the landslides. The reliability of the InSAR results was further verified by field investigations and Unmanned Aerial Vehicle (UAV) surveys. In addition, the precursory movements and causative factors of the recent Yahuokou landslide were analyzed in detail, and the application of the time-series InSAR method in landslide investigations was discussed and summarized. Therefore, this study has practical significance for early warning of landslides and risk mitigation.

1. Introduction

Landslides seriously threaten the safety of properties and lives [1,2,3,4], causing tens of billions of dollars in losses and more than 4300 fatalities around the world annually [5,6,7]. Through the analysis of the characteristics of several landslides that caused heavy casualties and economic losses, it has been found that these landslides have the common characteristics of high position and concealment, which makes it difficult for geological field investigations to find these potential threats [8,9,10]. Therefore, the identification and monitoring of deformation areas in topographically complex mountains and vegetation-covered slopes are significant for the prevention and mitigation of geological hazards.
Landslide surface displacement analysis is the basis of landslide stability research and is of great significance to landslide identification and monitoring [11,12,13,14]. Traditional landslide deformation analysis methods are mainly performed using field surveys, inclinometers, Global Positioning System (GPS), extensometers, total stations, and so on [15,16,17]. However, these methods cannot “blindly” monitor for landslides; that is, there needs to be knowledge of a landslide or, at minimum, a previously identified instability-prone area to establish monitoring, so they cannot identify and monitor landslides on a large scale. Optical remote sensing methods can be used to identify landslides that have occurred and areas with obvious deformation through differences in image spectra and textures, combined with topographic and geomorphological features, but it is difficult to identify slowly deforming landslides [10,16,18]. Differential Synthetic Aperture Radar Interferometry (D-InSAR) has the unique ability to measure surface micro-deformation on a large scale [19,20,21]. In recent years, time-series InSAR based on D-InSAR has been extensively applied to identify and monitor landslides over wide areas, and substantial progress has been made [22,23,24,25,26]. However, InSAR technology still has some problems regarding landslide investigations. A key problem is the low density of measurement points (MPs) in topographically complex mountains and vegetation-covered slopes [27], because mountains with complex topography are prone to geometric distortion (shadow, layover, and foreshortening) and the existence of vegetation will reduce the coherence. Sparse MPs will introduce phase unwrapping errors and are not sufficient for detecting small landslides. To effectively improve the spatial density of MPs, Ferretti et al. [28] proposed the SqueeSARTM method, which used the embedded DespecKS procedure to identify Statistically Homogeneous Pixels (SHP), and then carried out the subsequent solution by combining Persistent Scatterers (PS). Lv et al. [29] proposed the Joint-Scatterer InSAR (JSInSAR) method, which used coherence information of neighboring pixel stacks to improve the spatial density of MPs in the low-coherence region. Fornaro et al. [30] proposed the Component extrAction and sElection SAR (CAESAR) method, which extracted different scattering components through the analysis of the covariance matrix to increase the MPs. Dong et al. [31] proposed the Coherent Scatterer InSAR (CSI) method, which used the generalized likelihood ratio (GLR) test to identify the SHP and used the phase link algorithm to estimate the optimal phase for each SHP, and then conducted time-series analysis by combining the PS. These methods greatly improve the spatial density of the MPs and make the phase unwrapping more reliable, but they are too time-consuming [8,31]. Thus, it is necessary to balance the relationship between the spatial density of the MPs and a high computational efficiency, which may improve the efficiency of landslide identification and monitoring.
Therefore, in this study, we combined Stacking and time-series InSAR analysis with single- and multi-look phases to study and analyze the unstable slopes within Zhouqu County, the midstream of the Bailong River. First, Stacking was applied to quickly identify the deformation region, and then time-series InSAR analysis with single- and multi-look phases was used to monitor the landslides area. In addition, in order to study the characteristics of landslides in this area in the imminent sliding stage, the precursory movements and causative factors of the recent Yahuokou landslide were analyzed. Finally, the potential improvements and limitations of the time-series InSAR methods for landslide identification and monitoring were considered.

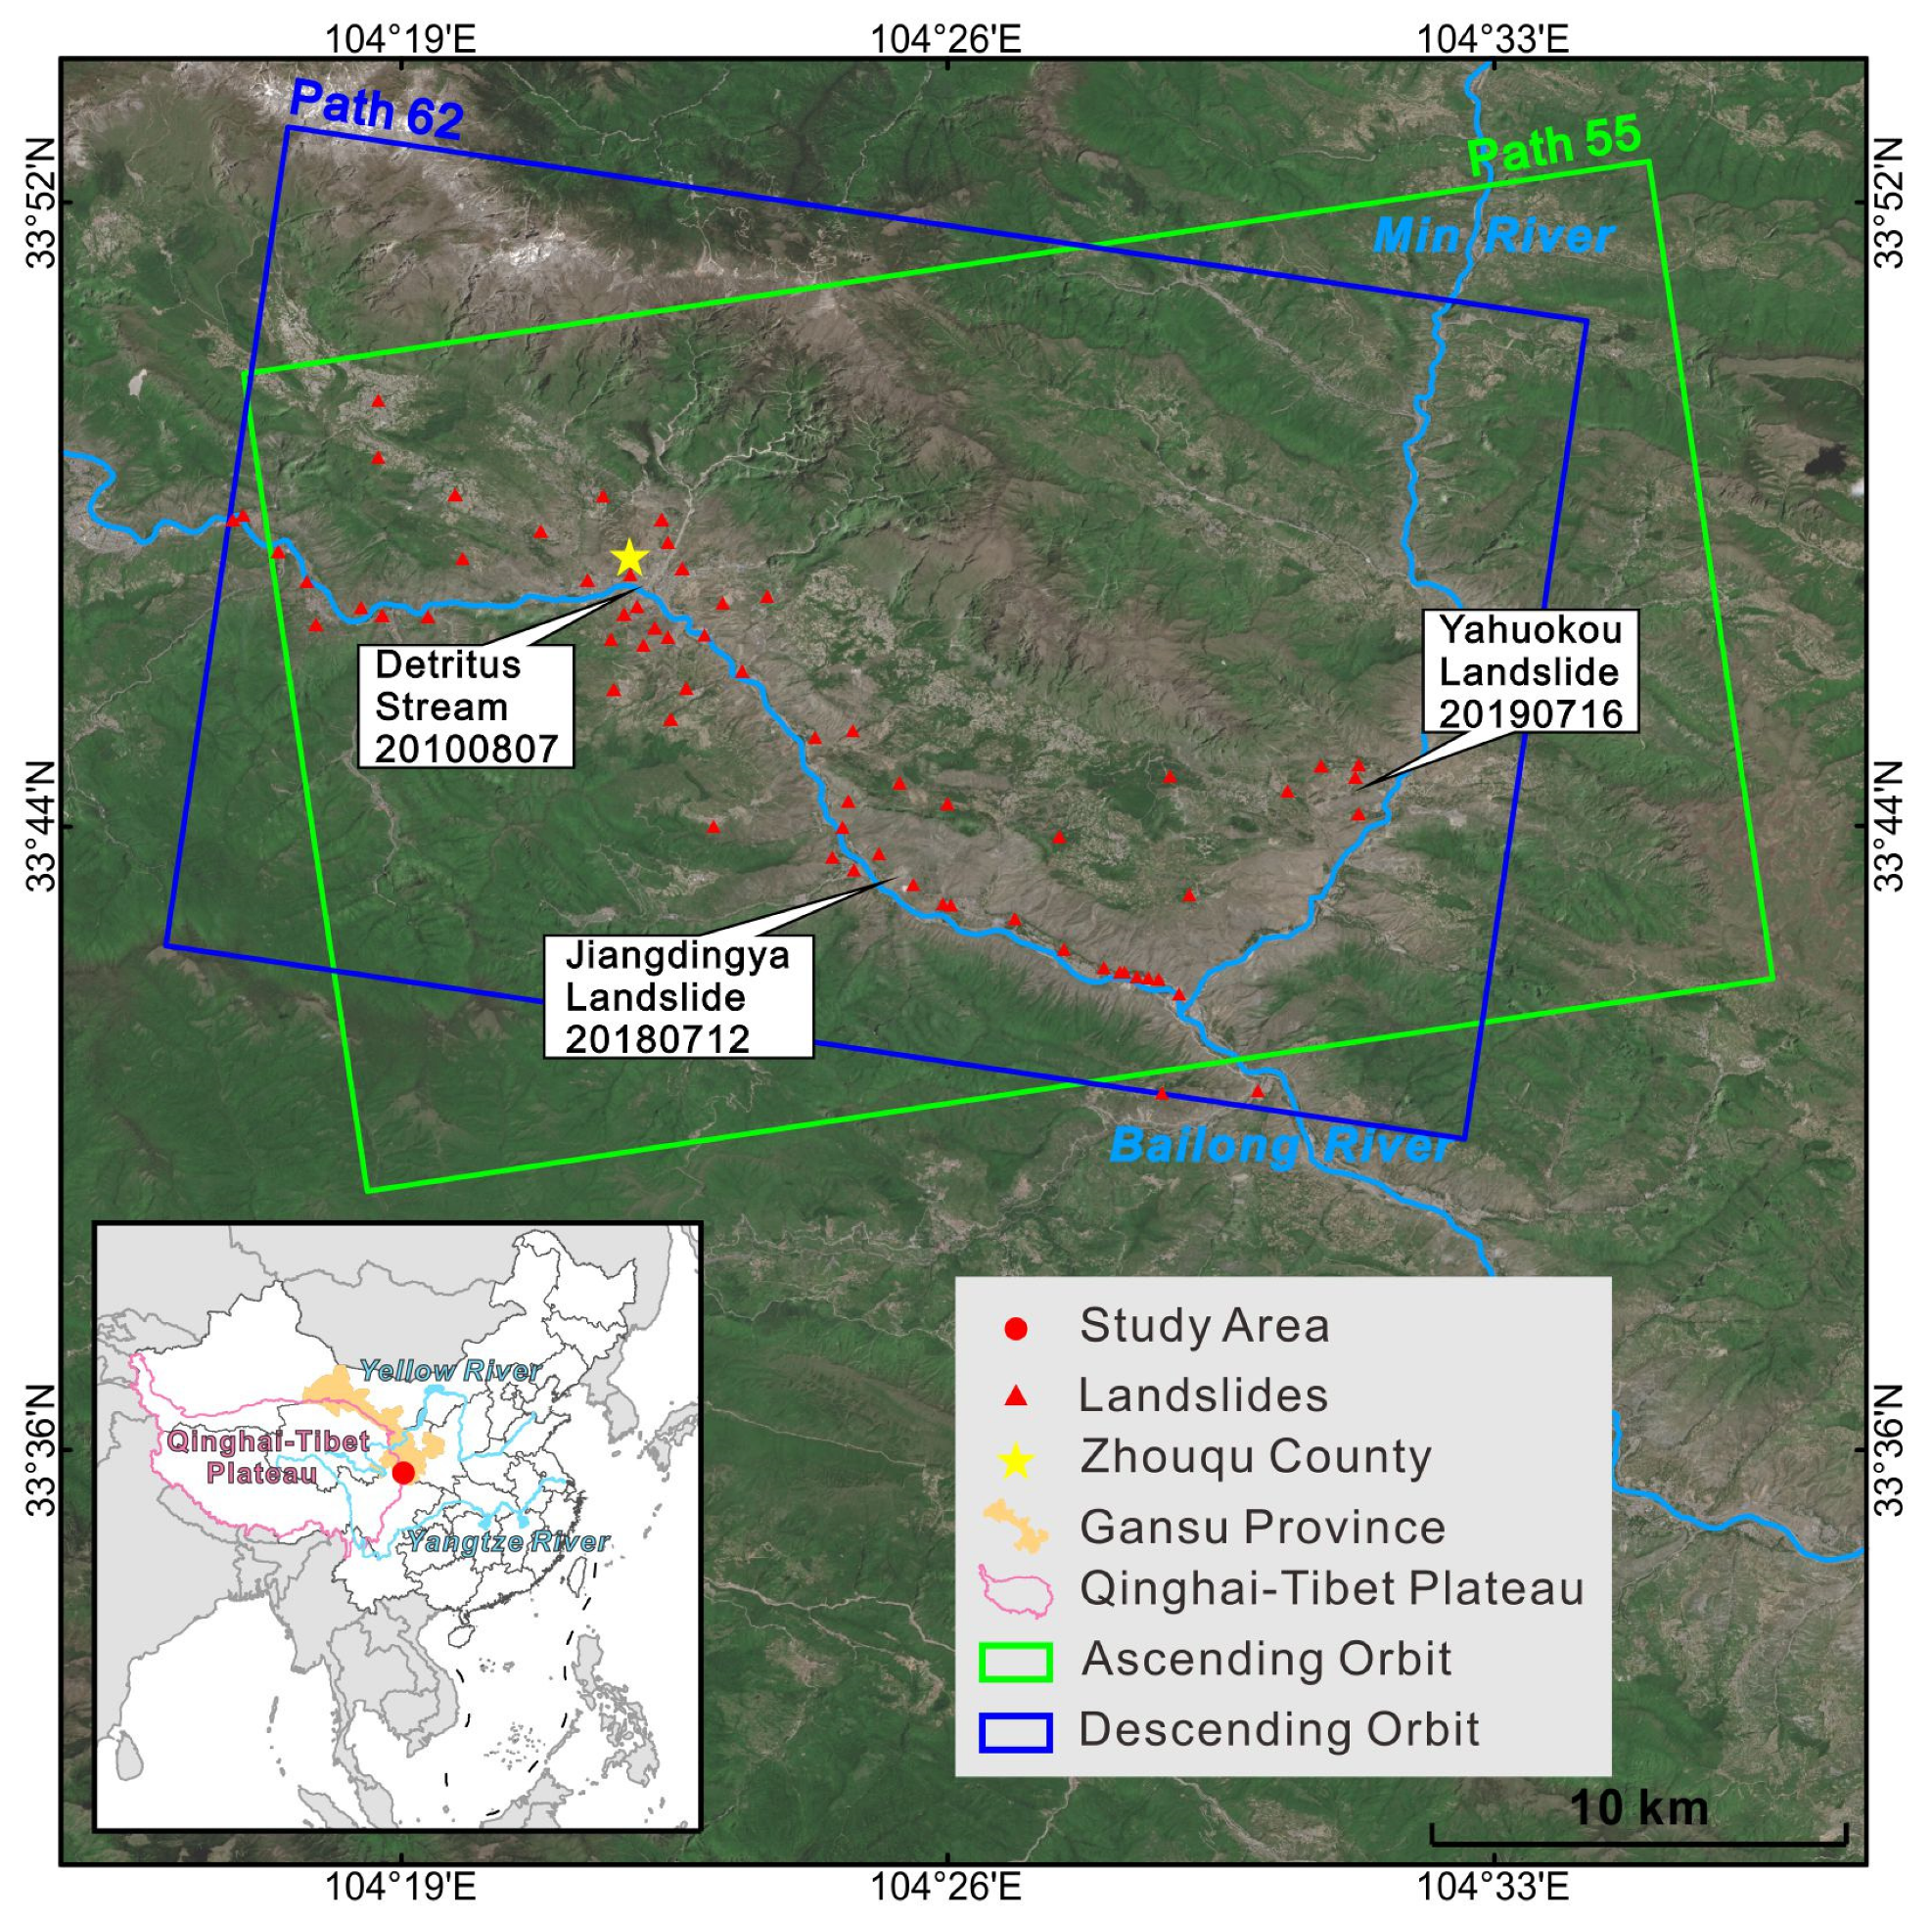
2. Study Area and SAR Data

2.1. Study Area

Zhouqu County is situated in the midstream of the Bailong River (Figure 1). The Bailong River is 576 km long, located in the transition zone between the Qinghai–Tibet Plateau and the Sichuan Basin [32]. Zhouqu County is a typical tectonic erosional mountain with altitudes varying from 1173 m to 4504 m [33]. Influenced by the monsoon climate, the rainfall in Zhouqu Country is low and unevenly distributed, and its wet season is from May to October, accounting for approximately 90% of the annual precipitation [34]. The mean annual temperature of the area is 12.7 °C. Fracture surfaces (e.g., Pingding-huama fault and Zhouqu fault) and quaternary deposits are widely distributed in the study area due to the neotectonic movements [26,33]; meanwhile, the frequency of earthquakes is relatively high, with 16 earthquakes with a magnitude above Ms 7.0 [35]. Moreover, bedrock fissure water, karst-fractured groundwater, and Quaternary pore water are widely distributed underground [36], which will further increase the possibility of unstable slopes to form geological disasters. These objective factors result in the frequent occurrences of landslides, collapses, debris flows, and other geological disasters in the Bailong River valley. Furthermore, with the growing population and rapidly developed economy of the study area, unreasonable engineering construction has consequently destabilized the local slopes, causing the geological environment in Zhouqu to deteriorate. In recent years, various geological disasters have become frequent in Zhouqu County and its surrounding areas. A giant debris flow that occurred on 7 August 2010, caused nearly 1800 deaths [37,38]. The Jiangdingya flowslide occurred on July 12, 2018, and blocked the Bailong River, with a 1.4 × 10⁵ m2 area and a total volume of 5 × 10⁶ m3 [39,40]. Additionally, the Yahuokou earthflow, which occurred on July 16, 2019, destroyed the road and buildings at the toe of the landslide [41], with a 2 × 10⁵ m2 area and a total volume of 3.9 × 10⁶ m3 [42,43]. These events all experienced intense rainfall before their occurrence. The rainfall increased the self-weight of soil and reduced the shear strength of soil, which triggered the occurrence of the disasters [35,38,42].

2.2. SAR Data

In this study, two stacks of Sentinel-1 datasets covering the study area were used, namely the ascending orbit datasets with a path number of 55 and the descending orbit datasets with a path number of 62, in which an incidence angle of 37.0° was applied to the ascending Sentinel-1 observations, and an angle of 38.4° was used for the descending Sentinel-1 observations. The two datasets cover an area of about 550 km2, and the other basic parameters are shown in Table 1. The error of satellite orbit was corrected by the Precise Orbit Ephemerides (POD); meanwhile, the topographic phase was simulated by the Shuttle Radar Topography Mission (SRTM) Digital Elevation Model (DEM) with a 30 m resolution and removed from the interferogram.
The large number of Sentinel-1 images acquired over a long time period had a positive effect on the quality of the time-series analysis results [8]. Meanwhile, the spatial baselines of the two Sentinel-1 datasets were small, benefiting from the strict orbit controls, which helped to reduce geometric errors. Therefore, the two Sentinel-1 datasets were used to identify the deformation region and to calculate the deformation rate.

3. Methodology

The main flowchart is shown in Figure 2. First, the SAR data needed to be preprocessed; then the deformation regions were identified by Stacking method, which can quickly identify the deformation regions in a large range. Based on the identified deformation regions, the topographic boundary was delimited, and the standard of delineation was along the ridge line where the deformation area is located, because landslides mostly occur in the area below the ridge line. Next, the deformation rates of the landslides were inverted by time-series InSAR analysis with single- and multi-look phases. This method greatly increases the number of MPs and avoids the situation of sparse MPs in mountainous areas. Finally, the results of the InSAR analysis were verified through a field investigation. Following this methodology, we identified and monitored landslides in Zhouqu County.

3.1. Stacking

Assuming that N + 1 SAR images are acquired according to time-series, M differential interferograms can be obtained by setting an appropriate time–space baseline, and then M unwrapping phase maps can be obtained by phase unwrapping. Stacking was used to estimate the average phase rate by taking M unwrapped phase maps and then stacking the weighted unwrapping phases together (Figure 2) [44]. This technique can weaken the influence of orbital, atmospheric, and topographic errors in the unwrapped phase map. Benefiting from the open source of Sentinel-1 data, the role of this technology in the general surveys of land surface deformation is attracting more attention [44,45,46,47]. Since the atmospheric phase component has the characteristics of low frequency in the spatial domain and high frequency in the time domain, Stacking minimizes the atmospheric errors and improves the calculation accuracy of the deformation rate [48]. The method assumes that the regional deformation rate is the ratio of the total deformation to time, without considering the distribution of the other noise in each independent unwrapping phase; that is, the linear deformation rate and the atmospheric delay error are random and equal. Normally, to ensure the accuracy of the results, the data with a short temporal baseline and a spatial baseline are selected for combination. The constant rate of each pixel was estimated using M individual unwrapping phases in the following Equation (1):
V a v e = j = 1 M Δ t j φ j j = 1 M Δ t j 2
where V a v e is the average phase rate, φ j is the unwrapped phase, and Δ t j is the temporal baseline of the j th interferogram. In Equation (1), the unwrapping phases are weighted according to the time interval [44].
In this study, 147 ascending and 157 descending orbit datasets were processed by Stacking, respectively, and the time span was from October 2014 to December 2020. First of all, based on the condition that only two interferometric pairs were generated for each date, 291 and 311 interferometric pairs were created from the ascending and descending orbit datasets, respectively. Next, the factors of 4 (range) and 1 (azimuth) (approximately 15 m resolution) were used for the interferogram and differential interferogram. Then, the pixels with coherence greater than 0.35 were selected to use the Minimum Cost Flow (MCF) method for phase unwrapping. Finally, all of the phase unwrapping results were stacked to obtain the result of Stacking.

3.2. Time-Series InSAR Analysis with Single- and Multi-Look Phases

The single-look phases (Figure 3), which corresponded primarily to point scatterers, were initially selected using the spectral diversity criteria and the low temporal amplitude variation criterion of the GAMMA IPTA software [49,50,51,52]. The multi-look phases (Figure 3) used primarily corresponded to distributed scatterers, because the distributed scatterers were statistically consistent in the spatial distribution, which were determined using the factors of 12 (range) and 3 (azimuth) (approximately 40 m resolution). Multi-look phases can not only reduce the phase noise in areas with lower coherence, but also improve the spatial coverage in areas with gravel or sparse vegetation. Expect for the geometrical distortion regions (foreshortening, layover, and shadow), water surfaces and forests, multi-look phases covered the whole study area [52]. In this study, the SLC area of ascending and descending orbit datasets was 6800 columns × 1400 rows, which produced 566 × 466 multi-look phases. In the end, 12,733 single-look phases and 197,914 multi-look phases were selected in the ascending orbit dataset, while 17,453 single-look phases and 197,842 multi-look phases were selected in the descending orbit dataset.
After the initial selection, the single- and multi-look phases were triangulated, and their interferometric phases were unwrapped with the MCF method [51,52]. Then, the phase components were separated one by one according to their different characteristics. The orbital phase ramps were obtained by a biquadratic model and the linear relationship between the perpendicular baselines and the terrain was used to estimate the DEM errors [25]. Due to the complexity of the atmospheric composition in mountainous areas, it can be divided into stratified troposphere and turbulence effect signals, in which the stratified troposphere can be obtained by using the linear relationship with elevation, and the turbulence effect signal can be obtained by combined spatiotemporal filters [53]. After the above four components were removed from the unwrapped phases, Singular Value Decomposition (SVD) was applied to the residual phase to obtain the time-series displacements and the mean rate map.

3.3. Unmanned Aerial Vehicle and Field Surveys

The role of UAV photogrammetry in landslide investigation has been widely recognized, and the high-precision digital elevation model (DEM) data and digital surface model (DSM) data obtained based on UAV photogrammetry technology can intuitively display the basic characteristics of landslides [54,55,56]. In the July 2021 survey, we mainly used the DJI Phantom4 Real-Time Kinematic (RTK) drone to obtain orthophotos of the landslide; meanwhile, we used the RTK global navigation satellite system to obtain the real-time coordinates of the control points as the mapping control. In addition, we also verified whether the InSAR results were consistent with the actual surface deformation through careful field investigations.

4. Results and Analysis

4.1. Landslide Detection

4.1.1. Identification of Deformation Region

Stacking was used to quickly identify the deformation regions in Zhouqu County and its surrounding area. The Stacking results are shown in Figure 4. The noise signal in Figure 4 mainly came from orbital, atmospheric, and topographic error, which was mainly because the Stacking method weakened the influence of these errors, rather than removed them. The method used to identify the deformation region was visual interpretation, which was to confirm the deformation region through human–computer interaction. Compared with the stable region, the deformation region exhibited an obvious color change. At the same time, to improve the accuracy of the deformation region recognition, multi-temporal optical remote sensing images were used for multiple checks. The Stacking results from the ascending and descending orbits indicated that at least nine landslides remained active between October 2014 and December 2020. Additionally, the Suoertou, Xieliupo, Zhongpai, Qinyu, and Jiangdingya landslides were identified in both the ascending and descending results, while the Nanshan and Yahuokou landslides were only identified in the ascending results and the Luojiayu and Mentouping landslides were only observed in the descending results. Moreover, some small movement areas with relatively weak signals were also identified, as shown by the red circles in Figure 4. These areas were studied further using time-series InSAR.

4.1.2. Inversion of Deformation Rate

Figure 5a shows the Line of Sight (LOS) deformation rate measure by the ascending Sentinel-1 datasets in the midstream of the Bailong River Basin in Zhouqu County. The time-series InSAR analysis with single- and multi-look phases identified 120,783 MPs (including single- and multi-look phases), producing an overall spatial density of over 240 MPs/km2. Since 12 range looks and 3 azimuth looks were used during the processing of the multi-look phases, the ground resolution of each multi-look element was approximately 40 m, while the single-look element retained the resolution of the original pixels. According to previous research results and the actual results obtained [26,32,33,34], we set the region where the deformation rates were between −10 mm/yr and 10 mm/yr as the stable region, and set it as the unstable region when the threshold was exceeded. The InSAR results showed that about 86% of the MPs were in a stable state, indicating that the entire area remained stable.
Combined with the results of Stacking, a total of seven landslides with a deformation rate exceeding 10 mm/yr had been monitored from the ascending Sentinel-1 rate map, namely the Suoertou, Xieliupo, Zhongpai, Qinyu, Jiangdingya, Yahuokou, and Nanshan landslides. In the result of the ascending orbit, the area of all unstable regions was about 70 km2.
Correspondingly, 129,533 MPs were detected from the descending Sentinel-1 dataset in the same region, producing an overall density of 260 MPs/km2. The InSAR results showed that about 88% of the MPs were in a stable state, indicating that the study area remained stable. The Suoertou, Xieliupo, Zhongpai, Qinyu, Jiangdingya, Yahuokou, Luojiayu, and Mentouping landslides were identified in the descending Sentinel-1 rate map (Figure 5b). In the result of the descending orbit, the area of all unstable regions was about 60 km2.
It could be seen from the deformation rates of the ascending orbit and descending orbit that they were consistent. However, to further prove the reliability of the InSAR results, field investigations were needed to verify the InSAR results.

4.2. Verification of InSAR Results through Field Investigations

We conducted a field investigation in July 2021 to verify the reliability of the InSAR results for landslide detection. After comprehensive consideration of the landslide area, threat degree, and deformation intensity, four typical landslides were selected as the targets of the field investigation. The LOS deformation rates, field investigation data, UAV aerial images, and optical images (obtained from Google EarthTM) were used to analyze and research the landslides.

4.2.1. Suoertou Landslide

Figure 6a,b shows the LOS deformation rates of the Suoertou landslide overlaid on Google EarthTM. The points in blue indicate movement toward the satellite, while the red points indicate movement away from the satellite, and the green points indicate good stability. The length of the landslide was about 3300 m, and the widest part was about 700 m. The landslide faced almost east, with a gradient angle of less than 20°, and the thickness of the landslide body ranged from 20 to 100 m, which was a flowslide [43]. The Bailong River flowed along the front of the slope, causing intense river erosion at the toe of the slope [32]. As shown in Figure 6a,b, the top and bottom of Suoertou landslide were unstable, and the middle part was not covered by MPs due to the intensive activity [57] and relatively dense vegetation coverage. The maximum average displacement rate of the MPs at the top and bottom of the Suoertou landslide exceeded 100 mm/yr. Figure 6i shows the displacement time series of points P3 and P4 (marked by white circles in Figure 6b), and the average displacement rates of these two points were determined to be 161.4 mm/yr and 115.3 mm/yr, respectively.
Moreover, deformation with a mean LOS rate greater than 100 mm/yr was detected in the Daxiaowan landslide (Figure 6a,b) to the south of the Suoertou landslide. Figure 6i gives the LOS displacements time-series of two selected points, P1 and P2 (marked by white circles in Figure 6a), with average displacement rates of −117.5 mm/yr and −154.9 mm/yr, respectively. During the field survey, an obvious white fresh scarp was observed at the top of the landslide, and signs of a damaged road were observed at the bottom of the landslide. The corresponding deformation characteristics indicated that the Suoertou and Daxiaowan landslides remained active from October 2014 to December 2020.
Through field investigation, it was found that the upper part of the landslide had an obvious scarp and a large amount of debris (Figure 6c,d,h). Based on this, it was identified as the source area. The flowing area was mainly determined by the time-series InSAR results and whether there were scour marks on both sides of the slideway in the middle of the landslide (Figure 6e,h). If there was an alluvial fan in the lower part of the landslide, it could be determined as an accumulation area (Figure 6f,g).

4.2.2. Xieliupo Landslide

The Xieliupo landslide was a typical large flowslide that developed in the Zhouqu fracture zone [26,43,58]. The slope was 800 m wide and 2700 m long. The elevation ranged from 1300 m to 2200 m [41]. The Bailong River and Provincial Road S313 passed through the slope’s toe.
Based on the LOS deformation rates derived by Sentinel-1 overlaid on Google EarthTM (Figure 7a,b), the deformation areas in the middle and bottom part of the slope were detected, and the deformation in the middle was significantly more severe. In the middle, the maximum displacement rates detected by the ascending and descending orbits were 304.9 mm/yr and −314.8 mm/yr, respectively; and at the bottom, the maximum displacement rates detected by the ascending and descending orbits were 221.7 mm/yr and −150.8 mm/yr, respectively. A white fresh scarp, which was the scarp of landslide that occurred not long ago, was observed at the top of the landslide (Figure 7c). Figure 7d shows a building at the toe of the slope (marked by white triangles in Figure 7a), which exhibited cracks on the surface and about 20 mm of ground subsidence. The toe of the Xieliupo landslide was seriously eroded by the Bailong River (Figure 7e). Provincial Road S211 at the toe of the slope was damaged (Figure 7f). Figure 7g shows the area with severe deformation at the foot of the slope, which clearly shows that the vegetation cover was sparse and the surface erosion was severe, which verified the reliability of the InSAR results. The displacement time series of points P5, P6, P7, and P8 are shown in Figure 7h.
As the bottom of the landslide kept moving toward the Bailong River, it easily formed a landslide dam and dammed the lake, thus threatening local residents and the town downstream.

4.2.3. Zhongpai Landslide

The Zhongpai landslide was shaped like an irregular funnel and was about 4600 m long [41], belonging to the flowslide category [43]. The InSAR results indicated that the toe moved faster than the head between October 2014 and December 2020 (Figure 8a,b). The maximum LOS displacement rate detected by the ascending and descending orbit datasets were −214.7 mm/yr and 126.6 mm/yr, respectively. The time-series displacements of points P9 and P10 are shown in Figure 8f. The cross-section of the landslide was V-shaped, the height changed greatly, and there were numerous small rockfalls at the toe of the slope, which are shown in the photos in Figure 8c. Several faults passed through the landslide (Figure 8d), and the Yahuokou landslide formed on the middle fault on 16 July 2019 (Figure 8e). The precursory movements and causative factors of the Yahuokou landslide will be discussed further in Section 5.1.
The middle part of the Zhongpai landslide was mainly cultivated land and residential buildings. The InSAR results showed that this area was relatively stable, but the severe deformation in the bottom part posed a potential threat. In addition, both the Min River (a tributary of the Bailong River) and National Road G212 passed through the toe of the slope, so the rapid deformation of the toe of the slope may lead to river blockage and road damage. Therefore, it is necessary to use InSAR to monitor the region for a long time.

4.2.4. Qinyu Landslide

The Qinyu landslide was situated on the right bank of the Min River. It had an irregular dumbbell shape and belonged to the flowslide category [43]. Its front edge was about 1700 m wide, its middle was about 300 m wide, and the back edge was about 1500 m wide (Figure 9d) [59]. Choujiashan Village was located at the back of the landslide (Figure 9c) and several engineering plants were located at its front edge (Figure 9d). Figure 9c illustrates that an earthflow threatened Choujiashan Village. Figure 9d shows that obvious erosion occurred at the toe of the Qinyu landslide, exposing the underground white soil and forming continuous small landslides. The Min River flowed from south to southeast at the toe of the slope.
The lower parts of the Qinyu landslide were unstable (Figure 9a,b). The LOS deformation rate detected by the ascending and descending orbit datasets were −103.6 mm/yr to 26.0 mm/yr and −78.3 mm/yr to 39.2 mm/yr, respectively. Many large cracks were found at the bottom of the landslide (Figure 9e). In addition, Road G212 was damaged (Figure 9f), and a warning sign was erected on the side of the road (Figure 9g). Additionally, the lower parts of the Qinyu landslide were reinforced by walls. During our field investigation on 12 July 2021, the retaining walls were undergoing maintenance (Figure 9h). The time-series displacement of points P11 and P12 are shown in Figure 9i, and the cumulative displacements at points P11 and P12 were greater than 500 mm and 350 mm, respectively, during the six-year period.

5. Discussion

5.1. Measuring Precursory Movements of the Recent Yahuokou Landslide

The Yahuokou landslide occurred on July 16, 2019, but, in the field investigation on 13 July 2021, it was found that slow deformation was still continuing. The road (Figure 10d) and buildings (Figure 10f) within the boundary of the landslide were basically destroyed, and part of the landslide collapsed into the Min River, reducing its channel width from 26 m to 6 m [41] (Figure 10i,j). To enable the villagers to travel, a construction organization is repairing the portion of the road affected by the landslide (Figure 10e). Owing to the slow movement of the landslide, there were no casualties. This landslide was an earthflow. There was a rockfall on the north side of the back edge of the landslide (Figure 10c), while numerous new and old rockfalls (Figure 10b) were distributed on the south side. The landslide potentially threatened the lives and property of people in Maojia Village in Dongshan Town. An introduction to and schematic map of the Yahuokou landslide were erected at the toe of the landslide (Figure 10g,h).

5.1.1. Precursory Movements Measured by Time-Series InSAR Analysis

To analyze the precursory movement before the Yahuokou landslide, 103 images of ascending datasets from 21 October 2014, to 15 July 2019, and 107 images of descending datasets from 9 October 2014, to 15 July 2019, were collected. Time-series InSAR analysis with single- and multi-look phases was carried out to obtain the expected results.
Figure 11d,e shows the annual mean LOS displacement rate maps obtained from the two Sentinel-1 data stacks. Owing to the difference in the observation geometry, the range and degree of the deformation results obtained from the ascending and descending track datasets were not consistent. The maximum displacement rate detected by the ascending and descending orbits were −135.3 mm/yr and 77.3 mm/yr, respectively. As can be seen from the annual mean LOS displacement rate graphs (Figure 11d,e), the deformation at the top was significantly more severe. Therefore, it could be inferred that the landslide was a typical thrust-type landslide. That is, the upper part of the rock layer slid and squeezed the lower part to produce deformation. When the sliding speed was faster, the surface of the sliding body exhibited undulation, which was mostly observed on the slopes with deposits. To further show the temporal pattern of pre-failure deformation, we used the method proposed by Bianchini et al. [60] to estimate the mean of the time-series displacements for each SAR acquisition at the points of active motion outlined by the white curved line on the map in Figure 11d,e, and we plotted them in Figure 12a. The cumulative LOS movements of the points of active motion outlined from 9 October 2014, to 15 July 2019, by the ascending and descending orbit datasets were about −387.7 mm and 241.4 mm, respectively. Overall, the InSAR technique can be used to effectively identify dangerous landslide areas before a disaster occurs, and it can also be used to infer the type of landslide, such as a retrogressive or thrust-type landslides.

5.1.2. Causative Factors of the Yahuokou Landslide

Multiple studies have confirmed that rainfall, irrigation, river erosion, and human activities easily cause loess-bedrock landslides [61,62]. Due to the characteristics of porosity and water permeability of loess, loess bedrock landslides are susceptible to rainfall. As can be seen from Figure 12b, the daily precipitation in Zhouqu County from 9 October 2014, to 15 July 2019, was obviously concentrated in May to October. By observing the daily precipitation during the month before the landslide, it was determined that the precipitation was up to 26 mm (Figure 12c) on 11 July 2019. The concentrated rainfall caused the groundwater level to rise rapidly and the soil moisture in the loess layer to increase, which reduced the shear strength of the slope soil, increased the instability of the slope, and eventually led to the reactivation of the landslide.
In addition, the displacement time series can be divided into linear deformation (Figure 12a) and non-linear deformation (Figure 12b). By observing the relationship between the non-linear deformation and the daily precipitation (Figure 12b) [63], it was found that, in the wet season, the fluctuation in the non-linear deformation from the ascending data was obvious, while it was not obvious from the descending data. This may be explained by the fact that ascending data are more suitable for the analysis of east-facing slopes, while descending data are more suitable for the analysis of west-facing slopes [8]. That is, this showed that there was an obvious relationship between the precipitation and the deformation of the landslide from another point of view.
According to our field survey, the factors influencing the Yahuokou landslide’s stability were fluvial erosion by the Min River (Figure 10j) and fault activity (Figure 8d) [41]. Moreover, the landslide area was also disturbed by the previous road constriction and agricultural cultivation activities. The road construction reduced the stability of the landslide and caused the landslide to move under the effect of gravity. The agricultural cultivation activities needed irrigation to support them, but intensive irrigation can easily cause changes in the groundwater level, resulting in the local deformation of landslides [31]. This may be one of the important reasons for the serious deformation in the upper part of the Yahuokou landslide. Therefore, it is speculated that fluvial erosion, fault activity, road construction, and agricultural cultivation activities created the conditions for the landslide, while rainfall was the main triggering factor.

5.2. Significance for Applications

Stacking and time-series InSAR analysis with single- and multi-look phases has a great potential in landslide identification and monitoring. The potential applications of these techniques are discussed from three perspectives.
First, as a robust, straightforward, and easy-to-implement method, Stacking provides a fast and effective way to identify deformation regions across wide areas. The landslides that cause disasters are often characterized by a high position [64] (the high position means that the source area of the landslide is located in the middle and upper parts of the mountain, which are difficult for personnel to reach) and concealment (the concealment comes from two aspects: on the one hand, the source area of the disaster is covered by vegetation or ice and snow, making it difficult to identify with the naked eye and using traditional means; on the other hand, the disasters are located in inaccessible areas) [10], so geological field investigations overlook these deformation areas. Nonetheless, it is very important to identify these unstable areas as soon as possible to prevent disasters in advance and to protect the security of lives and property. The experimental results presented in Section 4.2.1 demonstrated that Stacking can be used to quickly and effectively identify deformation in the visible regions of radar sensors, making it an important supplement to traditional field investigations. Moreover, progress has been made in GACOS-corrected InSAR Stacking based on Stacking, which will greatly improve the accuracy of the Stacking results; thus, it can be used in large-scale ground deformation general surveys [44].
Second, for areas with serious geological disasters, such as Zhouqu County, time-series InSAR analysis with single- and multi-look phases can be used as an effective tool for the long-term monitoring and stability evaluation of unstable areas. It provided the data needed to understand the possibility of these unstable areas transforming into disasters in advance, which will play a key role in disaster prevention and mitigation. Furthermore, because of the high spatial density of the single- and multi-look phases in the study area, the deformation rate maps of the time-series InSAR data can be used to determine the spatial range of the unstable areas, which provides basic data for the engineering treatment of these areas.
Finally, time-series InSAR analysis with single- and multi-look phases can provide early warning information to avoid tragedies before landslides occur. In Section 5.1, time-series InSAR analysis with single- and multi-look phases was used to process the Sentinel-1 data before the Yahuokou landslide occurred, and the deformation signal was successfully monitored due to the fact that Sentinel-1 has the advantage of short revisit cycles. This provides the possibility to establish a geological disaster early warning system based on InSAR monitoring results [40,65,66].

5.3. Limitations

Compared with conventional time-series InSAR analysis in Zhouqu County [26,32,33,34], the time-series InSAR analysis with single- and multi-look phases has more advantages in areas with complex topography, sparse vegetation cover, and a large deformation gradient. Compared with the second-generation time-series InSAR techniques, such as SqueeSARTM [28], JSInSAR [29], CAESAR [30], and CSI [31], time-series InSAR analysis with single- and multi-look phases avoids complex algorithms in point selection and has improved operational efficiency. However, the limitation of the conventional InSAR techniques’ parameters also affects the time-series InSAR analysis with single- and multi-look phases, such as the SAR observation mode, sensor parameters, and direction of landslide movement [8].
In addition, the time-series InSAR analysis with single- and multi-look phases has some inherent limitations. On one hand, combining single- and multi-look phases has a lower accuracy than the single-look phase only, because the coherence of the single-look phase is higher and it is not easily affected by orbital, atmospheric, and topographic errors. Additionally, the spatial resolution is sampled to approximately 40 m during the preprocessing of the multi-look phases, which is not conducive to the detection of small-scale landslides. Therefore, to some extent, time-series InSAR analysis with single- and multi-look phases is gained at the expense of loss of accuracy and spatial resolution.

6. Conclusions

In this study, Stacking and time-series InSAR analyses with single- and multi-look phases were used to identify and monitor landslides in the middle reaches of the Bailong River Basin in Zhouqu County using archived C-band Sentinel-1 ascending and descending datasets. Among them, time-series InSAR analysis combines single- and multi-look phases to increase the density of the MPs, which improves the deformation measurement results. The Stacking and time-series InSAR analyses were used to identify nine landslides and to monitor their deformation degrees. Through field investigations and UAV surveys, the reliability of the InSAR results was validated, which also illustrated the potential of using Sentinel-1 data for landslide investigations.
Time-series InSAR analysis with single- and multi-look phases was demonstrated to be accurate and efficient in measuring landslide deformation. It can not only quantitatively analyze the magnitude and dynamic evolution of the deformation in various parts of landslides, but also capture the deformation signals before the occurrence of landslides, such as the Yahuokou landslide. However, due to its inherent limitations, it has obvious inadequacies in measurement accuracy and its ability to monitor small-scale landslides. So, through further analysis of time-series displacement information and the combination of the ascending and descending orbit data, the method can be better applied to disaster prevention and the mitigation of geological disasters.

Author Contributions

Conceptualization, H.Q.; methodology, Z.L. and H.Q.; software, Z.L. and Y.Z.; validation, Y.L. and L.W.; formal analysis, Z.L., D.Y. and Y.Z.; investigation, Z.L., Y.L., Y.W. and J.Z.; resources, H.Q.; data curation, L.W. and B.T.; writing—original draft preparation, Z.L.; writing—review and editing, H.Q.; visualization, Z.L., S.M. and Y.Z.; supervision, H.Q.; project administration, H.Q.; funding acquisition, H.Q. All authors have read and agreed to the published version of the manuscript.

Funding

This research was funded by the Second Tibetan Plateau Scientific Expedition and Research Program (STEP) (Grant No. 2019QZKK0902), Natural Science Basic Research Program of Shaanxi (Grant No. 2021JC-40), and International Science & Technology Cooperation Program of China (Grant No. 2018YFE0100100).

Institutional Review Board Statement

Not applicable.

Informed Consent Statement

Not applicable.

Data Availability Statement

The Sentinel-1A data used in this study were provided by the European Space Agency (ESA), https://search.asf.alaska.edu/#/ (accessed on 22 December 2021); the POD Precise Orbit Ephemerides used in this study were provided by the ESA, https://s1qc.asf.alaska.edu/aux_poeorb/ (accessed on 22 December 2021); and the SRTM DEM was freely downloaded from the website https://earthexplorer.usgs.gov/ (accessed on 22 December 2021).

Acknowledgments

The authors thank the ESA for providing free Sentinel-1A datasets. The authors also thank the Google Earth Platform for providing the optical remote sensing images.

Conflicts of Interest

The authors declare no conflict of interest.

References

  1. Gariano, S.; Guzzetti, F. Landslides in a changing climate. Earth Sci. Rev. 2016, 162, 227–252. [Google Scholar] [CrossRef] [Green Version]
  2. Larsen, I.; Montgomery, D. Landslide erosion coupled to tectonics and river incision. Nat. Geosci. 2012, 5, 468–473. [Google Scholar] [CrossRef]
  3. Qiu, H.; Cui, P.; Regmi, A.; Hu, S.; Wang, X.; Zhang, Y.; He, Y. Influence of topography and volume on mobility of loess slides within different slip surfaces. Catena 2017, 157, 180–188. [Google Scholar] [CrossRef]
  4. Zhang, Y.; Meng, X.; Dijkstra, T.; Jordan, C.; Chen, G.; Zeng, R.; Novellino, A. Forecasting the magnitude of potential landslides based on InSAR techniques. Remote Sens. Environ. 2020, 241, 111738. [Google Scholar] [CrossRef]
  5. Froude, M.; Petley, D. Global fatal landslide occurrence from 2004 to 2016. Nat. Hazards Earth Syst. Sci. 2018, 18, 2161–2181. [Google Scholar] [CrossRef] [Green Version]
  6. Intrieri, E.; Carla, T.; Gigli, G. Forecasting the time of failure of landslides at slope-scale: A literature review. Earth Sci. Rev. 2019, 193, 333–349. [Google Scholar] [CrossRef]
  7. Kirschbaum, D.; Stanley, T.; Zhou, Y. Spatial and temporal analysis of a global landslide catalog. Geomorphology 2015, 249, 4–15. [Google Scholar] [CrossRef]
  8. Dong, J.; Liao, M.; Xu, Q.; Zhang, L.; Tang, M.; Gong, J. Detection and displacement characterization of landslides using multi- temporal satellite SAR interferometry: A case study of Danba County in the Dadu River Basin. Eng. Geol. 2018, 240, 95–109. [Google Scholar] [CrossRef]
  9. Huang, R.; Xu, Q. Catastrophic landslide disasters in China. Science Press 2008. [Google Scholar]
  10. Xu, Q. Understanding and Consideration of Related Issues in Early Identification of Potential Geohazards. Geomat. Inform. Sci. Wuhan. Univ. 2020, 45, 1651–1659. [Google Scholar]
  11. Dai, K.; Li, Z.; Tomas, R.; Liu, G.; Yu, B.; Wang, X.; Cheng, H.; Chen, J.; Stockamp, J. Monitoring activity at the Daguangbao mega-landslide (China) using Sentinel-1 TOPS time series interferometry. Remote Sens. Environ. 2016, 186, 501–513. [Google Scholar] [CrossRef] [Green Version]
  12. Shi, X.; Zhang, L.; Zhou, C.; Li, M.; Liao, M. Retrieval of time series three-dimensional landslide surface displacements from multi-angular SAR observations. Landslides 2018, 15, 1015–1027. [Google Scholar] [CrossRef]
  13. Zhou, C.; Cao, Y.; Yin, K.; Wang, Y.; Shi, X.; Catani, F.; Ahmed, B. Landslide Characterization Applying Sentinel-1 Images and InSAR Technique: The Muyubao Landslide in the Three Gorges Reservoir Area, China. Remote Sens. 2020, 12, 3385. [Google Scholar] [CrossRef]
  14. Zhu, Y.; Qiu, H.; Liu, Z.; Wang, J.; Yang, D.; Pei, Y.; Ma, S.; Du, C.; Sun, H.; Wang, L. Detecting Long-Term Deformation of a Loess Landslide from the Phase and Amplitude of Satellite SAR Images: A Retrospective Analysis for the Closure of a Tunnel Event. Remote Sens. 2021, 13, 4841. [Google Scholar] [CrossRef]
  15. Bekaert, D.; Handwerger, A.; Agram, P.; Kirschbaum, D. InSAR-based detection method for mapping and monitoring slow-moving landslides in remote regions with steep and mountainous terrain: An application to Nepal. Remote Sens. Environ. 2020, 249, 111983. [Google Scholar] [CrossRef]
  16. Ding, C.; Feng, G.; Liao, M.; Tao, P.; Zhang, L.; Xu, Q. Displacement history and potential triggering factors of Baige landslides, China revealed by optical imagery time series. Remote Sens. Environ. 2021, 254, 112253. [Google Scholar] [CrossRef]
  17. Liu, Z.; Qiu, H.; Ma, S.; Yang, D.; Pei, Y.; Du, C.; Sun, H.; Hu, S.; Zhu, Y. Surface displacement and topographic change analysis of the Changhe landslide on September 14, 2019, China. Landslides 2021, 18, 1471–1483. [Google Scholar] [CrossRef]
  18. Li, M.; Zhang, L.; Ding, C.; Li, W.; Luo, H.; Liao, M.; Xu, Q. Retrieval of historical surface displacements of the Baige landslide from time-series SAR observations for retrospective analysis of the collapse event. Remote Sens. Environ. 2020, 240, 111695. [Google Scholar] [CrossRef]
  19. Hu, C.; Li, Y.; Dong, X.; Cui, C.; Long, T. Impacts of Temporal-Spatial Variant Background Ionosphere on Repeat-Track GEO D-InSAR System. Remote Sens. 2016, 8, 916. [Google Scholar] [CrossRef] [Green Version]
  20. Schlogel, R.; Doubre, C.; Malet, J.; Masson, F. Landslide deformation monitoring with ALOS/PALSAR imagery: A D-InSAR geomorphological interpretation method. Geomorphology 2015, 231, 314–330. [Google Scholar] [CrossRef]
  21. Tzouvaras, M.; Kouhartsiouk, D.; Agapiou, A.; Danezis, C.; Hadjimitsis, D. The Use of Sentinel-1 Synthetic Aperture Radar (SAR) Images and Open-Source Software for Cultural Heritage: An Example from Paphos Area in Cyprus for Mapping Landscape Changes after a 5.6 Magnitude Earthquake. Remote Sens. 2019, 11, 1766. [Google Scholar] [CrossRef] [Green Version]
  22. Bayer, B.; Simoni, A.; Schmidt, D.; Bertello, L. Using advanced InSAR techniques to monitor landslide deformations induced by tunneling in the Northern Apennines, Italy. Eng. Geol. 2017, 266, 20–32. [Google Scholar] [CrossRef]
  23. Hilley, G.; Burgmann, R.; Ferretti, A.; Novali, F.; Rocca, F. Dynamics of slow-moving landslides from permanent scatterer analysis. Science 2004, 304, 1952–1955. [Google Scholar] [CrossRef] [PubMed] [Green Version]
  24. Liu, X.; Zhao, C.; Zhang, Q.; Lu, Z.; Li, Z.; Yang, C.; Zhu, W.; Liu-Zeng, J.; Chen, L.; Liu, C. Integration of Sentinel-1 and ALOS/PALSAR-2 SAR datasets for mapping active landslides along the Jinsha River corridor, China. Eng. Geol. 2021, 284, 106033. [Google Scholar] [CrossRef]
  25. Shi, X.; Yang, C.; Zhang, L.; Jiang, H.; Liao, M.; Zhang, L.; Liu, X. Mapping and characterizing displacements of active loess slopes along the upstream Yellow River with multi-temporal InSAR datasets. Sci. Total Environ. 2019, 674, 200–210. [Google Scholar] [CrossRef] [PubMed]
  26. Zhang, Y.; Meng, X.; Jordan, C.; Novellino, A.; Dijkstra, T.; Chen, G. Investigating slow-moving landslides in the Zhouqu region of China using InSAR time series. Landslides 2018, 15, 1299–1315. [Google Scholar] [CrossRef]
  27. Hooper, A. A multi-temporal InSAR method incorporating both persistent scatterer and small baseline approaches. Geophys. Res. Lett. 2008, 35, 96–106. [Google Scholar] [CrossRef] [Green Version]
  28. Ferretti, A.; Fumagalli, A.; Novali, F.; Prati, C.; Rocca, F.; Rucci, A. A New Algorithm for Processing Interferometric Data-Stacks: SqueeSAR. IEEE Trans. Geosci. Remote Sens. 2011, 49, 3460–3470. [Google Scholar] [CrossRef]
  29. Lv, X.; Yazici, B.; Zeghal, M.; Bennett, V.; Abdoun, T. Joint-Scatterer Processing for Time-Series InSAR. IEEE Trans. Geosci. Remote Sens. 2014, 52, 7205–7221. [Google Scholar]
  30. Fornaro, G.; Verde, S.; Reale, D.; Pauciullo, A. CAESAR: An Approach Based on Covariance Matrix Decomposition to Improve Multibaseline-Multitemporal Interferometric SAR Processing. IEEE Trans. Geosci. Remote Sens. 2015, 53, 2050–2065. [Google Scholar] [CrossRef]
  31. Dong, J.; Zhang, L.; Tang, M.; Liao, M.; Xu, Q.; Gong, J.; Ao, M. Mapping landslide surface displacements with time series SAR interferometry by combining persistent and distributed scatterers: A case study of Jiaju landslide in Danba, China. Remote Sens. Environ. 2018, 205, 180–198. [Google Scholar] [CrossRef]
  32. Zhang, Y.; Meng, X.; Chen, G.; Qiao, L.; Zeng, R.; Chang, J. Detection of geohazards in the Bailong River Basin using synthetic aperture radar interferometry. Landslides 2016, 13, 1273–1284. [Google Scholar] [CrossRef]
  33. Sun, Q.; Hu, J.; Zhang, L.; Ding, X. Towards Slow-Moving Landslide Monitoring by Integrating Multi-Sensor InSAR Time Series Datasets: The Zhouqu Case Study, China. Remote Sens. 2016, 8, 908. [Google Scholar] [CrossRef] [Green Version]
  34. Sun, Q.; Zhang, L.; Ding, X.; Hu, J.; Li, Z.; Zhu, J. Slope deformation prior to Zhouqu, China landslide from InSAR time series analysis. Remote Sens. Environ. 2015, 156, 45–57. [Google Scholar] [CrossRef]
  35. Guo, C.; Ren, S.; Li, X.; Zhang, Y.; Yang, Z.; Wu, R.; Jin, J. Development Characteristics and Reactivation Mechanism of the Jiangdingya Ancient Landslide in the Nanyu Town, Zhouqu County, Gansu Province. Geoscience 2019, 33, 206–217. [Google Scholar]
  36. Zhang, C. Geological Environment and Distribution Characteristics of Geological Hazards in Bailong River Basin in Zhouqu County. Gansu Water Conserv. Hydropower Technol. 2010, 46, 26–28. (In Chinese) [Google Scholar]
  37. Bai, S.; Wang, J.; Thiebes, B.; Cheng, C.; Yang, Y. Analysis of the relationship of landslide occurrence with rainfall: A case study of Wudu County, China. Arab. J. Geosci. 2014, 7, 1277–1285. [Google Scholar] [CrossRef]
  38. Yu, B.; Yang, Y.; Su, Y.; Huang, W.; Wang, G. Research on the giant debris flow hazards in Zhouqu County, Gansu province on August 7, 2010. J. Eng. Geol. 2010, 18, 437–444. (In Chinese) [Google Scholar]
  39. Guo, C.; Zhang, Y.; Li, X.; Ren, S.; Yang, Z.; Wu, R.; Jin, J. Reactivation of giant Jiangdingya ancient landslide in Zhouqu County, Gansu Province, China. Landslides 2020, 17, 179–190. [Google Scholar] [CrossRef]
  40. Ma, S.; Qiu, H.; Hu, S.; Yang, D.; Liu, Z. Characteristics and geomorphology change detection analysis of the Jiangdingya landslide on July 12, 2018, China. Landslides 2020, 18, 383–396. [Google Scholar] [CrossRef]
  41. Qi, T.; Meng, X.; Qing, F.; Zhao, Y.; Shi, W.; Chen, G.; Zhang, Y.; Li, Y.; Yue, D.; Su, X.; et al. Distribution and characteristics of large landslides in a fault zone: A case study of the NE Qinghai-Tibet Plateau. Geomorphology 2020, 379, 107592. [Google Scholar] [CrossRef]
  42. Yi, Z.; Xingmin, M.; Allesandro, N.; Tom, D.; Guan, C.; Colm, J.; Yuanxi, L.; Xiaojun, S. Characterization of pre-failure deformation and evolution of a large earthflow using InSAR monitoring and optical image interpretation. Landslides 2021, 19, 35–50. [Google Scholar] [CrossRef]
  43. Hungr, O.; Leroueil, S.; Picarelli, L. The Varnes classification of landslide types, an update. Landslides 2014, 11, 167–194. [Google Scholar] [CrossRef]
  44. Xiao, R.; Yu, C.; Li, Z.; Song, C.; He, X. General Survey of Large-scale Land Subsidence by GACOS-Corrected InSAR Stacking: Case Study in North China Plain. Proc. Int. Assoc. Hydrol. Sci. 2020, 382, 213–218. [Google Scholar] [CrossRef] [Green Version]
  45. Zhang, L.; Dai, K.; Deng, J.; Ge, D.; Liang, R.; Li, W.; Xu, Q. Identifying Potential Landslides by Stacking-InSAR in Southwestern China and Its Performance Comparison with SBAS-InSAR. Remote Sens. 2021, 13, 3662. [Google Scholar] [CrossRef]
  46. Zhang, C.; Li, Z.; Yu, C.; Song, C.; Xiao, R.; Peng, J. Landslide Detection of the Jinsha River Region Using GACOS Assisted InSAR Stacking. Geomat. Inform. Sci. Wuhan Univ. 2021, 46, 1649–1657. [Google Scholar]
  47. Zhou, Z.; Yao, X.; Liu, H.; Ren, K. Accurate Identification of Active Landslides in Region Composed with Glacier, Forest, Steep Valley: A Case Study in the Lantsang Meili Snow Mountain Section. Adv. Eng. Sci. 2020, 52, 61–74. [Google Scholar]
  48. Wright, T.; Parsons, B.; Fielding, E. Measurement of interseismic strain accumulation across the North Anatolian Fault by satellite radar interferometry. Geophys. Res. Lett. 2001, 28, 2117–2120. [Google Scholar] [CrossRef]
  49. Ferretti, A.; Prati, C.; Rocca, F. Permanent scatterers in SAR interferometry. IEEE Trans. Geosci. Remote Sens. 2001, 39, 8–20. [Google Scholar] [CrossRef]
  50. Hooper, A.; Zebker, H.; Segall, P.; Kampes, B. A new method for measuring deformation on volcanoes and other natural terrains using InSAR persistent scatterers. Geophys. Res. Lett. 2004, 31, L23611. [Google Scholar] [CrossRef]
  51. Hooper, A.; Segall, P.; Zebker, H. Persistent scatterer interferometric synthetic aperture radar for crustal deformation analysis, with application to Volcan Alcedo, Galapagos. J. Geophys. Res. Earth Surf. 2007, 112, B07407. [Google Scholar] [CrossRef] [Green Version]
  52. Wegmuller, U.; Magnard, C.; Werner, C.; Strozzi, T.; Caduff, R.; Manconi, A. Methods to avoid being affected by non-zero closure phase in InSAR time series analysis in a multi-reference stack. Procedia Comput. Sci. 2021, 181, 511–518. [Google Scholar] [CrossRef]
  53. Liao, M.; Jiang, H.; Wang, Y.; Wang, T.; Zhang, L. Improved topographic mapping through high-resolution SAR interferometry with atmospheric effect removal. ISPRS J. Photogramm. Remote Sens. 2013, 80, 72–79. [Google Scholar] [CrossRef]
  54. Zhu, Y.; Qiu, H.; Yang, D.; Liu, Z.; Ma, S.; Pei, Y.; He, J.; Du, C.; Sun, H. Pre- and post-failure spatiotemporal evolution of loess landslides: A case study of the Jiangou landslide in Ledu, China. Landslides 2021, 18, 3475–3484. [Google Scholar] [CrossRef]
  55. Yang, D.; Qiu, H.; Ma, S.; Liu, Z.; Du, C.; Zhu, Y.; Cao, M. Slow surface subsidence and its impact on shallow loess landslides in a coal mining area. Catena 2021, 209, 105830. [Google Scholar] [CrossRef]
  56. Meng, Q.; Li, W.; Raspini, F.; Xu, Q.; Peng, Y.; Ju, Y.; Zheng, Y.; Casagli, N. Time-series analysis of the evolution of large-scale loess landslides using InSAR and UAV photogrammetry techniques: A case study in Hongheyan, Gansu Province, Northwest China. Landslides 2020, 18, 251–265. [Google Scholar] [CrossRef]
  57. Jiang, S.; Wen, B.; Li, Z.; Zhao, C. An analysis of the activity features of the Suoertou landslide in Zhouqu county of Gansu. Hydrogeol. Eng. Geol. 2016, 43, 69–74. [Google Scholar]
  58. Jiang, X.; Wen, B. Creep behavior of slip zone of reactivated slow-moving landslide and its characteristic strength. Rock and Soil Mechanics 2015, 36, 495–501. [Google Scholar]
  59. Xie, W.; Bao, X.; Liu, G.; Li, J.; Sun, C. Study on creep characteristics and evolution model of slide body in D area of Qinyu landslide. IOP Conf. Ser. Earth Environ. Sci. 2021, 804, 022051. [Google Scholar] [CrossRef]
  60. Bianchini, S.; Herrera, G.; Mateos, R.M.; Notti, D.; Garcia, I.; Mora, O.; Moretti, S. Landslide Activity Maps Generation by Means of Persistent Scatterer Interferometry. Remote Sens. 2013, 5, 6198–6222. [Google Scholar] [CrossRef] [Green Version]
  61. Qiu, H.; Regmi, A.; Cui, P.; Cao, M.; Lee, J.; Zhu, X. Size distribution of loess slides in relation to local slope height within different slope morphologies. Catena 2016, 145, 155–163. [Google Scholar] [CrossRef]
  62. Yang, D.; Qiu, H.; Hu, S.; Zhu, Y.; Cui, Y.; Du, C.; Liu, Z.; Pei, Y.; Cao, M. Spatiotemporal distribution and evolution characteristics of successive landslides on the Heifangtai tableland of the Chinese Loess Plateau. Geomorphology 2021, 378, 107619. [Google Scholar] [CrossRef]
  63. Tomas, R.; Li, Z.; Lopez-Sanchez, J.; Liu, P.; Singleton, A. Using wavelet tools to analyse seasonal variations from InSAR time-series data: A case study of the Huangtupo landslide. Landslides 2016, 13, 437–450. [Google Scholar] [CrossRef] [Green Version]
  64. Fan, X.; Xu, Q.; Scaringi, G.; Dai, L.; Li, W.; Dong, X.; Zhu, X.; Pei, X.; Dai, K.; Havenith, H. Failure mechanism and kinematics of the deadly 24 June 2017 Xinmo landslide, Maoxian, Sichuan, China. Landslides 2017, 14, 2129–2146. [Google Scholar] [CrossRef]
  65. Dong, J.; Zhang, L.; Li, M.; Yu, Y.; Liao, M.; Gong, J.; Luo, H. Measuring precursory movements of the recent Xinmo landslide in Mao County, China with Sentinel-1-and ALOS-2 PALSAR-2 datasets. Landslides 2018, 15, 135–144. [Google Scholar] [CrossRef]
  66. Intrieri, E.; Raspini, F.; Fumagalli, A.; Lu, P.; Del Conte, S.; Farina, P.; Allievi, J.; Ferretti, A.; Casagli, N. The Maoxian landslide as seen from space: Detecting precursors of failure with Sentinel-1 data. Landslides 2018, 15, 123–133. [Google Scholar] [CrossRef] [Green Version]
Figure 1. Location of Zhouqu County. The background image is the Sentinel-2 image on 3 August 2019. The green and blue rectangles represent the coverage of the ascending and descending Sentinel-1, respectively, and the white labels indicate recent disasters in the study area. In addition, the red circle marks the location of Zhouqu County in Gansu Province in the inset map at the left–bottom.
Remotesensing 14 01026 g001
Figure 2. Flowchart of this study. Radar remote sensing images were used to identify the deformation regions and invert the deformation rates. Optical remote sensing images were used to delimit the topographic boundary. An Unmanned Aerial Vehicle (UAV) was used for photogrammetry, Real-Time Kinematic (RTK) was used for control point surveying, and tape was used for on-site measurements.
Remotesensing 14 01026 g002
Figure 3. Schematic diagram of the SLC, single-look phase, Rmli (multi-look intensity images from SLC images), and multi-look phases.
Remotesensing 14 01026 g003
Figure 4. Average phase rate revealed by Stacking. (a) Ascending track; (b) descending track. The black circles mark the location of the reference point. The degree of color change indicates the degree of deformation. The white boxes contain the names of the detected landslides. The red circles indicate the identified potential landslide areas.
Remotesensing 14 01026 g004
Figure 5. The LOS deformation rate maps in the midstream of the Bailong River. (a) Ascending track; (b) descending track. The black circles mark the location of reference point. Negative values (red color) and positive values (blue color) indicate that the measurement point is moving away from and toward the radar sensor, respectively. The red circles indicate the identified potential landslide areas.
Remotesensing 14 01026 g005
Figure 6. Suoertou landslide. LOS deformation rate of the MPs from the (a) ascending track and (b) descending track, overlaid on Google EarthTM; (ch) photos acquired using a UAV on 11 July 2021; (i) InSAR time-series displacement of points P1, P2, P3, and P4.
Remotesensing 14 01026 g006
Figure 7. Xieliupo landslide. LOS deformation rate of the MPs from the (a) ascending track and (b) descending track superimposed on Google EarthTM; (c,e,g) photos acquired using a UAV taken on 11 July 2021; (d,f) photos of sites d and f taken on 11 July 2021; and (h) time-series displacement of points P5, P6, P7, and P8.
Remotesensing 14 01026 g007
Figure 8. Zhongpai landslide. LOS deformation rate of the MPs from the (a) ascending track and (b) descending track superimposed on Google EarthTM; (c,d) photos acquired using a UAV on 13 July 2021; (e) photos of site e taken on 13 July 2021; and (f) time-series displacement of points P9 and P10.
Remotesensing 14 01026 g008
Figure 9. Qinyu landslide. LOS deformation rate of the MPs from the (a) ascending track and (b) descending track superimposed on Google EarthTM; (c,d) photos acquired using a UAV on 12 July 2021; (eh) photos of sites (eh) taken on 12 July 2021; and (i) time-series displacement of points P11 and P12.
Remotesensing 14 01026 g009
Figure 10. Field investigation of the Yahuokou landslide on 13 July 2021. (a) Digital Surface Model (DSM); (b) rockfalls; (c) rockfall; (d) damaged road; (e) construction organization; (f) building; (g) schematic map of the landslide; (h) introduction to landslide; (i) direction of landslide movement; (j) accumulation area; and (k) landslide panorama.
Remotesensing 14 01026 g010
Figure 11. Yahuokou landslide. (a) Digital Surface Model (DSM); (b) slope; (c) elevation. LOS displacement rates derived from the (d) ascending and (e) descending Sentinel-1 data stack and the background image is the DSM.
Remotesensing 14 01026 g011
Figure 12. InSAR displacement time series and distribution of rainfall. (a) The time-series average LOS displacements of the moving points outlined from the ascending Sentinel-1 data stack and the descending Sentinel-1 data stack by the white curve on the map in Figure 11d,e. (b) Non-linear deformation and daily precipitation from 9 October 2014, to 15 July 2019. (c) Daily precipitation from 16 June 2019, to 15 July 2019.
Remotesensing 14 01026 g012
Table 1. Basic parameters of the SAR datasets.
SensorSentinel-1Sentinel-1
Orbit directionAscendingDescending
Heading angle (°)347193
Path No.5562
Incidence angle (°)37.038.4
Spacing (Rg × Az)2.3 m × 14.0 m2.3 m × 14.0 m
Number of images147157
Temporal coverageOctober 2014 to December 2020October 2014 to December 2020
Publisher’s Note: MDPI stays neutral with regard to jurisdictional claims in published maps and institutional affiliations.

