
Understanding Landslide Susceptibility in Northern Chilean Patagonia: A Basin-Scale Study Using Machine Learning and Field Data

 , , , and
Abstract
:1. Introduction
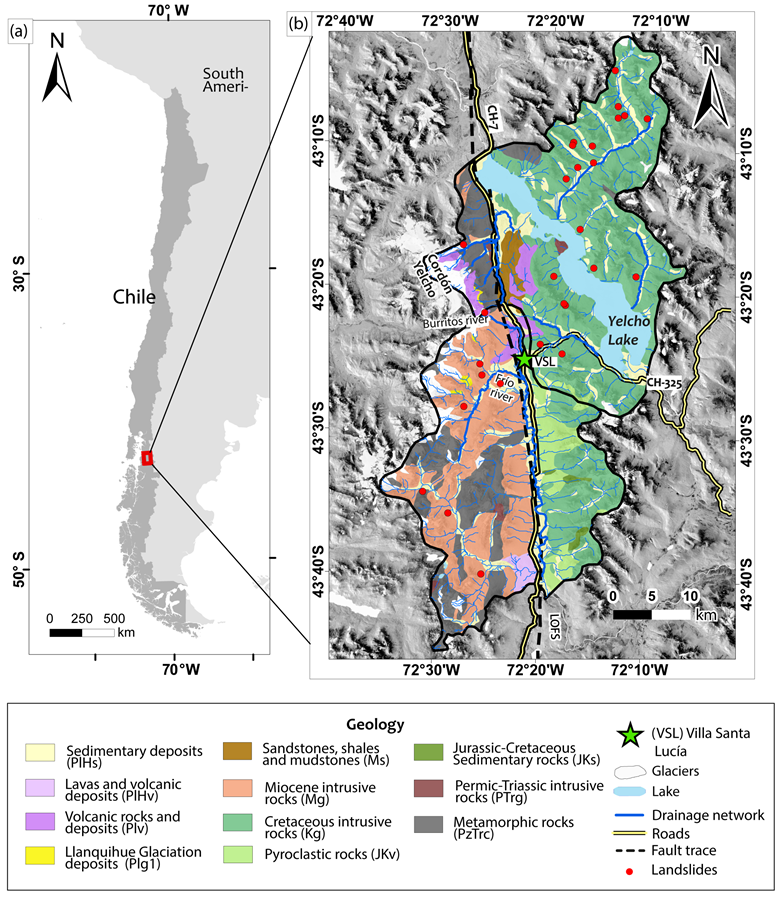
2. Study Area
2.1. Location
2.2. Geological and Geomorphological Setting
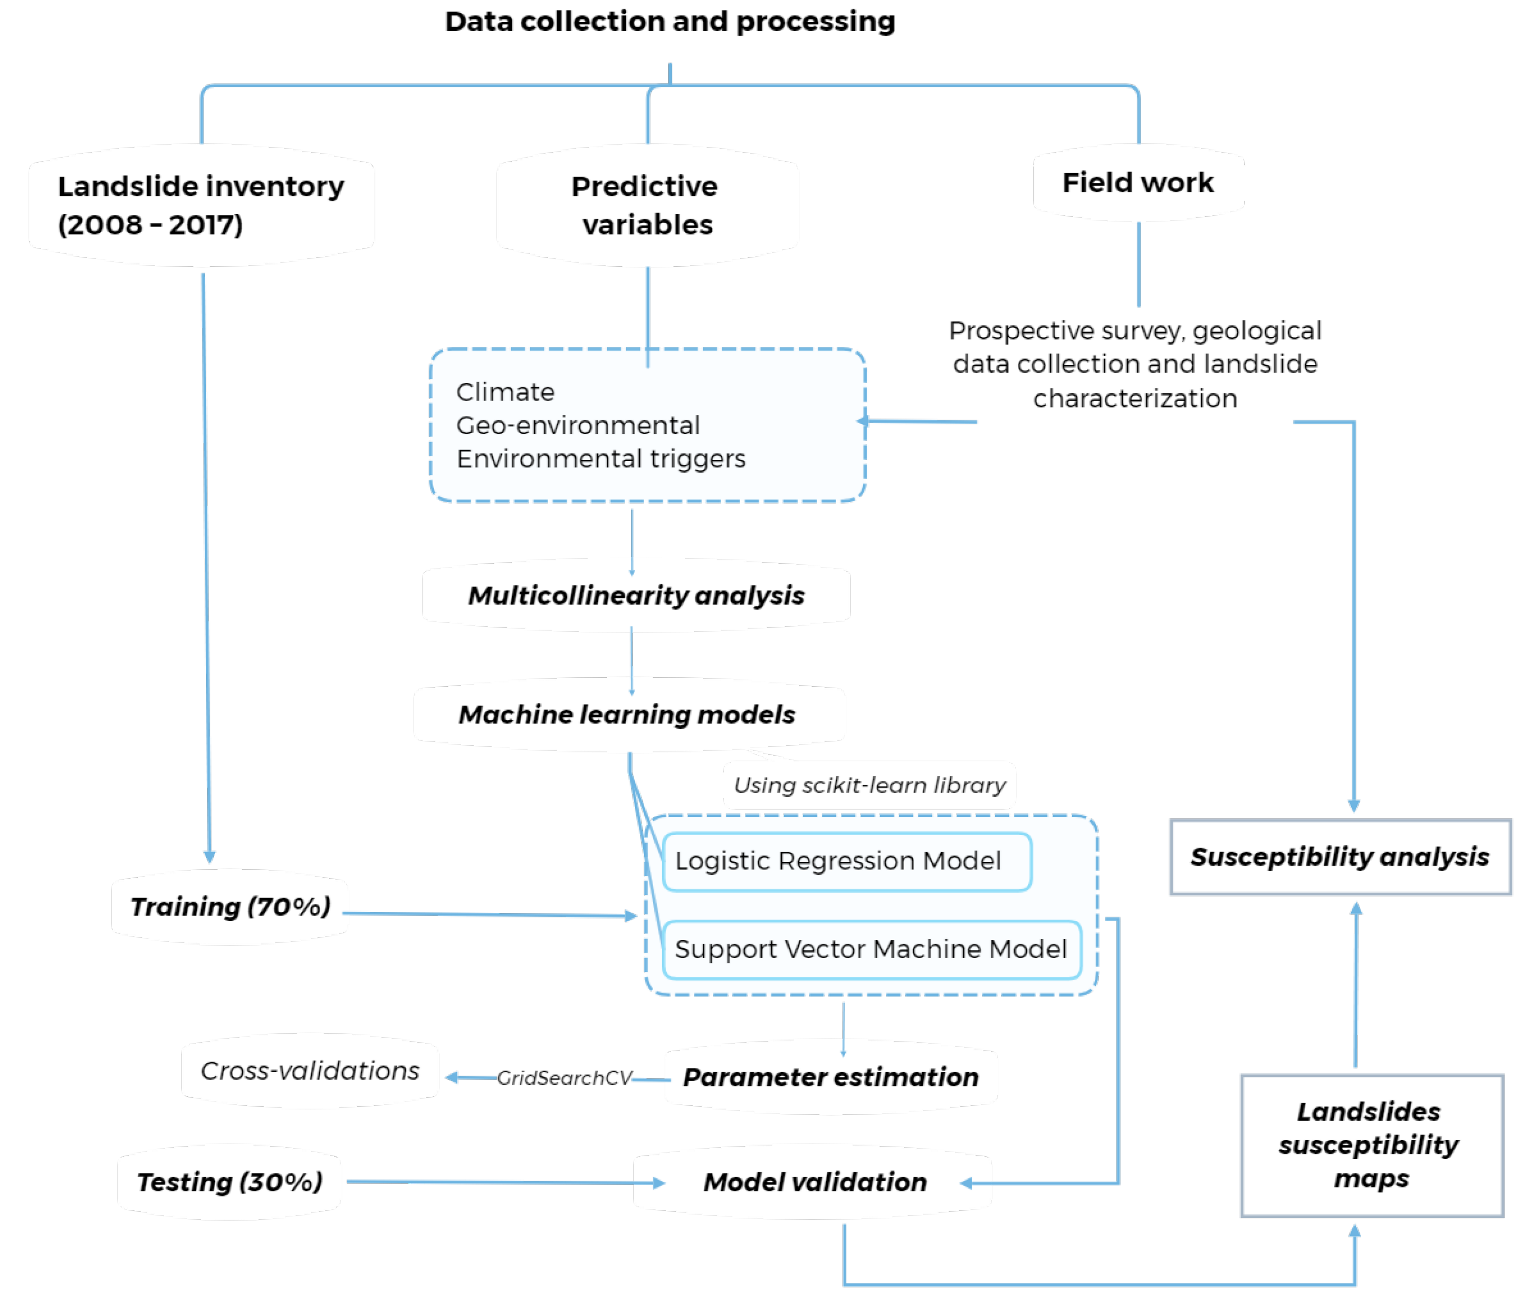
3. Methodology
3.1. Landslide Database
3.2. Predictor Variables
3.2.1. Climate
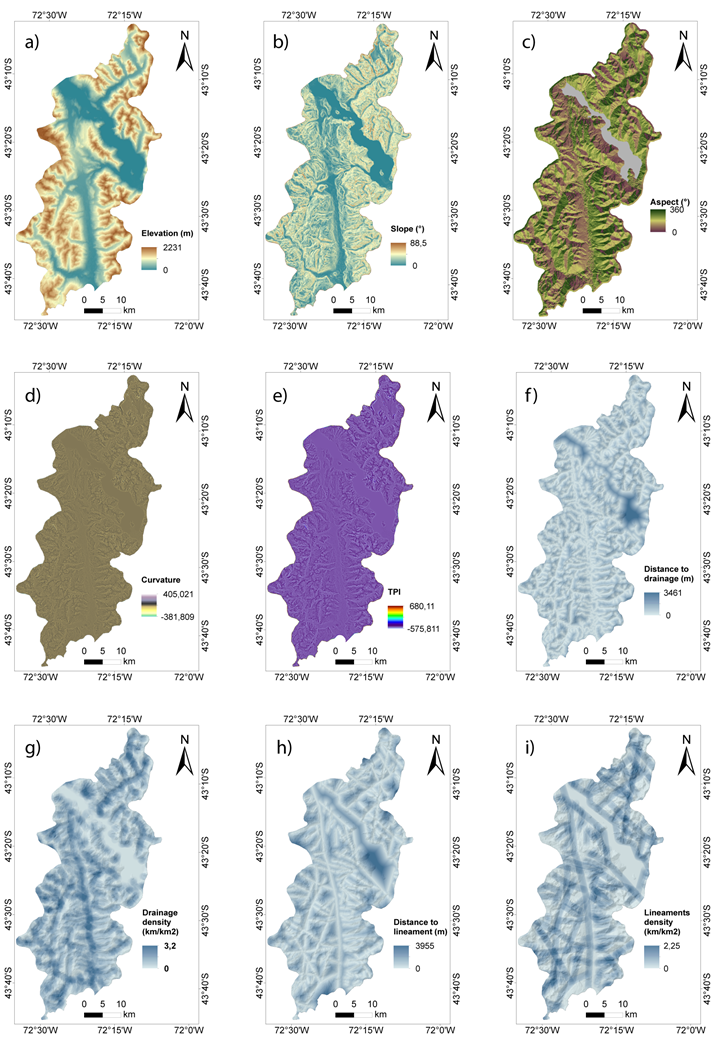
3.2.2. Geo-Environmental Information
3.2.3. Environmental Triggers
3.3. Statistical Modeling
3.3.1. Multicollinearity Analysis
3.3.2. Machine Learning Models and Parameter Estimation
3.3.3. Model Validation
3.4. Fieldwork
4. Results
4.1. Statistical Modeling
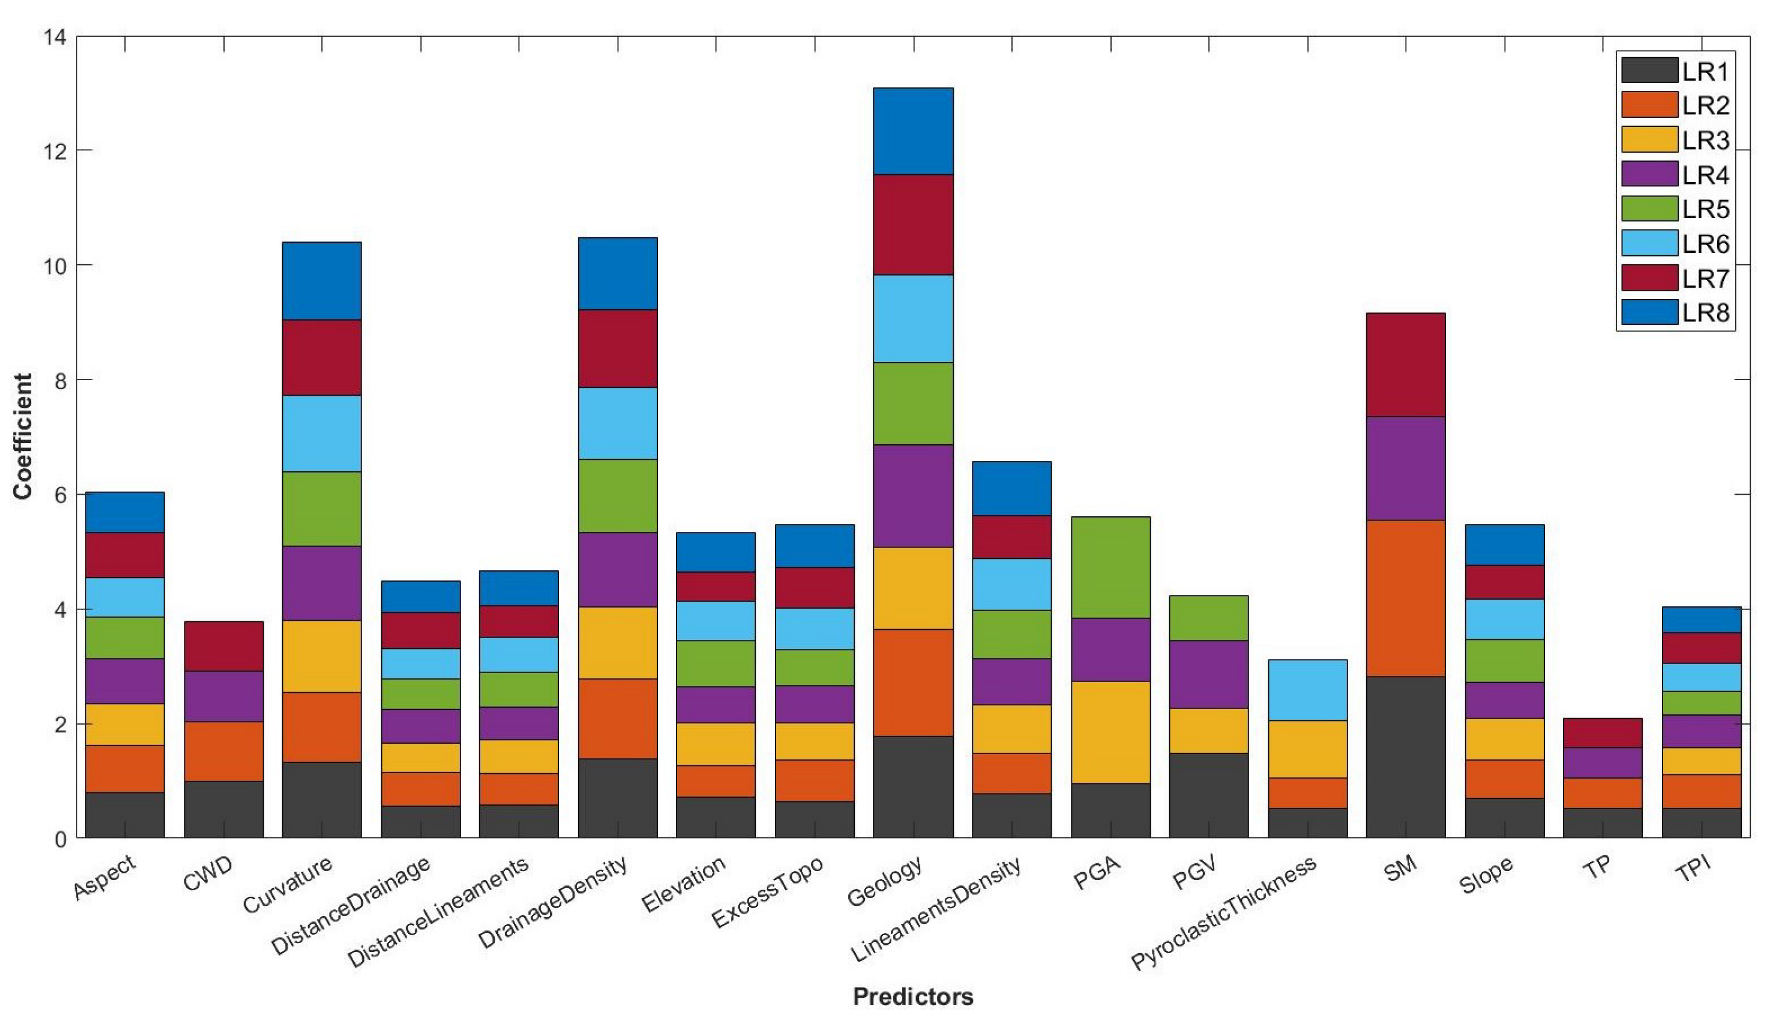
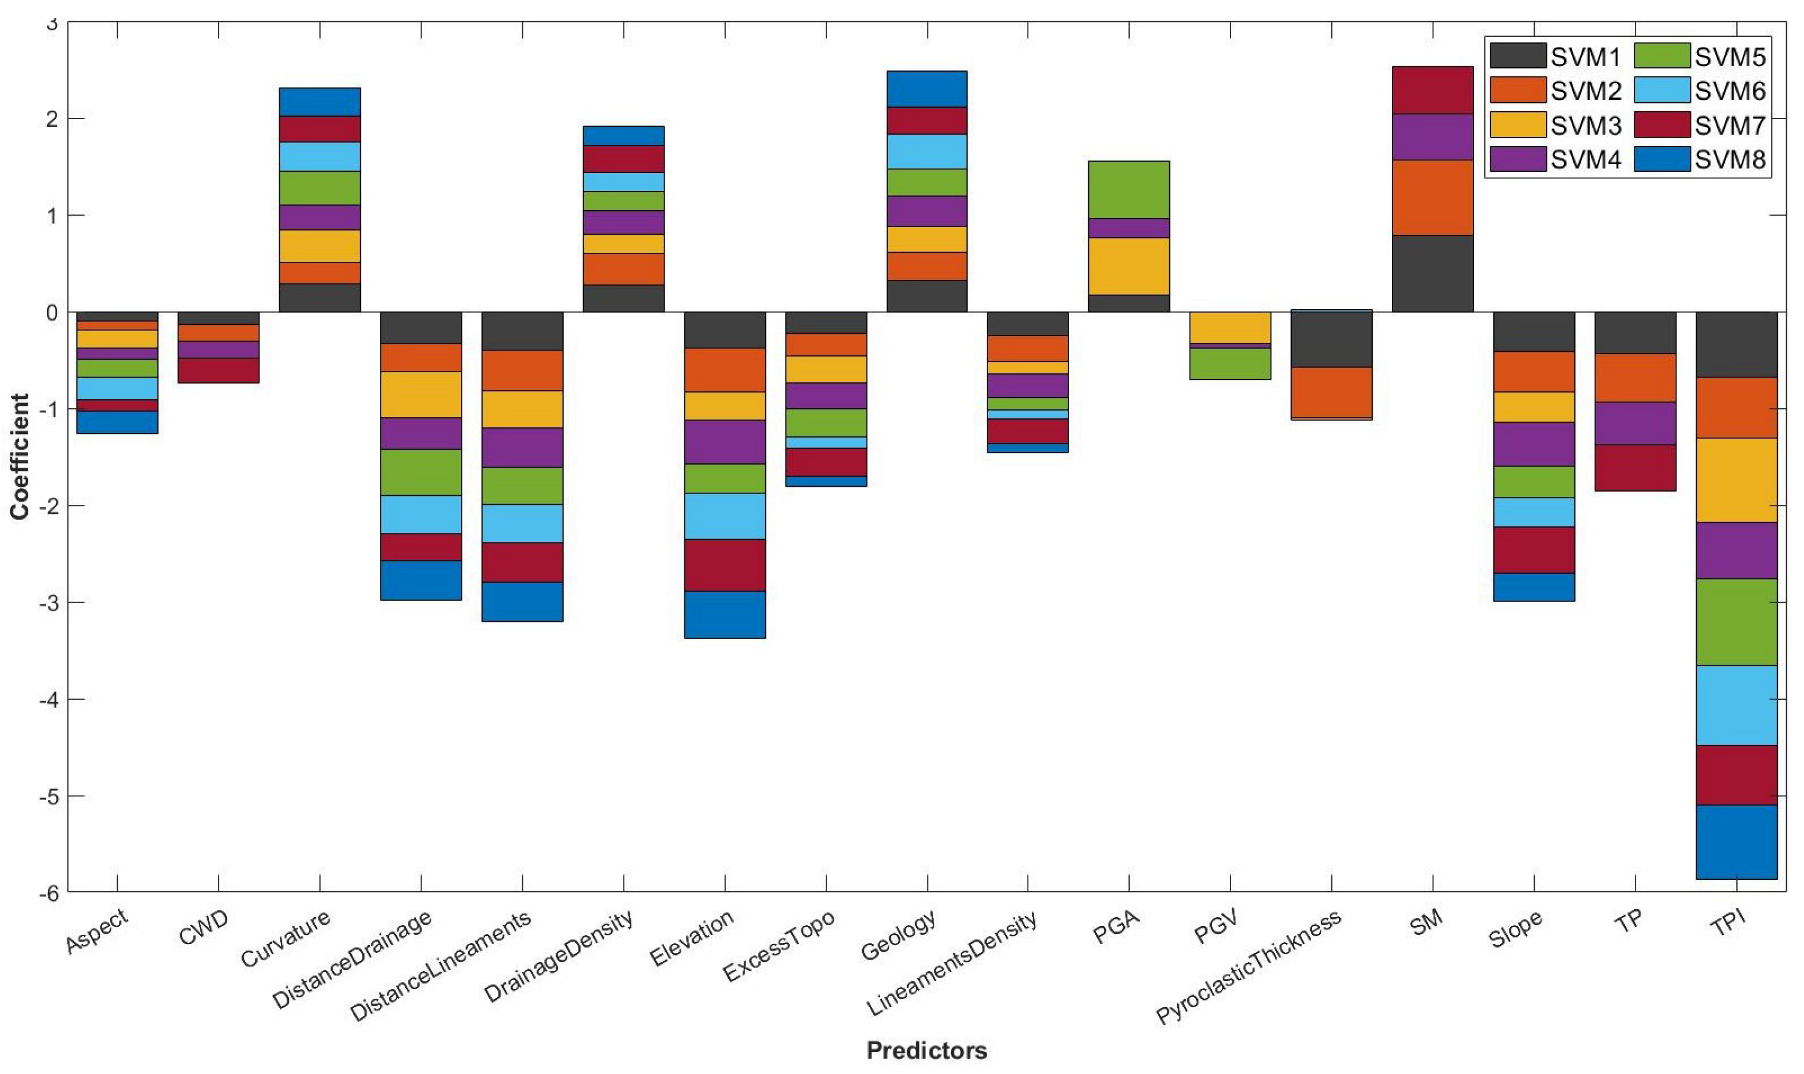
4.1.1. Importance of Predictors
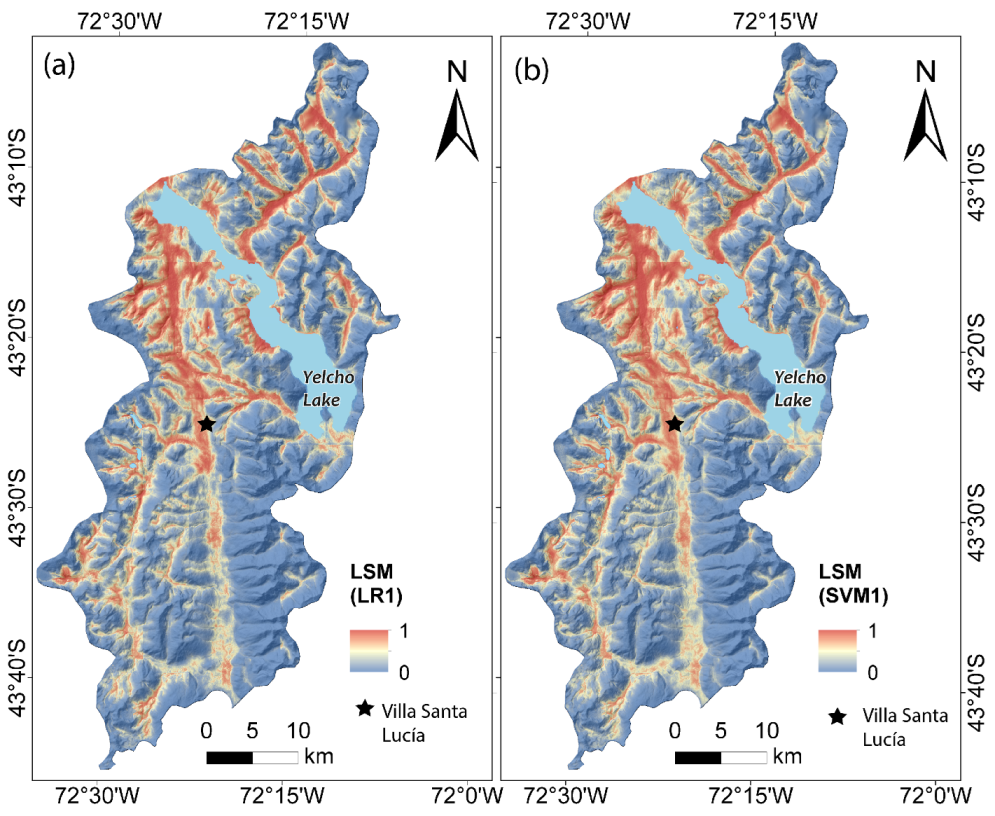
4.1.2. Models’ Performance and Landslide Susceptibility
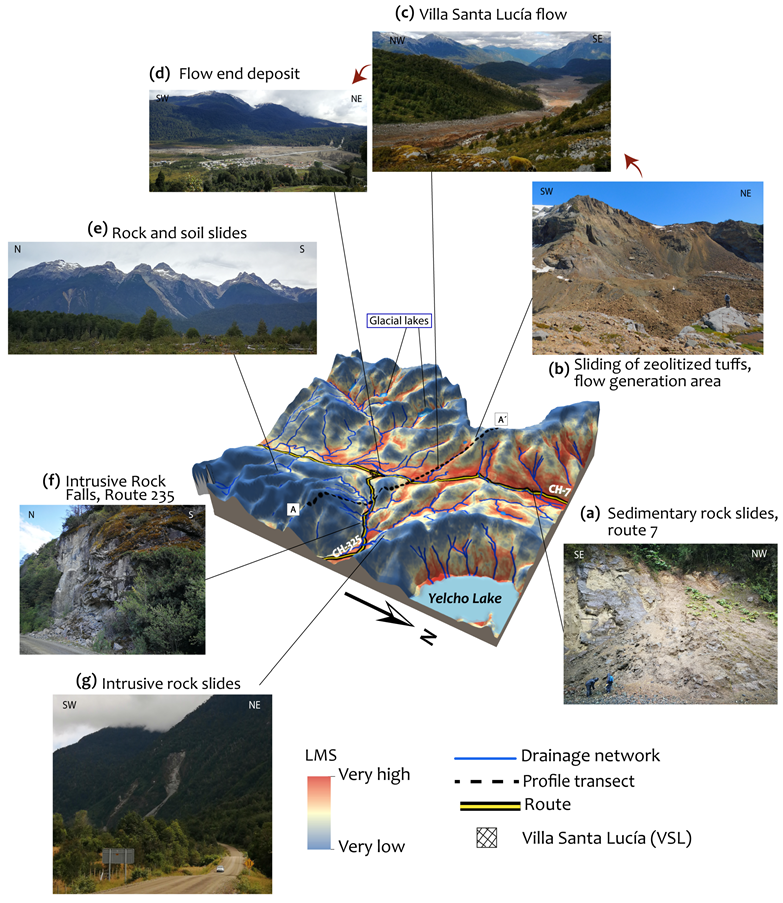
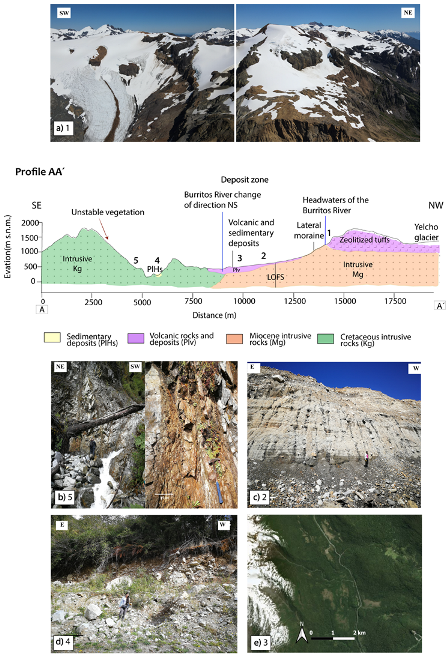
4.2. Field Observations
5. Discussion
5.1. Data Limitation and Approach
5.2. Prediction Capacity of the Variables
5.3. Interpretation of the Results
6. Conclusions
Author Contributions
Funding
Institutional Review Board Statement
Informed Consent Statement
Data Availability Statement
Acknowledgments
Conflicts of Interest
Appendix A


References
- Chapron, E.; Ariztegui, D.; Mulsow, S.; Villarosa, G.; Pino, M.; Outes, V.; Juvignié, E.; Crivelli, E. Impact of the 1960 major subduction earthquake in Northern Patagonia (Chile, Argentina). Quat. Int. 2006, 158, 58–71. [Google Scholar] [CrossRef]
- Xu, W. Finite-fault slip model of the 2016 Mw 7.5 Chiloé earthquake, southern Chile, estimated from Sentinel-1 data. Geophys. Res. Lett. 2017, 44, 4774–4780. [Google Scholar] [CrossRef] [Green Version]
- Sepúlveda, S.A.; Serey, A.; Lara, M.; Pavez, A.; Rebolledo, S. Landslides induced by the April 2007 Aysén Fjord earthquake, Chilean Patagonia. Landslides 2010, 7, 483–492. [Google Scholar] [CrossRef]
- Alfano, F.; Bonadonna, C.; Volentik, A.C.M.; Connor, C.B.; Watt, S.F.L.; Pyle, D.M.; Connor, L.J. Tephra stratigraphy and eruptive volume of the May, 2008, Chaitén eruption, Chile. Bull. Volcanol. 2011, 73, 613–630. [Google Scholar] [CrossRef]
- Cai, W.; McPhaden, M.J.; Grimm, A.M.; Rodrigues, R.R.; Taschetto, A.S.; Garreaud, R.D.; Dewitte, B.; Poveda, G.; Ham, Y.G.; Santoso, A.; et al. Climate impacts of the El Niño—Southern Oscillation on South America. Nat. Rev. Earth Environ. 2020, 1, 215–231. [Google Scholar] [CrossRef]
- Somos-Valenzuela, M.A.; Oyarzún-Ulloa, J.E.; Fustos-Toribio, I.J.; Garrido-Urzua, N.; Chen, N. The mudflow disaster at Villa Santa Lucía in Chilean Patagonia: Understandings and insights derived from numerical simulation and postevent field surveys. Nat. Hazards Earth Syst. Sci. 2020, 20, 2319–2333. [Google Scholar] [CrossRef]
- Morales, B.; Lizama, E.; Somos-Valenzuela, M.A.; Lillo-Saavedra, M.; Chen, N.; Fustos, I. A comparative machine learning approach to identify landslide triggering factors in northern Chilean Patagonia. Landslides 2021, 18, 2767–2784. [Google Scholar] [CrossRef]
- Korup, O.; Seidemann, J.; Mohr, C.H. Increased landslide activity on forested hillslopes following two recent volcanic eruptions in Chile. Nat. Geosci. 2019, 12, 284–289. [Google Scholar] [CrossRef]
- SERNAGEOMIN. Catastro de Remociones en Masa en la Provincia de Palena, Región de Los Lagos; Technical Report; Servicio Nacional de Geología y Minería: Puerto Varas, Chile, 2018. [Google Scholar]
- Korup, O.; Stolle, A. Landslide prediction from machine learning. Geol. Today 2014, 30, 26–33. [Google Scholar] [CrossRef]
- Reichenbach, P.; Rossi, M.; Malamud, B.D.; Mihir, M.; Guzzetti, F. A review of statistically-based landslide susceptibility models. Earth-Sci. Rev. 2018, 180, 60–91. [Google Scholar] [CrossRef]
- Merghadi, A.; Yunus, A.P.; Dou, J.; Whiteley, J.; ThaiPham, B.; Bui, D.T.; Avtar, R.; Abderrahmane, B. Machine learning methods for landslide susceptibility studies: A comparative overview of algorithm performance. Earth-Sci. Rev. 2020, 207, 103225. [Google Scholar] [CrossRef]
- Ilia, I.; Tsangaratos, P. Applying weight of evidence method and sensitivity analysis to produce a landslide susceptibility map. Landslides 2016, 13, 379–397. [Google Scholar] [CrossRef]
- Pourghasemi, H.R.; Teimoori Yansari, Z.; Panagos, P.; Pradhan, B. Analysis and evaluation of landslide susceptibility: A review on articles published during 2005–2016 (periods of 2005–2012 and 2013–2016). Arab. J. Geosci. 2018, 11, 193. [Google Scholar] [CrossRef]
- Cembrano, J.; Lara, L. The link between volcanism and tectonics in the southern volcanic zone of the Chilean Andes: A review. Tectonophysics 2009, 471, 96–113. [Google Scholar] [CrossRef]
- Pérez-Flores, P.; Cembrano, J.; Sánchez-Alfaro, P.; Veloso, E.; Arancibia, G.; Roquer, T. Tectonics, magmatism and paleo-fluid distribution in a strike-slip setting: Insights from the northern termination of the Liquiñe-Ofqui fault System, Chile. Tectonophysics 2016, 680, 192–210. [Google Scholar] [CrossRef]
- Hervé, F.; Fuentes, F.J.; Calderón, M.; Fanning, M.; Quezada, P.; Pankhurst, R.; Rapela, C. Ultramafic rocks in the North Patagonian Andes: Is their emplacement associated with the Neogene tectonics of the Liquiñe–Ofqui Fault Zone? Andean Geol. 2017, 44, 1. [Google Scholar] [CrossRef] [Green Version]
- Aguilera, F.; Honores, C.; Lemus, M.; Neira, H.; Pérez, Y.; Rojas, J. Evaluación de los Recursos Geotérmicos de la Región de Los Lagos. Servicio Nacional de Geología y Minería; Technical Report; Servicio Nacional de Geología y Minería: Providencia, Chile, 2014. [Google Scholar]
- SERNAGEOMIN—BRGM. Carta Metalogénica de la X Región Sur, Informe Registrado IR 95—05; Technical Report; Servicio Nacional de Geología y Minería: Providencia, Chile, 1995. [Google Scholar]
- Moreno, H. Los Volcanes de la X Región Sur: Estudio fotogeológico a escala 1:100.000. In SERNAGEOMIN—BRGM (1995), Carta Metalogénica de la X Región Sur, Informe Registrado IR 95—05. NEXTMAP World 100 DSM de NTERMAP. 2015; Technical Report; Servicio Nacional de Geología y Minería: Providencia, Chile, 1995. [Google Scholar]
- SERNAGEOMIN. Mapa Geológico de Chile: Versión Digital. Servicio Nacional de Geología y Minería, Carta Geológica de Chile, Serie Geología Básica 75, Escala 1: 1.000.000; Technical Report; Servicio Nacional de Geología y Minería: Providencia, Chile, 2003. [Google Scholar]
- Barcaza, G.; Nussbaumer, S.U.; Tapia, G.; Valdés, J.; García, J.L.; Videla, Y.; Albornoz, A.; Arias, V. Glacier inventory and recent glacier variations in the Andes of Chile, South America. Ann. Glaciol. 2017, 58, 166–180. [Google Scholar] [CrossRef] [Green Version]
- Wilson, R.; Glasser, N.F.; Reynolds, J.M.; Harrison, S.; Anacona, P.I.; Schaefer, M.; Shannon, S. Glacial lakes of the Central and Patagonian Andes. Glob. Planet. Chang. 2018, 162, 275–291. [Google Scholar] [CrossRef]
- Hussin, H.Y.; Zumpano, V.; Reichenbach, P.; Sterlacchini, S.; Micu, M.; van Westen, C.; Bălteanu, D. Different landslide sampling strategies in a grid-based bi-variate statistical susceptibility model. Geomorphology 2016, 253, 508–523. [Google Scholar] [CrossRef]
- Gariano, S.L.; Guzzetti, F. Landslides in a changing climate. Earth-Sci. Rev. 2016, 162, 227–252. [Google Scholar] [CrossRef] [Green Version]
- Huggel, C.; Clague, J.J.; Korup, O. Is climate change responsible for changing landslide activity in high mountains? Earth Surf. Process. Landf. 2012, 37, 77–91. [Google Scholar] [CrossRef]
- Funk, C.; Peterson, P.; Landsfeld, M.; Pedreros, D.; Verdin, J.; Shukla, S.; Husak, G.; Rowland, J.; Harrison, L.; Hoell, A.; et al. The climate hazards infrared precipitation with stations—A new environmental record for monitoring extremes. Sci. Data 2015, 2, 150066. [Google Scholar] [CrossRef] [Green Version]
- Abatzoglou, J.T.; Dobrowski, S.Z.; Parks, S.A.; Hegewisch, K.C. TerraClimate, a high-resolution global dataset of monthly climate and climatic water balance from 1958–2015. Sci. Data 2018, 5, 170191. [Google Scholar] [CrossRef] [PubMed] [Green Version]
- Huntington, J.L.; Hegewisch, K.C.; Daudert, B.; Morton, C.G.; Abatzoglou, J.T.; McEvoy, D.J.; Erickson, T. Climate Engine: Cloud Computing and Visualization of Climate and Remote Sensing Data for Advanced Natural Resource Monitoring and Process Understanding. Bull. Am. Meteorol. Soc. 2017, 98, 2397–2410. [Google Scholar] [CrossRef]
- Othman, A.A.; Gloaguen, R.; Andreani, L.; Rahnama, M. Improving landslide susceptibility mapping using morphometric features in the Mawat area, Kurdistan Region, NE Iraq: Comparison of different statistical models. Geomorphology 2018, 319, 147–160. [Google Scholar] [CrossRef]
- Jones, J.N.; Boulton, S.J.; Bennett, G.L.; Stokes, M.; Whitworth, M.R.Z. Temporal Variations in Landslide Distributions Following Extreme Events: Implications for Landslide Susceptibility Modeling. J. Geophys. Res. Earth Surf. 2021, 126, e2021JF006067. [Google Scholar] [CrossRef]
- Schwanghart, W.; Scherler, D. Short Communication: TopoToolbox 2—MATLAB-based software for topographic analysis and modeling in Earth surface sciences. Earth Surf. Dyn. 2014, 2, 1–7. [Google Scholar] [CrossRef] [Green Version]
- Fan, X.; Scaringi, G.; Korup, O.; West, A.J.; Westen, C.J.; Tanyas, H.; Hovius, N.; Hales, T.C.; Jibson, R.W.; Allstadt, K.E.; et al. Earthquake-Induced Chains of Geologic Hazards: Patterns, Mechanisms, and Impacts. Rev. Geophys. 2019, 57, 421–503. [Google Scholar] [CrossRef] [Green Version]
- O’brien, R.M. A Caution Regarding Rules of Thumb for Variance Inflation Factors. Qual. Quant. 2007, 41, 673–690. [Google Scholar] [CrossRef]
- Zhou, C.; Yin, K.; Cao, Y.; Ahmed, B.; Li, Y.; Catani, F.; Pourghasemi, H.R. Landslide susceptibility modeling applying machine learning methods: A case study from Longju in the Three Gorges Reservoir area, China. Comput. Geosci. 2018, 112, 23–37. [Google Scholar] [CrossRef] [Green Version]
- Trigila, A.; Iadanza, C.; Esposito, C.; Scarascia-Mugnozza, G. Comparison of Logistic Regression and Random Forests techniques for shallow landslide susceptibility assessment in Giampilieri (NE Sicily, Italy). Geomorphology 2015, 249, 119–136. [Google Scholar] [CrossRef]
- Hosmer, D.W., Jr.; Lemeshow, S.; Sturdivant, R.X. Applied Logistic Regression; John Wiley and Sons: Hoboken, NJ, USA, 2013. [Google Scholar]
- Noble, W.S. What is a support vector machine? Nat. Biotechnol. 2006, 24, 1565–1567. [Google Scholar] [CrossRef] [PubMed]
- Janik, P.; Lobos, T. Automated Classification of Power-Quality Disturbances Using SVM and RBF Networks. IEEE Trans. Power Deliv. 2006, 21, 1663–1669. [Google Scholar] [CrossRef] [Green Version]
- Huang, Y.; Zhao, L. Review on landslide susceptibility mapping using support vector machines. CATENA 2018, 165, 520–529. [Google Scholar] [CrossRef]
- Hossin, M.; Sulaiman, M. A Review on Evaluation Metrics for Data Classification Evaluations. Int. J. Data Min. Knowl. Manag. Process 2015, 5, 1–11. [Google Scholar] [CrossRef]
- Lever, J.; Krzywinski, M.; Altman, N. Classification evaluation. Nat. Methods 2016, 13, 603–604. [Google Scholar] [CrossRef]
- Gaidzik, K.; Ramírez-Herrera, M.T. The importance of input data on landslide susceptibility mapping. Sci. Rep. 2021, 11, 19334. [Google Scholar] [CrossRef]
- Ozturk, U.; Pittore, M.; Behling, R.; Roessner, S.; Andreani, L.; Korup, O. How robust are landslide susceptibility estimates? Landslides 2021, 18, 681–695. [Google Scholar] [CrossRef]
- Kohno, M.; Maeda, H. Relationship between point load strength index and uniaxial compressive strength of hydrothermally altered soft rocks. Int. J. Rock Mech. Min. Sci. 2012, 50, 147–157. [Google Scholar] [CrossRef]
- Miramontes, E.; Sultan, N.; Garziglia, S.; Jouet, G.; Pelleter, E.; Cattaneo, A. Altered volcanic deposits as basal failure surfaces of submarine landslides. Geology 2018, 46, 663–666. [Google Scholar] [CrossRef] [Green Version]
- Lombardo, L.; Opitz, T.; Ardizzone, F.; Guzzetti, F.; Huser, R. Space-time landslide predictive modelling. Earth-Sci. Rev. 2020, 209, 103318. [Google Scholar] [CrossRef]
- Parker, R.N.; Hancox, G.T.; Petley, D.N.; Massey, C.I.; Densmore, A.L.; Rosser, N.J. Spatial distributions of earthquake-induced landslides and hillslope preconditioning in the northwest South Island, New Zealand. Earth Surf. Dyn. 2015, 3, 501–525. [Google Scholar] [CrossRef] [Green Version]
- Zhuo, L.; Dai, Q.; Han, D.; Chen, N.; Zhao, B.; Berti, M. Evaluation of Remotely Sensed Soil Moisture for Landslide Hazard Assessment. IEEE J. Sel. Top. Appl. Earth Obs. Remote Sens. 2019, 12, 162–173. [Google Scholar] [CrossRef] [Green Version]
- Zhao, B.; Dai, Q.; Han, D.; Zhang, J.; Zhuo, L.; Berti, M. Application of hydrological model simulations in landslide predictions. Landslides 2020, 17, 877–891. [Google Scholar] [CrossRef]
- Paul, F.; Mölg, N. Hasty retreat of glaciers in northern Patagonia from 1985 to 2011. J. Glaciol. 2014, 60, 1033–1043. [Google Scholar] [CrossRef] [Green Version]
- Dussaillant, A.; Benito, G.; Buytaert, W.; Carling, P.; Meier, C.; Espinoza, F. Repeated glacial-lake outburst floods in Patagonia: An increasing hazard? Nat. Hazards 2010, 54, 469–481. [Google Scholar] [CrossRef] [Green Version]
- Anacona, P.I.; Mackintosh, A.; Norton, K. Reconstruction of a glacial lake outburst flood (GLOF) in the Engaño Valley, Chilean Patagonia: Lessons for GLOF risk management. Sci. Total Environ. 2015, 527–528, 1–11. [Google Scholar] [CrossRef]
- Van Daele, M.; Moernaut, J.; Doom, L.; Boes, E.; Fontijn, K.; Heirman, K.; Vandoorne, W.; Hebbeln, D.; Pino, M.; Urrutia, R.; et al. A comparison of the sedimentary records of the 1960 and 2010 great Chilean earthquakes in 17 lakes: Implications for quantitative lacustrine palaeoseismology. Sedimentology 2015, 62, 1466–1496. [Google Scholar] [CrossRef]


| Variable | VIF |
|---|---|
| Aspect | 1.13 |
| Climate water deficit | 1.81 |
| Curvature | 1.56 |
| Drainage density | 1.86 |
| Lineaments density | 1.97 |
| Pyroclastic deposits | 2.32 |
| Drainage distance | 1.69 |
| Lineaments distance | 1.82 |
| Elevation | 3.33 |
| Lithology | 2.04 |
| PGA | 4.31 |
| PGV | 4.63 |
| Slope | 1.76 |
| Soil moisture | 2.59 |
| TP | 1.44 |
| TPI | 1.75 |
| Excess topography | 2.10 |
| Model LR | Model SVM | ||||
|---|---|---|---|---|---|
| Configurations | C | Penalty | Solver | Kernel | C |
| M1 | 10 | l2 | lbfgs | linear | 10 |
| M2 | 1 | l2 | liblinear | linear | 1 |
| M3 | 10 | l2 | newton-cg | linear | 1 |
| M4 | 1 | l2 | newton-cg | linear | 10 |
| M5 | 1 | l2 | lbfgs | linear | 10 |
| M6 | 1 | l2 | saga | linear | 1 |
| M7 | 10 | l2 | sag | linear | 1 |
| M8 | 1 | l2 | saga | linear | 1 |
| Metrics | Precision | Recall | F1-Score | Accuracy | ROC AUC | Score |
|---|---|---|---|---|---|---|
| M1 LR/SVM | 0.83/0.83 | 0.82/0.83 | 0.82/0.83 | 0.82/0.83 | 0.82/0.83 | 0.83/0.83 |
| M2 LR/SVM | 0.83/0.83 | 0.82/0.83 | 0.82/0.83 | 0.83/0.83 | 0.82/0.83 | 0.82/0.83 |
| M3 LR/SVM | 0.80/0.81 | 0.78/0.80 | 0.79/0.80 | 0.79 /0.80 | 0.78/0.80 | 0.78/0.80 |
| M4 LR/SVM | 0.83/0.83 | 0.82/0.82 | 0.82/0.82 | 0.82/0.83 | 0.82/0.82 | 0.82/0.82 |
| M5 LR/SVM | 0.81/0.81 | 0.80/0.80 | 0.81/0.80 | 0.81/0.80 | 0.80/0.80 | 0.80/0.80 |
| M6 LR/SVM | 0.80/0.80 | 0.79/0.80 | 0.79/0.80 | 0.79/0.80 | 0.79/0.80 | 0.79/0.80 |
| M7 LR/SVM | 0.81/0.83 | 0.80/0.82 | 0.80/0.82 | 0.80/0.83 | 0.80/0.82 | 0.80/0.82 |
| M8 LR/SVM | 0.80/0.80 | 0.79/0.80 | 0.79/0.80 | 0.79/0.80 | 0.79/0.80 | 0.79/0.80 |
Publisher’s Note: MDPI stays neutral with regard to jurisdictional claims in published maps and institutional affiliations. |
© 2022 by the authors. Licensee MDPI, Basel, Switzerland. This article is an open access article distributed under the terms and conditions of the Creative Commons Attribution (CC BY) license (https://creativecommons.org/licenses/by/4.0/).
Share and Cite
Lizama, E.; Morales, B.; Somos-Valenzuela, M.; Chen, N.; Liu, M. Understanding Landslide Susceptibility in Northern Chilean Patagonia: A Basin-Scale Study Using Machine Learning and Field Data. Remote Sens. 2022, 14, 907. https://0-doi-org.brum.beds.ac.uk/10.3390/rs14040907
Lizama E, Morales B, Somos-Valenzuela M, Chen N, Liu M. Understanding Landslide Susceptibility in Northern Chilean Patagonia: A Basin-Scale Study Using Machine Learning and Field Data. Remote Sensing. 2022; 14(4):907. https://0-doi-org.brum.beds.ac.uk/10.3390/rs14040907
Chicago/Turabian StyleLizama, Elizabet, Bastian Morales, Marcelo Somos-Valenzuela, Ningsheng Chen, and Mei Liu. 2022. "Understanding Landslide Susceptibility in Northern Chilean Patagonia: A Basin-Scale Study Using Machine Learning and Field Data" Remote Sensing 14, no. 4: 907. https://0-doi-org.brum.beds.ac.uk/10.3390/rs14040907