
Characteristics of Regions with High-Density Initiation of Flashes in Mesoscale Convective Systems
by
 , , ,
, , ,
Fei Wang
1,2,* ,
,
Yijun Zhang
3,4,
Xiaohua Deng
5,
Hengyi Liu
1,2,
Wansheng Dong
1,2 and
Wen Yao
1,2 1
State Key Laboratory of Severe Weather, Chinese Academy of Meteorological Sciences (CAMS), Beijing 100081, China
2
Laboratory of Lightning Physics and Protection Engineering, CAMS, Beijing 100081, China
3
Department of Atmospheric and Oceanic Sciences, Institute of Atmospheric Sciences, Fudan University, Shanghai 200438, China
4
CMA-FDU Joint Laboratory of Marine Meteorology, Shanghai 200438, China
5
National Marine Environmental Forecasting Center, State Oceanic Administration, Beijing 100081, China
*
Author to whom correspondence should be addressed.
Remote Sens. 2022, 14(5), 1193; https://0-doi-org.brum.beds.ac.uk/10.3390/rs14051193
Submission received: 25 January 2022
/
Revised: 22 February 2022
/
Accepted: 25 February 2022
/
Published: 28 February 2022
(This article belongs to the Special Issue Remote Sensing of Lightning and Its Applications in Atmospheric Electricity Studies)
Abstract
:To investigate the characteristics of regions exhibiting multiple lightning initiations within a finite volume and a short time, the lightning location data obtained from the convective regions of 14 mesoscale convective systems were analyzed in combination with data from radar. In total, 415 out of 5996 radar grids (1 km × 1 km × 0.5 km) were found to initiate more than one flash within 6 min. Only 49 grids showed an initiation density of more than two flashes within 6 min. The grids with high flash initiation densities were found to have a similar distribution to those with one lightning initiation within 6 min, in terms of altitude and reflectivity relative to altitude. They also showed similar trends in their frequency evolution. The grids with higher initiation densities seemed to be more concentrated in the altitude range of 9–13 km. However, only one was found to form at a lower altitude near the melting level when lightning initiation clearly declined. Moreover, the spatial relationship of this lower higher-initiation density grid to the reflectivity core was different to that in the main altitude range. In this paper, the possible dynamic and electrical mechanisms of the formation of this lower higher-initiation density grid are discussed.
1. Introduction
The conditions of regions displaying lightning initiation represent an important research topic for the improvement of lightning warning systems and the assessment of lightning risk, as well as for gaining insight into the conditions allowing lightning initiation and propagation. It is common practice to carry out such research using lightning location data combined with weather radar data. Based on this method, many previous studies have obtained a range of research results relating to the reflectivity in the lightning initiation regions and their altitude distributions [1,2,3,4,5,6]. The findings of these studies indicate that lightning flashes are usually initiated in regions with a moderate reflectivity range of 20–40 dBZ, instead of in the core, where reflectivity is strongest [1,2,5]. Moreover, the distribution of lightning relative to altitude and radar reflectivity was found to vary as a function of both storm type and flash type [3,4,5]. The peak distribution areas of lightning initiation relative to altitude and reflectivity have a relatively low altitude range and a relatively small reflectivity range for mesoscale convective systems (MCSs) (8–9 km and 30–35 dBZ), those with multiple cells (8–10 km and 30–35 dBZ), and those with supercells (10–12 km and 35–40 dBZ) [5]. A study of the distribution of the reflectivity and altitude of a VHF source detected in isolated convections indicated that the distributions of VHF sources in normal storms are similar (7–10 km), although there is a slight change with an alteration in the region [7]. The reflectivity of cloud-to-ground lightning flashes at initiation has been found to be stronger than that of intra-cloud lightning flashes [4,8]. Moreover, recent research has shown that the reflectivity characteristics of stratiform initiation regions of lightning flashes in MCSs are different from those initiated in convective regions [6]. In other regions, some researchers have used data from similar lightning location systems to analyze the characteristics of lightning flashes, including intra-cloud and cloud-to-ground lightning flashes, combined with radar data, and derived similar results for the distributions of lightning initiation/propagation altitude and co-located radar variation [8,9,10,11].
Most of the above studies only considered the positions of lightning initiation, and did not treat regions with different initiation densities differently. However, in a finite region, lightning flashes could be initiated just once or several times within a limited period. Based on existing knowledge about electrical activity in a thunderstorm [12], in a region with a high initiation density, the electrical field should be quickly re-strengthened to a level sufficient for another initiation after the last flash. This means that, at that moment, the final effect of the electrical activity in the vicinity is that the charges of the nearby layers can be replenished quickly. Therefore, the charges of the charge layers near the multiple-initiation region can quickly return to a sufficiently level for another initiation after the last discharge. This is also assumed to contribute to the increases in average flash duration with increases in flash initiation density in regions with a large initiation density [13].
However, few studies based on high lightning initiation density have been conducted [13,14,15,16] (e.g., As we know, electrification processes charge different particles with opposite polarity charges first; then those opposite charges are transported (charge separation) to the charge accumulation areas (net charge layers). Once the charge densities in the charge layers have accumulated to a sufficiently high level, a flash can be initiated. The neutralization of a flash will reduce the charge densities, while the processes mentioned above (electrification and charge separation) will strengthen the charge densities again for the next discharge. The combined efficiency (charge supplement efficiency) of the above electrical activities may determine whether the next flash can be initiated in the same finite volume, and how quickly it can be initiated again. Those regions displaying multiple initiations of flashes within a short time should be treated as the true center of lightning activity, and deserve more attention in lightning warning systems and lightning risk assessments. An analysis approach based on the volume of every lightning initiation, but that ignores the time relationship between these discharges, may give rise to a situation where the characteristics of the volumes with high lightning initiation density are blurred by those with low lightning initiation density, even though the former should be dominant. However, because of the lack of targeted research, the specific quantitative results regarding the correlation and evolution of regions with different lightning initiation densities remain unclear. In this study, we used the lightning location data of 14 MCSs combined with data from radar to carry out a preliminary study of the characteristics of regions with a high lightning initiation density.
2. Data
2.1. Lightning Location Data
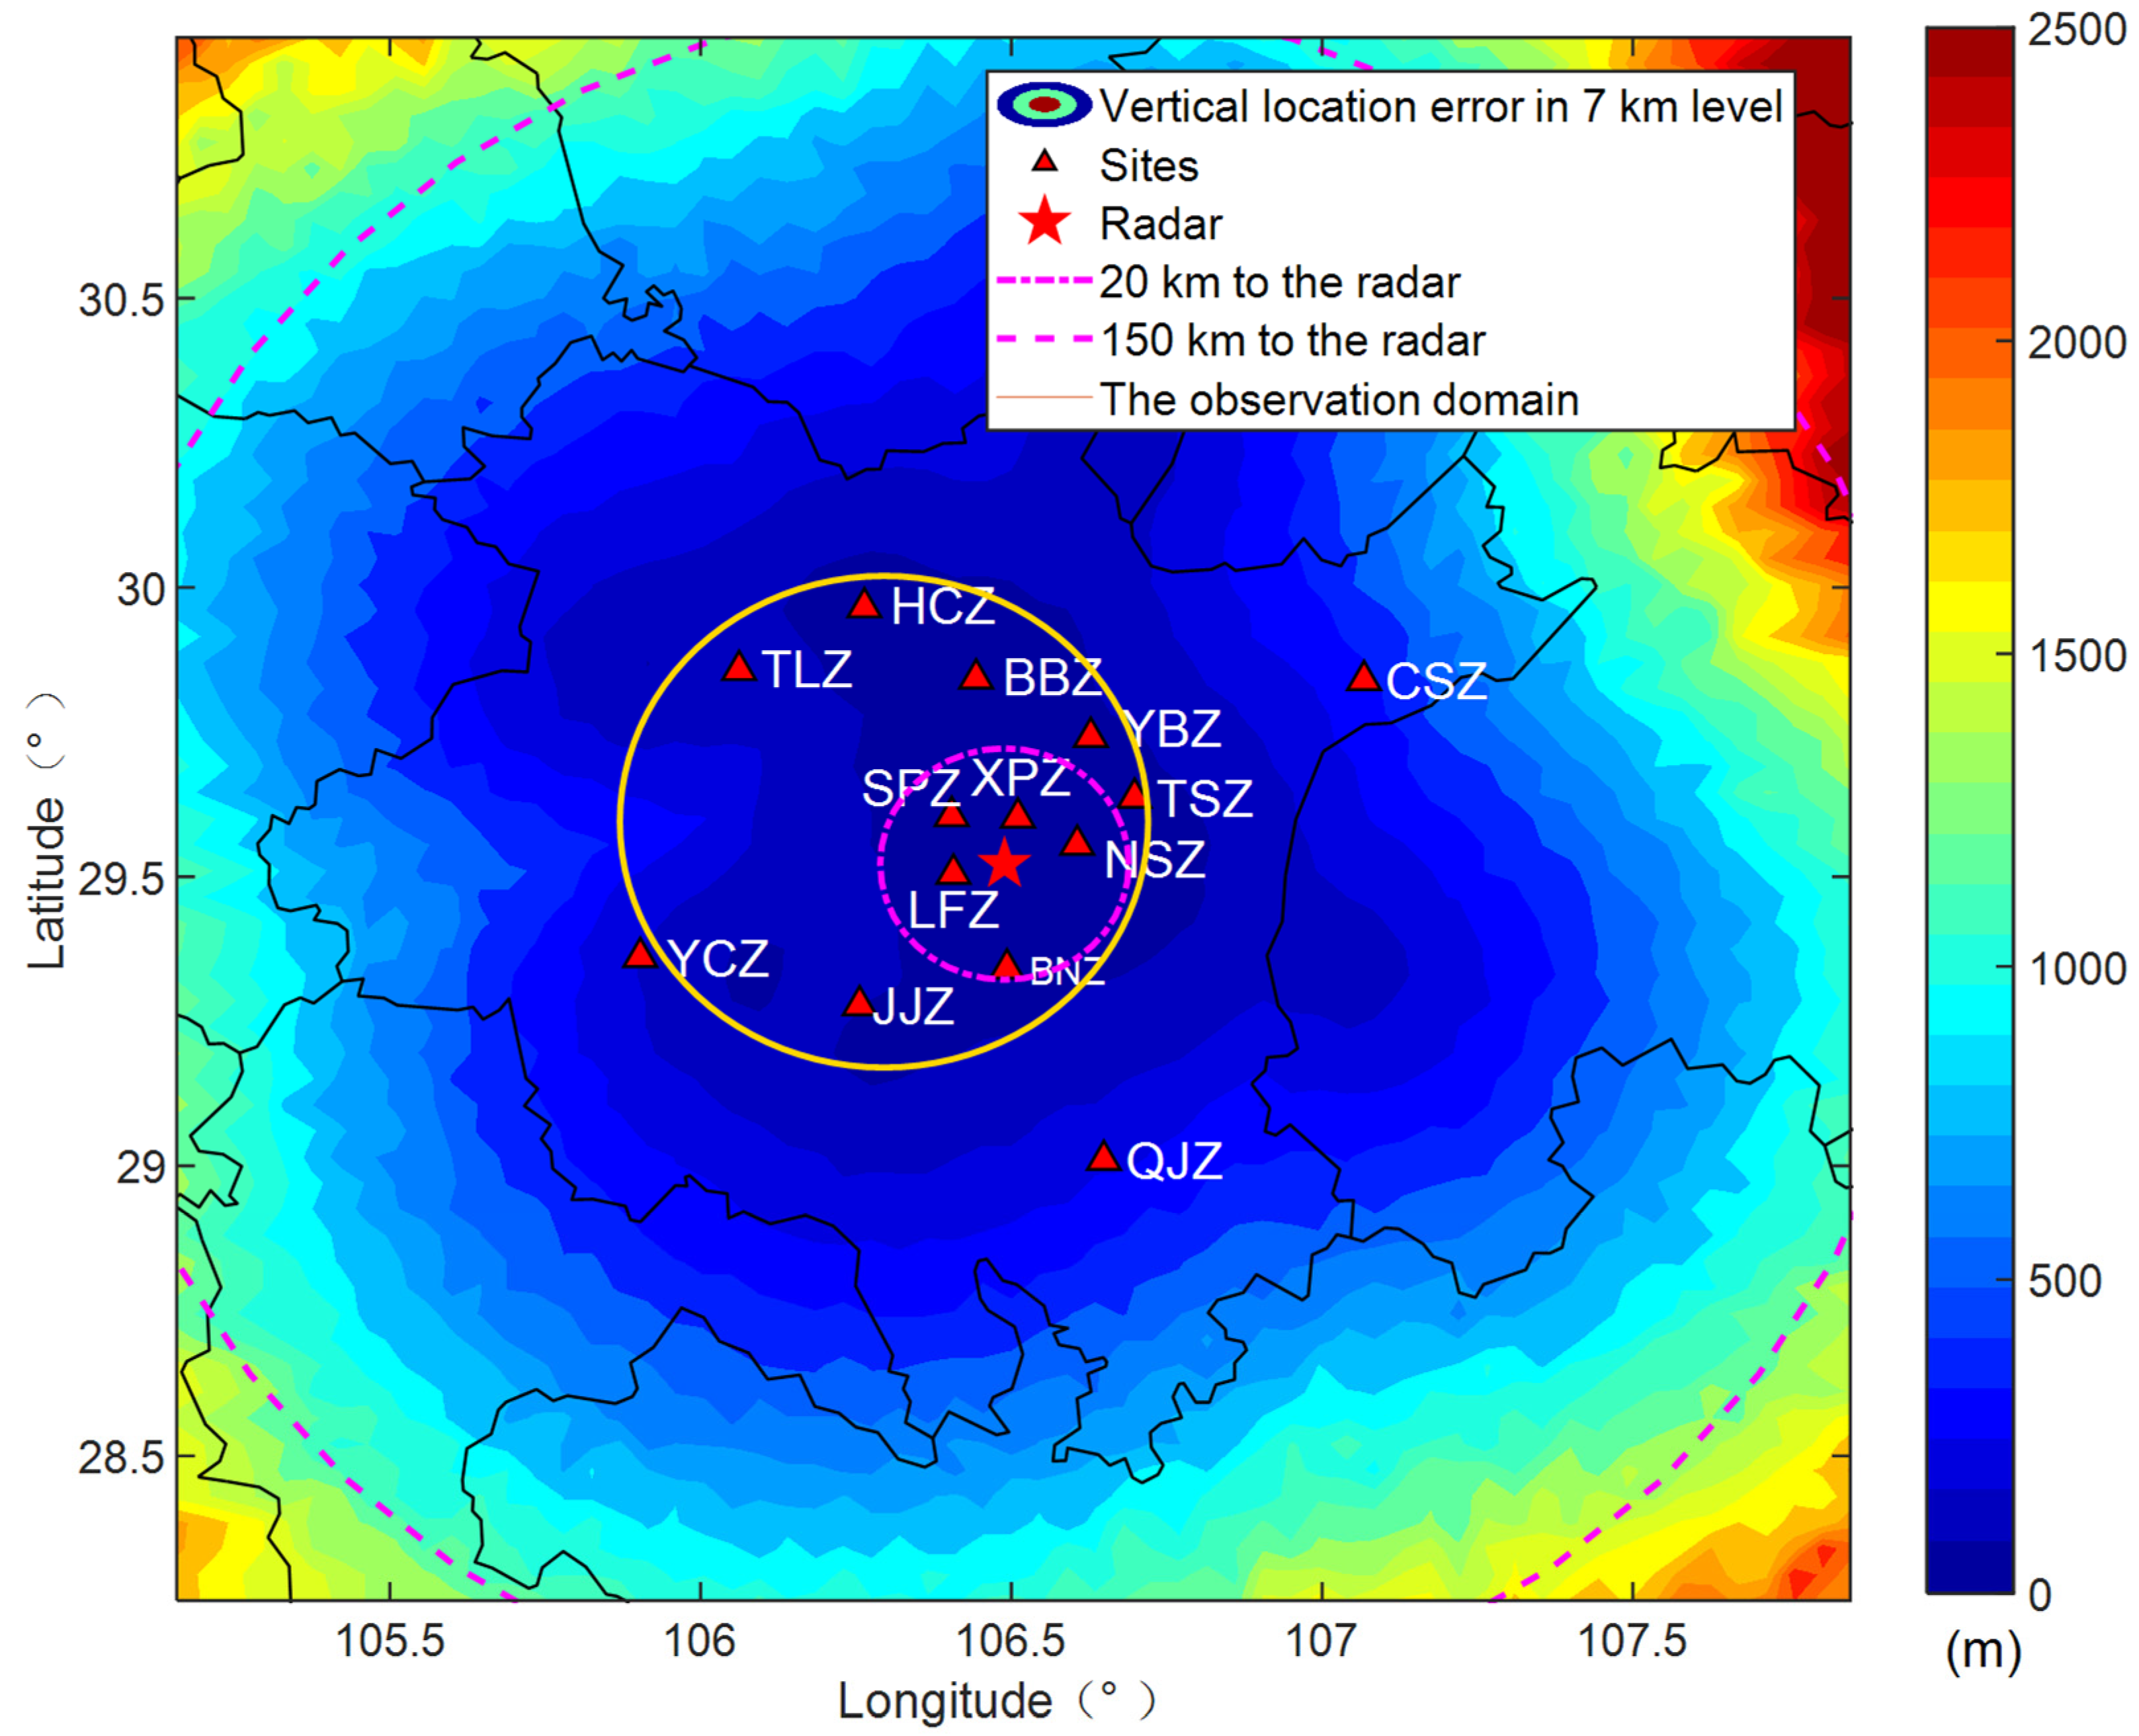
The lightning flashes used for analysis in this study were located by a network consisting of 14 sensors (Figure 1) that received the very-high-frequency (VHF) signals radiated by lightning, located in Chongqing, southwest China [6,17,18]. This lightning mapping system was similar in design to the lightning mapping array used in the United States [19,20,21,22]. The distances between each pair of sensors varied within the range 10–100 km. Each VHF radiation source was located using time differences in the time-of-arrival signals at the sensors. A global positioning system (GPS) device was used for the synchronization of the sensors and guaranteed a synchronization accuracy better than 50 ns.
The VHF radiation sources were grouped into flashes based on the method of MacGorman et al. [23]. Under this system, a new VHF radiation source will be added to a flash if it occurs within 150 ms of the previous source and 3 km from any source already accounted for in the flash. Two segments previously treated as separate flashes will be merged into one flash if the newest source added to one of the segments satisfies the 150 ms and 3 km criteria for both segments. The maximum duration permitted for each flash is 3 s.
To ensure high accuracy in the location of the VHF radiation sources, only VHF signals simultaneously received by at least six sensors were used in the location calculation [20]. Moreover, to ensure that the lightning flashes used for the analysis could be detected by as many sensors as possible, only the lightning flashes occurring in a domain of about 80 km in diameter and surrounded by a large number of sensors (the observation domain) were selected for analysis (Figure 1). This ensured that the errors in the height of the VHF radiation source located by our network in the observation domain were mostly less than 200 m.
To avoid the high electromagnetic interference of the urban area of Chongqing, the trigger threshold of most of the sensors was set to a high level. The maximum and minimum trigger thresholds were about −35 dBm and −85 dBm, respectively. As a result, only high-power VHF radiation sources could be detected and located. Thomas et al. [21] indicated that the initial VHF radiation source of a flash has a consistently very high peak power, and powerful VHF radiation sources usually occur in positively charged regions. This means that the initial VHF radiation source can be detected even by a sensor with a high trigger threshold. This ensures our network can efficiently detect the initiation of lightning flashes. Although Rison et al. [24] indicated that the position of the initial radiation is often poorly identified, the location error (less than about 200 m) is acceptable when compared with the resolution of the radar data (about 1 km) used here. The high trigger thresholds of most of the sensors in our network also mean that most of the VHF radiation sources detected by our network are produced by negative breakdowns in the positively charged regions, because previous observations found that the channel on the end propagating in the positively charged layer produces stronger VHF signals than those produced by the end propagating in the negatively charged layer [25]. Therefore, it is easy for the lightning data provided by our network to roughly determine the positively charged region but to miss the negatively charged region.
2.2. Radar Data
The S-band radar used here was single-polarization radar, which has been operating for more than 10 years. The radar technique was the same as that used in the WSR-88D system in the USA. The scan volume, with a beam width of 1°, consisted of nine tile angles from 0.5° to 19.5° in 6 min. The data quality was controlled using a program to avoid the impacts of some artifacts such as ground echo, clear sky echo, and sea clutter [18].
Before the radar data were used, they were interpolated from polar coordinates to Cartesian coordinates using a vertical interpolation scheme with nearest neighbor on the range-azimuth plane [26]. The interpolated data had a horizontal resolution of 1 km and a vertical resolution of 0.5 km.
After that, the radar coverage was divided into convective and stratiform regions using the convective/stratiform participation method of Biggerstaff and Listemaa [27]. The observations indicate that the dynamic structures in the convective and stratiform regions are totally different, and give rise to a variety of cloud and precipitation structures in these regions [28,29,30,31]. The convective region consists of intense, vertically extending cores, while the stratiform region is of a more uniform texture with lighter precipitation and is usually characterized by a bright band in radar observation [32,33,34,35,36]. Therefore, the convective/stratiform participation method comprehensively uses a series of reflectivity parameters, including reflectivity at the working level [37], horizontal reflectivity gradient, reflectivity laps rate, and bright band fraction [38], to distinguish the convective region from the stratiform region [27]. To avoid negative impacts on the low-level cloud observations arising from the elevation and the radar-blind zone present above the site, only radar data from 20–150 km from the radar site were used in the analysis.
In the volume of an interpolated radar grid (1 km × 1 km × 0.5 km), the number of first-mapped VHF radiation sources of flashes located within this volume during a radar scanning period was determined and entered as the initiation density of the grid. Although the location of the initiation of lightning flashes may be confused because of the powerful and frequent pulses occurring in the initiation process [24], the errors were estimated to be acceptable when compared with the resolution of the radar data [17], and are therefore unlikely to negatively affect the results of our analysis.
A radar grid with only one flash initiation within one radar scanning time was defined as a low-density initiation (LD) grid, while a grid with two or more initiation densities within one scanning time was defined as a high-density initiation (HD) grid. Among the HD grids, a grid with an initiation density more than two flashes grid−1 6 min−1 was defined as a super-high-density initiation (SD) grid (note that according to the definition, SD grids are a subset of HD grids).
It should be noted that the times of the LD, HD, and SD grids are marked by the starting time of radar scanning and these grid times are subsequently used for frequency calculation. This means that the lightning flashes, which are used to calculate the frequency of a grid, in fact occur within 6 min of the time marked for this grid.
Although a distance range (20 km) to the radar site has been enforced to avoid the most radar-blind zone, the upper parts of some cells with strong convection and which are close to the radar site may still be missed because the maximum elevation of the radar beam (19.5°) may limit the maximum altitude detectable by radar to an altitude lower than the upper parts of these cells. This causes the number of grids with radar observation data to be lower than the total number of grids. It does not mean that those grids without reflectivity data and at a high altitude are located above the cloud tops, but that they could not be observed by the radar. In the following, only grids under the maximum elevation of the radar beam are used when analysis is associated with reflectivity.
2.3. Temperature Corresponding to Altitude
Based on the thermodynamic equations of state for atmospheric air, mixing dry air and water vapor, temperature is a more appropriate parameter than altitude, because it can describe the distribution of many atmospheric parameters even in different geographic regions. Moreover, previous studies found that the main electrification processes depend on environmental temperature rather than on altitude [39,40,41]. Therefore, the vertical distribution of charge in many previous studies using data from electric sounding is usually described in terms of temperature [42,43]. However, no real-time sounding has been carried out through every storm in Chongqing. In order to illustrate an approximate temperature range of altitude in the subsequent analysis, the daily sounding data of all thunderstorm days in July–August 2014–2015 in Chongqing are used to calculate the average temperatures corresponding to altitudes from 1 to 16 km with an interval of 1 km. Note that these temperatures are statistical values, not the true distribution of temperature in a storm. In some specific parts or periods of a storm, the real temperatures corresponding to altitudes may fluctuate greatly from these statistical values. They are just used to outline the approximate temperature range corresponding to each altitude for reference to similar research results. Therefore, these statistical temperature values are used only to describe the temperature range of the statistical results for altitude, and are retained to within one decimal point.
3. Results
Based on the data from the radar and the lightning location system, 6333 grids at which lightning flashes were initiated were found in all 14 MCSs. According to the convective/stratiform participation method of Biggerstaff and Listemaa [27], 5996 grids were in the convective regions and 337 in the stratiform regions.
Table 1 lists the maximum altitudes of the 30 dBZ echo top and the maximum areas of the 30 dBZ region at the altitude of 7 km (about −10 °C), which is an important altitude/temperature for the onset of lightning activity [44,45,46], for 14 analyzed MCSs. Note that the maximum altitudes of the 30 dBZ echo top and the maximum areas of the 30 dBZ region are only counted based on the radar data within the observation domain when these MCSs pass through the observation domain. As mentioned in Wang et al. [17], because of the limitation of the observation domain, some MCSs with a larger area than the observation domain and some MCSs partly within the observation domain could be partially captured by the observation domain for both radar echo and lightning flashes. Therefore, only the radar echoes within the observation domain have been used for the statistics shown in Table 1, because these should constitute the majority of the echoes that are closely related to the lightning flashes to be analyzed, although sometimes some echoes just outside of the observation domain may also have an impact.
In the stratiform grids, the maximum value of the initiation density was found to be two flashes grid−1 6 min−1. The initiation density in ~98.2% of the stratiform grids was found to be one flash grid−1 6 min−1. Only six stratiform grids showed an initiation density greater than one flash grid−1 6 min−1. Since the charge structures are different between convective and stratiform regions, the main electrification processes in these regions are correspondingly inferred to be different [42,43,47,48,49,50,51], and thus the characteristics of the stratiform grids can be expected to be different from those of the convective grids. However, the number of stratiform grids was considered too small to be worth analyzing in-depth, and thus these stratiform grids were not analyzed in depth in this study. The data from the stratiform grids will be accumulated and may be analyzed in the future when the dataset is sufficiently large.
However, based on this small number of samples, the HD grids in the stratiform regions formed within the altitude range of 9–13 km (about −21.9 to −52.7 °C). Approximately 66.7% of the HD grids in the stratiform regions formed in regions with an altitude of 9–11 km (about −21.9 to −36.4 °C). Note that this small sample is highly susceptible to localized maxima and minima, and more accurate results need to be obtained to provide a larger dataset in future.
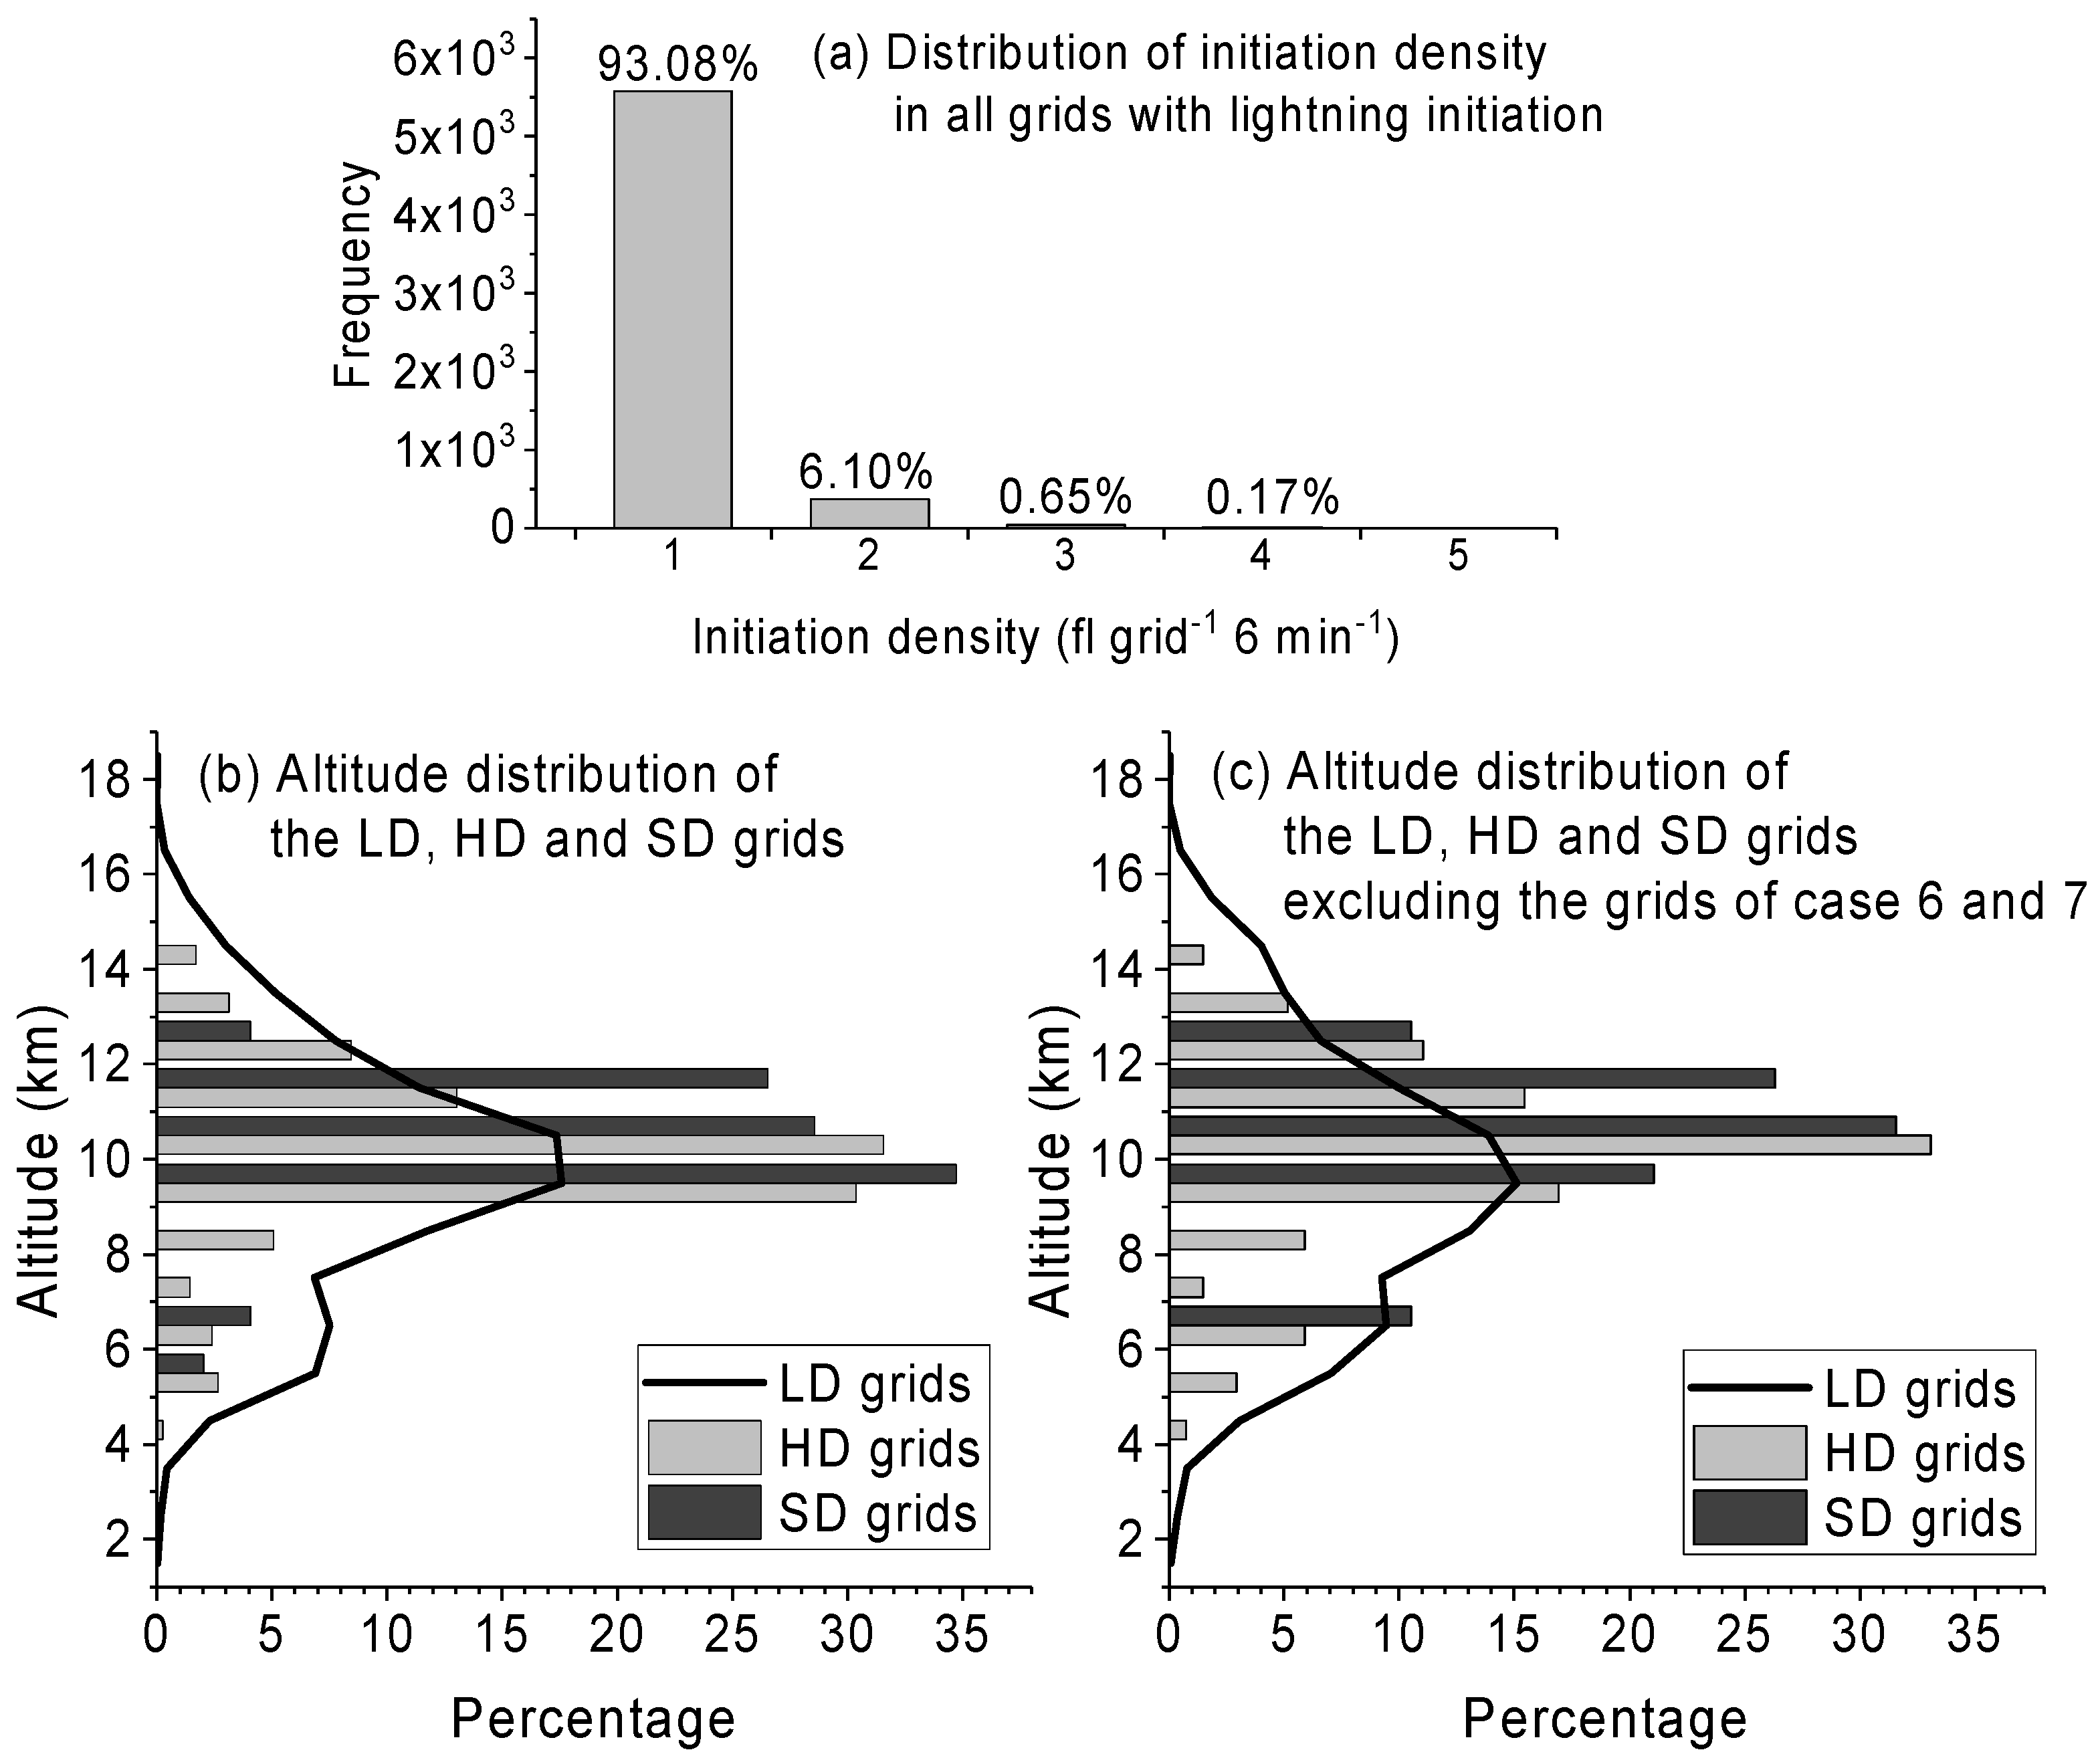
In the convective grids, the maximum value of the initiation density was found to be four flashes grid−1 6 min−1. The mean initiation density was found to be ~1.1 flashes grid−1 6 min−1. The frequency distribution of the convective grids (Figure 2a) shows that most of the grids (~93.08%) had an initiation density of only one flash grid−1 6 min−1. This means that in most of the regions of 1 km × 1 km × 0.5 km, a lightning flash could only be initiated once every 6 min. The initiation density in ~6.10% of the grids reached two flashes grid−1 6 min−1, and it reached more than two flashes grid−1 6 min−1 in ~0.82% of the grids.
In the HD grids, the maximum and minimum values of the timespans between adjacent initiations were about 341.9 s and 4.9 s, respectively, with an average value of 70.8 ± 63.6 s. This means that even in a convective region, in which charges can be replenished by strong electrification, the next flash in the same finite volume is usually initiated several to more than 100 s after the initiation of the last flash.
The distributions of the LD, HD and SD grids in the 14 MCSs show a similar trend (Table 1). The LD grids represent the majority in every MCS, as expected. The percentage of HD grids in all convective grids with lightning initiation in an MCS varies in the range 0 to ~16.7% with a mean percentage of ~5.2%. SD grids were found in only six MCSs, and the percentages of the SD grids in these MCSs varied in the range 0.3–3.0%, with a mean value of ~1.1%.
Figure 2b shows that the altitude distributions of the LD and HD grids are also similar. The majority (more than 58.1%) of LD grids were found distributed in the altitude range 8–12 km (−15.1 to −44.7 °C), with a peak value of ~17.6% in the bin for 9–10 km (−21.9 to −29.0 °C). The HD grids were mainly found distributed in the altitude range 9–12 km (−21.9 to −44.7 °C) (accounting for ~74.9%) with a peak value (~31.6%) in the range 10–11 km (−29.0 to −36.4 °C). The SD grids were more concentrated in this altitude range. A total of ~89.9% of the SD grids are distributed in the altitude range 9–12 km, with a peak value of ~34.7% found in the altitude range 9–10 km, which is slightly lower than the center bin for the HD grids. Moreover, it seems that there was a sub-peak range at a lower level (5–7 km; 1.2 to −9.3 °C) for the LD, HD, and SD grids. The LD, HD, and SD grids in the lower altitude distribution range accounted for ~14.1%, ~5.1%, and ~6.1%, respectively.
Table 1 shows that the HD and SD grids from Cases 6 and 7 constitute a large proportion of the total. To consider the impact of data from these two cases, we also analyzed the data when these cases were excluded (Figure 2c). After the grids from Cases 6 and 7 were excluded, the altitude distributions of the LD, HD, and SD grids showed a similar trend, as can be seen in Figure 2b. The differences were mainly reflected in two aspects: (1) the distribution centers of the HD and SD grids were slightly increased in altitude. The percentages of the HD and SD grids within 9–10 km (−21.9 to −29.0 °C) decreased, while the percentages above 11 km (−36.4 °C) increased; (2) the percentages of the LD, HD and SD grids in the lower distribution range all increased. Although some distribution values in Figure 2c changed, the overall distribution trend remained similar to that in Figure 2b. The similar distributions shown in Figure 2b,c indicate that the distribution characteristics of the LD, HD, and SD grids are real, and should not be influenced by a few individual cases. That is to say that the main LD, HD, and SD grids formed within the altitude range of 9–12 km (−21.9 to −44.7 °C). Additionally, the lower altitude range of 5 to 7 km (1.2 to −9.3 °C) was also relatively concentrated.
A bootstrap statistical method was applied to evaluate the stability of the statistical results derived for the limited number of HD and SD grids considered in this study. The 1000 bootstrap data samples were separately drawn from each of the HD and SD grids. The statistical results show that the distributions of the mean altitudes of the samples for both HD and SD grids were all normal, and the samples were highly concentrated. The mean values of the mean altitudes for the HD and SD grids were 10.22 ± 0.08 km and 10.11 ± 0.19 km, respectively. All the mean values of the samples for the HD and SD grid altitudes were found within the ranges 9.96–10.44 km and 9.46–10.78 km, respectively. Most (99.7% for the HD grids and 71.7% for the SD grids) of the mean values of altitude statistical results were found within a narrow altitude range of 10–11 km. These statistical results for the altitude distributions of the HD and SD grids show that our conclusions based on our limited data should be stable. This also implies that the distribution characteristics shown in Figure 2b may represent a real distribution trend, although the case numbers of HD and SD grids used in this analysis are limited. In the future, as more data accumulate, the characteristics of the dual-center regional distribution should not be substantially altered, although there may be some changes in specific values, such as the center value or regional shape.
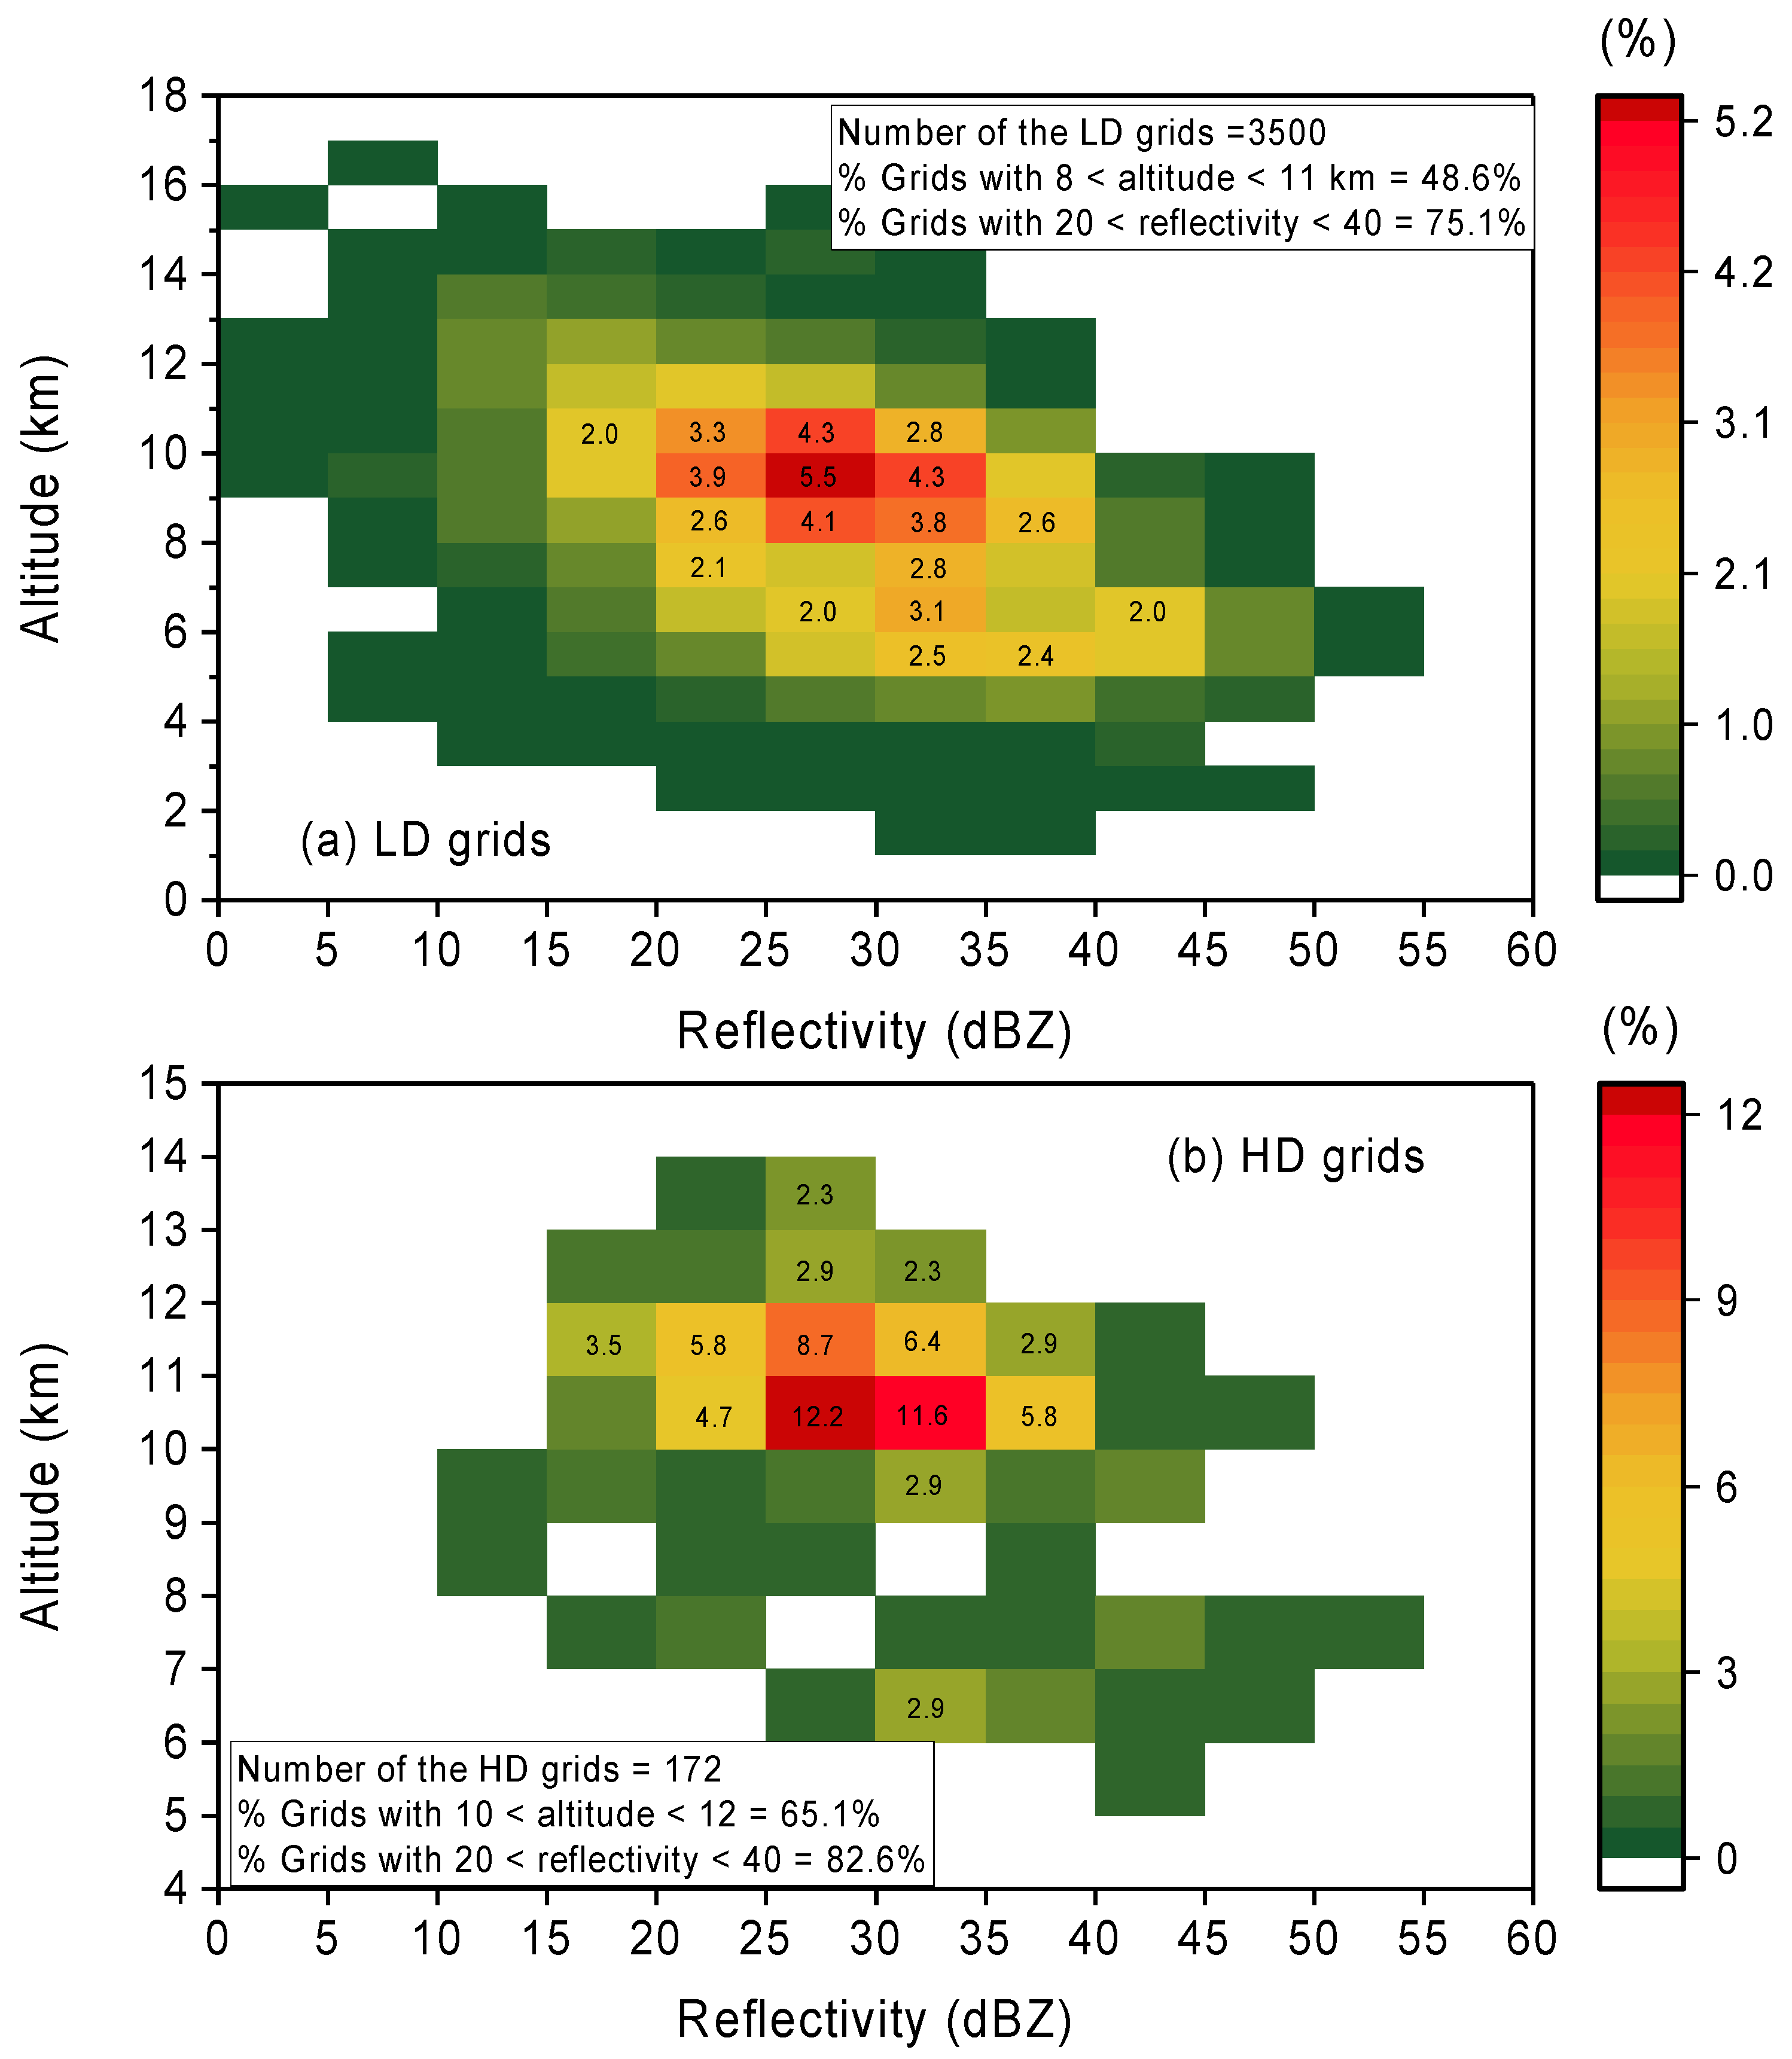
As mentioned in Section 2.2, only the data for lightning flashes and reflectivity within 20–150 km of the radar site were used for analysis to avoid the negative impact of the blind zone. This was appropriate for our previous studies on stratiform lightning flashes because the altitudes of the cloud tops in most stratiform regions are not very high. However, because our observation domain is close to the radar site (Figure 1), a convective cell in the observation domain may be missed in its upper part by the radar, because the maximum elevation of the radar beam is only 19.5° if the convective cell is close to the radar site and has developed to a very high altitude. This leads to some grids, including the LD, HD, and SD grids, forming at a high altitude without any detected reflectivity. Therefore, only the LD, HD, and SD grids located below the maximum elevation of the radar beam have been collected for further analyses of the reflectivity distributions in these grids. This means that the numbers of LD (3500), HD (172), and SD (17) grids that can be used for analysis of reflectivity distribution are smaller than the true total number of LD, HD, and SD grids. This is also the main reason why some grids showing lightning initiation were located in positions with a very high altitude but very low reflectivity, as shown in Figure 2 of Wang et al. [6].
Based on the grids below the maximum elevation of the radar beam, 2D histograms of the LD and HD grids relative to radar reflectivity and altitude are exhibited (Figure 3). Because there were too few SD grids with effective reflectivity data, the SD grids are not analyzed individually here. The results show that the LD grids were mainly located in the area of 5–11 km and 15–45 dBZ (Figure 3a). This is similar to the results (7–11 km and 15–40 dBZ) given by Mecikalski and Carey [5] for MCSs in terms of altitude and reflectivity ranges, although the center bin in Figure 3a is located in a bin with a slightly higher altitude and reflectivity. Fuchs and Rutledge [7] also gave similar distributions of reflectivity and altitude based on 3D location data from VHF radiation sources combined with Doppler radar from normal isolated storms in Alabama, Washington DC, and Oklahoma. In Figure 3a of Mecikalski and Carey [5], a weaker center can be vaguely seen in the lower altitude range of 4–7 km. In the distribution of LD grids (Figure 3a), the lower distribution center is clearer. The reflectivity range for this lower distribution region is within 25–45 dBZ, which is slightly higher than that (15–40 dBZ) for the main distribution region.
The main distribution region of the HD grids was found to be the same as that of the LD grids in terms of the reflectivity range and reflectivity of the center bin (Figure 3b). However, the altitude range of the main distribution region for the HD grids is 9–12 km (−21.9 to −44.7 °C), and the center bin is located at an altitude of 10–11 km (−29.0 to −36.4 °C). These values are all higher than those for the LD grids. Simultaneously, the lower distribution region for the HD grids is not as clear as that of the LD grids. Only in one bin of 6–7 km (−4.0 to −9.3 °C) with a reflectivity of 30–35 dBZ did the percentage exceed 2%. This may suggest that the HD grids tend to be formed in a higher altitude range than the LD grids, but in almost the same reflectivity range.
To investigate the stability of the statistical results on the reflectivity distribution of the HD grids, a bootstrap statistical method was also used, based on the same setting parameters. The results show that the distribution of the mean reflectivities of the samples conform to a normal distribution. The mean values of the mean reflectivities change between 28.0 and 31.2 dBZ, with a mean value of these mean values of 29.7 ± 0.5 dBZ. These results indicate that, although the total number of HD grids with valid reflectivity is small, the statistical results based on these finite grids are still stable.
4. Case Study
Case 7 in Table 1 shows an MCS with a maximum horizontal diameter of more than 200 km, as shown in Figure 6b of Wang et al. [17]. Some parts of the main body of this MCS passed through our observation domain when the lightning activity in these parts was active. As a result, there were more observed lightning flashes in this storm than in other storms in all 14 MCSs. Moreover, for the reason mentioned in Wang et al. [6], the lightning flashes in all 14 MCSs occurred mainly during the dissipation stage. Case 7 is the only one with sufficient lightning flashes across a relatively complete lifetime for analysis. Moreover, the radar observations show that the MCS of Case 7 had reflectivity characteristics of a typical MCS, with a front convective line and a trailing stratiform region, the dynamical and precipitation structures of which have been proposed many times in the past [32,36,52]. Therefore, we conducted a more in-depth analysis of this storm to provide a better understanding of the spatial–temporal distribution characteristics of the HD and SD grids.
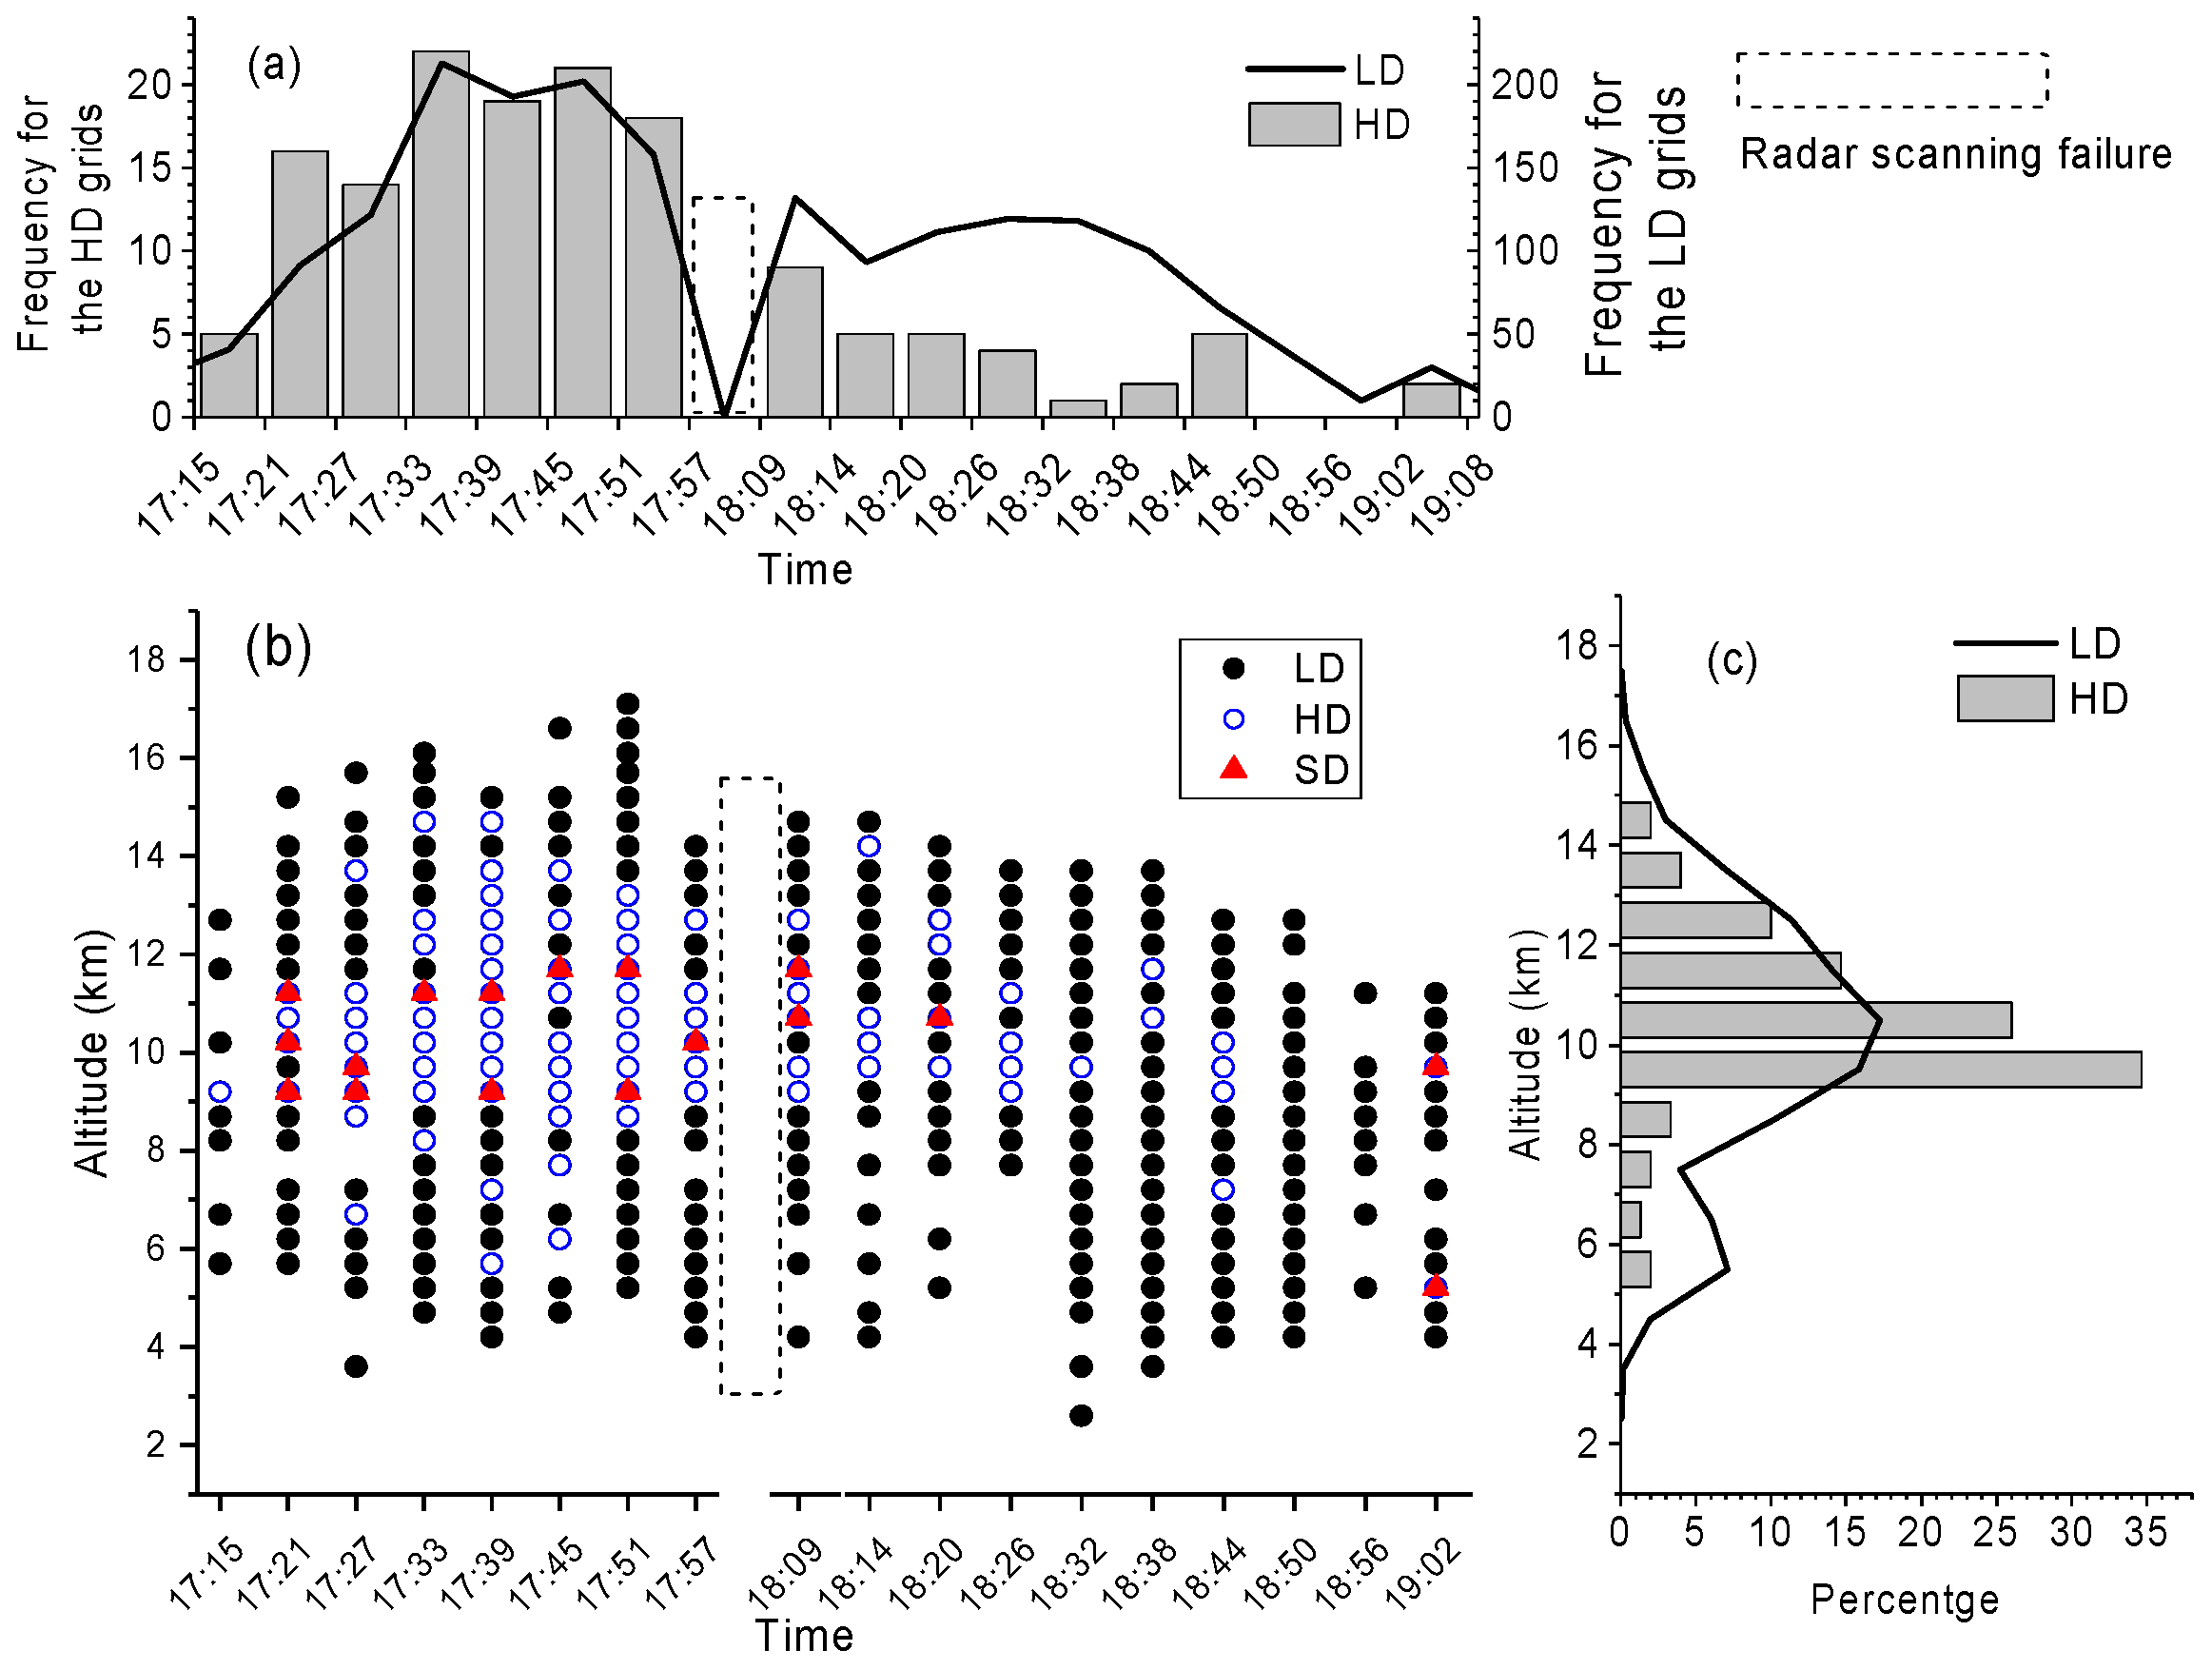
The frequency evolution of the HD grids in Case 7 reveals a similar trend to that of the LD grids, but while the HD and LD frequencies are similar from 17:15 to 17:51, the later LD peak is more pronounced than the HD peak (Figure 4a). The frequencies of the LD and HD grids gradually increase until they reach their peaks (213 grids 6 min−1 for the LD grids and 22 grids 6 min−1 for the HD grids) within the time bin of 17:33–17:39 CST; then they decrease gradually. Note that the zero value within the period 17:57–18:09 CST does not mean there were no lightning flashes during this volume scanning time, but rather that there was a period of missing radar data due to radar failure (the time span without radar data is shown using the dotted box in Figure 4a,b). Since there are no radar data, it is impossible to determine whether a lightning flash was initiated in the MCS or not. Therefore, the lightning flash data during this radar scanning period were not included in the analysis. Thus, no grid can be marked within this period in Figure 4a,b. In addition, because the total number of the SD grids during the statistical period is too small (21 SD grids) to make statistics, the SD grids are only marked in Figure 4b, but are not taken into account in the frequency and altitude analyses.
The LD grids showed the largest altitude range, from 2.6 km to 17.1 km (Figure 4b). More than 68.8% of the LD grids were assembled in the altitude range of 8–13 km, with a peak (~17.3%) in the altitude bin 10–11 km (Figure 4c). These were approximately coincident with the distribution characteristics shown in Figure 3a. Most of the time, the LD grids were distributed in a vertical range with a thickness of nearly 10 km, while the distribution center showed a slight decrease with declining frequency (Figure 4b). In the last period, the vertical distribution range of the LD grids shrank, and the distribution center declined to nearly 7 km. The drop in the altitudes of the centers of LD grids in the last period, which are superimposed upon the previous LD grids formed in the lower-altitude range, may have given rise to the sub-peak between 5 and 7 km seen in Figure 4c.
Compared to the altitude distribution of the LD grids, the HD grids tended to be distributed in a relatively higher altitude range. More than 85.3% of the HD grids were located between 9 and 13 km, with a peak of ~34.7% in the bin 9–10 km (Figure 4c). The evolution of the altitude distribution ranges of the HD grids shows that in the period of increase in HD grid frequency, the altitude distribution ranges of the HD grids were wider than those in the period of decrease (Figure 4b). The thickness of the vertical distribution range of the HD grids in the period of increase reached the maximum value of 9 km, with the lowest boundary at the altitude of 5.7 km in the time bin of 17:33–17:39 CST when the HD grid frequency reached its peak. Subsequently, the lower boundary of the distribution range increased to more than 9 km after two radar scanning times. After that, the lower boundary remained above 9 km for about 53 min before it declined again.
A similar distribution and trend can also be seen in the evolution of the altitude of the SD grids, although the total number of SD grids is evidently smaller than the total number of HD grids. Most SD grids were formed when LD and HD grids were frequently formed, and these SD grids were all located within the relatively narrow altitude range of 9–12 km (Figure 4b). When the frequencies of the LD and HD grids were further reduced, the SD grid disappeared for about 36 min. However, in a short period (one radar scanning time), in which the LD and HD grid frequencies all declined to low values (19:02–19:08 CST), two SD grids, one in the main distribution range above 9 km and another in a low altitude (~5.2 km) near the melting level, appeared briefly.
The maximum value of the initiation density in these SD grids reached four flashes grid−1 6 min−1, but only four SD grids reached this maximum value. Two of these SD grids with the maximum initiation density were formed at the same scanning time (17:27 CST) in two adjacent altitude bins (9.2 and 9.7 km). The next was formed two radar scans later (17:39 CST), at a similar altitude (9.2 km). Subsequently, no SD grid reached the maximum initiation density until the last period in which the SD grids were seen (19:02 CST) at a similar altitude (9.7 km). These results indicate that, although the arising of the SD grids was sparse, they tended to appear within a stable and relatively narrow altitude range, especially for those SD grids with higher initiation densities.
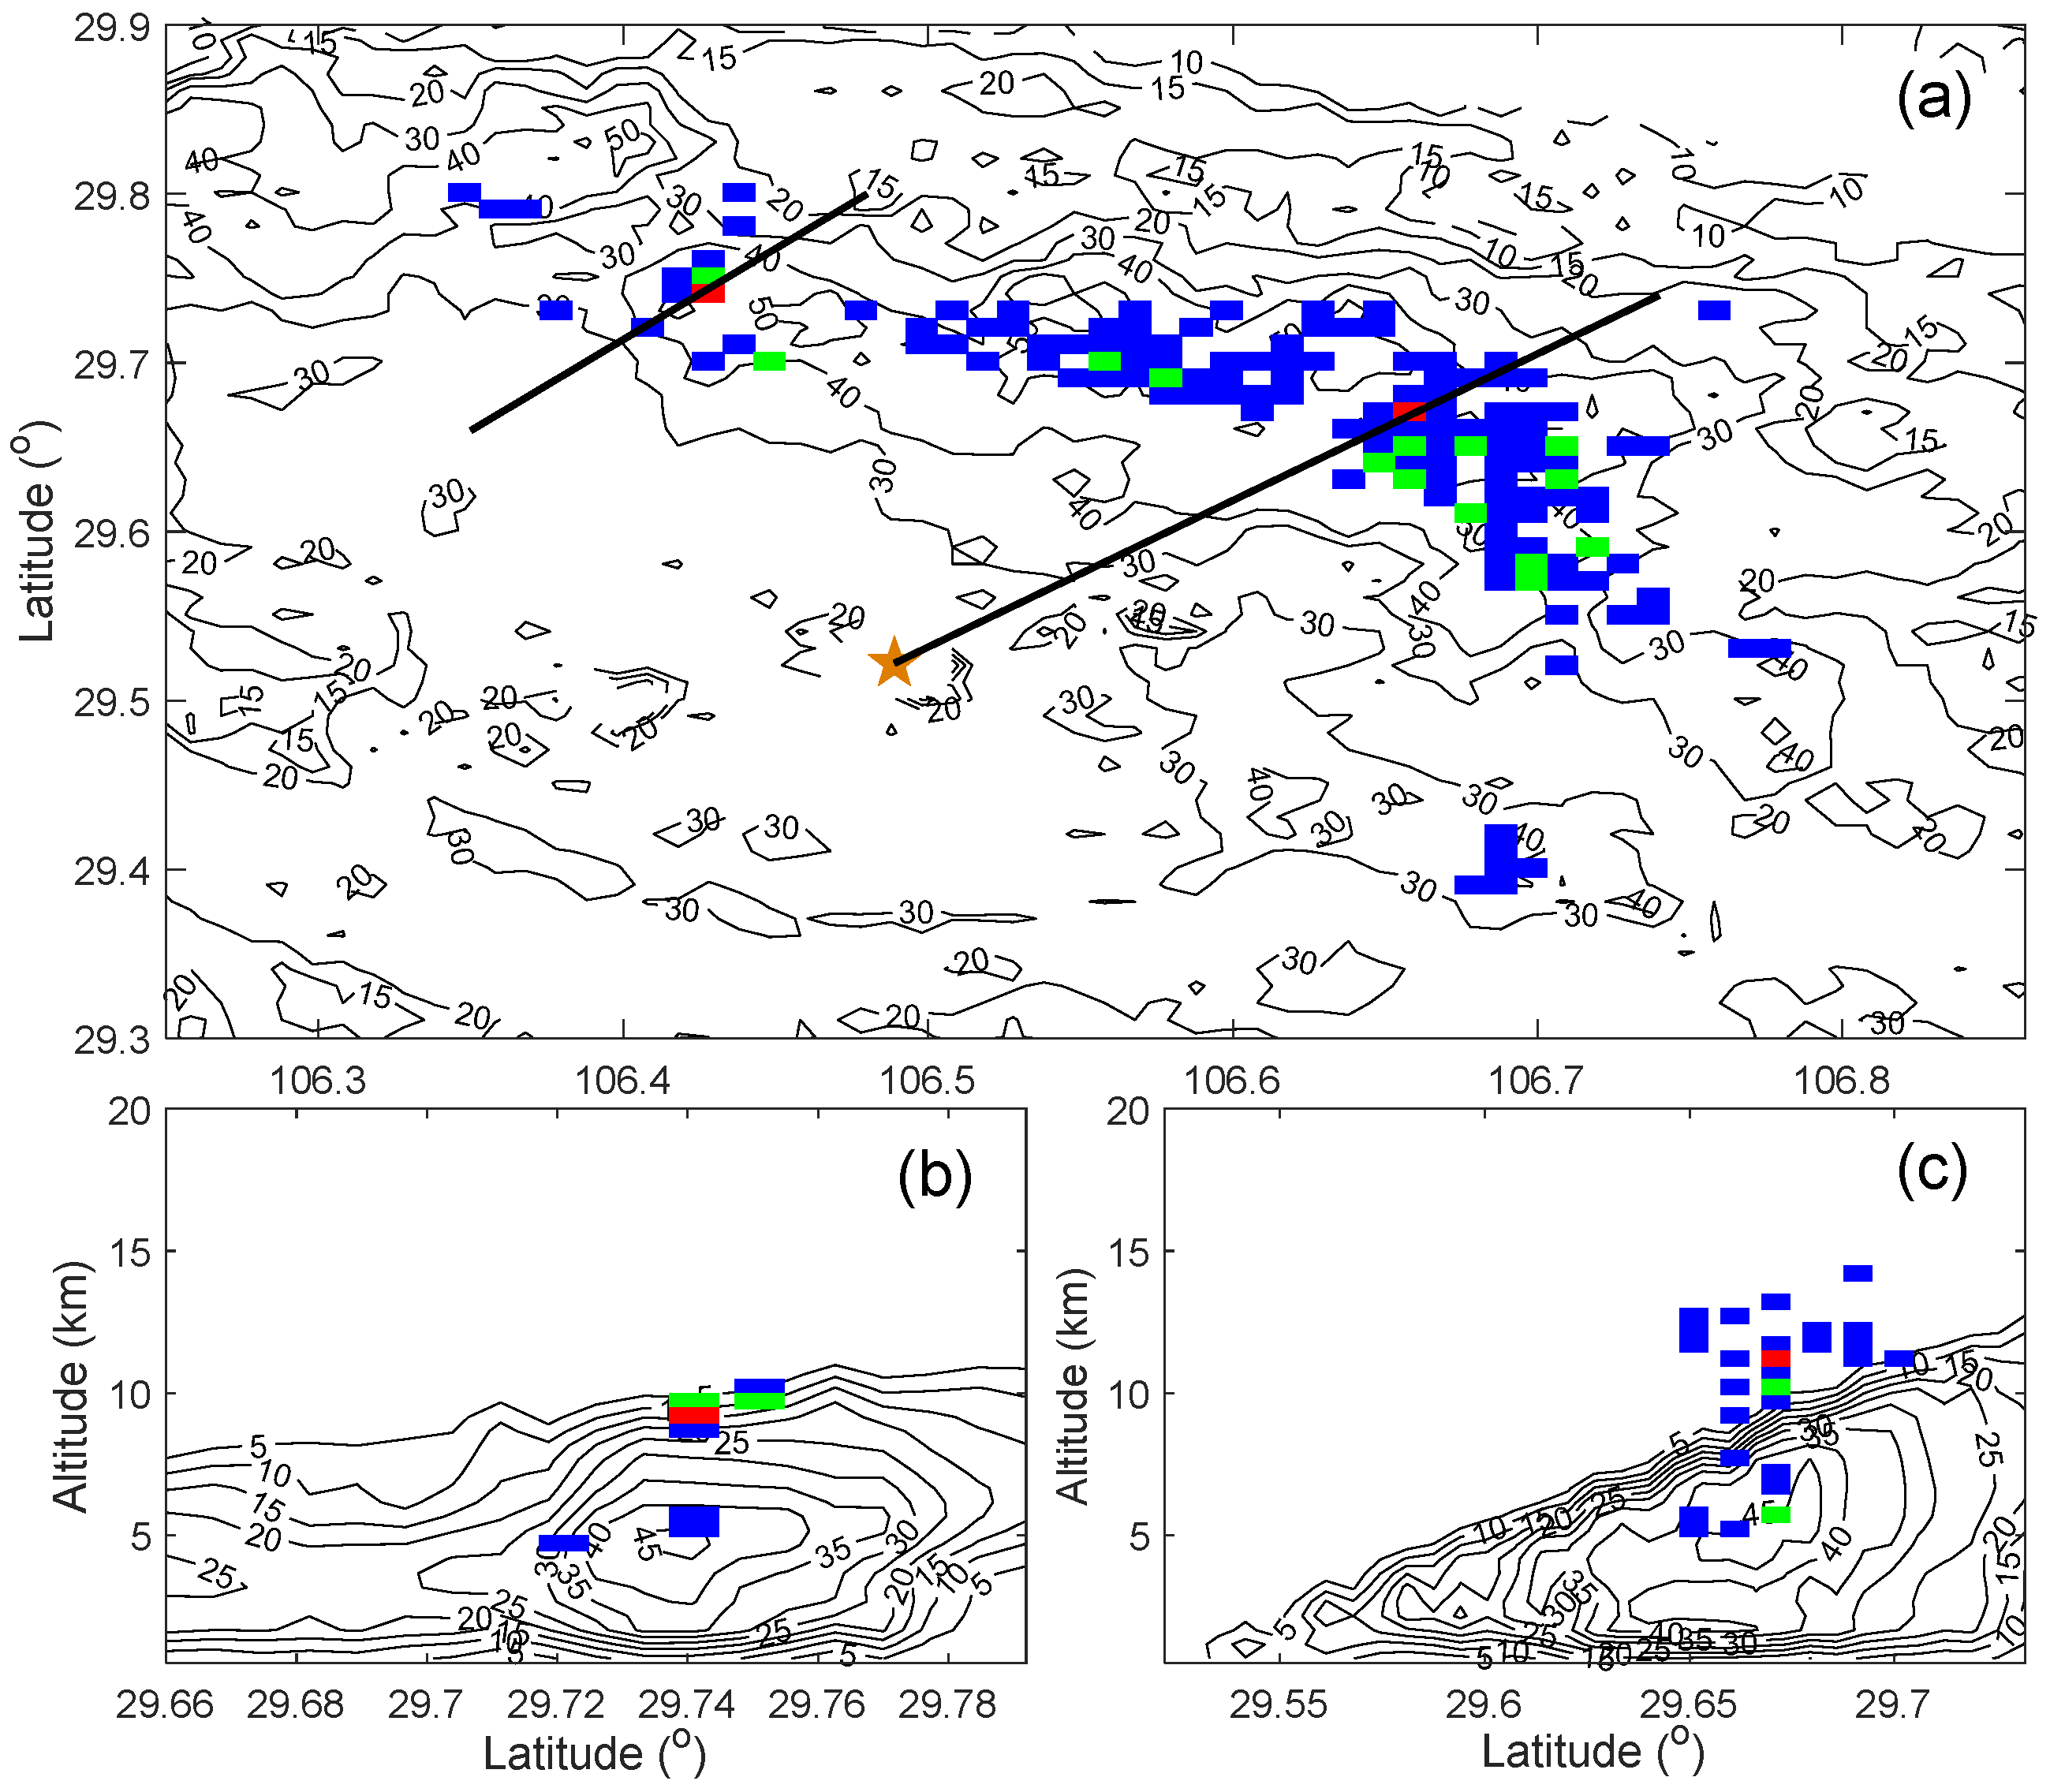
In the time bin of 17:33–17:39 CST, the frequencies of the LD and HD grids both reached their peaks. Moreover, two SD grids, one with the maximum initiation density of four flashes grid−1 6 min−1, were formed at the scanning time of 17:39 CST. Figure 5a shows the horizontal distributions of the LD, HD, and SD grids overlapping the composite reflectivity. Obviously, the LD and HD grids in the right-hand part of the system were more numerous and denser than those in the left-hand part. A comparison of the profiles in the right-hand and left-hand parts (with the SD grids) of the system demonstrates that the cells in the right-hand part may be more robust. Although the reflectivity above ~9 km near the SD grid in Figure 5c was missed because of the limitation of the maximum elevation of the radar beam (those cells displaying lightning initiation were just outside the 20 km radius to the radar site), the distributions of the detected reflectivity show that the cell on the left reached a peak of 45 dBZ near 5 km, and the 45 dBZ echo peak in Figure 5c was about 7.0 km. Moreover, the altitude distribution of lightning initiation also demonstrates that the convection of the right-hand cell should have been stronger than that in the left-hand cell, because the maximum value of lightning initiation altitude in the right-hand cell reached about 14 km, but the maximum initiation altitude in the left-hand cell was only about 10 km. The results seem to show that regions where lightning flashes were initiated at a high density tended to be located at similar altitude levels.
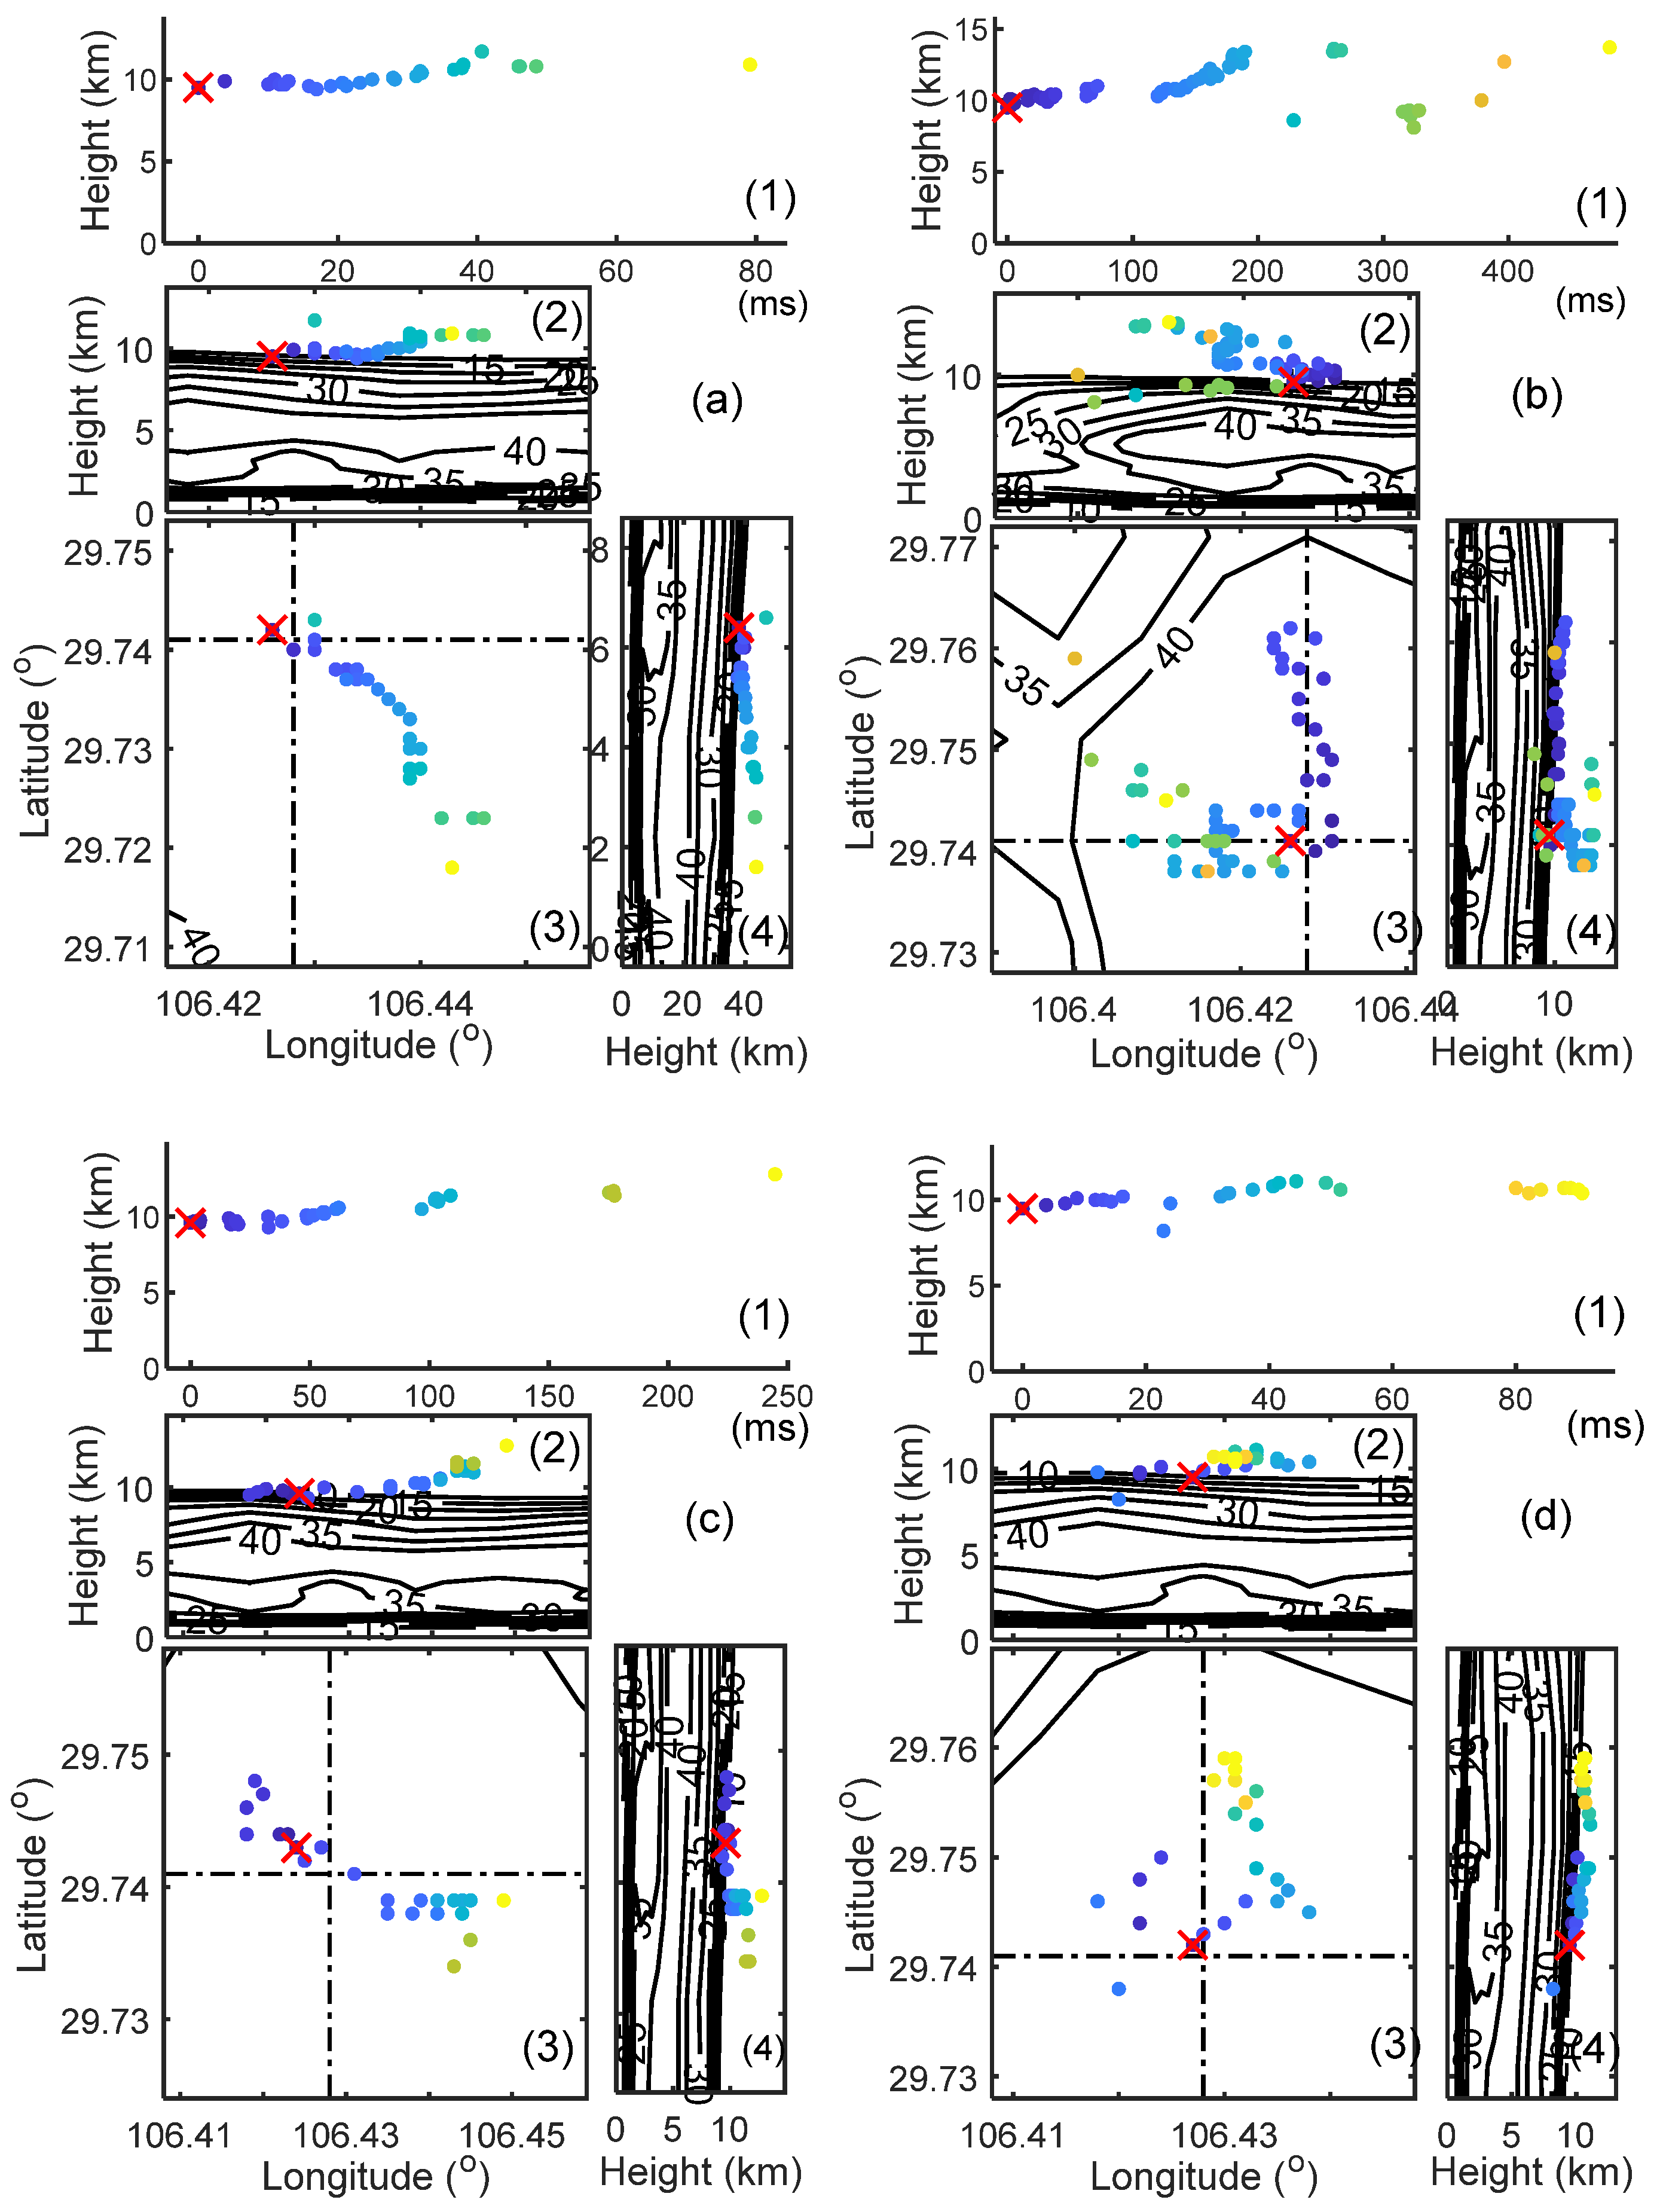
One of the SD grids shown in the left-hand cell of Figure 5a,b was located at 9.2 km, and had an initiation density of four flashes grid−1 6 min−1. Another SD grid in the right-hand cell appeared at 11.2 km with an initiation density of three flashes grid−1 6 min−1. The channels of the flashes initiated in the SD grid on the left, which had a higher initiation density, are illustrated in Figure 6. Regrettably, due to the limitation of the maximum elevation of the radar beam, the reflectivity in many parts of these lightning channels was missed. The maximum and minimum differences between the initiation times of the four flashes were ~36.883 and ~20.291 s, respectively, with a mean value of ~30.44 s. The maximum differences in longitude and latitude of their initiation positions were 0.003° and 0.002°, respectively. According to the distribution of the channels (Figure 6), it is obvious that these lightning channels (dominated by negative leaders) did not follow the same path. This suggests that these flashes were more likely to have developed independently, and the later channel development may not have been directly affected by the earlier channel development, although these flashes were initiated and propagated within almost the same volume area during a short period.
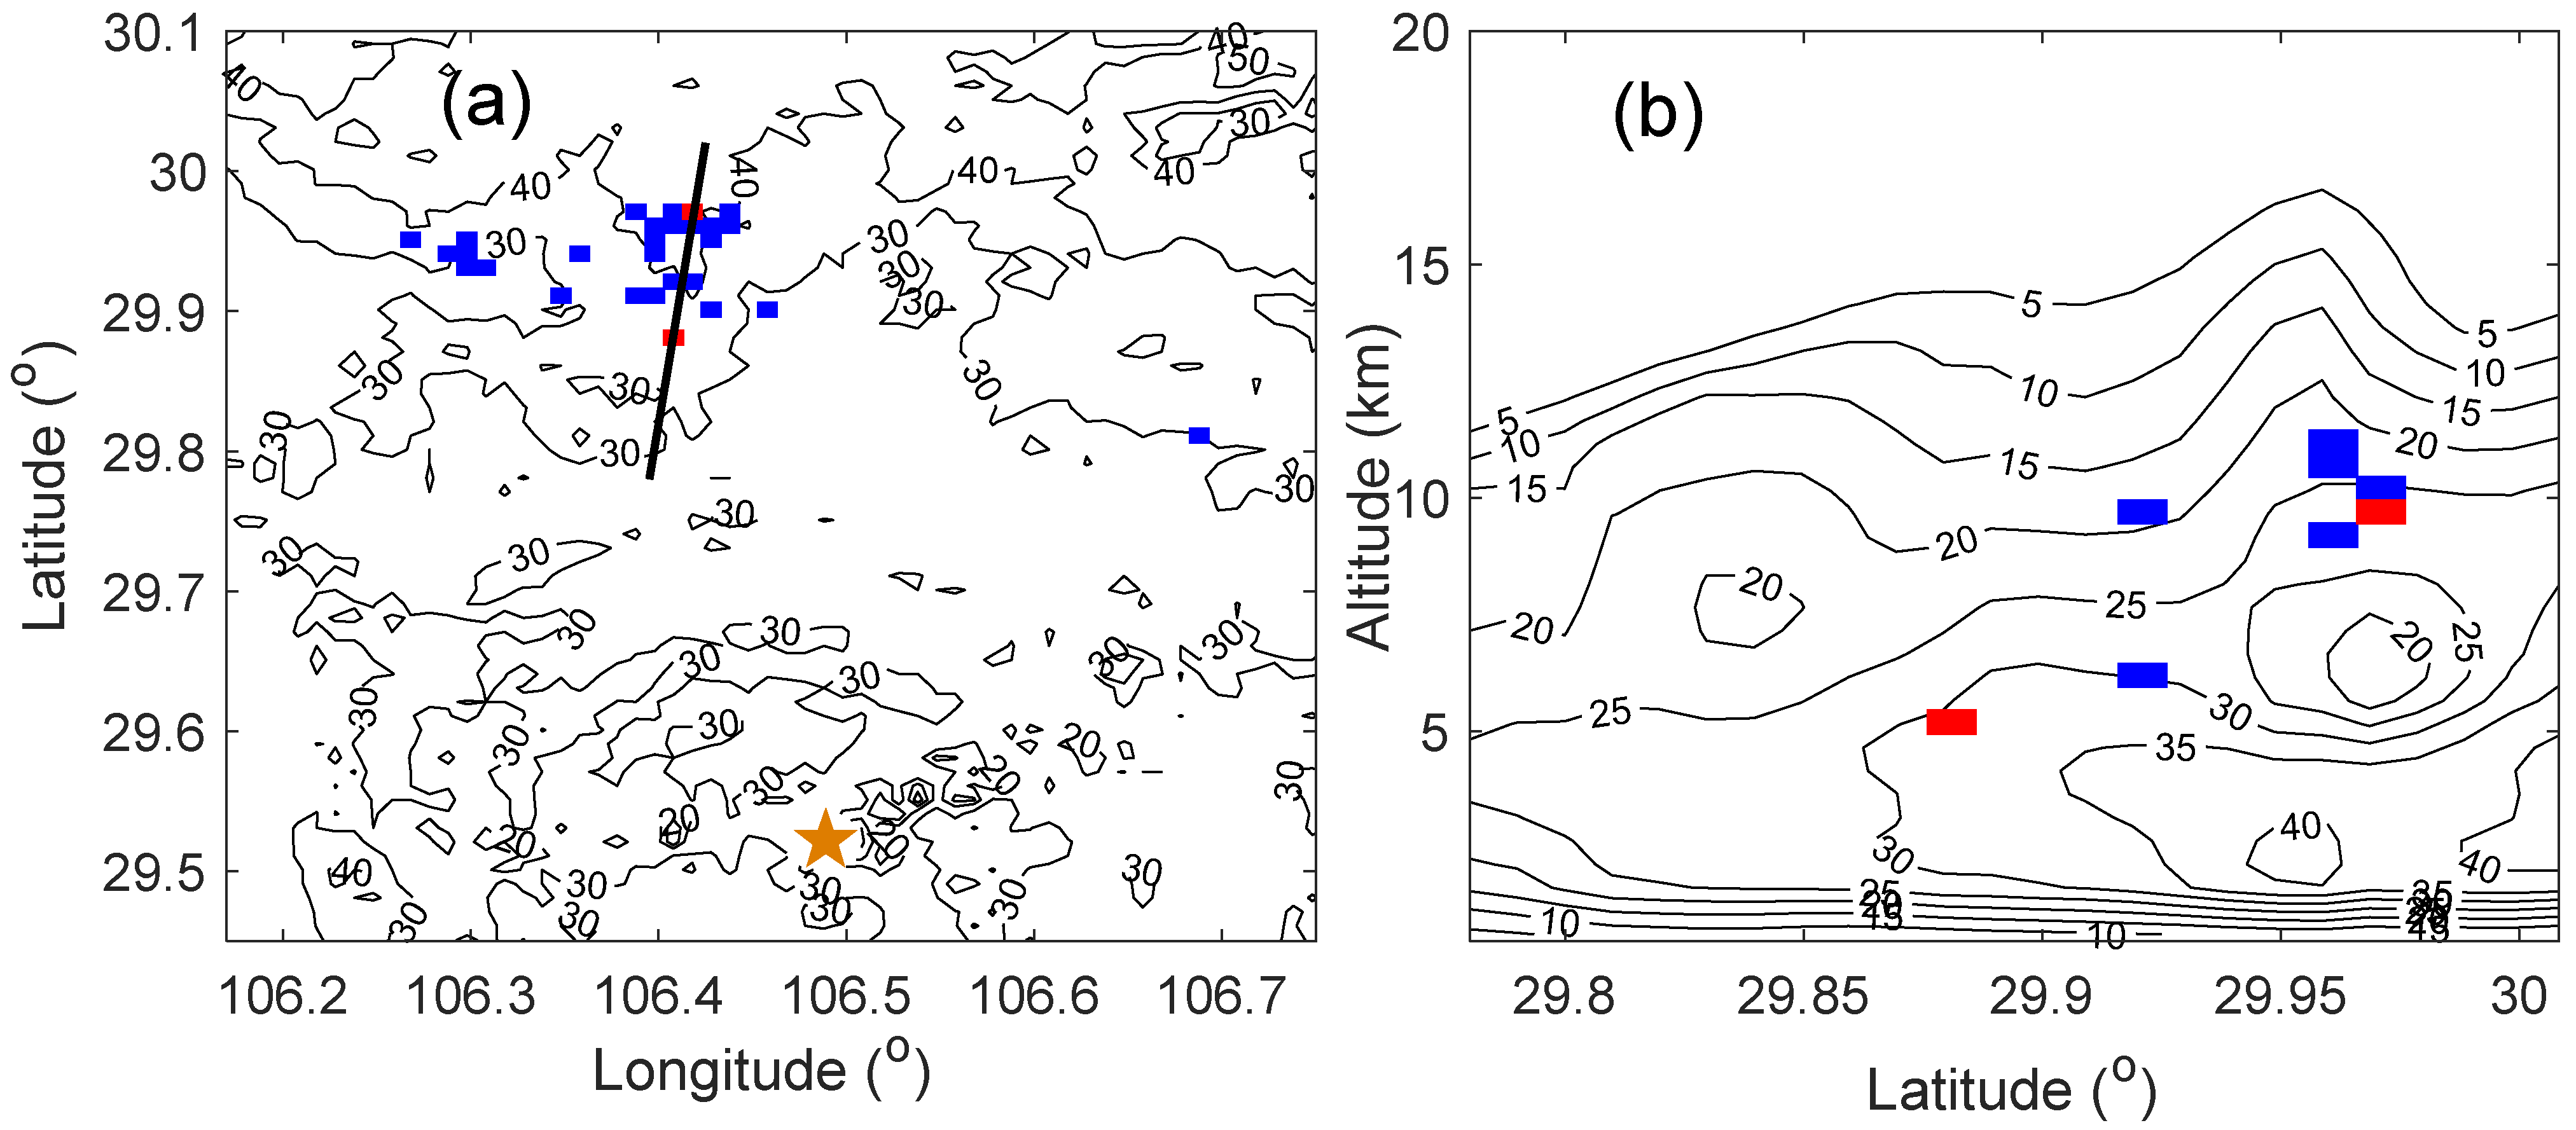
In the last scanning period for the SD grids (19:02 CST), only two SD grids were found at two different altitude levels (Figure 7). One (9.7 km) was in the normal altitude range, in which many previous SD grids have been found, and another (5.2 km) was the only SD grid at an obviously lower altitude than the normal SD grids (Figure 7b). The vertical section of reflectivity shows that the main reflectivity core (>40 dBZ) was at a much lower altitude (about 2 km) than those seen in Figure 5b,c. These results indicate that the updraft in the system was evidently weakened.
The higher SD grid was formed within a similar altitude range to the previous SD grids, and was almost above the reflectivity core (Figure 7b), which was also the case in the HD and SD grids seen in Figure 5b,c. This suggests that this SD grid may have been formed under similar environmental conditions to those under which many previous SD grids were formed. However, the lower SD grid, near the melting level, was located near the upper boundary of the 30 dBZ contour, and was clearly on the side of the reflectivity core rather than above it. This implies that there may have been some differences in the formation of this lower SD grid.
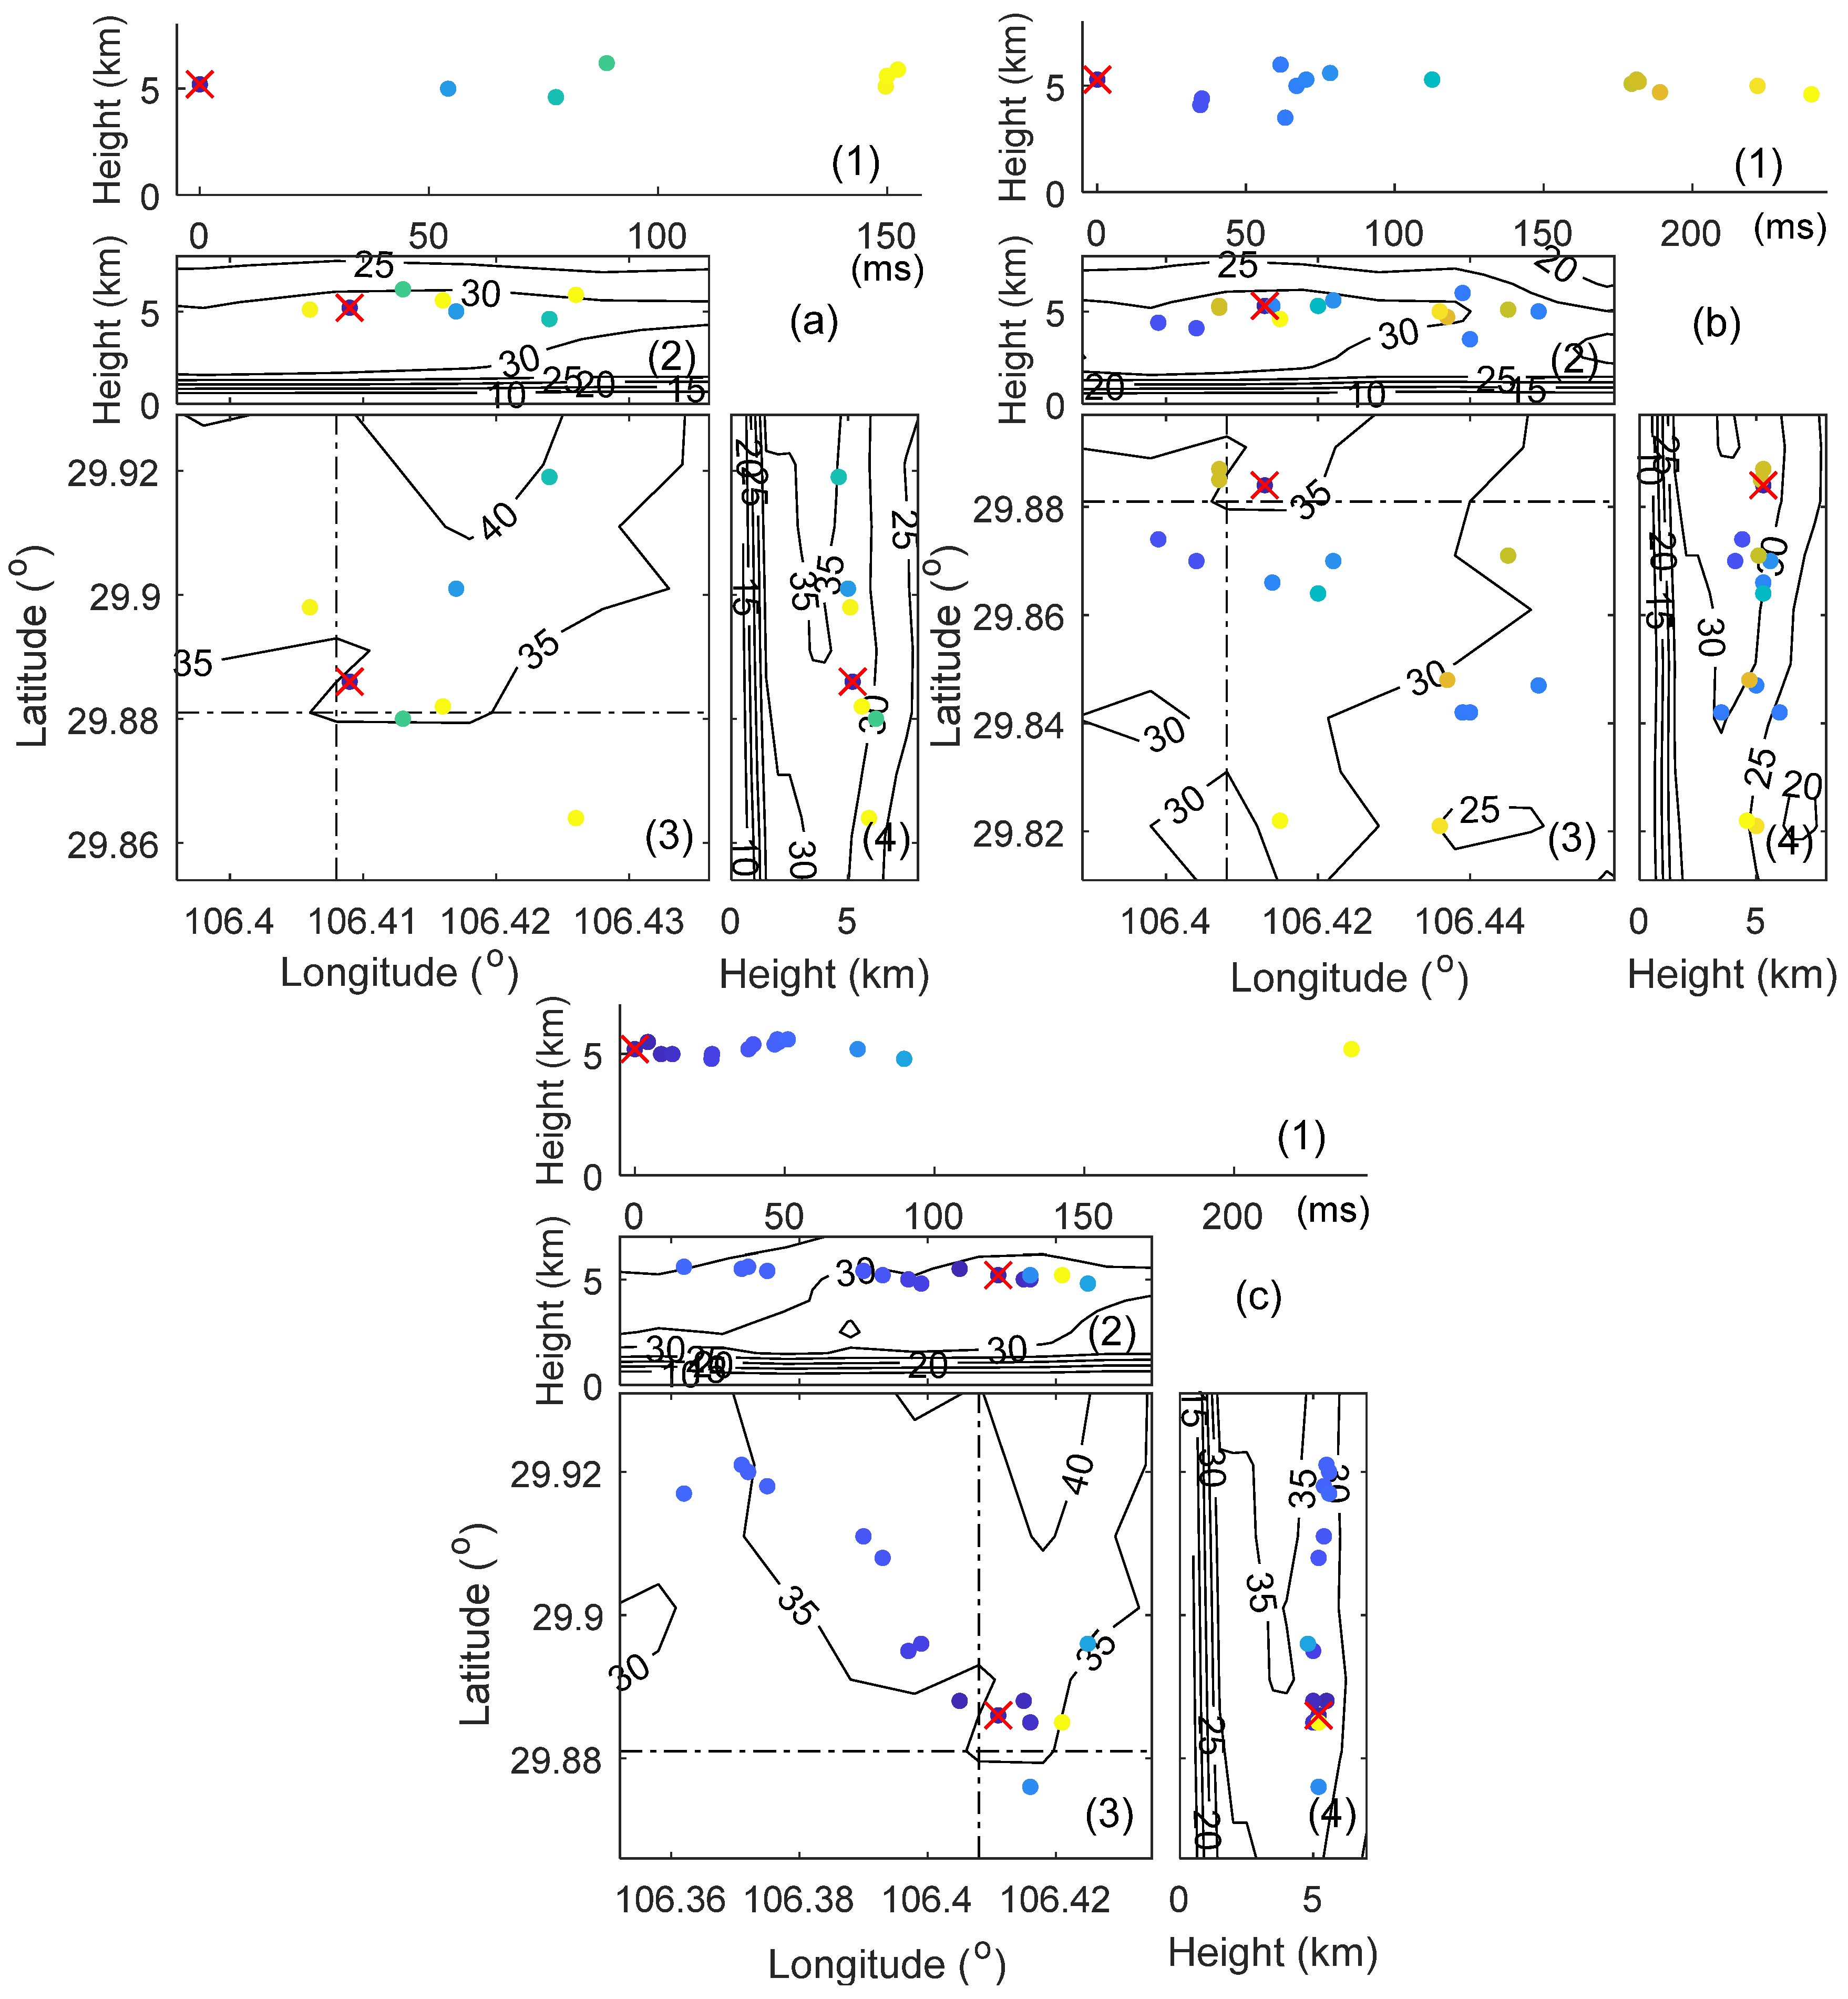
The distributions of the VHF radiation sources of the three flashes initiated in the lower SD grid in Figure 7 show that the channels of these flashes had different morphologies, with different development directions (Figure 8). The differences between the initiation times were about 43.68 and 40.137 s, respectively. These time differences are larger than those displayed by the flashes initiated in the higher SD grid shown in Figure 6. The reflectivity distributions in the vertical sections of these flashes show that the initiations were all located near the upper boundary of the 30 dBZ contour. Moreover, the upper boundaries of 30 dBZ in these vertical sections were near 5 km, which is lower than the upper boundary of 40 dBZ in the vertical sections shown in Figure 6. This indicates that an environment causing a high rate of flashes at lower altitudes should display a weaker updraft.
5. Discussion
Our analysis results indicate that HD grids, especially SD grids, tend to be formed in a stable temperature range (−29.0 to −44.7 °C), and this range seems to be colder than the main temperature range (0 to −30 °C) of non-inductive electrification [39,53,54,55]. Many previous observations found that the strong updraft present in the mixed phase zone is important for the production of lightning [56,57,58,59,60,61,62,63,64,65,66]. Furthermore, the simulation study indicated that the main electrification processes usually occur within regions with a consistent, instead of necessarily a very strong, updraft [67]. Updraft in a region with highly efficient non-inductive electrification will bring the charged hydrometeors into a colder temperature range after they have been charged. Subsequently, it is easy for these charged hydrometeors to be separated and form net charge layers more quickly in a colder temperature range. As long as the updraft can be maintained, the strong electrification can continuously produce and transport charges to these higher-net charge layers. Therefore, the strong electric field between these charge layers is also maintained. This may eventually lead to the intensive initiation of lightning in the colder temperature range shown here.
Although most of the SD grids were located in the colder temperature range, one SD grid was found in a warm range close to the melting level. This SD grid formed when the LD and HD grid frequencies declined. What leads to the emergence of such a distinctive SD grid? We make the following assumption. The reduction in LD and HD grid frequencies may suggest that the updraft in the MCS was weakened at that time. On one hand, the weakened updraft will impair the strength of non-inductive electrification. This results in a much lower number of SD grids at that time. On the other hand, the weakened updraft may also cause the center of the non-inductive electrification to enter a warmer temperature range just above the melting level. This may reduce the altitude of the SD grid. Moreover, because the updraft has been weakened, the horizontal motion of the ice particles, especially the small ice particles, will increase during their electrification processes. This may lead to an increase in the horizontal distance over which small charged ice particles separate from large charged ice particles, forming a total net charge structure in this lower level. This may result in a horizontal shift of the only SD grid in the lower level relative to the reflectivity core.
Additionally, according to previous studies on non-inductive electrification, the fact of this electrification process occurring in a warmer environment close to the melting level will charge the ice particles with a polarity opposite to that obtained in colder environments [39,53,54,55]. This should be clearly observable through a comparison of the charge structures initiating lightning flashes in the main altitude range of the SD grids with those in the lower altitude range. However, the low detection efficiency of positive breakdowns in our network prevents this work from being carried out. In the future, we will try to verify this hypothesis with more detailed lightning channel detection data.
6. Conclusions
To investigate the characteristics of the regions in which lightning flashes are frequently initiated, data from the first VHF radiation source detected with a 3D lightning location system in Chongqing, China, were analyzed together with radar data. The focus of this study is the formation environment of these regions in a storm. Through this study, we can learn more about high-density regions of flash initiation during a storm.
Of the convective regions of 14 MCSs observed during the summers of 2014 and 2015, 5996 convective radar grids showed lightning initiation. Among these convective grids, 415 showed a flash initiation density greater than one flash grid−1 6 min−1, and were classified as HD grids. This means that only in a very small proportion (about 6.9%) of the grids with lightning initiation can flashes be initiated multiple times within a short period (6 min here). Moreover, in only 49 of these HD grids, were the flash-initiation densities more than two flashes grid−1 6 min−1 (SD grids). All this suggests that the conditions required for frequent initiations of flashes are stringent. This results in very small proportions of HD and SD grids.
The LD (with initiation density 1 flash grid−1 6 min−1) and HD grids, including SD grids, showed similar trends in altitude distribution. These were mainly distributed in the altitude range of 9 to 12 km (−21.9 to −44.7 °C). The distribution of reflectivity relative to altitude for the HD and LD grids was also analyzed, although the number (172 grids) of HD grids with radar observation data was limited. The results show that the distribution of HD grids in terms of reflectivity relative to altitude is similar to that of LD grids. The similar distribution of the HD and LD grids in terms of reflectivity and altitude implies that the characteristics of the HD grids shown here may be real, although the characteristics were obtained from a limited number of datasets. However, it seems that the HD grids were mainly distributed within a higher altitude range (10–12 km; −29.0 to −44.7 °C) than the main altitude distribution range of the LD grids (9–11 km; −21.9 to −36.4 °C). The results mentioned above indicate that for most MCSs, lightning flashes occur frequently in this stable range. Additionally, more HD (82.6%) grids were concentrated in the reflectivity range of 20–40 dBZ than LD grids (75.1%).
A further analysis was carried out on a storm, some of which was observed to pass through our observation domain on 7 August 2015, and frequent lightning activity was detected during this period. The results show that the frequency evolution of the HD grids was also similar to that of the LD grids. Most of the HD and LD grids were concentrated in the same altitude range, from 9 km to 13 km. Moreover, the higher the flash initiation densities of the grids, the higher the percentage of these grids in this altitude range. The proportions of the LD, HD, and SD grids in this altitude range reached ~58.6%, 85.3%, and 95.2%, respectively.
The altitude distribution ranges of the HD grids when the frequency increased are wider than those measured when the frequency declined. The HD grids below 9 km mainly appeared when the frequency was increasing. However, the SD grids mostly formed stably in the altitude range of 9–12 km, except for one SD grid, located near 5 km in the last stage when the LD and HD grid frequencies were very low. The analysis combined with the radar data shows that the SD grids in the altitude range 9–12 km always formed just above a reflectivity core. However, the only SD grid in the lower level was clearly on the side of a reflectivity core. This may suggest that the charge layers forming the SD grids within the 9–12 km region will be different to those in the lower SD grid. A weaker updraft, which causes weaker electrification, and the relatively larger impact of the horizontal flow on the distribution of charged particles seem to play important roles in the formation of lower SD grids.
Author Contributions
Conceptualization, F.W. and Y.Z.; methodology, F.W.; software, X.D.; validation, H.L.; formal analysis, F.W.; data curation, W.D., W.Y.; writing—original draft preparation, F.W.; writing—review and editing, Y.Z.; funding acquisition, F.W., Y.Z. and W.D. All authors have read and agreed to the published version of the manuscript.
Funding
This research was funded by National Key Research and Development Program of China, grant number 2017YFC1501502, and National Natural Science Foundation of China, grant number 41675001, 41875001, and 41875005.
Informed Consent Statement
Informed consent was obtained from all subjects involved in the study.
Data Availability Statement
The data presented in this study are openly available in https://0-doi-org.brum.beds.ac.uk/10.5281/zenodo.5885848 (accessed on 24 January 2022).
Acknowledgments
This study was supported by the National Key R&D Program of China (2017YFC1501502) and the National Natural Science Foundation of China (41675001, 41875001, and 41875005).
Conflicts of Interest
The authors declare no conflict of interest.
References
- Proctor, D.E. Regions where lightning flashes began. J. Geophys. Res. 1991, 96, 5099–5112. [Google Scholar] [CrossRef]
- Lund, N.R.; MacGorman, D.R.; Schuur, T.J.; Biggerstaff, M.I.; Rust, W.D. Relationships between lightning location and polarimetric radar signatures in a small mesoscale convective system. Mon. Weather Rev. 2009, 137, 4151–4170. [Google Scholar] [CrossRef] [Green Version]
- Mecikalski, R.M.; Carey, L.D. Lightning characteristics relative to radar, altitude and temperature for a multicell, MCS and supercell over northern Alabama. Atmos. Res. 2017, 191, 128–140. [Google Scholar] [CrossRef] [Green Version]
- Mecikalski, R.M.; Carey, L.D. Radar reflectivity and altitude distributions of lightning as a function of IC CG and HY flashes: Implications for LNOx production. J. Geophys. Res. Atmos. 2018, 123, 12796–12813. [Google Scholar] [CrossRef]
- Mecikalski, R.M.; Carey, L.D. Radar reflectivity and altitude distributions of lightning flashes as a function of three main storm types. J. Geophys. Res. Atmos. 2018, 123, 12814–12828. [Google Scholar] [CrossRef]
- Wang, F.; Liu, H.; Dong, W.; Zhang, Y.; Yao, W.; Zheng, D. Radar reflectivity of lightning flashes in stratiform regions of mesoscale convective systems. J. Geophys. Res. Atmos. 2019, 124, 14114–14132. [Google Scholar] [CrossRef]
- Fuchs, B.R.; Rutledge, S.A. Investigation of lightning flash locations in isolated convection using LMA observations. J. Geophys. Res. Atmos. 2018, 123, 6158–6174. [Google Scholar] [CrossRef]
- Figueras i Ventura, J.; Pineda, N.; Besic, N.; Grazioli, J.; Hering, A.; van der Velde, O.A.; Romero, D.; Sunjerga, A.; Mostajabi, A.; Azadifar, M.; et al. Polarimetric radar characteristics of lightning initiation and propagating channels. Atmos. Meas. Tech. 2019, 12, 2881–2911. [Google Scholar] [CrossRef] [Green Version]
- Coquillat, S.; Defer, E.; de Guibert, P.; Lambert, D.; Pinty, J.P.; Pont, V.; Prieur, S.; Thomas, R.J.; Krehbiel, P.R.; Rison, W. SAETTA: High-resolution 3-D mapping of the total lightning activity in the Mediterranean Basin over Corsica, with a focus on a mesoscale convective system event. Atmos. Meas. Tech. 2019, 12, 5765–5790. [Google Scholar] [CrossRef] [Green Version]
- López, J.A.; Montanyà, J.; Velde, O.A.; Pineda, N.; Salvador, A.; Romero, D.; Aranguren, D.; Taborda, J. Charge structure of two tropical thunderstorms in Colombia. J. Geophys. Res. Atmos. 2019, 124, 5503–5515. [Google Scholar] [CrossRef]
- Salvador, A.; Pineda, N.; Montanya, J.; Sola, G. Seasonal variations on the conditions required for the lightning production. Atmos. Res. 2020, 243, 104981. [Google Scholar] [CrossRef]
- Saunders, C. Charge separation mechanisms in clouds. Space Sci. Rev. 2008, 137, 335–353. [Google Scholar] [CrossRef]
- Zheng, D.; Zhang, Y.; Meng, Q. Properties of negative initial leaders and lightning flash size in a cluster of supercells. J. Geophys. Res. Atmos. 2018, 123, 12857–12876. [Google Scholar] [CrossRef]
- Mazur, V.; Rust, W.D. Lightning propagation and flash density in squall lines as determined with radar. J. Geophys. Res. 1983, 88, 1495–1502. [Google Scholar] [CrossRef]
- Mazur, V.; Rust, W.D.; Gerlach, J.C. 1986. Evolution of lightning flash density and reflectivity structure in a multicell thunderstorm. J. Geophys. Res. 1986, 91, 8690–8700. [Google Scholar] [CrossRef]
- Bruning, E.C.; MacGorman, D.R. Theory and observations of controls on lightning flash size spectra. J. Atmos. Sci. 2013, 70, 4012–4029. [Google Scholar] [CrossRef]
- Wang, F.; Liu, H.; Dong, W.; Zhang, Y.; Meng, Q. Characteristics of lightning flashes associated with the charge layer near the 0 °C isotherm in the stratiform region of mesoscale convective systems. J. Geophys. Res. Atmos. 2018, 123, 9524–9541. [Google Scholar] [CrossRef]
- Wang, F.; Zhang, Y.; Liu, H.; Dong, W.; Yao, W.; Zheng, D. Vertical reflectivity structures near lightning flashes in the stratiform regions of mesoscale convective systems. Atmos. Res. 2020, 242, 104961. [Google Scholar] [CrossRef]
- Rison, W.; Thomas, R.J.; Krehbiel, P.R.; Hamlin, T.; Harlin, J. A GPS-based three-dimensional lightning mapping system: Initial observations in central New Mexico. Geophys. Res. Lett. 1999, 26, 3573–3576. [Google Scholar] [CrossRef] [Green Version]
- Koshak, W.J.; Solakiewicz, R.J.; Blakeslee, R.J.; Goodman, S.J.; Christian, H.J.; Hall, J.M.; Bailey, J.C.; Krider, E.P.; Bateman, M.G.; Boccippio, D.J.; et al. North Alabama lightning mapping array (LMA): VHF source retrieval algorithm and error analyses. J. Atmos. Ocean. Technol. 2004, 21, 543–558. [Google Scholar] [CrossRef] [Green Version]
- Thomas, R.J.; Krehbiel, P.R.; Rison, W.; Hamlin, T.; Harlin, J.; Shown, D. Observations of VHF source power radiated by lightning. Geophys. Res. Lett. 2001, 28, 143–146. [Google Scholar] [CrossRef] [Green Version]
- Thomas, R.J.; Krehbiel, P.R.; Rison, W.; Hunyada, S.J.; Winn, W.P.; Hamlin, T.; Harlin, J. Accuracy of the lightning mapping array. J. Geophys. Res. 2004, 109, D14207. [Google Scholar] [CrossRef] [Green Version]
- MacGorman, D.; Rust, W.D.; Schuur, T.J.; Biggerstaff, M.; Straka, J.M.; Ziegler, C.L.; Mansell, E.R.; Bruning, E.; Kuhlman, K.M.; Lund, N.R.; et al. TELEX the thunderstorm electrification and lightning experiment. Bull. Am. Meteorol. Soc. 2008, 89, 997–1013. [Google Scholar] [CrossRef]
- Rison, W.; Krehbiel, P.R.; Stock, M.G.; Edens, H.E.; Shao, X.-M.; Thomas, R.J.; Stanley, M.A.; Zhang, Y. Observations of narrow bipolar events reveal how lightning is initiated in thunderstorms. Nat. Commun. 2016, 7, 10721. [Google Scholar] [CrossRef] [Green Version]
- Shao, X.M.; Krehbiel, P.R. The spatial and temporal development of intracloud lightning. J. Geophys. Res. Earth Surf. 1996, 101, 26641–26668. [Google Scholar] [CrossRef]
- Zhang, J.; Howard, K.; Xia, W.; Gourley, J.J. Comparison of objective analysis schemes for the WSR-88D radar data. In Proceedings of the 31st International Conference on Radar Meteorology, Seattle, WA, USA, 6–12 August 2003; pp. 907–910. [Google Scholar]
- Biggerstaff, M.I.; Listemaa, S.A. An improved scheme for convective/stratiform echo classification using radar reflectivity. J. Appl. Meteorol. 2000, 39, 2129–2150. [Google Scholar] [CrossRef]
- Houze, R.A., Jr.; Smull, B.F.; Dodge, P. Mesoscale organization of springtime rainstorms in Oklahoma. Mon. Weather Rev. 1990, 118, 613–654. [Google Scholar] [CrossRef]
- Biggerstaff, M.I.; Houze, R.A. Kinematics and microphysics of the transition zone of the 10–11 June 1985 squall line. J. Atmos. Sci. 1993, 50, 3091–3110. [Google Scholar] [CrossRef] [Green Version]
- Loehrer, S.M.; Johnson, R.H. Surface pressure and precipitation life cycle characteristics of PRE-STORM mesoscale convective systems. Mon. Weather Rev. 1995, 123, 600–621. [Google Scholar] [CrossRef] [Green Version]
- Parker, M.D.; Johnson, R.H. Organizational modes of midlatitude mesoscale convective systems. Mon. Weather Rev. 2000, 128, 3413–3436. [Google Scholar] [CrossRef]
- Houze, R.A., Jr.; Rutledge, S.A.; Biggerstaff, M.I.; Smull, B.F. Interpretation of Doppler weather-radar displays in midlatitude mesoscale convective systems. Bull. Am. Meteorol. Soc. 1989, 70, 608–619. [Google Scholar] [CrossRef] [Green Version]
- Houze, R.A., Jr. Cloud Dynamics; Academic: San Diego, CA, USA, 1993; 573p. [Google Scholar]
- Yuter, S.E.; Houze, R.A., Jr. Three-dimensional kinematic and microphysical evolution of Florida cumulonimbus. Part II: Frequency distribution of vertical velocity, reflectivity, and differential reflectivity. Mon. Weather Rev. 1995, 123, 1941–1963. [Google Scholar] [CrossRef]
- Yuter, S.E.; Houze, R.A., Jr. Three-dimensional kinematic and microphysical evolution of Florida cumulonimbus. Part III: Vertical mass transport, mass divergence, and synthesis. Mon. Weather Rev. 1995, 123, 1964–1983. [Google Scholar] [CrossRef] [Green Version]
- Houze, R.A., Jr. Stratiform precipitation in regions of convection: A meteorological paradox? Bull. Am. Meteorol. Soc. 1997, 78, 2179–2196. [Google Scholar] [CrossRef]
- Steiner, M.; Houze, R.A., Jr.; Yuter, S.E. Climatological characterization of three-dimensional storm structure from operational radar and rain gauge data. J. Appl. Meteor. 1995, 34, 1978–2007. [Google Scholar] [CrossRef]
- Rosenfeld, D.; Amitai, E.; Wolff, D.B. Classification of rain regimes by the three-dimensional properties of reflectivity fields. J. Appl. Meteor. 1995, 34, 198–211. [Google Scholar] [CrossRef] [Green Version]
- Takahashi, T. Riming electrification as a charging generation mechanism in thunderstorms. J. Atmos. Sci. 1978, 35, 1536–1548. [Google Scholar] [CrossRef]
- Gardiner, B.; Lamb, D.; Pitter, R.L.; Hallett, J.; Saunders, C.P.R. Measurements of initial potential gradient and particle charges in a Montana summer thunderstorm. J. Geophys. Res. 1985, 90, 6079–6086. [Google Scholar] [CrossRef]
- Saunders, C.P.R.; Keith, W.D.; Mitzeva, R.P. The effect of liquid water on thunderstorm charging. J. Geophys. Res. 1991, 96, 11007–11017. [Google Scholar] [CrossRef]
- Stolzenburg, M.; Marshall, T.C.; Rust, W.D.; Smull, B.F. Horizontal distribution of electrical and meteorological conditions across the stratiform region of a mesoscale convective system. Mon. Weather Rev. 1994, 122, 1777–1797. [Google Scholar] [CrossRef] [Green Version]
- Stolzenburg, M.; Rust, W.D.; Marshall, T.C. Electrical structure in thunderstorm convective regions 3. Synthesis. J. Geophys. Res. Earth Surf. 1998, 103, 14097–14108. [Google Scholar] [CrossRef]
- Gremillion, M.S.; Orville, R.E. Thunderstorm characteristics of cloud-to-ground lightning at the Kennedy Space Center, Florida: A study of lightning initiation signatures as indicated by the WSR-88D. Weather Forecast. 1999, 14, 640–649. [Google Scholar] [CrossRef]
- Martinez, M. The relationship between radar reflectivity and lightning activity at initial stages of convective storms. In Proceedings of the American Meteorological Society 2002, 82nd Annual Meeting, First Annual Student Conference, Orlando, FL, USA, 14 January 2002. [Google Scholar]
- Vincent, B.R.; Carey, L.D.; Schneider, D.; Keeter, K.; Gonski, R. Using WSR-88D reflectivity for the prediction of cloud-to-ground lightning: A central North Carolina study. Natl. Weather Dig. 2003, 27, 35–44. [Google Scholar]
- Marshall, T.C.; Rust, W.D. Two types of vertical electrical structures in stratiform precipitation regions of mesoscale convective systems. Bull. Am. Meteorol. Soc. 1993, 74, 2159–2170. [Google Scholar] [CrossRef] [Green Version]
- Schuur, T.J.; Rutledge, S.A. Electrification of stratiform regions in mesoscale convective systems. Part I: An observational comparison of symmetric and asymmetric MCSs. J. Atmos. Sci. 2000, 57, 1961–1982. [Google Scholar] [CrossRef]
- Marshall, T.C.; Stolzenburg, M.; Rust, W.D.; Williams, E.R.; Boldi, R. Positive charge in the stratiform cloud of a mesoscale convective system. J. Geophys. Res. 2001, 106, 1157–1163. [Google Scholar] [CrossRef]
- Mo, Q.; Detwiler, A.G.; Hallett, J.; Black, R. Horizontal structure of the electric field in the stratiform region of an Oklahoma mesoscale convective system. J. Geophys. Res. 2003, 108, 4225. [Google Scholar] [CrossRef]
- Carey, L.D.; Murphy, M.J.; McCormick, T.L.; Demetriades, N.W.S. Lightning location relative to storm structure in a leading-line, trailing-stratiform mesoscale convective system. J. Geophys. Res. 2005, 110, D03105. [Google Scholar] [CrossRef]
- Houze, R.A., Jr. Mesoscale convective systems. Rev. Geophys. 2004, 42, RG4003. [Google Scholar] [CrossRef] [Green Version]
- Saunders, C.P.R.; Peck, S.L. Laboratory studies of the influence of the rime accretion rate on charge transfer during crystal/graupel collisions. J. Geophys. Res. Earth Surf. 1998, 103, 13949–13956. [Google Scholar] [CrossRef]
- Pereyra, R.G.; Avila, E.E.; Castellano, N.E.; Saunders, C.P.R. A laboratory study of graupel charging. J. Geophys. Res. 2000, 105, 20803–20812. [Google Scholar] [CrossRef]
- Saunders, C.P.R.; Bax-Norman, H.; Emerisic, C.; Avila, E.E.; Castellano, N.E. Laboratory studies of the effect of cloud conditions on graupel/crystal charge transfer in thunderstorm electrification. Quart. J. Roy. Meteor. Soc. 2006, 132, 2653–2673. [Google Scholar] [CrossRef]
- Workman, E.J.; Reynolds, S.E. Electrical activity as related to thunderstorm cell growth. Bull. Am. Meteorol. Soc. 1949, 30, 142–149. [Google Scholar]
- Williams, E.R.; Lhermitte, R.M. Radar tests of the precipitation hypothesis for thunderstorm electrification. J. Geophys. Res. Earth Surf. 1983, 88, 10984–10992. [Google Scholar] [CrossRef]
- Dye, J.E.; Jones, J.J.; Weinheimer, A.J.; Winn, W.P. Observations within two regions of charge during initial thunderstorm electrification, Q.J.R. Meteorol. Soc. 1989, 114, 1271–1290. [Google Scholar] [CrossRef]
- Rutledge, S.A.; Williams, E.R.; Keenan, T.D. The down under Doppler and electricity experiment (DUNDEE): Overview and preliminary results. Bull. Am. Meteorol. Soc. 1992, 73, 3–16. [Google Scholar] [CrossRef] [Green Version]
- Carey, L.D.; Rutledge, S.A. A multiparameter radar case study of the microphysical and kinematic evolution of a lightning producing storm. Meteor. Atmos. Phys. 1996, 59, 33–64. [Google Scholar] [CrossRef]
- Petersen, W.A.; Rutledge, S.A.; Orville, R.E. Cloud-to-ground lightning observations to TOGA COARE, selected results and lightning location algorithm. Mon. Weather Rev. 1996, 124, 602–620. [Google Scholar] [CrossRef] [Green Version]
- Petersen, W.A.; Rutledge, S.A.; Cifelli, R.C.; Ferrier, B.S.; Smull, B.F. 999, Shipborne Dual-Doppler operations during TOGA COARE: Integrated observations of storm kinematics and electrification. Bull. Am. Meteorol. Soc. 1999, 80, 81–97. [Google Scholar] [CrossRef] [Green Version]
- Heymsfield, G.M.; Tian, L.; Heymsfield, A.J.; Li, L.; Guimond, S. Characteristics of deep tropical and subtropi-cal convection from nadir-viewing high-altitude air-borne Doppler radar. J. Atmos. Sci. 2010, 67, 285–308. [Google Scholar] [CrossRef] [Green Version]
- Zheng, D.; Zhang, Y.; Meng, Q.; Lti, W. Relationship between lightning activities and surface precipitation in thunderstorm weather in Beijing. J. Appl. Meteor. Sci. 2010, 21, 287–297. [Google Scholar]
- Palucki, J.L.; Biggerstaff, M.I.; MacGorman, D.R.; Schuur, T. Comparison between low-flash and non-lightning-producing convective areas within a mature mesoscale convective system. Weather Forecast. 2011, 26, 468–486. [Google Scholar] [CrossRef]
- Reinhart, B.; Fuelberg, H.; Blakeslee, R.; Mach, D.; Heymsfield, A.; Bansemer, A.; Durden, S.L.; Tanelli, S.; Heymsfield, G.; Lambrigtsen, B. Understanding the relationships between lightning, cloud microphysics, and airborne radar-derived storm structure during Hurricane Karl (2010). Mon. Weather Rev. 2014, 142, 590–605. [Google Scholar] [CrossRef] [Green Version]
- Wang, F.; Zhang, Y.; Zheng, D.; Xu, L. Impact of the vertical velocity field on charging processes and charge separation in a simulated thunderstorm. J. Meteor. Res. 2015, 29, 328–343. [Google Scholar] [CrossRef]
Figure 1.
The Chongqing sensor network. The colored contours indicate the vertical location errors in the 7-km range estimated by Monte Carlo simulation. The magenta dashed-dot and dashed circles show the ranges of 20 km and 150 km from the radar, respectively. The yellow circle shows the coverage of the observation domain.

Figure 2.
(a) Distribution of the convective grids with different initiation densities and altitude distributions of the LD, HD and SD grids in (b) all cases and (c) the cases excluding Case 6 and 7.
Figure 2.
(a) Distribution of the convective grids with different initiation densities and altitude distributions of the LD, HD and SD grids in (b) all cases and (c) the cases excluding Case 6 and 7.

Figure 3.
Two-dimensional histogram of the (a) and (b) grids relative to radar reflectivity and altitude for the 14 MCSs.
Figure 3.
Two-dimensional histogram of the (a) and (b) grids relative to radar reflectivity and altitude for the 14 MCSs.

Figure 4.
(a) Frequency (grids 6 min−1) evolution of the LD and HD grids, (b) altitude evolution of the LD, HD and SD grids, and (c) altitude distributions of the LD and HD grids in Case 7. (It should be noted that there is a time gap larger than 6 min due to radar failure).
Figure 4.
(a) Frequency (grids 6 min−1) evolution of the LD and HD grids, (b) altitude evolution of the LD, HD and SD grids, and (c) altitude distributions of the LD and HD grids in Case 7. (It should be noted that there is a time gap larger than 6 min due to radar failure).

Figure 5.
Distributions of the reflectivity and the LD, HD, and SD grids in (a) the horizontal and (b,c) the vertical planes at 17:39 CST. The contours in (a–c) indicate the distribution of (a) composite reflectivity in the horizontal and (b,c) reflectivity in the vertical (unit: dBZ). The blue, green, and red rectangles represent the LD, HD, and SD grids, respectively. The yellow star in (a) shows the location of the radar site. The black lines in (a) illustrate the positions of the vertical sections in (b,c), respectively.

Figure 6.
The 3D distribution of the channels of the lightning flashes initiated in the SD grid in the left-hand part of Figure 5a. The flashes in (a–d) were initiated at 17:40:34.443, 17:41:11.326, 17:41:31.617, and 17:42:05.762 CST, respectively. (1) illustrates the altitude evolution of VHF radiation sources with time; (2) and (4) give the distributions of reflectivity and the altitudes of VHF radiation sources in the vertical sections along the dot-dashed lines in (3); (3) shows the composite reflectivity and the horizontal projections of the VHF radiation sources. The contours in (2), (3), and (4) show the distribution of reflectivity (unit: dBZ). The colored dots illustrate the locations of VHF radiation sources and the colors represent their time differences relative to the first in ms. The red X indicates the location of the first VHF radiation source.

Figure 7.
Distributions of the reflectivity and the LD, HD, and SD grids in (a) the horizontal and (b) the vertical at 19:02 CST. The contours in (a,b) indicate the distribution of (a) composite reflectivity and (b) reflectivity (unit: dBZ). The blue, green, and red rectangles represent the LD, HD, and SD grids, respectively. The yellow star in (a) indicates the location of the radar site. The black lines in (a) illustrate the positions of the vertical sections shown in (b).

Figure 8.
Similar to Figure 6, but for lightning flashes initiated in the SD grid of Figure 5a at a lower level. The flashes in (a–c) were initiated at 19:02:00.927, 19:02:44.607, and 19:03:24.744 CST, respectively.


Table 1.
The distribution of the LD, HD and SD grids in the 14 MCSs.
| No. | Date of Storm | The Maximum Altitude of 30-dBZ Top (km) | The Maximum Area of 30-dBZ Region at 7-km Altitude (km2) | LD Grids (Percentage) | HD Grids (Percentage) | SD Grids (Percentage) |
|---|---|---|---|---|---|---|
| 1 | 1 September 2014 | 14 | 208 | 238 (99.2%) | 2 (0.8%) | 0 (0.0%) |
| 2 | 1 September 2014 | 11 | 113 | 29 (100.0%) | 0 (0.0%) | 0 (0.0%) |
| 3 | 9 September 2014 | 15 | 126 | 285 (93.8%) | 19 (6.3%) | 1 (0.3%) |
| 4 | 11 September 2014 | 15 | 217 | 529 (97.2%) | 15 (2.8%) | 2 (0.4%) |
| 5 | 11 September 2014 | 16 | 184 | 596 (94.6%) | 34 (5.4%) | 6 (1.0%) |
| 6 | 7 August 2015 | 15 | 374 | 1354 (91.3%) | 129 (8.7%) | 9 (0.6%) |
| 7 | 7 August 2015 | 13 | 577 | 1894 (92.7%) | 150 (7.3%) | 21 (1.0%) |
| 8 | 7 August 2015 | 12 | 77 | 10 (100.0%) | 0 (0.0% | 0 (0.0%) |
| 9 | 7 August 2015 | 13 | 265 | 191 (96.0%) | 8 (4.0%) | 0 (0.0%) |
| 10 | 11 August 2015 | 10 | 16 | 15 (83.3%) | 3 (16.7%) | 0 (0.0%) |
| 11 | 14 August 2015 | 10 | 50 | 3 (100.0%) | 0 (0.0%) | 0 (0.0%) |
| 12 | 16 August 2015 | 11 | 117 | 283 (84.7%) | 51 (15.3%) | 10 (3.0%) |
| 13 | 16 August 2015 | 12 | 190 | 108 (98.2%) | 2 (1.8%) | 0 (0.0%) |
| 14 | 16 August 2015 | 17 | 352 | 46 (95.8%) | 2 (4.2%) | 0 (0.0%) |
| Sum | 5581 | 415 | 49 |
Publisher’s Note: MDPI stays neutral with regard to jurisdictional claims in published maps and institutional affiliations. |
© 2022 by the authors. Licensee MDPI, Basel, Switzerland. This article is an open access article distributed under the terms and conditions of the Creative Commons Attribution (CC BY) license (https://creativecommons.org/licenses/by/4.0/).
Share and Cite
MDPI and ACS Style
Wang, F.; Zhang, Y.; Deng, X.; Liu, H.; Dong, W.; Yao, W. Characteristics of Regions with High-Density Initiation of Flashes in Mesoscale Convective Systems. Remote Sens. 2022, 14, 1193. https://0-doi-org.brum.beds.ac.uk/10.3390/rs14051193
AMA Style
Wang F, Zhang Y, Deng X, Liu H, Dong W, Yao W. Characteristics of Regions with High-Density Initiation of Flashes in Mesoscale Convective Systems. Remote Sensing. 2022; 14(5):1193. https://0-doi-org.brum.beds.ac.uk/10.3390/rs14051193
Chicago/Turabian StyleWang, Fei, Yijun Zhang, Xiaohua Deng, Hengyi Liu, Wansheng Dong, and Wen Yao. 2022. "Characteristics of Regions with High-Density Initiation of Flashes in Mesoscale Convective Systems" Remote Sensing 14, no. 5: 1193. https://0-doi-org.brum.beds.ac.uk/10.3390/rs14051193
Note that from the first issue of 2016, this journal uses article numbers instead of page numbers. See further details here.