Article

On the Use of Web Mapping Platforms to Support the Seismic Vulnerability Assessment of Old Urban Areas

by
Cosimo Columbro
1,
Rafael Ramírez Eudave
2,
Tiago Miguel Ferreira
3,
Paulo B. Lourenço
2 and
Giovanni Fabbrocino
1,4,*
1
Structural and Geotechnical Dynamics Lab “StreGa”, Department of Biosciences and Territory, University of Molise, 86100 Campobasso, Italy
2
Institute for Sustainability and Innovation in Structural Engineering (ISISE), Civil Engineering Department, School of Engineering, Azurém Campus, University of Minho, 4800-058 Guimarães, Portugal
3
Department of Geography and Environmental Management, University of the West of England, Bristol BS16 1QY, UK
4
Construction Technologies Institute L’Aquila Branch, National Research Council (ITC-CNR), 67100 L’Aquila, Italy
*
Author to whom correspondence should be addressed.
Submission received: 2 January 2022 / Revised: 2 March 2022 / Accepted: 7 March 2022 / Published: 15 March 2022

Abstract

:
European countries are affected by various levels of seismic hazard, including many areas with medium to high seismicity. Heavy damage over large areas has been observed in past earthquakes in these countries, particularly in masonry buildings located in historical centers, confirming the need for enhancing the current knowledge on the seismic vulnerability of these constructions, so more informed technical and political decisions towards the mitigation of the risk can be taken. However, the characterization of building stocks for engineering purposes is still an open issue due to the enormous amount of resources that such a project would require. Nevertheless, the availability of virtual images and maps represents an outstanding opportunity for having remote approaches to urban environments. The role of on-site inspections can be complemented or even substituted by means of these remote approaches, provided it is complemented with suitable approaches. The use of these resources is not new, but the critical assessment of their capabilities and limitations deserves a critical discussion. The present paper aims at assessing the opportunities offered by web-based mapping platforms in the context of seismic vulnerability assessment of masonry buildings in old urban areas. After evaluating the advantages and shortcomings of some of the most popular web-based mapping services, an explanatory application to a set of 39 buildings located in the historic center of the city of Leiria (Portugal) is presented and critically discussed, contrasting the results obtained by using on-site and remote inspections. Two different seismic vulnerability assessment approaches are applied and analyzed herein, confirming that web-based mapping platforms can represent an efficient and cost-effective complement to traditional field surveys when the large-scale seismic vulnerability of old urban areas is of interest.

1. Introduction

The development of methodologies for the assessment of the seismic vulnerability of historic centers received increasing interest in the last decades due to the intensity and the extension of the damage on constructions characterized by their architectural and historical value [1,2]. Several studies have been conducted for assessing the seismic vulnerability of building stocks on a regional and urban level using specially developed algorithms [3]. Any large-scale seismic vulnerability assessment procedure is often related to surveys aimed at collecting the main structural, geometric, and material characteristics of the buildings. Due to the considerable number of buildings usually involved, this task often involves time-consuming and costly field survey operations. In the specific case of the historical centers, image processing and remote sensing techniques are expected to offer attractive options for knowing and characterizing built heritage [4]. However, these techniques cannot yet replace field surveys mainly because it is still necessary to balance the amount of data to collect with the computational effort related to the analysis. Web-based technologies and approaches, used as a complement to traditional field survey activities [5], can play a role in this regard [6,7,8,9]. Then, it is convenient to explore the limitations and opportunities of performing remote inspections for seismic vulnerability and condition assessment purposes. This study primarily must observe the type of information offered to the user, its suitability in the context of vulnerability-assessment approaches, and the reliability of using these approaches in contrast to traditional field surveys. In the view of the exposed, the main objective of this work is to discuss the adequacy of the use of open-access web mapping solutions as complementary information sources to support the seismic vulnerability assessment of masonry buildings in old urban areas. To accomplish this objective, some of the most popular web-based mapping platforms were reviewed to identify their potentialities and shortcomings. Then, an explanatory application was conducted in a way that the selected platforms were used for feeding a seismic vulnerability analysis of the Historic City Center of Leiria (Portugal) and for forecasting damage scenarios based on simplified performance assessment methodologies associated with both global—Building Approach, BA, and local collapse mechanism—Façade Approach, FA. A comparative analysis of the results based on virtual surveys of remote sensing and those coming from technical information coming from traditional field surveys were finally discussed.
The paper is divided into five sections. Section 2 deals with the opportunities and limitations related to the use of commonly available web-mapping platforms. Section 3 recalls the fundamentals of the selected approaches to the quantitative analysis of the seismic vulnerability (BA and FA) based on those data effectively surveyable by remote observation of the buildings. Section 4 briefly illustrates the features of the selected area for the benchmark study in the center of the City of Leiria, Portugal. Section 5 reports the assessments and the results including the comparative analysis of the BA and FA method performance against the reference analysis conducted after a more traditional field survey. The last section draws some conclusions and final remarks.

2. Building Survey & Web-Based Mapping Platforms

Nowadays, technology is an integral part of our daily life. Electronic devices equipped with an internet connection, such as smartphones or tablets, allow quick access to any kind of information from everywhere. These constantly evolving technologies are radically changing our lives, opening new possibilities, and creating unprecedented research opportunities. The purpose of this work is to demonstrate the usefulness of web-based platforms as a complementary resource for the seismic vulnerability assessment of old urban areas, moving away from the traditional on-site data survey approaches and depicting a novel working methodology.

2.1. State-of-Art: Relevant Experiences

Previous experiences on the use of remote observations for performing vulnerability assessments permit recognizing opportunities and limitations of this approach. Some valuable efforts have been addressed to minimize the gap between inspection and assessment, facilitating a more straightforward process in which inspection is directly feeding specific databases. The use of web-based front ends for displaying inspection sheets facilitates real-time data acquisition and management. This procedure can be performed with the support of databases with browser-based interphases in substitution of traditional paper-based data collecting—for example, the implementation of the Rapid Visual Screening for reinforced-concrete constructions [10]. The implementation of this method with the support of remote inspections was explored for the city of George Town (Malaysia), finding an encouraging potential on this workflow [11].
The use of mobile devices also represents a promising opportunity for optimizing field surveys. For example, the android-based RViSITS (Rapid Visual Survey by Institut Teknologi Sepuluh Nopember) app [12] is aimed at optimizing data gathering for assessing the vulnerability of high-rise buildings (8–15 floors). This app permits a direct application of the Rapid Visual Screening method for estimating the seismic vulnerability of large sets of constructions based on correlations between the predicted seismic performance of specific typologies and materials [10]. A similar conceptual approach is given for assessing post-earthquake damages in masonry constructions [13], given the convenience of centralizing the field data gathered from several experts and professionals immediately after the seismic event.
The ML-EHSAPP (Machine Learning-based Earthquake Hazard Safety Assessment of buildings via smartphone App) is an example of development for final users in which a simple and friendly data acquisition app may give an easily understandable outcome for contextualizing the seismic vulnerability of constructions [14]. The information gathered by the app facilitates some additional processes, such as training artificial neural networks (ANN) for refining the methods and approaches on determinate environments. The representation of more complex effects and time-dependent events is able to be made by means of logic trees, such as the LOG-IDEAH (LOGic trees for Identification of Damage due to Earthquakes for Architectural Heritage) assessment tool [15].
The use of remote observations is, therefore, a feasible strategy for performing simplified approaches based on visual surveys, provided the level of detail and accuracy of the observations may comply with the parameters of the vulnerability approaches. An objective comparison among the most common remote observation tools and their suitability in the context of straightforward methods is needed to propose complete workflows of inspections and assessments.

2.2. Key Structural Data for Seismic Vulnerability Assessment

The definition of a survey approach to the building stock of interest is the key phase of any structural performance assessment. A set of relevant parameters must be defined, and then the inspection procedure should be designed to accomplish the task. Commonly, the first step of seismic vulnerability analysis is the planimetric identification of the buildings, an operation that can be supported using cadastral maps.
The primary data to be acquired, usually on-site, is related to the type, geometry, and state of conservation of the building. Specifically, the following information should be carefully gathered: the quality of the connections between adjacent façades and between orthogonal walls, the staggered floors between adjacent buildings or within the same building, the alignment of the façades, the type of masonry, and the interaction between walls and the horizontal structures (i.e., floors and roof).
Different national authorities have designed and adopted many survey forms aimed at collecting data associated with vulnerability features and damage of the building. Before and after the earthquake, their use is twofold for prevention and damage recognition purposes. A particular effort in this direction has been made in Italy due to the number and impact of earthquakes on historical areas in the last four decades [16]. It is worth noting that the scientific effort led to the definition of a clear and definite legal operational context for the technical operators and professionals involved in the post-earthquake damage reports. Herein some words are devoted to introducing some of the most relevant Italian survey forms. The FAST form (the acronym from the Italian “Fabbricati per l’Agibilità Sintetica post-Terremoto”–Buildings for synthetic post-earthquake usability) was designed following the 2016 earthquake in Central Italy [17]. As the acronym recalls, the form aims to speed up the survey operations due to the extension of the impacted area and the need to repeat the assessments depending on the long-lasting seismic sequence. Therefore, it guides the operator in quickly identifying hazardous conditions of the building and the situations requiring temporary housing solutions to the occupants. The outcome of this survey is reported on a form aimed to distinguish accessible buildings from those that cannot be used.
The AeDES (the acronym from the Italian “Agibilità e Danno nell’Emergenza Sismica”—Usability and damage in the seismic emergency) is the first-level form for ordinary buildings in a post-seismic emergency scenario date back to the Umbria and Marche earthquake in 1997. It is the official reference tool for the expeditious survey of damage, the definition of emergency measures, and the evaluation of the post-seismic viability of ordinary buildings [18]. Besides the damage survey, these data are also useful for an initial evaluation of the repair and/or improvement costs.
A contribution to the definition of a set of relevant parameters for masonry buildings is offered by the “PALAZZI” (the Italian word for ‘historical buildings’) form, which deals with the assessment of the features and seismic damage of those architectural assets whose structural behavior is similar to ordinary buildings [19]. It is divided into two sections; the first is made of 13 fields and is aimed at locating the object of the survey and the context in which it is allocated. The second one contains 19 fields and is specifically oriented to the typological and damage survey of the different components of the construction, and to the identification of the collapse mechanisms. It is worth mentioning herein also the level I “CARTIS” form has as its purpose the detection of building type structures, which appear to be made up of homogeneity of the building fabric, given by the age of first construction and/or structural construction technologies [20]. Its main objective consists of creating a national-wide repository of relevant structural data representatives of building stock capable of feeding large-scale analyses and supporting evolving tools useful to deepen seismic vulnerability-related knowledge and extendable to other natural hazards, such as volcanic activity eruptions and hydrogeological events.
The detailed review and analysis of the above-reported vulnerability and damage survey forms led to the identification of 18 parameters common to all the forms, confirming their relevance in the estimation of the structural and seismic performances of the buildings. The selected parameters are reported in Table 1; it is easy to recognize that they are aimed at defining both global and local features of the building structure. For this reason, the capability of the web-mapping platforms in providing the knowledge demand in the context of seismic vulnerability assessments was tested against this specific set of structural parameters.

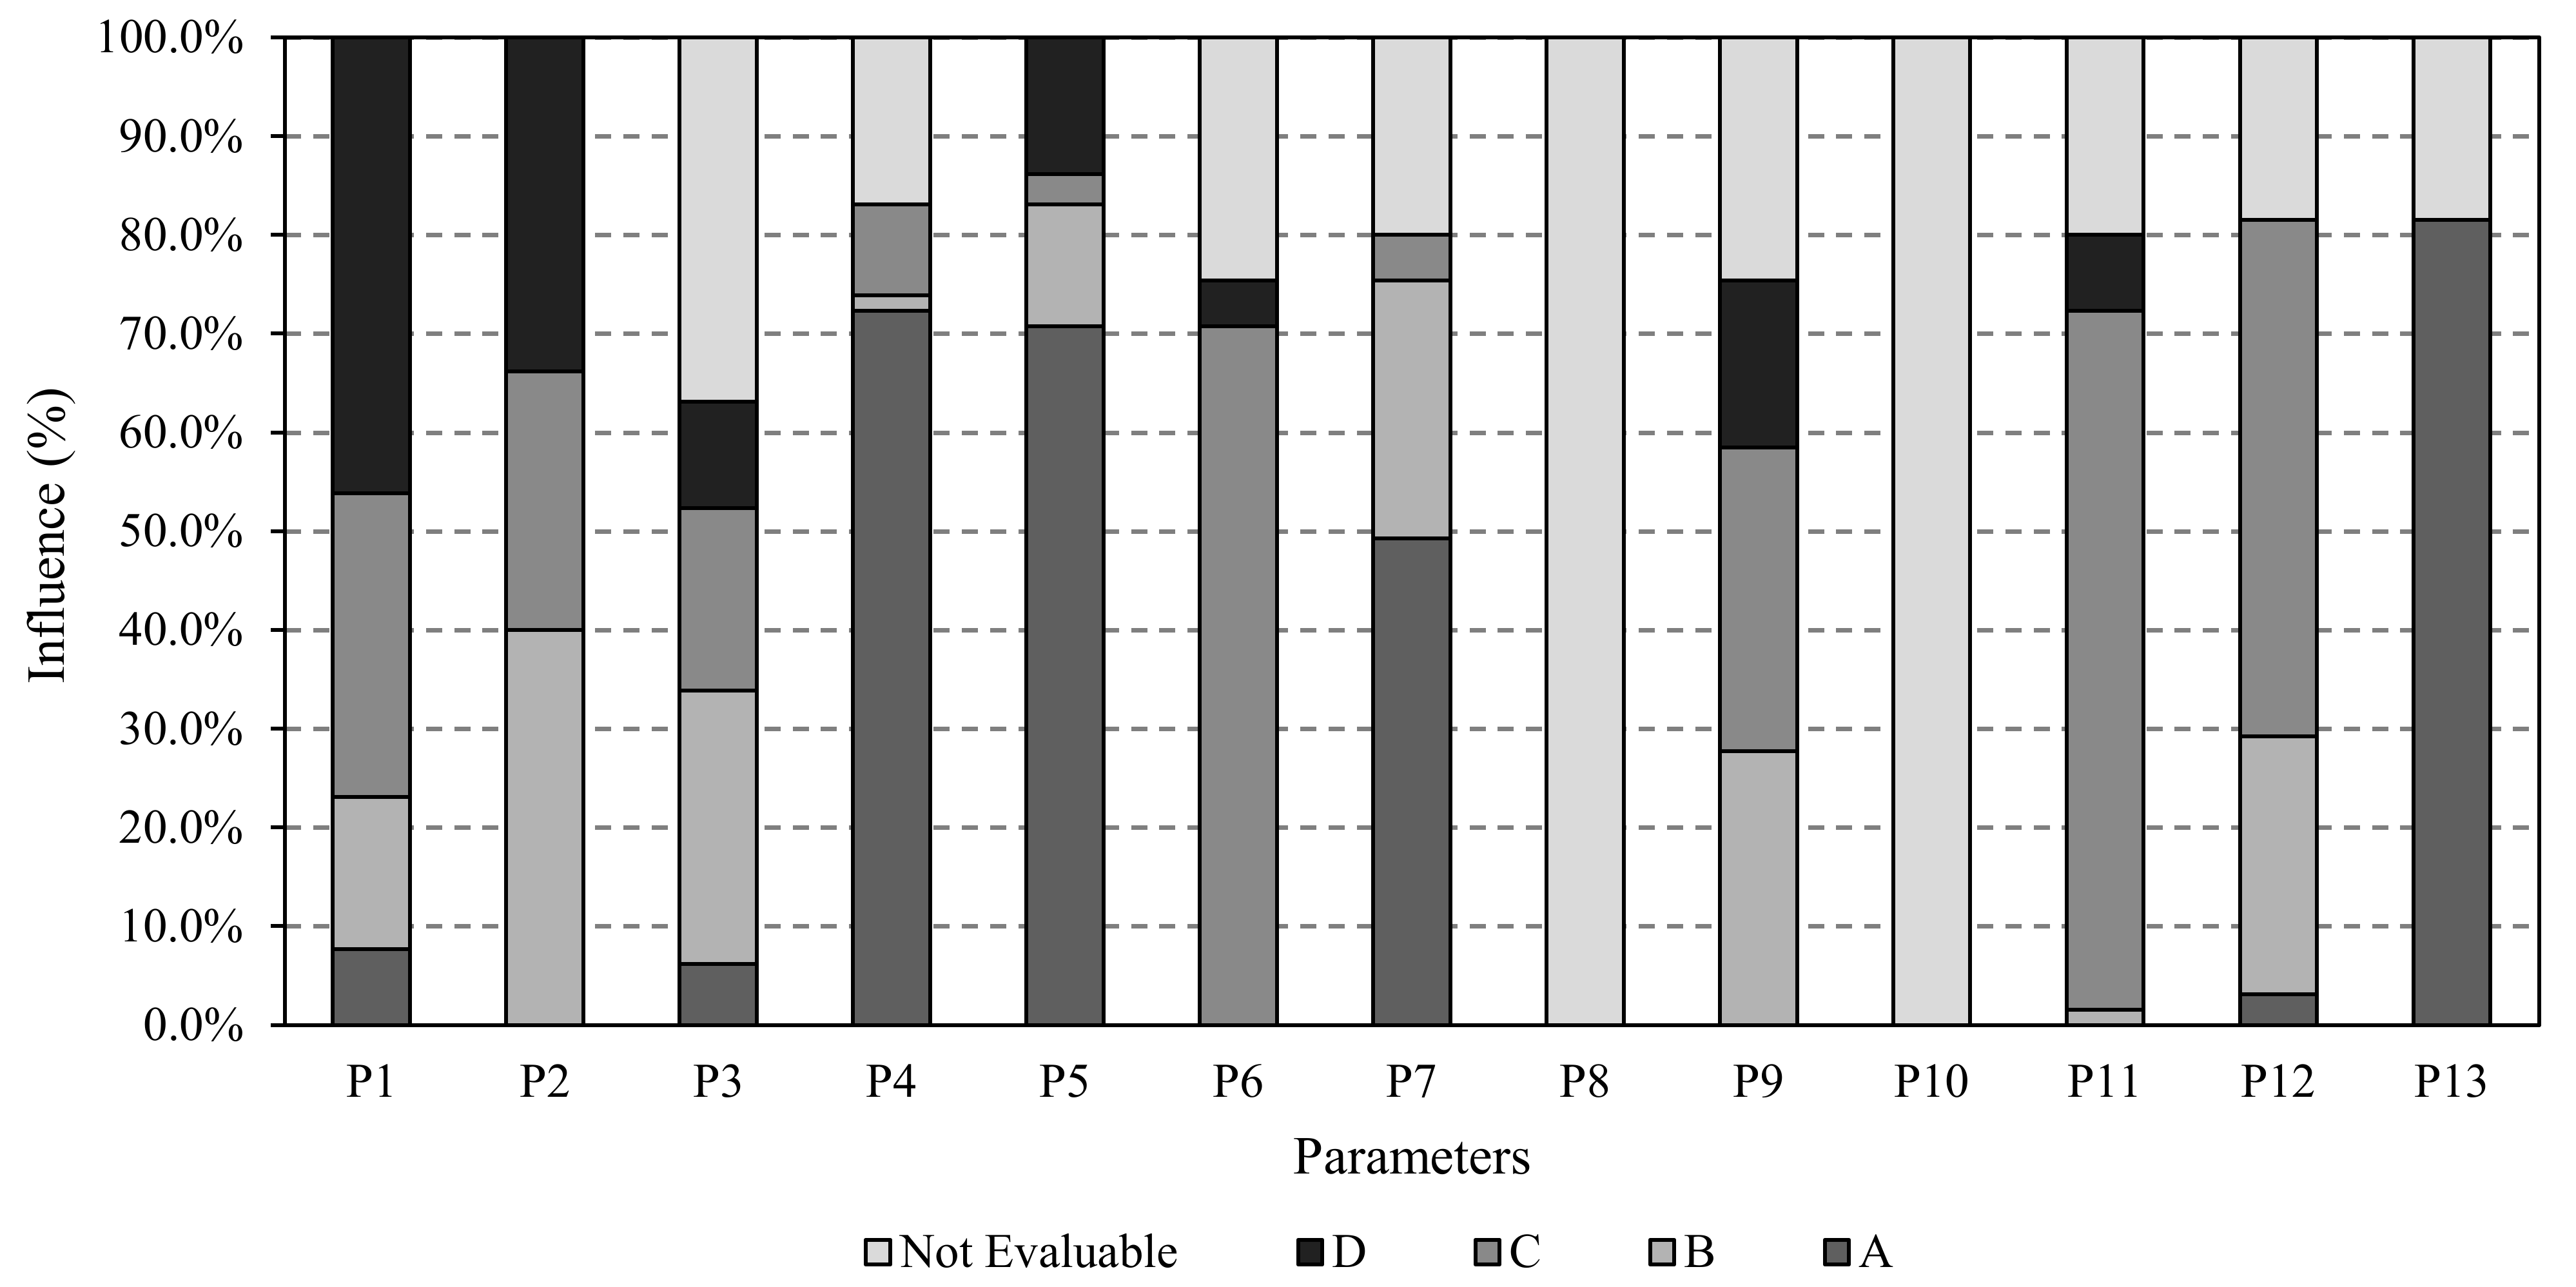
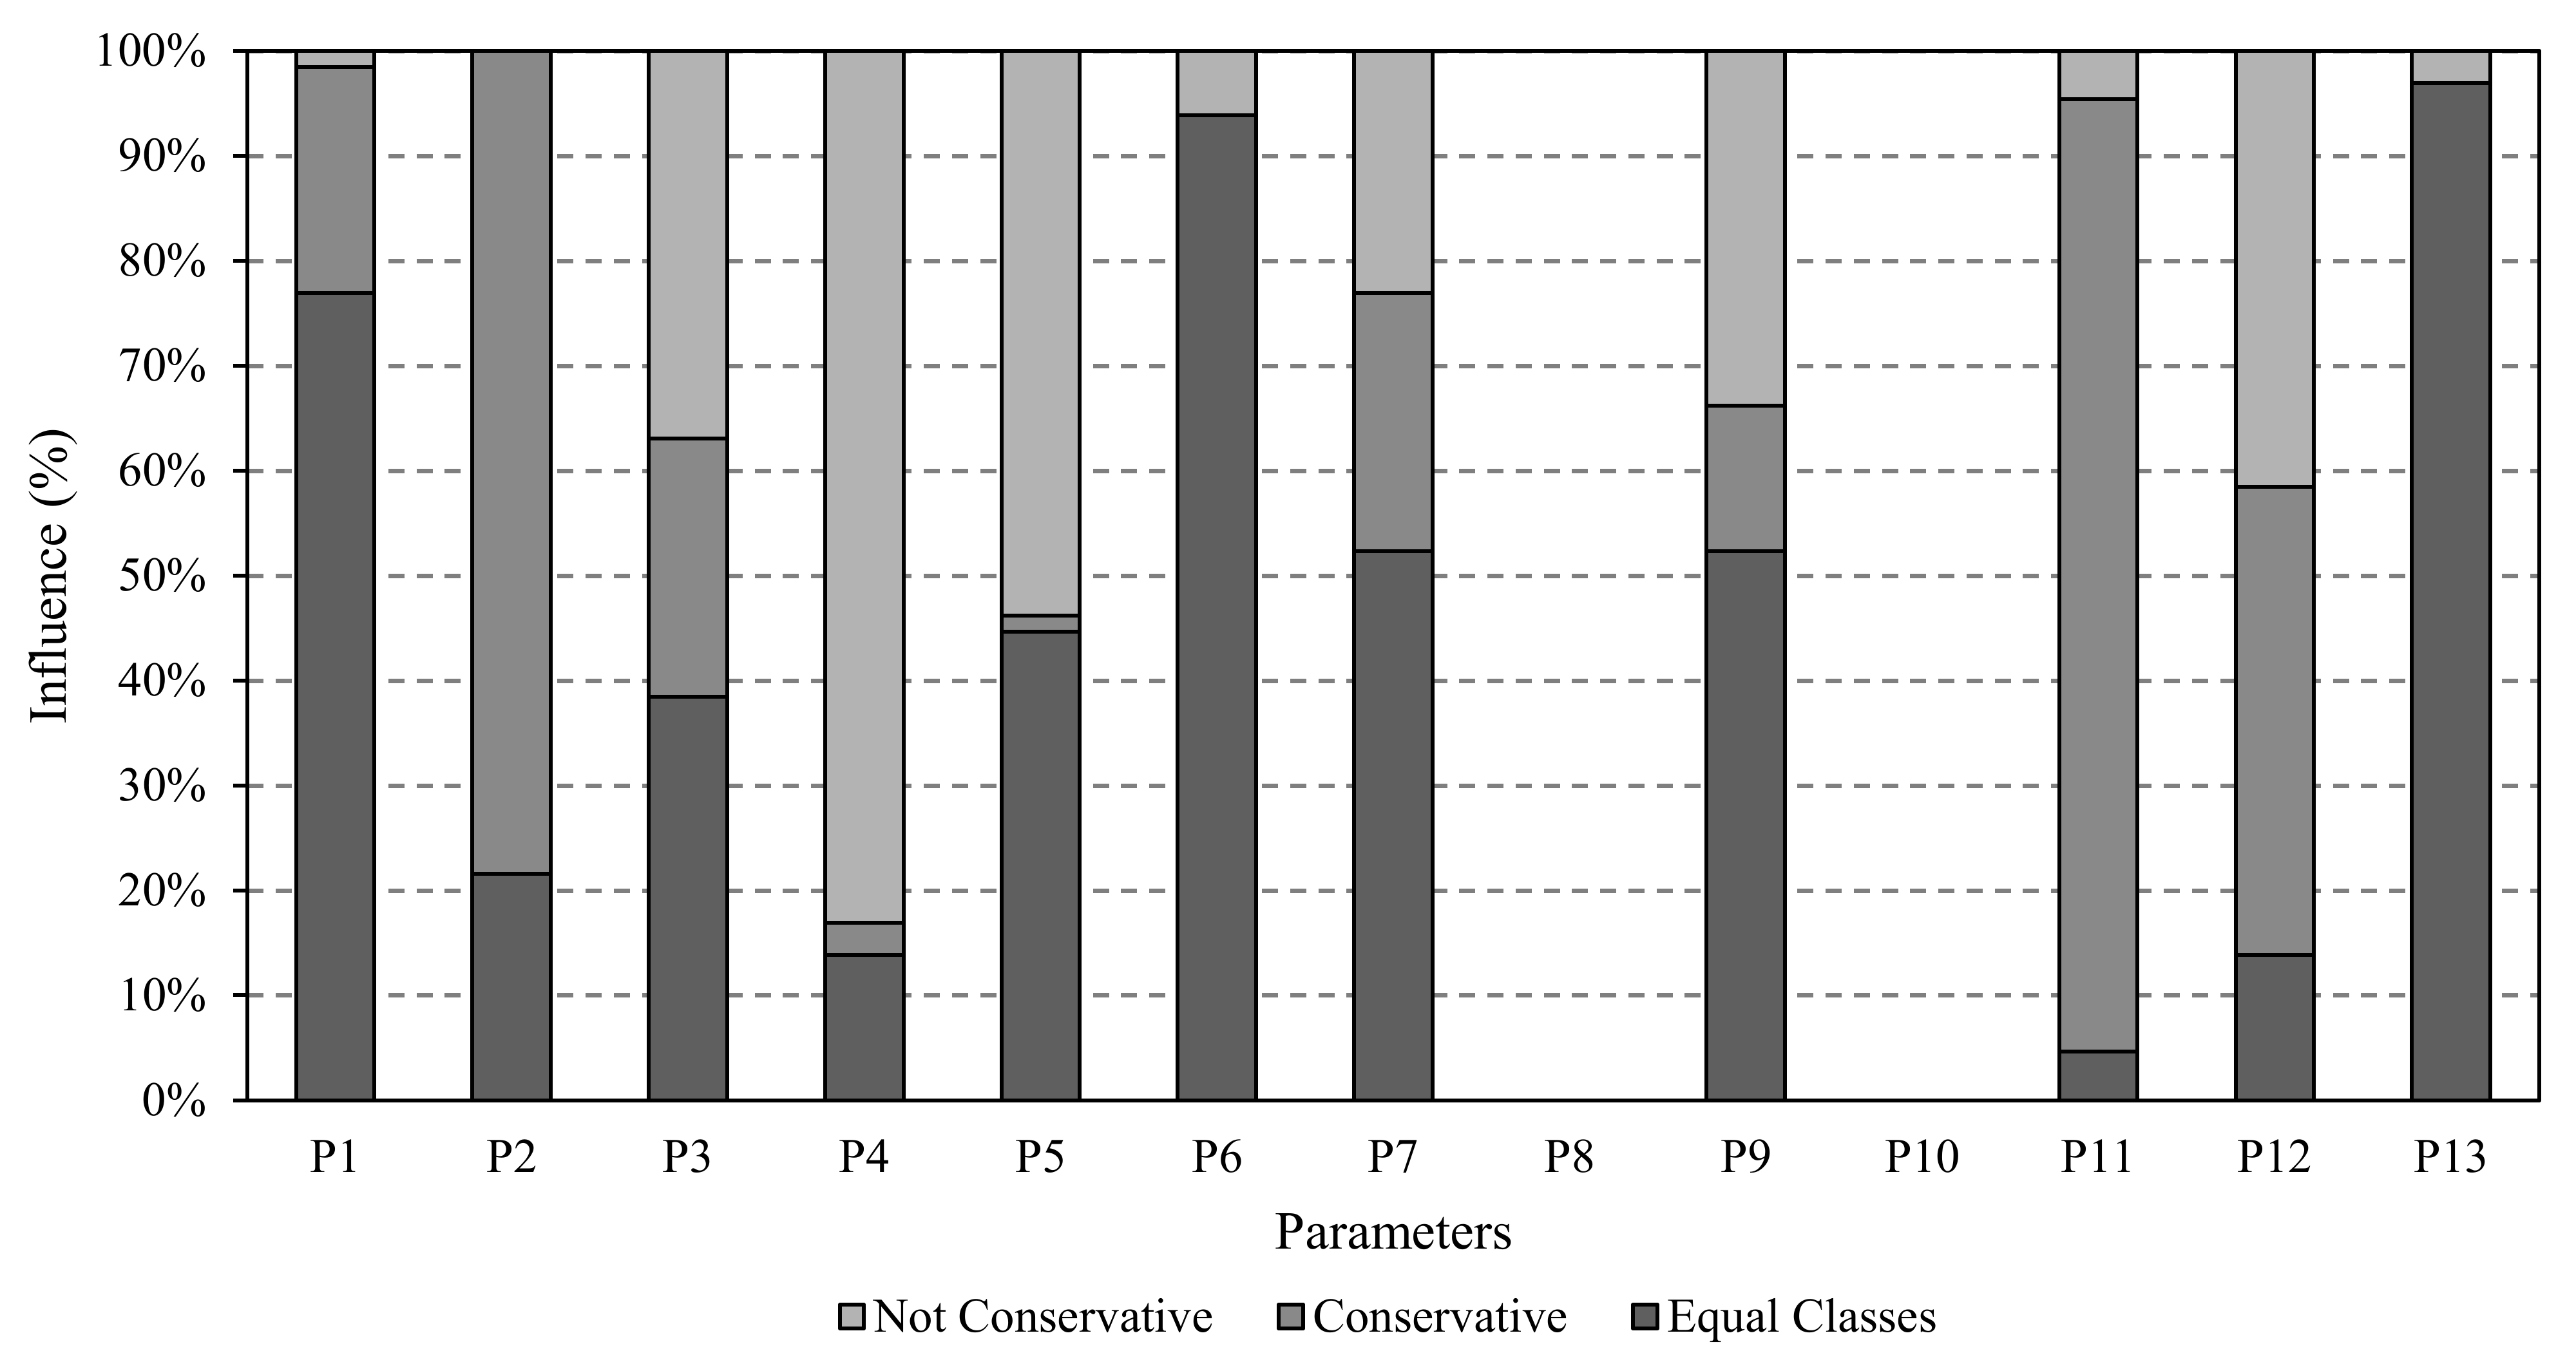
2.3. Web-Based Mapping Platforms vs. Key Structural Data

The detailed characterization of the buildings is a fundamental and decisive step in any seismic vulnerability assessment work, in the sense that a poor characterization of the buildings will negatively affect the accuracy of the vulnerability results. An analysis aimed at investigating whether it is possible to complement, if not completely replace, traditional on-side survey works by using open-access web-based mapping platforms is provided in the following, departing from the parameters identified as mentioned before.
The first step towards this objective consists of the selection of suitable web tools, among those that offer detailed road-level imagery. This first criterion led to discarding some less popular web-mapping platforms, such as “HERE WeGo” [21], a mapping and geographic data processing service by the German company here. Conversely, some less popular platforms emerged due to this criterium, namely a few crowdsourcing-based platforms whose principle seems to be promising within the scope of the present investigation. After a detailed analysis of all the web mapping platforms available online, five platforms appeared as main possibilities: Google Maps [22] & Google Earth [23] (by Google), Bing Maps [24] (Microsoft), Mapillary [25] (Mapillary AB), OpenStreetCam–currently KartaView [26] (KartaView), and Yandex.Maps [27] (Yandex). The most relevant strengths and shortcomings of each of these platforms, given the scope and objectives of this research, are summarized in Table 2. The five web-based mapping platforms included in Table 2 were tested for acquiring data from a real building located in the city of Lisbon (Portugal). The objective was to investigate if the imagery and the tools offered by each one of these services were suitable to provide a detailed and accurate description of the buildings of interest so that they can be used to get the set of information required to evaluate the key structural parameters summarized in Table 1.
The benchmark building is located in the parish of Estrela, just in the heart of Lisbon, at Arriaga street. This building is of relevant cultural value since it was part of the Headquarters of the British embassy until 1940 and the residence of the ambassador until 2003. It is a Pombaline style building that was built after the devastating 1755 Lisbon earthquake.
From the well-reasoned application of the four out of the five pre-selected platforms—Yandex Maps was disregarded due to its poor coverage in Western European countries, including Portugal—it was possible to observe that the Google platform offers the most suitable tool for the purpose of obtaining data that can be subsequently used to support vulnerability assessments.
As can be seen in Table 3, the use of Google Maps permitted the evaluation of 12 (out of the 18) parameters. Mapillary was found to be the second most suitable tool, with 11 parameters fully evaluated. Finally, Open Street Cam and Bing Maps allowed evaluating 10 and 6 parameters, respectively.
A comparison between the images obtained from the different tools to identify the location of the building and its conservation status (Parameter 17, in Table 3) is given in Figure 1 and Figure 2.

3. Quantitative Seismic Vulnerability Analysis and Assessment

Two different approaches are herein proposed for assessing the seismic vulnerability of masonry constructions from the data obtained by web-based platforms. The first approach considers the assessment of the seismic vulnerability of constructions by characterizing a series of general parameters of the constructions. This approach is expected to be performed having information about the internal organization and configuration of the construction. On the other hand, a simplified approach is used.
The above second strategy is aimed at the seismic vulnerability characterization of the building by exclusively using parameters related to the Façade. This strategy is meant to specifically assess the potential out-of-plane mechanism of the façade walls. It is helpful, however, when access to the building is limited.

3.1. Building Approach

The seismic vulnerability of the old city center of Leiria was evaluated by using the Vulnerability Index Method [28], later adapted and enriched by other authors such as Ferreira [29]. Originally developed in Italy and applied widely over the last 25 years, it was adapted to the Portuguese masonry-built environment by Vicente [29] and Ferreira [30].
This method, herein called “Building Approach,” is a hybrid vulnerability assessment technique through which it is possible to evaluate in a simplified way the seismic performance of masonry buildings, frequently found in historical cities, allowing to estimate losses and post-seismic scenarios.
This approach is based on post-seismic damage observations and surveys covering numerous events; this data has been used for guessing which characteristics of the buildings determined their structural behavior during a seismic event.
The method has been tested in many Portuguese historic city centers, such as Coimbra [31], Seixal [29,32], and Horta [30]. In order to evaluate the seismic performance of a building, the approach is based on the definition of 14 parameters that influence the structural response towards seismic activity.
These parameters are related to four classes of increasing vulnerability: A, B, C, and D. A weight pi is assigned to each parameter, ranging from 0.50 for the less important parameters (in terms of structural vulnerability) up to 2.5 for the most important. A total vulnerability index I v * is calculated as the weighted sum of the 14 parameters (Table 4) multiplied by their specific weight assigned as a meaning of importance in the definition of the seismic response of the single building (Equation (1)).
I v *   = i = 1 14 C vi × p i
The total vulnerability index initially obtained can have a range between 0 and 650, later normalized to an Iv index between 0 and 100. It is worth pointing out that the method herein used is based on a calibration to the Portuguese built environment based on a wide set of collected damage data obtained in the sequence of the magnitude VII earthquake that struck the Azores archipelago on 9 July 1998 [30]. The calibration of the method leads to the definition of updated weights given to each parameter compared to the values initially proposed by Vicente [28].

3.2. Façade Approach

The façade walls, especially of historic buildings, present many structural fragilities, such as the presence of flexible floors and inadequate connections between orthogonal walls and horizontal diaphragms. These parameters affect the out-of-plane response of the façades when subjected to horizontal loads. This response is not always related to the global building behavior, as it consists of a local failure mechanism, and thus independent evaluation of the façade walls’ vulnerability is necessary.
Observations of post-earthquake damages verify that the overturning of the façade walls is one of the most concerning damage patterns, not only because it is commonly observed but also because of the consequences that may result from its occurrence.
The first adaptation of the original formulation of the vulnerability index was proposed by Ferreira et al. [33] based on a vast set of post-seismic damage survey data and on the identification of construction aspects that most influence the damage on masonry building façades. Later, another calibration of the method was proposed by Ferreira et al. [34]. In this new calibration, three new parameters were proposed and analyzed and finally added to the 10 originally included in the vulnerability index.
In total, after Ferreira’s calibration, there are 13 parameters that are classified into four main groups to emphasize their relative importance. Such as for the building approach, these parameters are related to four classes, C vi of increasing vulnerability: A, B, C, and D. For each class, a numerical value is assigned and, for each parameter, a weighting factor, pi, reflects its relative importance.
Thus, the vulnerability index I v * of the façade approach is calculated as the weighted sum of those 13 parameters (Equation (2)) and is usually normalized to values between 0 to 100 for ease of use. The corresponding weight of each group of parameters is presented in Table 5.
I v *   = i = 1 13 C vi × p i

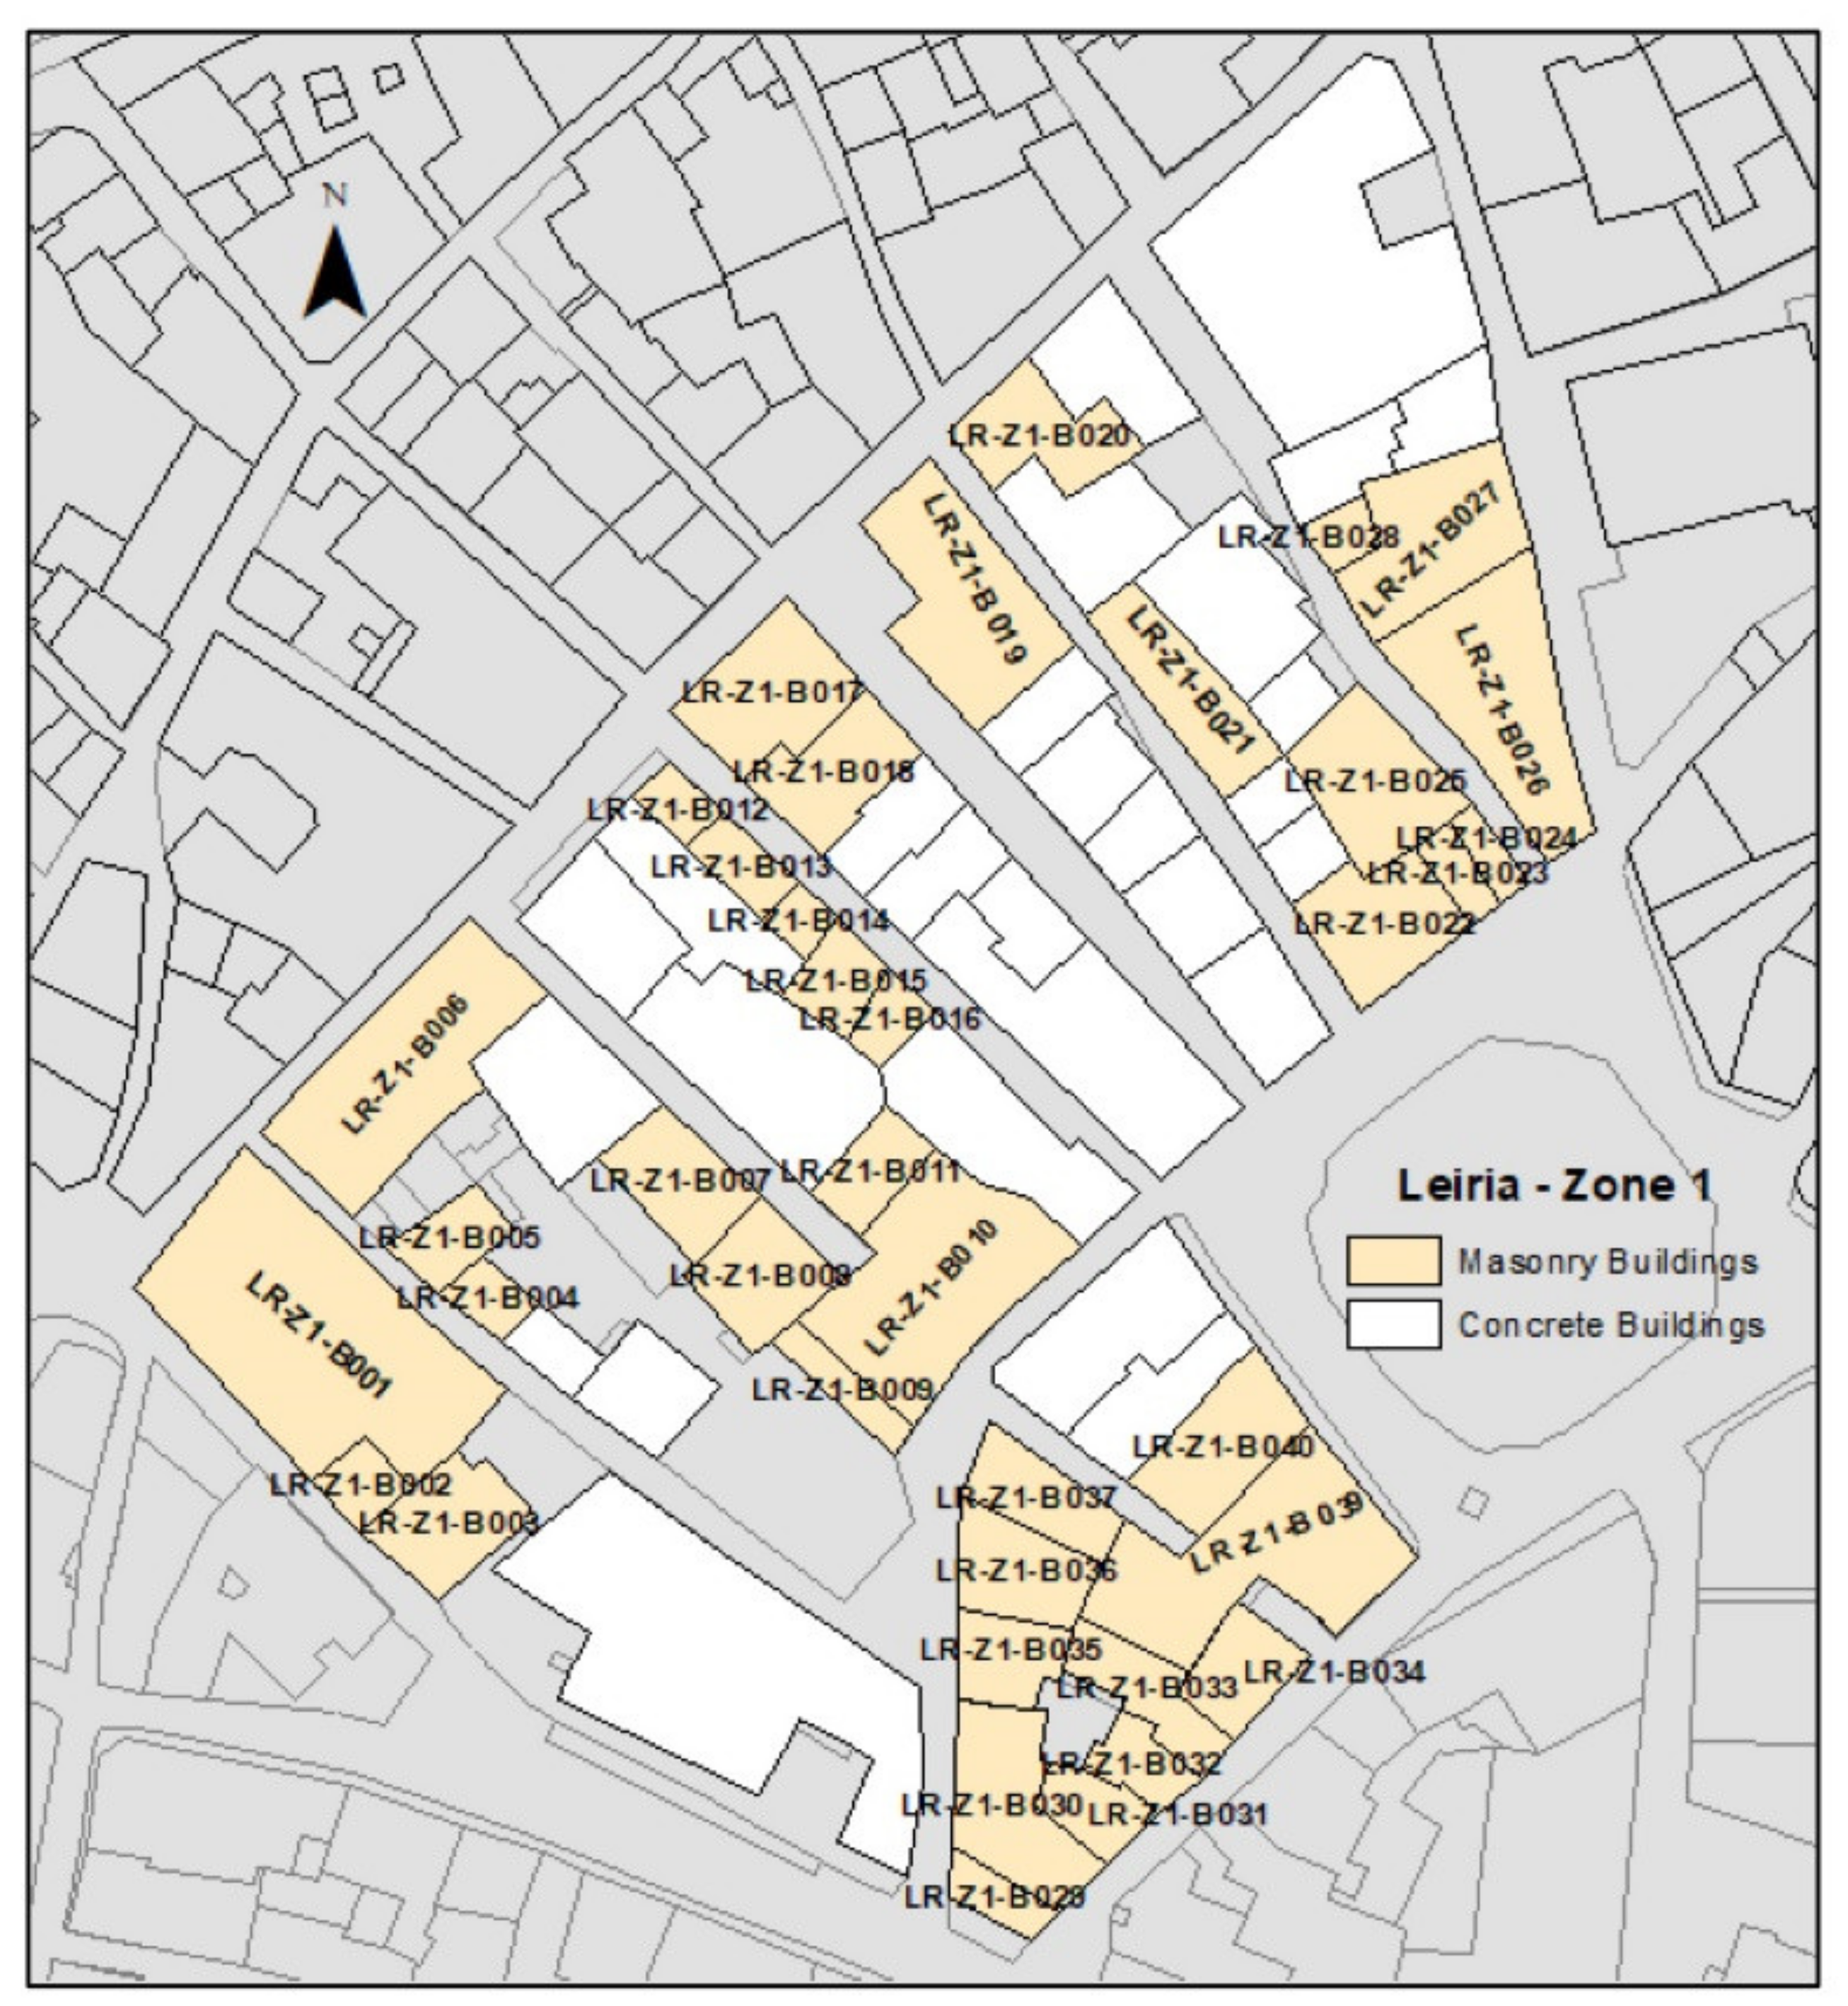
4. The Historic City Centre of Leiria

Both approaches were applied in a set of constructions of the historic city of Leiria, Portugal, located halfway between Coimbra and Lisbon. Considering that Portugal’s mainland is a slow seismic deforming region, significant seismic events are characterized by long return periods, and they are generated by the interaction of the boundary between the African and Eurasian plates. The seismic records of the last 20 years show more than 100 earthquakes with intensities equal to or larger than III in the EMS-98 macroseismic intensity scale [35].
According to maximum intensity maps (MIM) available for Portugal mainland, intensity VII or VIII can be identified as representative of the seismicity of the Teves [35]. The most destructive seismic event in the history of Portugal was the 1755 Lisbon earthquake (8.5 ± 0.3 Mw) [36], which caused great damage in the Algarve and Lisbon regions and was followed by a great tsunami.
The urban configuration developed in relation to the castle and the two landmarks of the main square and the cathedral. The layout of the historic city center is defined by the fundamental axis of Rua Direita, today also known as Rua Barão Viamonte, and 18 related streets branching perpendicularly (Figure 3). A limited region (13,000 m2) of the city was analyzed, corresponding to Zone 1 of the historical center. It is worth emphasizing that this exercise is inspired by the division of the historic center into three zones carried out by [37]. Each zone has its own typological slope.
The slope of Zone 1 is completely flat, whereas Zone 2 is inclined from north to south with a minimum slope of 3% and maximum slope of 23%, and an average of 14%. For Zone 3, two portions are separated by the main street, the southern part is flat, and the northern part has a minimum slope of 14% and a maximum slope of 35% with an average of 23% [37]. Only Zone 1 has been analyzed in this work. In Zone 1 there are 39 masonry buildings. For distinction and organization purposes, all buildings were labeled resorting to a unique code (Figure 4).

5. Assessments and Results

This experience compares the assessment performed by means of web-based images and an in-situ experience, in which a control assessment was completely performed from scratch. The similitudes and divergences are helpful for contextualizing the opportunities and limitations of the web-based images approach. The on-site assessment and its results, from this point on denominated as “reference”, will facilitate the identification of the deviation sources when performing the web-based assessment.

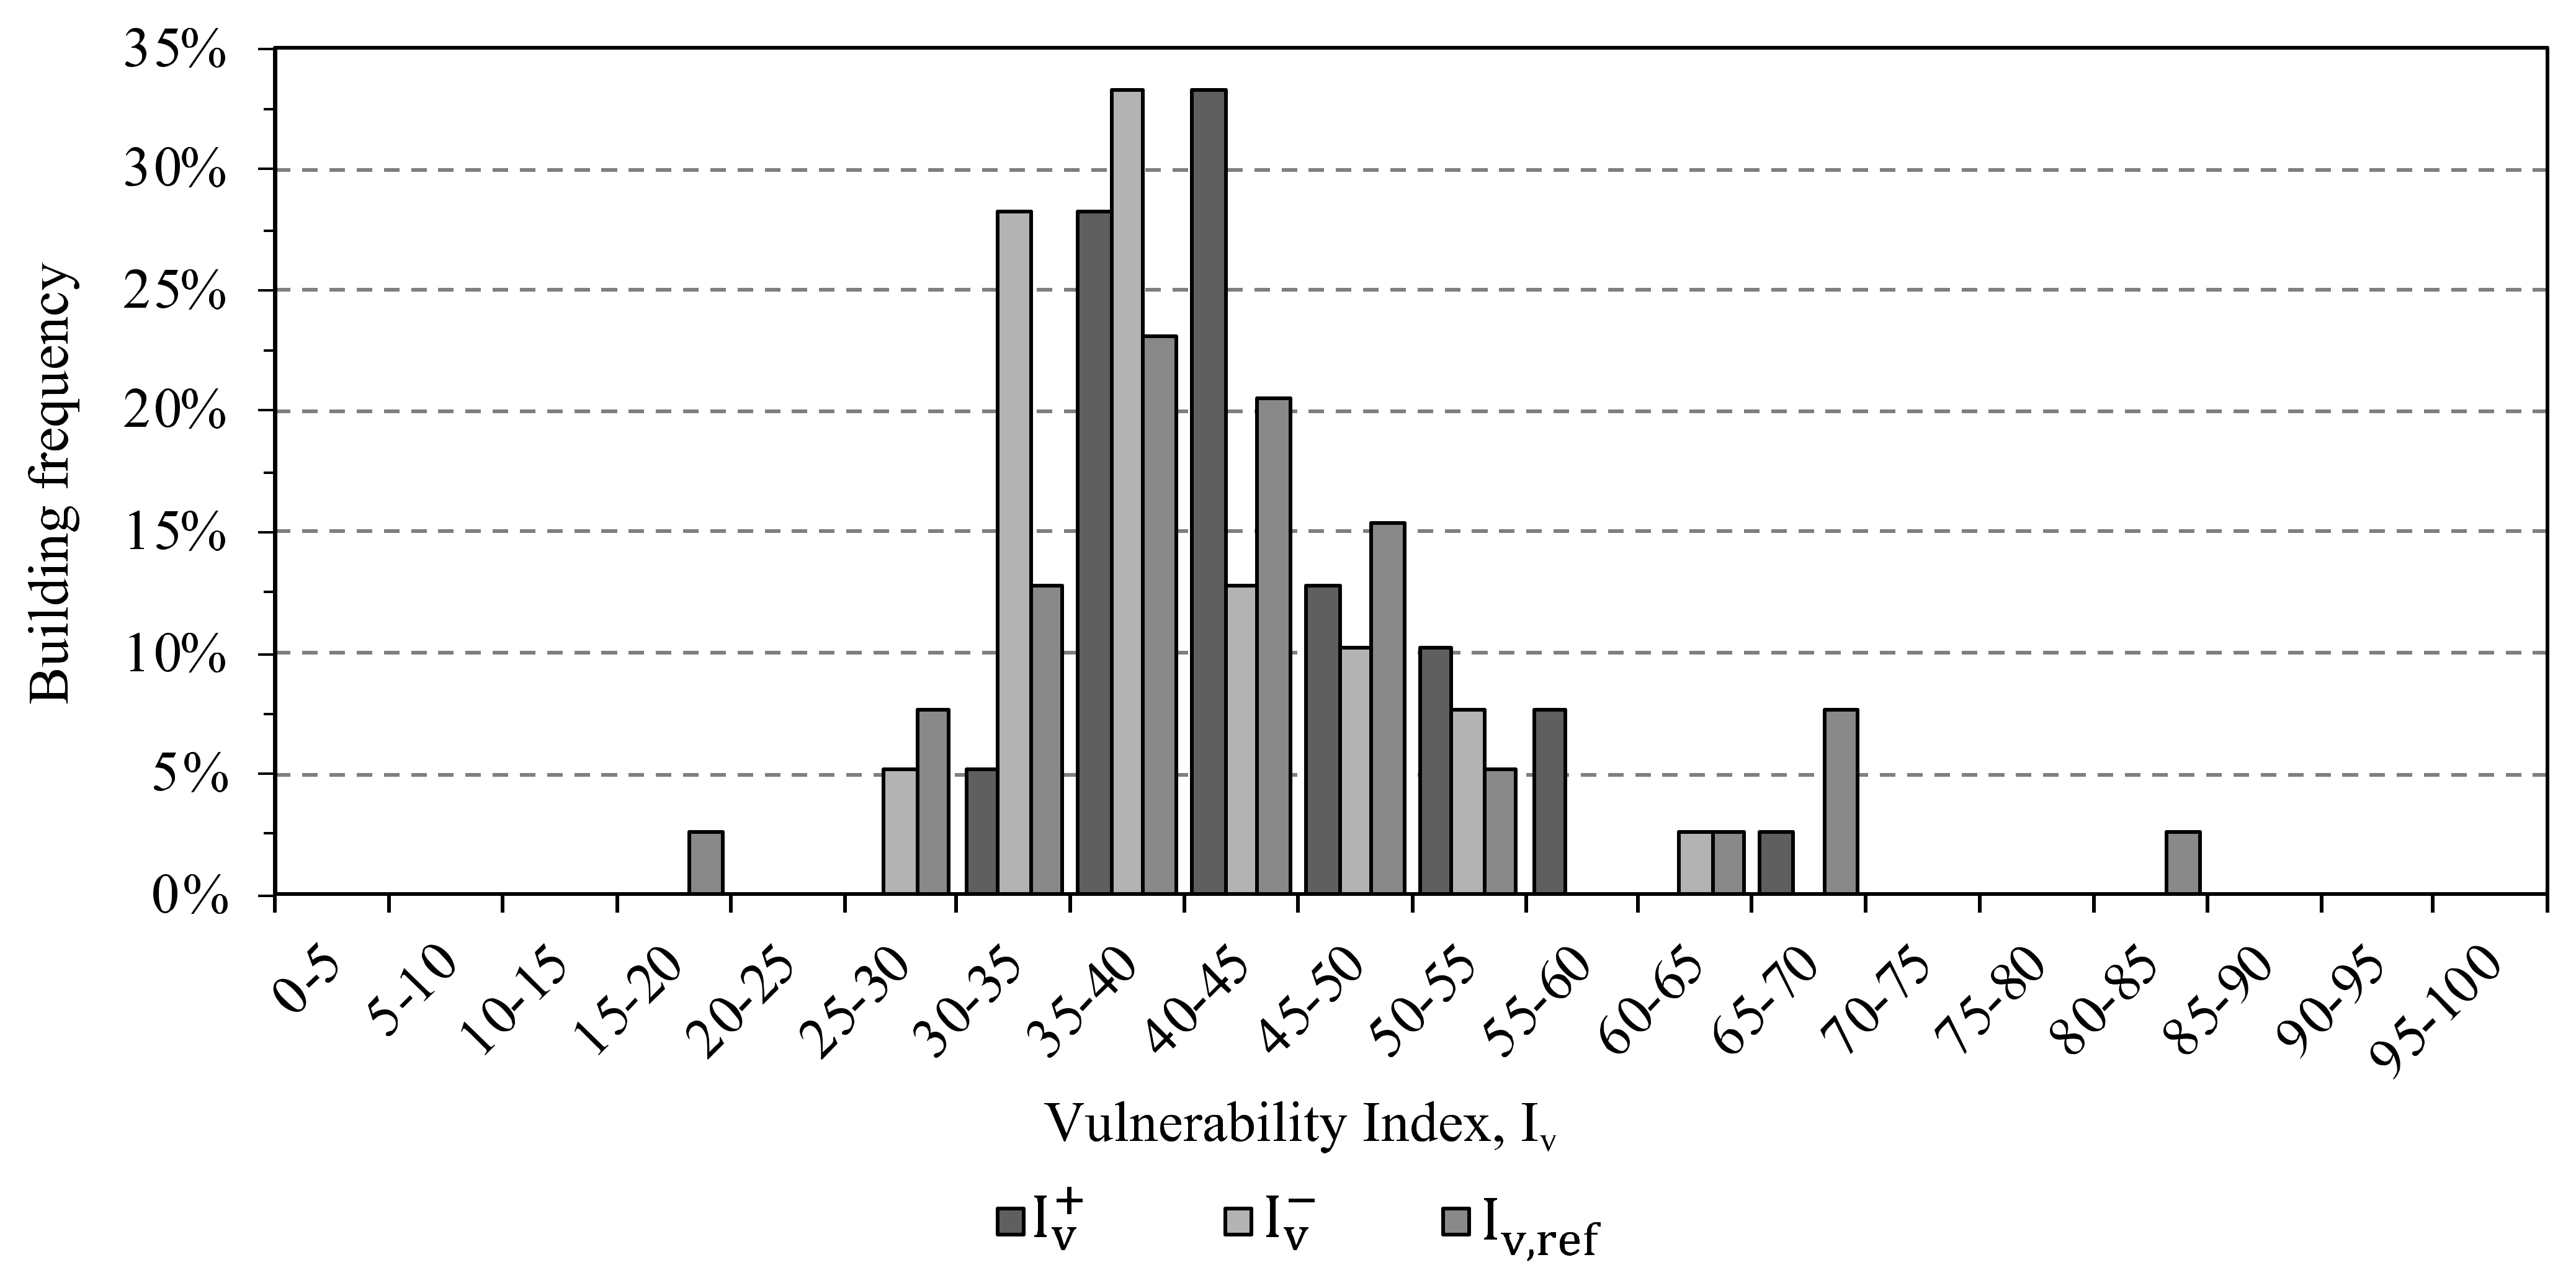
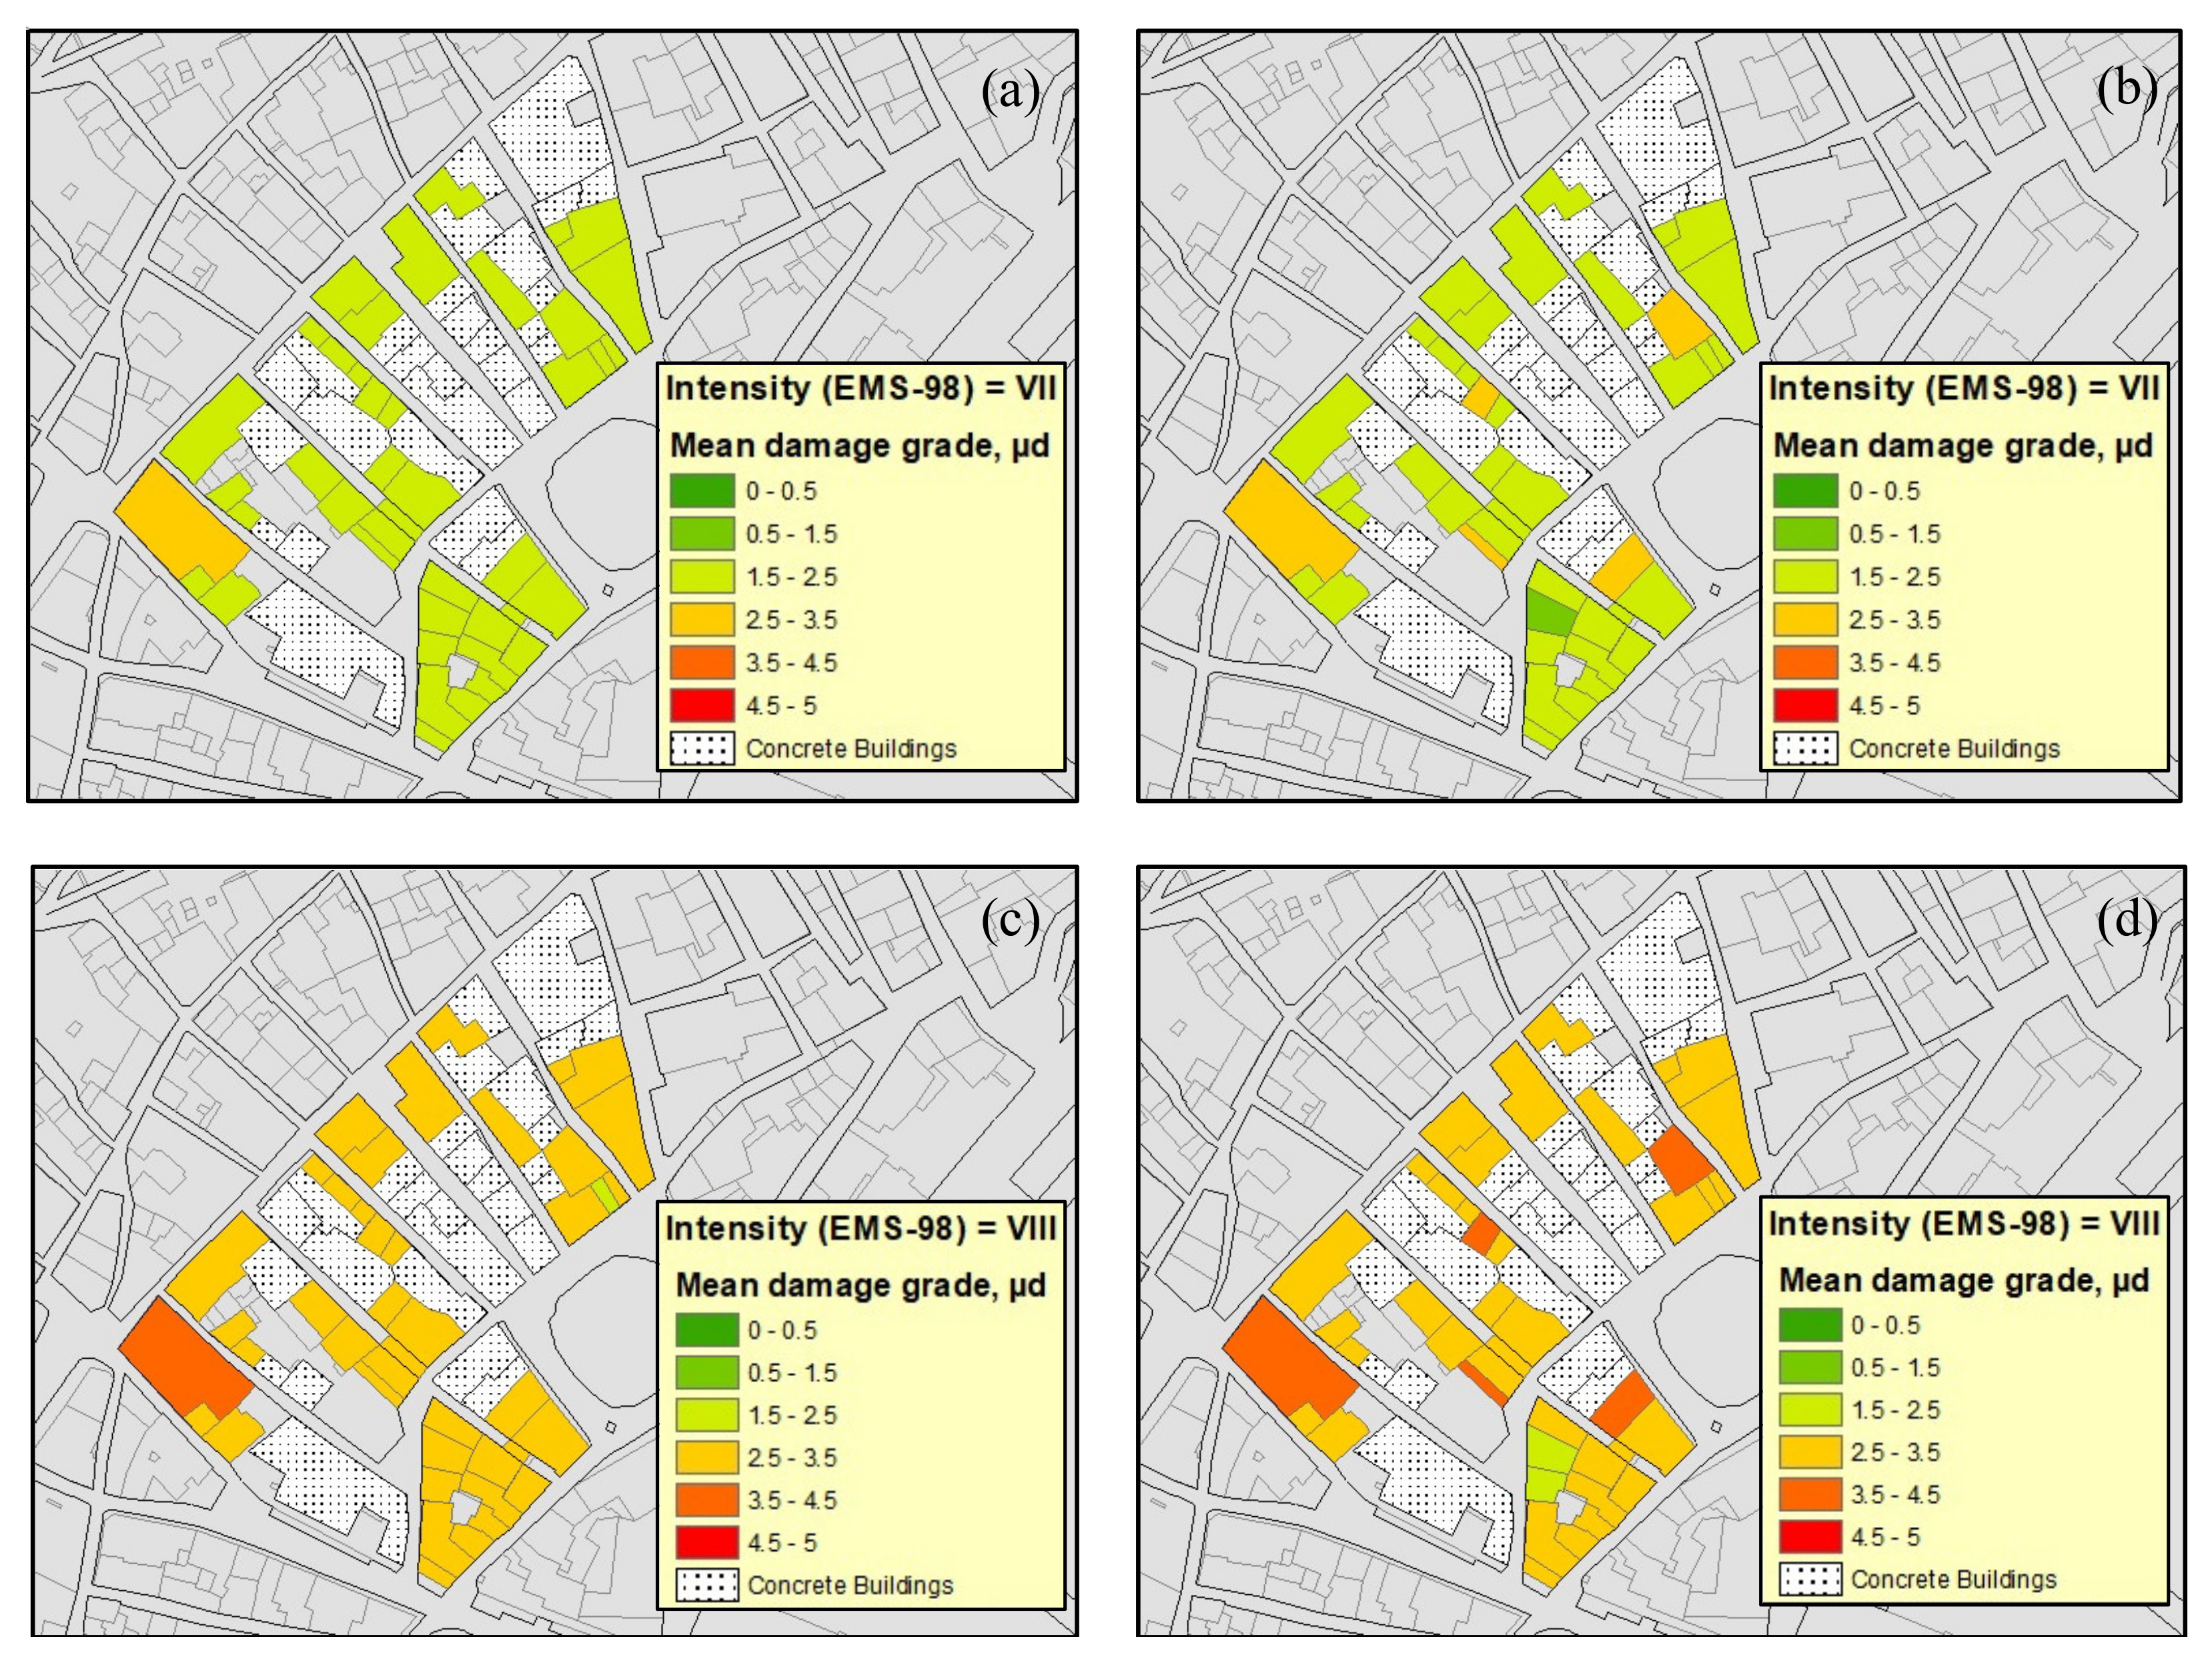
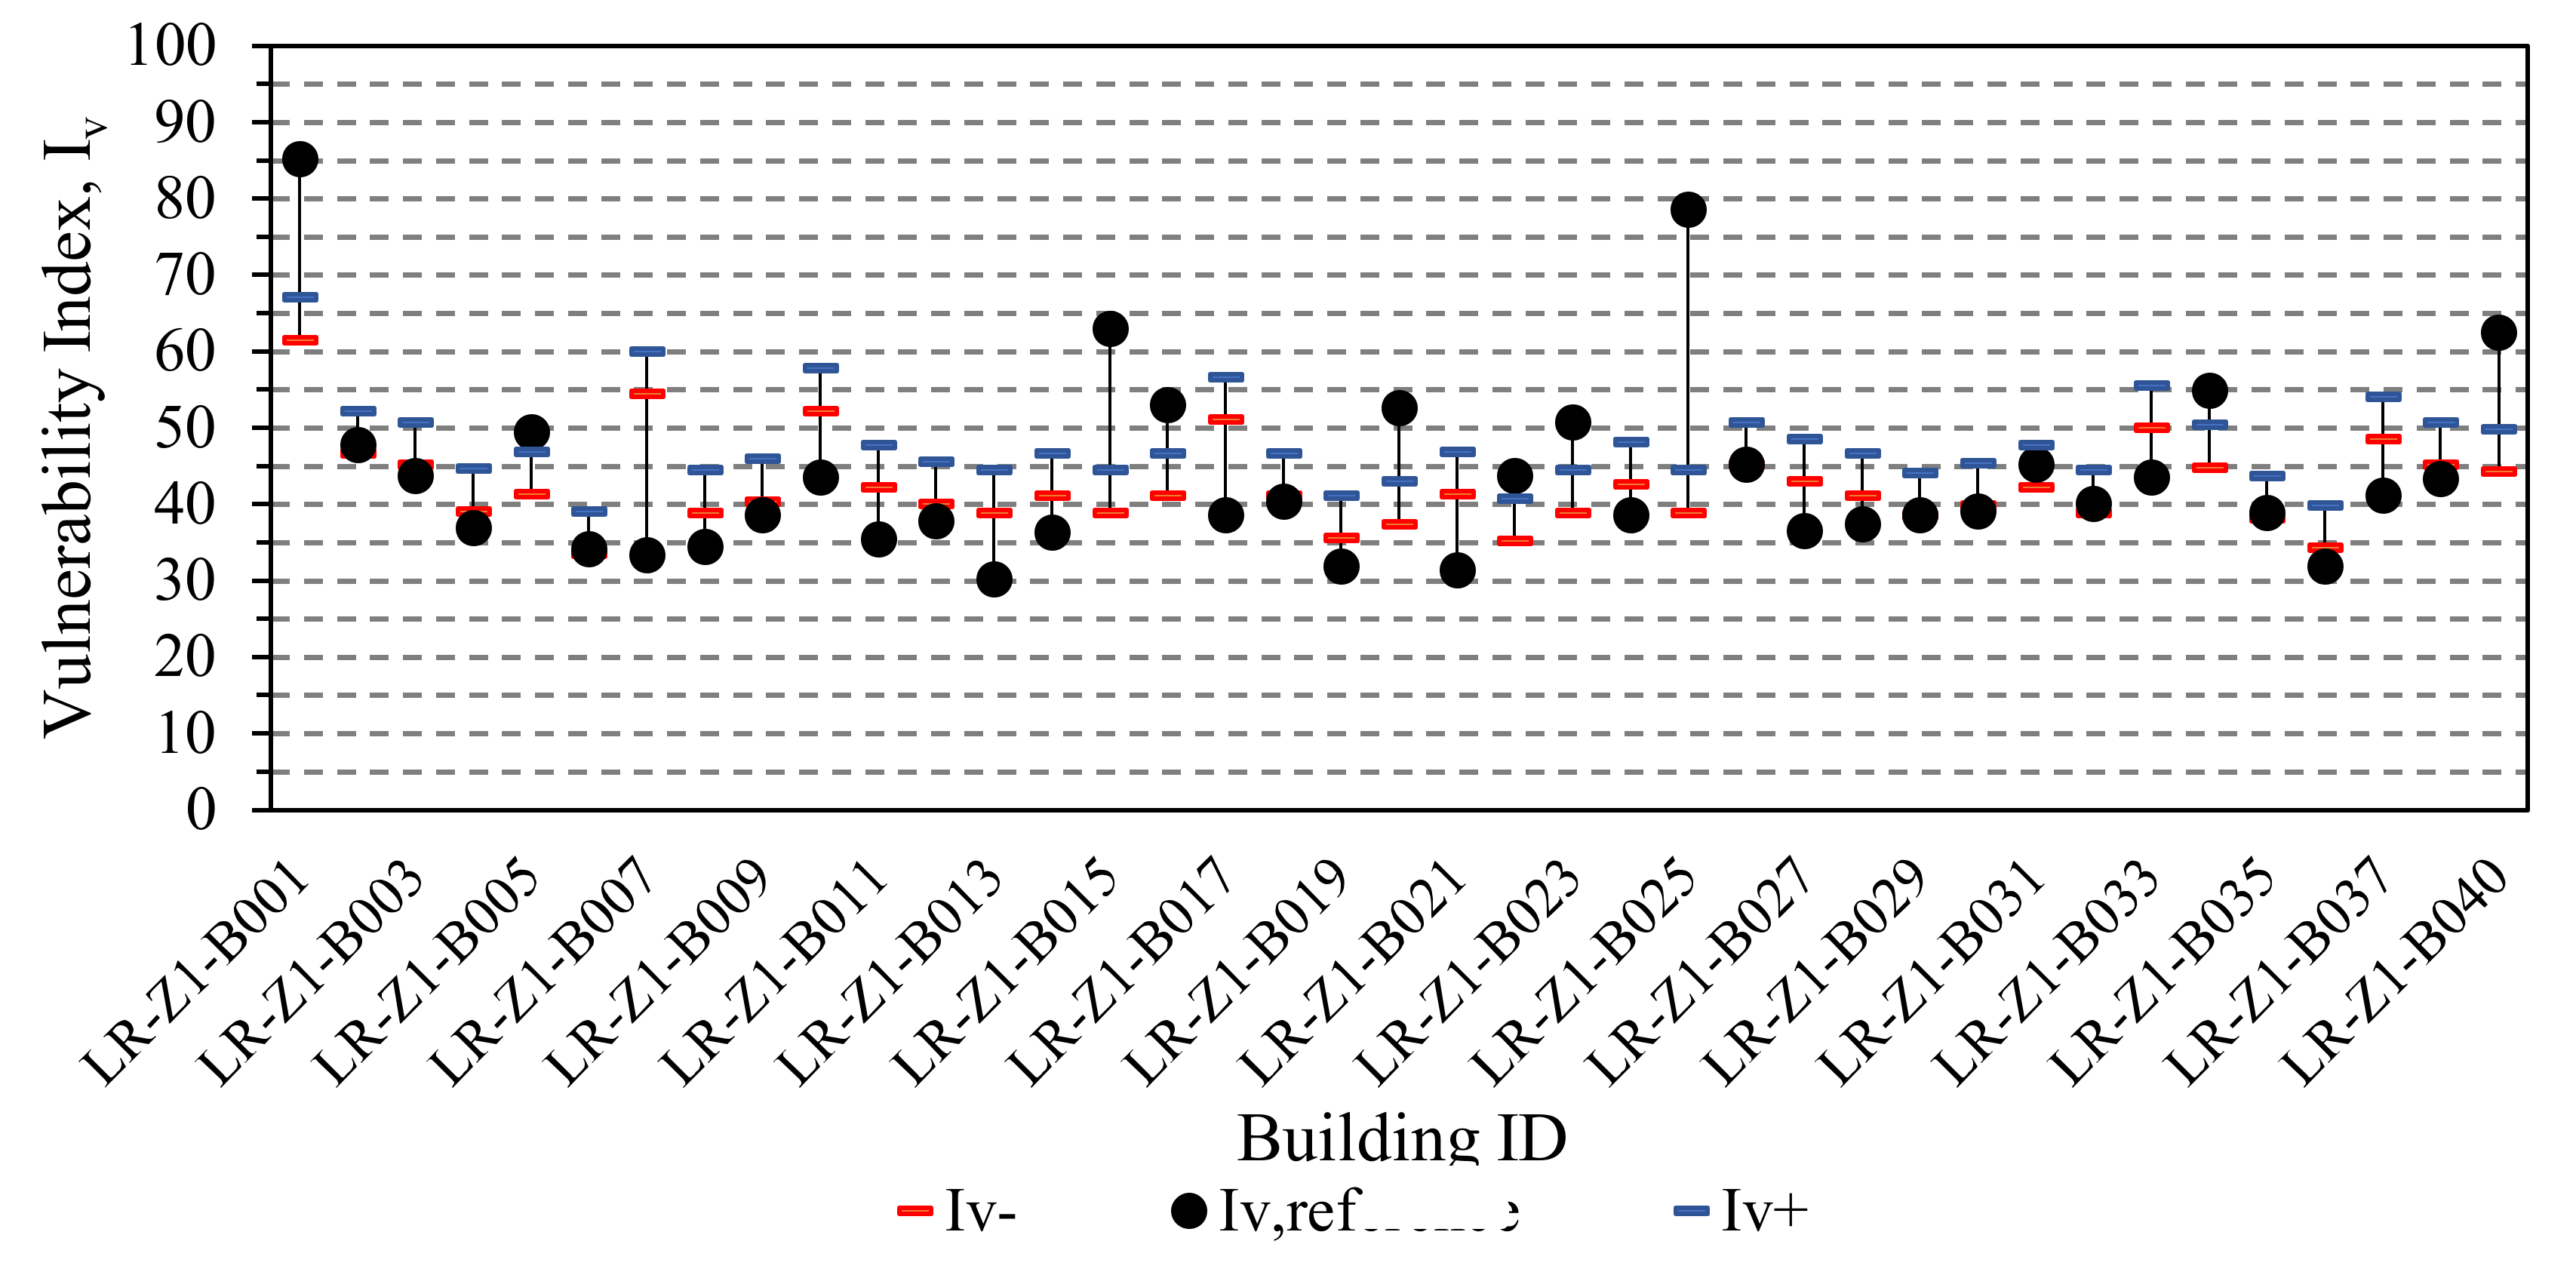
5.1. Building Approach

Some challenges were found while assigning vulnerability classes for the parameters contained in the Vulnerability Index Method. As shown in Figure 5, some parameters were not evaluable for some buildings. This situation was often caused because of a lack of street images. Furthermore, parameter P11 (horizontal diaphragms) is unable to be assessed only from exterior images.
A feasible way for dealing with this uncertainty, inherent to the proposed data-acquisition strategy, is to take an average grade from the effectively assessed buildings for being later used on those that were not completely assessed. For all those parameters that were not evaluated, two approaches were used: assigning two default extreme vulnerability classes, class A and class D, leading respectively to a less and more conservative scenario. Consequently, two values of the vulnerability index were obtained for each building: I v + corresponding to vulnerability class D; and I v corresponding to vulnerability class A. The vulnerability assessment was applied to 39 buildings. As regards the lower limit of the seismic vulnerability index, I v , the average value is 39.15 with a standard deviation of 7.43; approximately 33% of the assessed buildings have a vulnerability index value greater than 40 and about 21% greater than 45. No buildings present a vulnerability index lower than 20. The minimum and maximum values obtained are respectively 25.50 and 60.33. Considering the higher limit of the seismic vulnerability index, I v + , the average value is 44.15 with a standard deviation of 7.43; approximately 67% of the assessed buildings present a vulnerability index value greater than 40 and about 33% greater than 45. No buildings were found to have a vulnerability index lower than 20, and the minimum and maximum values are respectively 30.50 and 65.33.
In order to verify that the data followed a normal distribution, the Shapiro–Wilk test was performed on both groups of Vulnerability Index, I v + and I v . The hypothesis of normality was satisfied, with a value of p-value equal to 0.06 for both cases and therefore higher than α = 0.5, assigned level of significance. The graphical representation of the frequency distribution of the reference vulnerability index Iv,ref (corresponding to the vulnerability classes that were assessed on-site) and the comparison with higher and lower values computed, I v + and I v , are presented in Figure 6.
It is worth noticing that the extreme assessments (i.e., I v + , and I v ) are more concentrated than the Iv,ref values. The average reference value Iv is equal to 42.88, and therefore, it fits well in the calculated range of 39.15–44.15. The standard deviation value obtained herein is quite different from the reference one, 7.43 and 12.74, respectively.
Figure 7 illustrates the divergences found among the parameters that were effectively assessed by means of web-based images when compared to the on-site survey. It shows the proportion of web-based assessments that were conservative, non-conservative, and equal to the assessments performed in-situ. In most cases, the vulnerability classes assigned during the web-based survey correspond to those considered in the reference survey. Attention must be paid to the selection of the vulnerability class for Parameter 6 since this parameter is associated with the soil classification according to relevant National and International seismic design codes. Geological and geotechnical data can be retrieved by documents and data distributed by public administration but can also be estimated by means of the analysis of the topographical slope of the soil surface [38]. This methodology is certainly useful and validated at a large scale, but it can present some limitations in urbanized areas, where a more careful analysis of the built and natural environment must be carried out. In the case of the investigated area, it is worth noting that the area is characterized by a flat soil surface pointing out an alluvial subsoil generated by the floods of the nearby Lis river. Based on this, a “loose soil without impulse and without rock foundation”, Type D according to Eurocode 8 classification [39], was considered, differentiating on this point the work from a preceding one that referred to the same area [37].
The graph given in Figure 8 shows, for each building, the relationships between the reference and herein obtained vulnerability indexes.
Around 64% of the buildings resulted in a range of vulnerability index values that is higher or coincident with the reference value. The graph given in Figure 9 presents the percentages of the cases in which the reference vulnerability index falls within the computed range (more and less conservative scenario, I v + , and I v ) and in which the same range of values is more or less conservative than the reference value. The GIS application software adopted in this study was ESRI ArcMap 10.8.1 [40].
The next phase was the operational implementation of the methodology of the Vulnerability Index. Bernardini et al. [41] proposed an analytical expression that correlates hazard with the mean damage grade (0 < µD < 5) of the damage distribution in terms of the vulnerability value, as shown in Equations (3) and (4).
µ D = a + b tanh I + cV d Q ×   f V , I
f V , I = e V 2 I 7 , if     I 7 1 , if     I > 7
where:
  • a, b, c, and d are constant values 2.5, 3.0, 6.25, and 12.7, respectively, as per Bernardini et al. [41].
  • I = seismic hazard described in terms of macroseismic (MMI) intensity.
  • V = vulnerability index obtained from the normalized IV index (Equation (5)).
  • Q = ductility factor (1 ≤ Q ≤ 4). Following the calibration made by (Ferreira et al., 2014), a value of Q = 2.0 was herein assumed.
  • f (V, I) = is a function depending on the vulnerability index and intensity.
The vulnerability index Iv can be related to the vulnerability index V through the following equation:
V = 0.592 + 0.0057 ×   I v
Following the above-presented analytical formulation, it is possible to obtain damage curves for a given IV that represent a certain damage grade µD expected to occur because of a seismic event of a given macroseismic intensity. This damage grade represents a minimum value of 0 that represents no damage at all and a maximum value of 5, representing the total collapse of the structure. Figure 10 presents the construction of the curves for the mean I v + , I v and Iv,ref found throughout the sample. The reference vulnerability curve fits within the range of the two curves calculated in the previous section.
The mean damage grade µD corresponding to the mean of the I v + , I v values of each building (from now named “central value”) was used in the following analysis. The mean damage grade µD was computed for two classes of macroseismic intensity (VII, VIII), for each building, and both for the central and the reference value of the vulnerability index. The comparison between the results obtained in this work is given through the GIS map of Figure 11. The values of the mean damage grade µD computed were grouped into six classes, corresponding to the damage levels (Figure 12).

5.2. Façade Approach

An alternative way to estimate the seismic performance of existing masonry buildings moves from the idea that intrinsic features of the structure often prevent the box behavior under lateral loads. As a consequence, local mechanisms [42] play a key role in the definition of the vulnerability index. Performance estimation based on local mechanisms is herein addressed as façade approach, FA. All the buildings were analyzed under this specific assumption, and the corresponding Seismic Vulnerability Index, Iv, was computed. The procedure is like that presented in Section 5.1 but moves from a set of specific parameters identified in Table 5, as discussed in Section 3.1 (Figure 13). The challenges observed in the implementation of the building approach were present when performing this assessment, namely due to the lack of street images.
As in the building approach, a vulnerability class corresponding to the average value obtained from the assessed classes was assigned to the parameters for each bit of information that is missing. As regards parameters P8 and P10, since it is not possible to evaluate the vulnerability class with a web tool, two values of the vulnerability index were obtained for each building: I v + , corresponding to vulnerability class D and I v , corresponding to vulnerability class A. Sixty-five building façade walls were analyzed. The lower limit of the seismic vulnerability index I v shows an average value equal to 42.34 with a standard deviation of 5.71; approximately 59% of the assessed façade walls have a vulnerability index value greater than 40 and about 26% greater than 45. No façade walls present a vulnerability index lower than 20. The calculated values are within the range 33.52–61.48. The higher limit of the seismic vulnerability I v + presents an average value equal to 47.90 and a standard deviation of 5.71; about 95% of the assessed façade walls present a vulnerability index value greater than 40 and about 64% greater than 45. No façade walls have a vulnerability index lower than 20; the minimum and maximum values are respectively 39.07 and 67.04.
The Shapiro–Wilk test was performed on both groups of Vulnerability Index, I v + and I v . The hypothesis of normality was not satisfied, with a value of p-value equal to 0.01 for both cases and therefore lower than α = 0.5, assigned level of significance (Figure 14). The graphical representation of the frequency distribution of the reference vulnerability index Iv,ref, and the comparison with higher and lower values computed, I v + and I v , are presented in Figure 15. Once again, the results of this work are more concentrated than the reference values.
The average reference value (42.42) is close to the lower bound of the calculated range of 42.34–47.90. The standard deviation value obtained herein is quite different from the reference one, 5.71 and 12.79, respectively. Figure 16 presents the ratio between the reference (in-situ survey) and the evaluation classes of the vulnerability parameters.
These results are coherent with the building approach. In fact, 6 of the 13 parameters evaluated show a compatible vulnerability class. The vulnerability classes assigned in this work are the same as those calculated in the reference work. The graph in Figure 16 presents the relationship between the computed and the reference values. It is important to note that each building was assigned the maximum vulnerability index value computed considering all the relative façades. Approximately 74% of the buildings show a vulnerability index value higher or coincident with the reference value (Figure 17).
The Vulnerability Index for the façade walls was calculated using Equations (3) and (4), and adopting the following coefficients: a = 2.51, b = 2.5, c = 5.25, and d = 11.6; and a ductility factor Q = 2.0, as recommended by Ferreira et al. [43]. The application of this analytical formulation led to the following vulnerability curves: the upper and the lower average value of the vulnerability index distribution are plotted side-by-side with the reference vulnerability curve.
The reference vulnerability curve fits within the two computed vulnerability curves, such as for the building approach. The central value of the range of vulnerability index was used in the following analysis and shown in Figure 18. The mean damage grade µD was computed for two classes of macroseismic intensity (VII, VIII) and compared with the reference value of vulnerability index distribution (Figure 19 and Figure 20).

6. Final Remarks

The present paper reported the main results of an investigation on the feasibility of structural surveys for seismic vulnerability assessment of masonry buildings inside historical centers based on web-mapping platforms. The latter is becoming more and more sophisticated and widespread, thus offering opportunities to the technical community and decision-makers to improve their knowledge and awareness about the current conditions and the level of vulnerability of the building stocks under their administration.
The investigation reported herein started from selecting key structural data among those selected by well-established traditional vulnerability and seismic damage survey forms concerning buildings made of masonry.
The capabilities of available web-mapping platforms in supporting quantitative seismic performance assessments were checked first against the number of surveyable data and then the level of accuracy and reliability of the vulnerability estimations achieved by using available methods of analysis.
A benchmark study conducted on a selected portion of the Historic City Centre of Leiria, Portugal, was illustrated, and the results associated with data obtained from virtual surveys were compared with those provided by traditional on-site survey actions.
The main outcomes of the assessment can be briefly summarized as follows:
  • The global and local nature of the structural parameter of interest represents the main limitation to the completeness of the survey and the presence of undetectable parameters.
  • The availability of pictures of the buildings from different viewpoints, not necessarily aerial, improves the capabilities of the platforms.
  • Among the assessed web-mapping platforms, those belonging to the family of Google LLC exhibited superior performance, with or without additional information related to the building.
  • The integration of data coming from the web-mapping platforms and the structural knowledge associated with the technical literature and the reconnaissance reports from past earthquakes leads to reasonable and usable results.
  • The uncertainties associated with the use of remote sensing platforms can be accounted for by relaxing the requirement of classifying the buildings according to single classes of vulnerability. Conversely, the generation of a lower and an upper class represents an effective guide towards a rational distribution of the resources to be allocated to manage structural risk in extended urban areas.

Author Contributions

Conceptualization, T.M.F. and P.B.L.; methodology, T.M.F. and P.B.L.; formal analysis, C.C.; data curation, T.M.F.; writing—original draft preparation, C.C. and G.F.; writing—review and editing, T.M.F., G.F. and R.R.E.; supervision, T.M.F., P.B.L. and G.F.; funding acquisition, P.B.L. and G.F. All authors have read and agreed to the published version of the manuscript.

Funding

This research received no external funding.

Institutional Review Board Statement

Not applicable.

Informed Consent Statement

Not applicable.

Data Availability Statement

The datasets generated and analyzed during the current study are available from the corresponding author on reasonable request.

Conflicts of Interest

The authors declare no conflict of interest.

Abbreviations

RVSRapid Visual Screening
RViSITSRapid Visual Survey by Institut Teknologi Sepuluh Nopember
ML-EHSAPPMachine Learning-based Earthquake Hazard Safety Assessment of buildings via smartphone App
LOG-IDEAHLOGic trees for Identification of Damage due to Earthquakes for Architectural Heritage
FASTFabbricati per l’Agibilità Sintetica post-Terremoto–Buildings for synthetic post-earthquake usability
AeDES“Agibilità e Danno nell’Emergenza Sismica”-Usability and damage in the seismic emergency)
CARTIS“CARatterizzazione TIpologico-Strutturale dei comparti urbani costituiti da edifici ordinari”
MIMMaximum Intensity Maps
GISGeographical Information System

References

  1. Dolce, M.; Goretti, A. Building damage assessment after the 2009 Abruzzi earthquake. Bull. Earthq. Eng. 2015, 13, 2241–2264. [Google Scholar] [CrossRef]
  2. Dolce, M.; Speranza, E.; Giordano, F.; Borzi, B.; Bocchi, F.; Conte, C.; Di Meo, A.; Faravelli, M.; Pascale, V. Observed damage database of past Italian earthquakes: The Da.D.O. WebGIS. Bollettino di Geofisica Teorica ed Applicata 2019, 60, 141–164. [Google Scholar]
  3. Calvi, G.M.; Pinho, R.; Magenes, G.; Bommer, J.J.; Restrepo-Vélez, L.F.; Crowley, H. Development of seismic vulnerability assessment methodologies over the past 30 years. ISET J. Earthq. Technol. 2006, 43, 75–104. [Google Scholar]
  4. Marra, A.; Sabino, A.; Bartolomucci, C.; Trizio, I.; Mannella, A.; Fabbrocino, G. On a Rational and Interdisciplinary Framework for the Safety and Conservation of Historical Centres in Abruzzo Region. Int. J. Archit. Herit. 2019, 15, 608–626. [Google Scholar] [CrossRef]
  5. Marcari, G.; Fabbrocino, G. Seismic assessment of Oratino historical urban area. In Strategies for Reduction of the Seismic Risk; Fabbrocino, G., Santucci, F., Eds.; Structural and Geotechnical Dynamic Laboratory: Ripalimosani, Italy, 2008. [Google Scholar]
  6. Ricci, P.; Verderame, G.M.; Manfredi, G.; Pollino, M.; Borfecchia, F.; De Cecco, L.; Martini, S.; Pascale, C.; Ristoratore, E.; James, V. Seismic Vulnerability Assessment Using Field Survey and Remote Sensing Techniques BT. In Computational Science and Its Applications—ICCSA 2011; Murgante, B., Gervasi, O., Iglesias, A., Taniar, D., Apduhan, B.O., Eds.; Springer: Berlin/Heidelberg, Germany, 2011; pp. 109–124. [Google Scholar]
  7. Wieland, M.; Pittore, M.; Parolai, S.; Zschau, J.; Moldobekov, B.; Begaliev, U. Estimating building inventory for rapid seismic vulnerability assessment: Towards an integrated approach based on multi-source imaging. Soil Dyn. Earthq. Eng. 2012, 36, 70–83. [Google Scholar] [CrossRef]
  8. Anniballe, R.; Chini, M.; Pierdicca, N.; Bignami, C.; Stramondo, S.; Noto, F.; Scalia, T.; Martinelli, A.; Mannella, A. Detecting earthquake damage in urban area: Application to COSMO-SkyMed imagery of L’Aquila earthquake. SAR Image Anal. Model. Tech. XV 2015, 9642, 96420C. [Google Scholar] [CrossRef]
  9. Marra, A.; Fabbrocino, G. Open-access web mapping as a virtual survey tool for cultural heritage: An application to the Armenian religious architecture documented by Paolo Cuneo. Disegnarecon 2020, 13, 7. [Google Scholar] [CrossRef]
  10. Shah, M.F.; Ahmed, A.; Kegyes, O.; Al-Ghamadi, A.; Ray, R. A Case Study Using Rapid Visual Screening Method to Determine the Vulnerability of Buildings in two Districts of Jeddah, Saudi Arabia. In Proceedings of the 15th International Symposium on New Technologies for Urban Safety of Mega Cities in Asia, Tacloban, Philippines, 7–9 November 2016. [Google Scholar]
  11. Kassem, M.M.; Beddu, S.; Ooi, J.H.; Tan, C.G.; Mohamad El-Maissi, A.; Mohamed Nazri, F. Assessment of Seismic Building Vulnerability Using Rapid Visual Screening Method through Web-Based Application for Malaysia. Buildings 2021, 11, 485. [Google Scholar] [CrossRef]
  12. Riyanto, W.; Irawan, D.; Joko Wahyu Adi, T.; Iranata, D.; Rizki Amalia, A. Earthquake Vulnerability Assessment of High-Rise Buildings in Surabaya using RViSITS Android Application. IOP Conf. Ser. Mater. Sci. Eng. 2020, 739, 012040. [Google Scholar] [CrossRef]
  13. IŞIK, M.; IŞIK, E.; HARİCİHİAN, E. Application of IOS/Android Rapid Evaluation of Post-Earthquake Damages in Masonry Buildings. Gazi J. Eng. Sci. 2021, 7, 36–50. [Google Scholar] [CrossRef]
  14. Harirchian, E.; Jadhav, K.; Kumari, V.; Lahmer, T. ML-EHSAPP: A prototype for machine learning-based earthquake hazard safety assessment of structures by using a smartphone app. Eur. J. Environ. Civ. Eng. 2021, 2021, 1892829. [Google Scholar] [CrossRef]
  15. Novelli, V.I.; D’Ayala, D. LOG-IDEAH: LOGic trees for identification of damage due to earthquakes for architectural heritage. Bull. Earthq. Eng. 2015, 13, 153–176. [Google Scholar] [CrossRef]
  16. Mannella, A.; Fabbrocino, G. Una lettura dell’evoluzione delle procedure di rilievo del danno e sull’agibilità degli edifici ordinari nell’emergenza post-sisma. In Proceedings of the 39th GNTS Congress, Rome, Italy, 22–24 June 2021. [Google Scholar]
  17. Angeli, P.; Clementi, C.; De Mutiis, D.; Cagnizi, M.; Baldin, R.; Ferro, E.; Fedeli, C.; Nazionale, D. Il Coordinamento dall’emergenza al post sisma: L’esperienza dell’Associazione Ingegneri per la Prevenzione e le Emergenze [Coordination from the emergency to post-earthquake: The experience of the Association Engineers for the Prevention and Emerge]. Progettazione Sismica 2017, 8, 109–124. [Google Scholar] [CrossRef]
  18. Department of Civil Protection (DPC). Manuale per la Compilazione della Scheda di Primo Livello di Rilevamento di Danno, Pronto Intervento e Agibilità per Edifici Ordinari nell’Emergenza Post-Sismica (AeDES), 2nd ed.; Dolce, M., Papa, F., Pizza, A.G., Eds.; Dipartimento della Protezione Civile: Rome, Italy, 2014. [Google Scholar]
  19. Civerra, C.; Lemme, A.; Cifani, G. (Eds.) Strumenti per il Rilievo del Danno e della Vulnerabilità Sismica dei Beni Culturali; Tipografia Lampo: Campobasso, Italy, 2007. [Google Scholar]
  20. Zuccaro, G.; Dolce, M.; De Gregorio, D.; Speranza, E.; Moroni, C. La scheda CARTIS per la caratterizzazione tipologico- strutturale dei comparti urbani costituiti da edifici ordinari. Valu-tazione dell’esposizione in analisi di rischio sismico. In Proceedings of the 35th GNTS Congress, Trieste, Italy, 17–19 November 2015. [Google Scholar]
  21. HERE WeGo. Available online: https://wego.here.com/?x=ep&map=41.1337,16.85,10,normal (accessed on 28 November 2021).
  22. Google Maps. Available online: https://www.google.it/maps (accessed on 28 November 2021).
  23. Khan, A.; Chatterjee, S.; Filho, W.L.; Khatun, R.; Dinda, A.; Minhas, A. City-scale Modeling of Urban Heat Islands for Kolkata. In Climate Change Management; Springer: Berlin, Germany, 2020; pp. 89–133. [Google Scholar]
  24. Microsoft Inc. Bing Maps. Available online: https://www.bing.com (accessed on 28 November 2021).
  25. Mapillary. Available online: https://www.mapillary.com/ (accessed on 28 November 2021).
  26. KartaView. Available online: https://kartaview.org/landing (accessed on 28 November 2021).
  27. Yandex Yandex.Maps. Available online: www.yandex.com (accessed on 28 November 2021).
  28. Vicente, R. Estratégias e metodologias para intervenções de reabilitação urbana. In Avaliação da Vulnerabilidade e do Risco Sísmico do Edificado da Baixa de Coimbra; Universidade de Aveiro: Aveiro, Portugal, 2008. [Google Scholar]
  29. Ferreira, T.M.; Vicente, R.; Mendes da Silva, J.A.R.; Varum, H.; Costa, A. Seismic vulnerability assessment of historical urban centres: Case study of the old city centre in Seixal, Portugal. Bull. Earthq. Eng. 2013, 11, 1753–1773. [Google Scholar] [CrossRef]
  30. Ferreira, T.M.; Maio, R.; Vicente, R. Seismic vulnerability assessment of the old city centre of Horta, Azores: Calibration and application of a seismic vulnerability index method. Bull. Earthq. Eng. 2017, 15, 2879–2899. [Google Scholar] [CrossRef]
  31. Vicente, R.S.; Mendes da Silva, J.A.R.; Varum, H. Seismic vulnerability assessment of buildings in the old city centre of Coimbra. In Proceedings of the International Conference 250th Anniversary of the 1755 Lisbon Earthquake, Lisbon, Portugal, 1–4 November 2005; pp. 1–4. [Google Scholar]
  32. Maio, R.; Estêvão, J.M.C.; Ferreira, T.M.; Vicente, R. Casting a new light on the seismic risk assessment of stone masonry buildings located within historic centres. Structures 2020, 25, 578–592. [Google Scholar] [CrossRef]
  33. Ferreira, T.M.; Costa, A.A.; Vicente, R.; Varum, H. A simplified four-branch model for the analytical study of the out-of-plane performance of regular stone URM walls. Eng. Struct. 2015, 83, 140–153. [Google Scholar] [CrossRef]
  34. Ferreira, T.M.; Maio, R.; Costa, A.A.; Vicente, R. Seismic vulnerability assessment of stone masonry façade walls: Calibration using fragility-based results and observed damage. Soil Dyn. Earthq. Eng. 2017, 103, 21–37. [Google Scholar] [CrossRef]
  35. Teves-Costa, P.; Batlló, J.; Matias, L.; Catita, C.; Jiménez, M.J.; García-Fernández, M. Maximum intensity maps (MIM) for Portugal mainland. J. Seismol. 2019, 23, 417–440. [Google Scholar] [CrossRef]
  36. Fonseca, J.F.B.D. A Reassessment of the Magnitude of the 1755 Lisbon Earthquake. Bull. Seismol. Soc. Am. 2020, 110, 1–17. [Google Scholar] [CrossRef]
  37. Anglade, E.; Giatreli, A.-M.; Blyth, A.; Di Napoli, B.; Parisse, F.; Namourah, Z.; Rodrigues, H.; Ferreira, T.M. Seismic damage scenarios for the Historic City Center of Leiria, Portugal: Analysis of the impact of different seismic retrofitting strategies on emergency planning. Int. J. Disaster Risk Reduct. 2020, 44, 101432. [Google Scholar] [CrossRef]
  38. Wald, D.J.; Allen, T.I. Topographic Slope as a Proxy for Seismic Site Conditions and Amplification. Bull. Seismol. Soc. Am. 2007, 97, 1379–1395. [Google Scholar] [CrossRef] [Green Version]
  39. Hong, J.Y.; Ahmad, S.W.; Adnan, A.; Muthusamy, K.; Ariffin, N.F.; Yahaya, F.M.; Syed Mohsin, S.M. Seismic performance and cost analysis for reinforced concrete school building under different type of soil. Phys. Chem. Earth Parts A/B/C 2020, 120, 102933. [Google Scholar] [CrossRef]
  40. Esri Support ArcMap 10.8 (10.8.1). Available online: https://support.esri.com/en/Products/Desktop/arcgis-desktop/arcmap/10-8-1 (accessed on 28 November 2021).
  41. Bernardini, A.; Giovinazzi, S.; Lagomarsino, S.; Parodi, S. The vulnerability assessment of current buildings by a macroseismic approach derived from the EMS-98 scale. In Proceedings of the 3rd Congreso National de Ingeniería Sismíca, Girona, Spain, 8–11 May 2007; pp. 1–15. [Google Scholar]
  42. Lourenço, P.B.; Mendes, N.; Ramos, L.F.; Oliveira, D.V. Analysis of Masonry Structures Without Box Behavior. Int. J. Archit. Herit. 2011, 5, 369–382. [Google Scholar] [CrossRef]
  43. Athmani, A.E.; Gouasmia, A.; Ferreira, T.M.; Vicente, R.; Khemis, A. Seismic vulnerability assessment of historical masonry buildings located in Annaba city (Algeria) using non ad-hoc data survey. Bull. Earthq. Eng. 2015, 13, 2283–2307. [Google Scholar] [CrossRef]
Figure 1. Comparison of the satellite images for evaluating plan regularity by using different web platforms: (a) Google Maps, (b) Bing Maps, (c) Mapillary, (d) OpenStreetCam.
Remotesensing 14 01424 g001
Figure 2. Evaluation of the façade images for assessing the conservation state by using different web platforms: (a) Google Maps, (b) Bing Maps, (c) OpenStreetCam, and (d) Mapillary.
Remotesensing 14 01424 g002
Figure 3. Satellite view of the City of Leiria (top); view of the Historic Centre, including the area of study (bottom). Google Maps and GeoPortal.
Remotesensing 14 01424 g003
Figure 4. Region of study (Zone 1), emphasizing masonry-based constructions and the key assigned during the data acquisition campaigns.
Remotesensing 14 01424 g004
Figure 5. Vulnerability class distribution for each parameter throughout the total of samples.
Remotesensing 14 01424 g005
Figure 6. Vulnerability index obtained from Iv,ref, I v + , and I v , showing the normality of distribution.
Remotesensing 14 01424 g006
Figure 7. Comparison between the reference vulnerability index and the classes assigned using remote surveying.
Remotesensing 14 01424 g007
Figure 8. Comparison between the reference vulnerability index and the computed ranges by using remote surveying; the Building ID refers to the keys in Figure 4.
Remotesensing 14 01424 g008
Figure 9. Comparison between the indexes calculated in this work and the field-campaign reference values.
Remotesensing 14 01424 g009
Figure 10. Vulnerability curves for the mean I v + = 44.15, I v =39.15, and Iv,ref = 42.88. This curve exemplifies that the minimum and maximum values are reasonably close to reference values, supporting the hypothesis of having an accurate approach.
Remotesensing 14 01424 g010
Figure 11. Damage scenario for different macroseismic intensities IEMS-98, considering central values-(a,c); and reference values (b,d) of the Vulnerability Index Iv.
Remotesensing 14 01424 g011
Figure 12. Mean damage grade distributions obtained from both approaches for IEMS-98 = VII (left) and IEMS-98 = VIII (right).
Remotesensing 14 01424 g012
Figure 13. Vulnerability class distribution for each parameter, considering the façade approach.
Remotesensing 14 01424 g013
Figure 14. Vulnerability index distributions obtained from Iv,ref and overall comparison. The hypothesis of normality was not sustained in this approach.
Remotesensing 14 01424 g014
Figure 15. Comparison between the vulnerability classes assigned for each façade-related parameter.
Remotesensing 14 01424 g015
Figure 16. Comparison between the reference vulnerability index and the computed range.
Remotesensing 14 01424 g016
Figure 17. Comparison between the Vulnerability Indexes evaluated in this work and the reference values for the façade approach.
Remotesensing 14 01424 g017
Figure 18. Vulnerability curves for the mean I v + = 47.90, I v = 42.34, and Iv,ref = 42.42. Minimum and maximum values are close to reference values, supporting the feasibility of the approach.
Remotesensing 14 01424 g018
Figure 19. Damage scenario for different macroseismic intensities IEMS-98, considering central values (a,c) and reference values (b,d) of Vulnerability Index Iv, based on the façade approach.
Remotesensing 14 01424 g019
Figure 20. Mean damage grade distributions obtained from both intensities: IEMS-98 = VII (left) and VIII (right) for the façade approach.
Remotesensing 14 01424 g020
Table 1. Survey form: List of the most common parameters in the analyzed forms.
IdParameters
1Position in the urban context
2Total number of floors, including underground floors
3Average floor height and average floor area
4Masonry characteristics
5Presence of tie rods or perimeter concrete belts
6Connection between orthogonal walls
7Average wall thickness and distance between walls
8Floors characteristics
9Mixed structures in reinforced concrete, presence of additions with different construction techniques
10Mortar type
11Presence of porch/arcade
12Presence of specific elements of vulnerability, including non-structural elements
13Roof type
14Wall Façade openings
15Regularity in plan and height
16Structural interventions in time
17Status of conservation
18Foundations
Table 2. Summary of strengths and shortcomings identified on each web-mapping tool.
ToolStrengthsShortcomings
Google MapsHigh-quality photo
Capillary Street view coverage
3D model of the entire world
Tool for measuring height, width, and building area
Availability of images bound to access of Google acquisition media
Bing MapsAlternative view of the territory: Bird’s Eye
3D model of several cities in the world
Availability of images bound to access of Microsoft acquisition media
Street-side coverage is reduced
Lower photo resolution than competitors
MapillaryCrowdsourcing model
Shared upload
Photos and sequences can be taken anywhere and by anyone
Continuous updating
Small photo database
Image display is not 360°
OpenStreetCam
Yandex MapsStreet view function is particularly advanced and higher than competitorsReduced coverage of western Europe (most of the data refer to Russia and eastern European countries)
Table 3. Comparison of the web-mapping platforms considering the parameters that can be consulted on each platform.
ParameterGoogleBing MapsOpen-Street CamMapillary
1Position in the urban context
2Total number of floors
3Average floor height and average floor area×××
4Masonry characteristics××××
5Presence of tie rods or perimeter concrete belts×
6Connection between orthogonal walls×
7Average wall thickness and distance between walls××××
8Floors characteristics××××
9Mixed structures in reinforced concrete
10Mortar type××××
11Presence of porch/arcade
12Presence of specific elements of vulnerability×
13Roof type××××
14Wall Façade openings
15Regularity in plan and height×
16Structural interventions in time×
17Status of conservation×
18Foundations××××
Total of non-evaluable parameters61287
Table 4. Parameters, groups, and relative weights considered for the Building Approach, BA.
Parameters Class   ( C v i ) WeightRelative Weight
ABCD p i
Group 1. Structural building system 50/100
P1. Type of resisting system0520502.5016.67
P2. Quality of the resisting system0520502.5016.67
P3. Conventional strength0520501.006.67
P4. Maximum distance between walls0520500.503.33
P5. Number of floors0520500.503.33
P6. Location and soil conditions0520500.503.33
Group 2. Irregularities and interaction 20/100
P7. Aggregate position and interaction0520501.5010.0
P8. Plan configuration0520500.500.33
P9. Height regularity0520500.500.33
P10. Wall Façade openings and alignment0520500.500.33
Group 3. Floor slabs and roofs 18/100
P11. Horizontal diaphragms0520500.754.91
P12. Roofing system0520502.0013.09
Group 4. Conservation and other elements 12/100
P13. Fragilities and conservation status0520501.006.86
P14. Non-structural elements0520500.755.14
Table 5. Parameters functional to the Façade Approach, FA.
Parameters Class ,   C v i WeightRelative Weight
ABCDpi
Group 1. Façade geometry, openings, and interaction 16.7/100
P1. Geometry of Façade0520500.50
P2. Maximum slenderness0520500.50
P3. Area of openings0520500.50
P4. Misalignment of openings0520500.50
P5. Interaction between continuous Façades0520500.25
Group 2. Masonry materials and conservation 31.5/100
P6. Quality of materials0520502.00
P7. State of conservation0520502.00
P8. Replacement of original flooring system0520500.25
Group 3. Connection efficiency to other structural elements 33.3/100
P9. Connection to orthogonal walls0520502.00
P10. Connection to horizontal diaphragms0520500.50
P11. Impulsive nature of the roofing system0520502.00
Group 4. Conservation status and other elements 18.5/100
P12. Elements connected to the Façade0520500.50
P13. Improving elements052050−2.00
Publisher’s Note: MDPI stays neutral with regard to jurisdictional claims in published maps and institutional affiliations.

