Article

Improved Daily Evapotranspiration Estimation Using Remotely Sensed Data in a Data Fusion System

1
Earth System Science Interdisciplinary Center, University of Maryland, College Park, MD 20740, USA
2
Hydrology and Remote Sensing Laboratory, USDA ARS, Beltsville, MD 20705, USA
3
Sustainable Agriculture Water Systems Research Unit, USDA ARS, Davis, CA 95616, USA
4
Earth Science Branch, NASA Marshall Space Flight Center, Huntsville, AL 35805, USA
*
Author to whom correspondence should be addressed.
Submission received: 13 January 2022 / Revised: 12 March 2022 / Accepted: 1 April 2022 / Published: 7 April 2022
(This article belongs to the Special Issue Smart Farming and Land Management Enabled by Remotely Sensed Big Data)

Abstract

:
Evapotranspiration (ET) represents crop water use and is a key indicator of crop health. Accurate estimation of ET is critical for agricultural irrigation and water resource management. ET retrieval using energy balance methods with remotely sensed thermal infrared data as the key input has been widely applied for irrigation scheduling, yield prediction, drought monitoring and so on. However, limitations on the spatial and temporal resolution of available thermal satellite data combined with the effects of cloud contamination constrain the amount of detail that a single satellite can provide. Fusing satellite data from different satellites with varying spatial and temporal resolutions can provide a more continuous estimation of daily ET at field scale. In this study, we applied an ET fusion modeling system, which uses a surface energy balance model to retrieve ET using both Landsat and Moderate Resolution Imaging Spectroradiometer (MODIS) data and then fuses the Landsat and MODIS ET retrieval timeseries using the Spatial-Temporal Adaptive Reflectance Fusion Model (STARFM). In this paper, we compared different STARFM ET fusion implementation strategies over various crop lands in the central California. In particular, the use of single versus two Landsat-MODIS pair images to constrain the fusion is explored in cases of rapidly changing crop conditions, as in frequently harvested alfalfa fields, as well as an improved dual-pair method. The daily 30 m ET retrievals are evaluated with flux tower observations and analyzed based on land cover type. This study demonstrates improvement using the new dual-pair STARFM method compared with the standard one-pair STARFM method in estimating daily field scale ET for all the major crop types in the study area.

1. Introduction

As food production increases to meet the needs of the growing global population, the demand of water for agriculture, especially in water-limited areas of the world, has rapidly increased [1]. At the same time, drought is prevalent across the globe and could become more frequent under changing climate conditions [2]. The competing demands for water resources, especially under drought conditions, can lead to large socioeconomical impacts, requiring management decisions to balance the needs for water between agriculture, urban uses, and natural ecosystems [3,4]. Accurate assessments of water use at field scale can be critical to understand spatiotemporal patterns in water requirements and help improve water resource management and agricultural practices, for example, decisions about irrigation timing and amount [5,6].
Evapotranspiration (ET) represents the consumptive water use by a vegetated surface and is a major component of watershed water balance. Daily ET maps at field scale (100 m resolution or finer) can provide useful information for vegetation condition monitoring [7,8], drought detection [9,10], yield prediction [11] and irrigation scheduling [12,13]. While traditional ET measurement methods (e.g., lysimeter and eddy covariance flux tower) are limited to sampling only a small area (typically of dimensions of a meter to a few hundred meters), ET estimation using remotely sensed data can provide gridded water use information over large regions, taking advantage of the recent achievements in Earth observation capabilities [14,15]. Energy balance methods, with remotely sensed thermal infrared (TIR) observations as the key input, have been widely used for ET estimation [16]. Using sharpened TIR data from Landsat, ET can be produced at 30 m spatial resolution every 8 (16) days under clear-sky conditions with 2 (1) functioning platforms, although the revisit can be significantly longer in regions of persistent cloud-cover. This relatively long revisit interval may not be adequate to capture important vegetation water-use trends, especially during key growth and management stages, or during periods of rapid onset of “flash” drought. The ET retrieved using Moderate Resolution Imaging Spectroradiometer (MODIS) TIR data can be generated on a near daily basis, but at a relatively coarse spatial resolution (250–500 m) that often does not resolve water use variability at field or sub-field scales.
To obtain the daily Landsat-scale (30 m) ET needed for field-scale monitoring applications, a data fusion method has been employed to fuse ET timeseries retrieved from Landsat and MODIS. The Spatial-Temporal Adaptive Reflectance Fusion Model (STARFM) is a widely used data fusion method that was originally developed to fuse surface reflectance data from Landsat and MODIS [17]. STARFM uses spatio-statistical weighting information derived from Landsat data and MODIS data on one or more Landsat overpass days and MODIS data on the prediction date to obtain Landsat-like estimations on all prediction dates between Landsat overpasses. STARFM has been successfully adapted to fuse ET data retrieved from Landsat and MODIS and has been used in many studies in various climate zones and land use types [9,11,18,19,20].
The weighting information used in STARFM to downscale MODIS product timeseries can be derived from either a single pair of MODIS and Landsat images or two pairs bracketing the prediction date [17]. To date, most applications of STARFM for ET fusion have used one pair of images, since this mode is better suited for near real-time applications and uses less imagery. However, Xue et al. [21] found that the one-pair approach often did not adequately capture rapid changes in ET in intensively managed agricultural systems, such as alfalfa. Additionally, under some circumstances, the one-pair approach tends to add an artificial discontinuous change in predicted values when switching pairs. While there are many studies exploring the impact of different image pair selection strategies in surface reflectance fusion [22,23], no similar sensitivity study has been conducted characterizing the use of a single pair vs. two pairs of images in ET fusion.
In this study, we tested the standard one-pair and two-pair options as well as a new dual-pair option of STARFM in ET fusion over the Delta area in central California, and we investigated the impact of these options on daily ET estimation over various land use types. The study objectives are to explore the following: (1) the difference among fused daily ET timeseries estimated using different strategies of STARFM; (2) the impact of different STARFM methods on daily field-scale ET estimation over different land cover types.

2. Study Area

The study area, located in the Central Valley of California, is shown in Figure 1 along with land use information for 2014. This area is characterized by a wide range of land use and crop types with variable plant and water use phenology, which provides a complex condition for testing the capabilities of STARFM in fusing ET timeseries over a highly heterogenous area. This area also has the advantage of having many available clear remotely sensed observations during the growing season, which typically has low cloud cover. Over the past years, there has been a significant increase in viticulture within this study area, inspired by the region’s Mediterranean climate, characterized by the rainy cold season and dry and hot summers. In addition to vineyards, many other perennial and annual crops are grown in the region and a large amount of water is consumed for agriculture production. However, this area has experienced prolonged periods of drought over the past decade, which are projected to be more frequent due to the changing climate. To better manage water resources in this area, detailed accounting of seasonal water use curves by crop type is needed. Several flux towers are in this study area to monitor water and carbon fluxes that can be used as evaluation sites, as will be discussed in detail in the Data section.

3. Methods and Data

3.1. Methods

3.1.1. Evapotranspiration Retrieval Using Multi-Scale Remotely Sensed Data

The Atmosphere–Land Exchange Inverse (ALEXI) surface energy balance model and associated flux disaggregation technique DisALEXI were used to estimate surface energy fluxes over the study area using Landsat and MODIS TIR imagery. ALEXI/DisALEXI are based on the Two-Source Energy Balance (TSEB) model, which was developed by Norman et al. [24] and further refined by Kustas et al. [25,26]. In TSEB, the soil and vegetation energy components are solved separately (Equations (1) and (2)):
R n , s   = H S + L E S + G 0
R n , c   = H c + L E c
where the subscripts “s” and “c” represent soil and canopy energy flux components (in W m−2), Rn is net radiation, H is sensible heat flux, LE is latent heat flux and G0 is soil heat flux. The observed directional radiometric surface temperature is partitioned into soil and vegetation components, which are used to constrain Rn, H and G. Daily latent heat flux (in energy units of MJ m−2 day−1) is converted to ET (in mass units of mm day−1) by dividing by the latent heat of vaporization (λ = 2.45 MJ kg−1).
Combining TSEB with a simplified atmospheric boundary condition model, ALEXI/DisALEXI can estimate evapotranspiration from regional to continental scales with remotely sensed thermal infrared observations and vegetation index as the key inputs. The regional ALEXI model employs the TSEB in a time-differential mode during the morning period to reduce sensitivity to absolute temperature errors. For more details about the ALEXI model, see Anderson et al. [27,28]. Using time-differential land-surface temperature (LST) observations from geostationary satellites, ET estimated using ALEXI is normally at coarse scale, on the order of several kilometers. To obtain higher spatial resolution ET maps, DisALEXI can be employed to disaggregate the coarse ET from ALEXI using higher resolution LST retrievals from MODIS (500–1000 m/approximately daily) or Landsat (sharpened to 30 m/8–16 days). More information about DisALEXI can be found in Anderson et al. [28,29,30] and Yang et al. [31].

3.1.2. GEE-DisALEXI

In this study, Landsat ET was retrieved using a version of DisALEXI that has been recently implemented in Google Earth Engine (GEE) under the OpenET project—a collaborative effort aimed at providing field-scale ET estimates over the western U.S. for improved irrigation and water resource management [32]. The basic algorithm for GEE-DisALEXI is the same as the standard version described above and in previous studies, but with some differences in the input data preparation and model structure due to the specific capabilities and constraints of GEE. These differences are discussed in more detail in Section 2.

3.1.3. Gap-Filling

STARFM requires Landsat- and MODIS-retrieved ET images be spatially filled and MODIS-retrieved ET images additionally be temporally filled to ensure that daily MODIS images are available. Spatial gaps in Landsat DisALEXI caused by cloud contamination or stripes from the Landsat 7 scan-line corrector failure are filled using the method described in Yang et al. [33]. The gaps are filled using a weighted function between a STARFM predicted Landsat-scale ET and the original retrieved Landsat ET. Temporal gaps in MODIS-retrieved ET are filled using the method in Anderson et al. [15]. The ratio between MODIS-retrieved ET and ALEXI ET at 4 km is computed and smoothed using a Savitzky–Golay filter [34]. Gap-filled daily ET is recovered by multiplying this smoothed ratio series by daily ALEXI ET.

3.1.4. STARFM Data Fusion Method

STARFM uses Landsat and MODIS image pairs from the same day to estimate Landsat-resolution images for other MODIS dates [17]. The original method is implemented at the pixel level using spectrally similar pixels around the central (prediction) pixel. The change of temporal information is obtained from MODIS images based on these similar pixels. The final estimation is the sum of the predictions from similar pixels weighted by spectral and spatial differences. STARFM can use a one- or two-pair option. The single-pair option uses similar pixels from one image pair. The two-pair option uses all similar pixels from two image pairs, usually one before and one after the prediction date.
STARFM is the first operational algorithm open to the public for data fusion. Based on the original STARFM, several modified algorithms have developed to fuse surface reflectances [35,36,37], as summarized in Zhu et al. [23]. For example, the spatial temporal adaptive algorithm for mapping reflectance change (STAARCH, [38]) uses similar weight functions, but detects the land cover type change points from dense time series of coarse images. To improve the accuracy of STARFM in heterogeneous areas, Enhanced STARFM (ESTARFM, [39]) introduces a conversion coefficient estimated by linearly regressing the reflectance changes of fine resolution pixels of the same endmember and coarse resolution pixel.

One- and Two-Pair Modes

The one-pair and two-pair options are available in the standard publicly available STARFM package [17]. The one-pair option normally chooses an available Landsat image close to the prediction date and pairs this with the MODIS image on the same day. Transition between one pair and the next pair is determined by similarity between MODIS images on the prediction and pair dates. The two-pair mode uses pairs bracketing a prediction interval. The pair is determined for each pixel from the two bracketing pairs by selecting the higher similarity in MODIS. For ET fusion, similarity in the ratio between MODIS ET and ALEXI ET is used to select the optimal pair to downscale predictions [20].

Proposed Dual-Pair Mode

The proposed dual-pair mode of STARFM, like the two-pair mode, uses two pairs of Landsat- and MODIS-retrieved ET, one pair before and another pair after the predict day to predict Landsat-scale ET (Figure 2). However, rather than using the pair to determine an average set of downscaling weights employed over this prediction at the pixel-level, each pair is used to run the one-pair STARFM algorithm over the prediction interval, yielding two high-resolution ET timeseries–one forward predicted (ET1) from the first pair and one back predicted (ET2) from the second pair. The two ET timeseries are then merged together at the image level using Equation (3):
E T d u a l p a i r = W 1 × E T 1 + W 2 × E T 2 W 1 = t 2 t 0 t 2 t 1 W 2 = t 0 t 1 t 2 t 1  
where ET1 and ET2 are the results of one-pair STARFM using pair 1 and pair 2, W is the relative weight assigned to the results from using each pair, and t1 and t2 are the date for the two pairs, t0 is the prediction date. Under normal conditions, W1 and W2 are estimated using the date of two pairs and the prediction day, which yields a smooth weighted transition between the results from both pairs. However, this weight factor can also be modified to adapt to rapid changes; for example, harvest can be estimated from NDVI using change detection techniques [40]. In the case of a detected rapid change, the prediction before the change date should be more related to the image pair before change, while the prediction after the change date should be more related to the image pair after change. In this study, we simply tested assigning W1 as 1 and W2 as 0 for pre-harvest to only consider information from image pairs before harvest, and we tested the opposite for postharvest to only consider information from image pairs after harvest.

3.1.5. Quality Assessment

The relative accuracy of the various pair options for STARFM was assessed at flux tower locations using observations of daily ET. Statistical metrics including mean absolute error (MAE), mean bias error (MBE), and root mean square error (RMSE) were used in this study.

3.1.6. STARFM Testing Strategy

STARFM inputs used in this study include periodic ET retrievals from Landsat 7 and Landsat 8 (30 m), as well as daily ET from MODIS (500 m). The STARFM modes tested include the original one-pair and two-pair mode as well as the dual-pair mode proposed in this study. To better examine the impact of different inputs on the quality of the predicted Landsat-scale ET, various combinations of input data were tested. The following tests are performed: (1) using Landsat 8-retrieved ET with simulated MODIS derived through aggregation of Landsat direct retrievals to 480 m ET, to examine the performance of different STARFM application strategies using perfectly consistent multi-source imagery; (2) using both Landsat 7- and Landsat 8-retrieved ET and MODIS-retrieved ET to explore the time series performance from different strategies in comparison with flux tower observations; (3) using only Landsat 8-retrieved ET and MODIS-retrieved ET to assess, in comparison with test 2, the impact of temporal sampling at the Landsat scale. The time-series daily fused ET were compared with flux tower observations and analyzed for major crop types to look at the performance of the standard one-pair STARFM and proposed dual-pair STARFM for different crop types.

3.2. Data

3.2.1. ET Model Inputs

ALEXI and DisALEXI model inputs are briefly reviewed here, with more detailed information provided in [28,29,31].
Key remote sensing inputs to both ALEXI and DisALEXI are raster images of LST and LAI. For the ALEXI model, LST data are obtained at two times during the morning rise interval (typically 1.5 and 5.5 hourafter local sunrise) from the GOES-East and -West imager instruments and resampled to a 4 km grid. LAI data are obtained from the 500 m MODIS LAI (MCD15A3H) product. These data are spatially aggregated to the 4 km grid and temporally interpolated to a daily time step using the Savitzky–Golay methods [15]. Albedo, another primary component of the energy balance, is estimated with the narrow-to-broadband conversion equation developed for Landsat surface reflectances [41].
Inputs for MODIS-based disaggregation of ALEXI ET include instantaneous swath LST data (MOD11_L2), LAI (MCD15A3) and albedo (MCD43A3). All MODIS data were from collection 6 and went through quality check based on the associated QA data. MODIS LST at 1 km spatial resolution was sharpened to 500 m using the thermal sharpening method developed by Gao et al. [17].
Landsat-based disaggregation of ALEXI ET was carried out using the version of DisALEXI on GEE using TIR and shortwave surface reflectance data from Landsat 7 and Landsat 8 collection 1, excluding images with cloud cover exceeding 70% of the scene. The TIR data were atmospherically corrected using the parameters and methods described in Masahiro et al. [42], and then spatially sharpened to 30 m resolution using a thermal sharpening method similar to that developed by Gao et al. [17]. This thermal sharpening method was implemented into GEE using the random forest method. MODIS-consistent Landsat-scale LAI was estimated following the method described in Kang et al. [43] using machine learning on GEE. A total of 1.6 Millon samples were generated from MODIS LAI and Landsat surface reflectance data.
Surface meteorological data inputs to both ALEXI and DisALEXI, including air temperature and pressure, vapor pressure, wind speed, and insolation, were obtained from the Climate Forecast System Reanalysis (CFSR) at 0.5-degree spatial resolution and resampled to the GOES, Landsat and MODIS scales. Land cover information used to parameterize surface roughness and spectral characteristics at pixel scale was extracted from 2016 National Land Cover Dataset (NLCD) at 30 m spatial resolution. The pixel level vegetation parameters used in ET models were parameterized following Cammalleri et al. [20].

3.2.2. Flux Tower Data
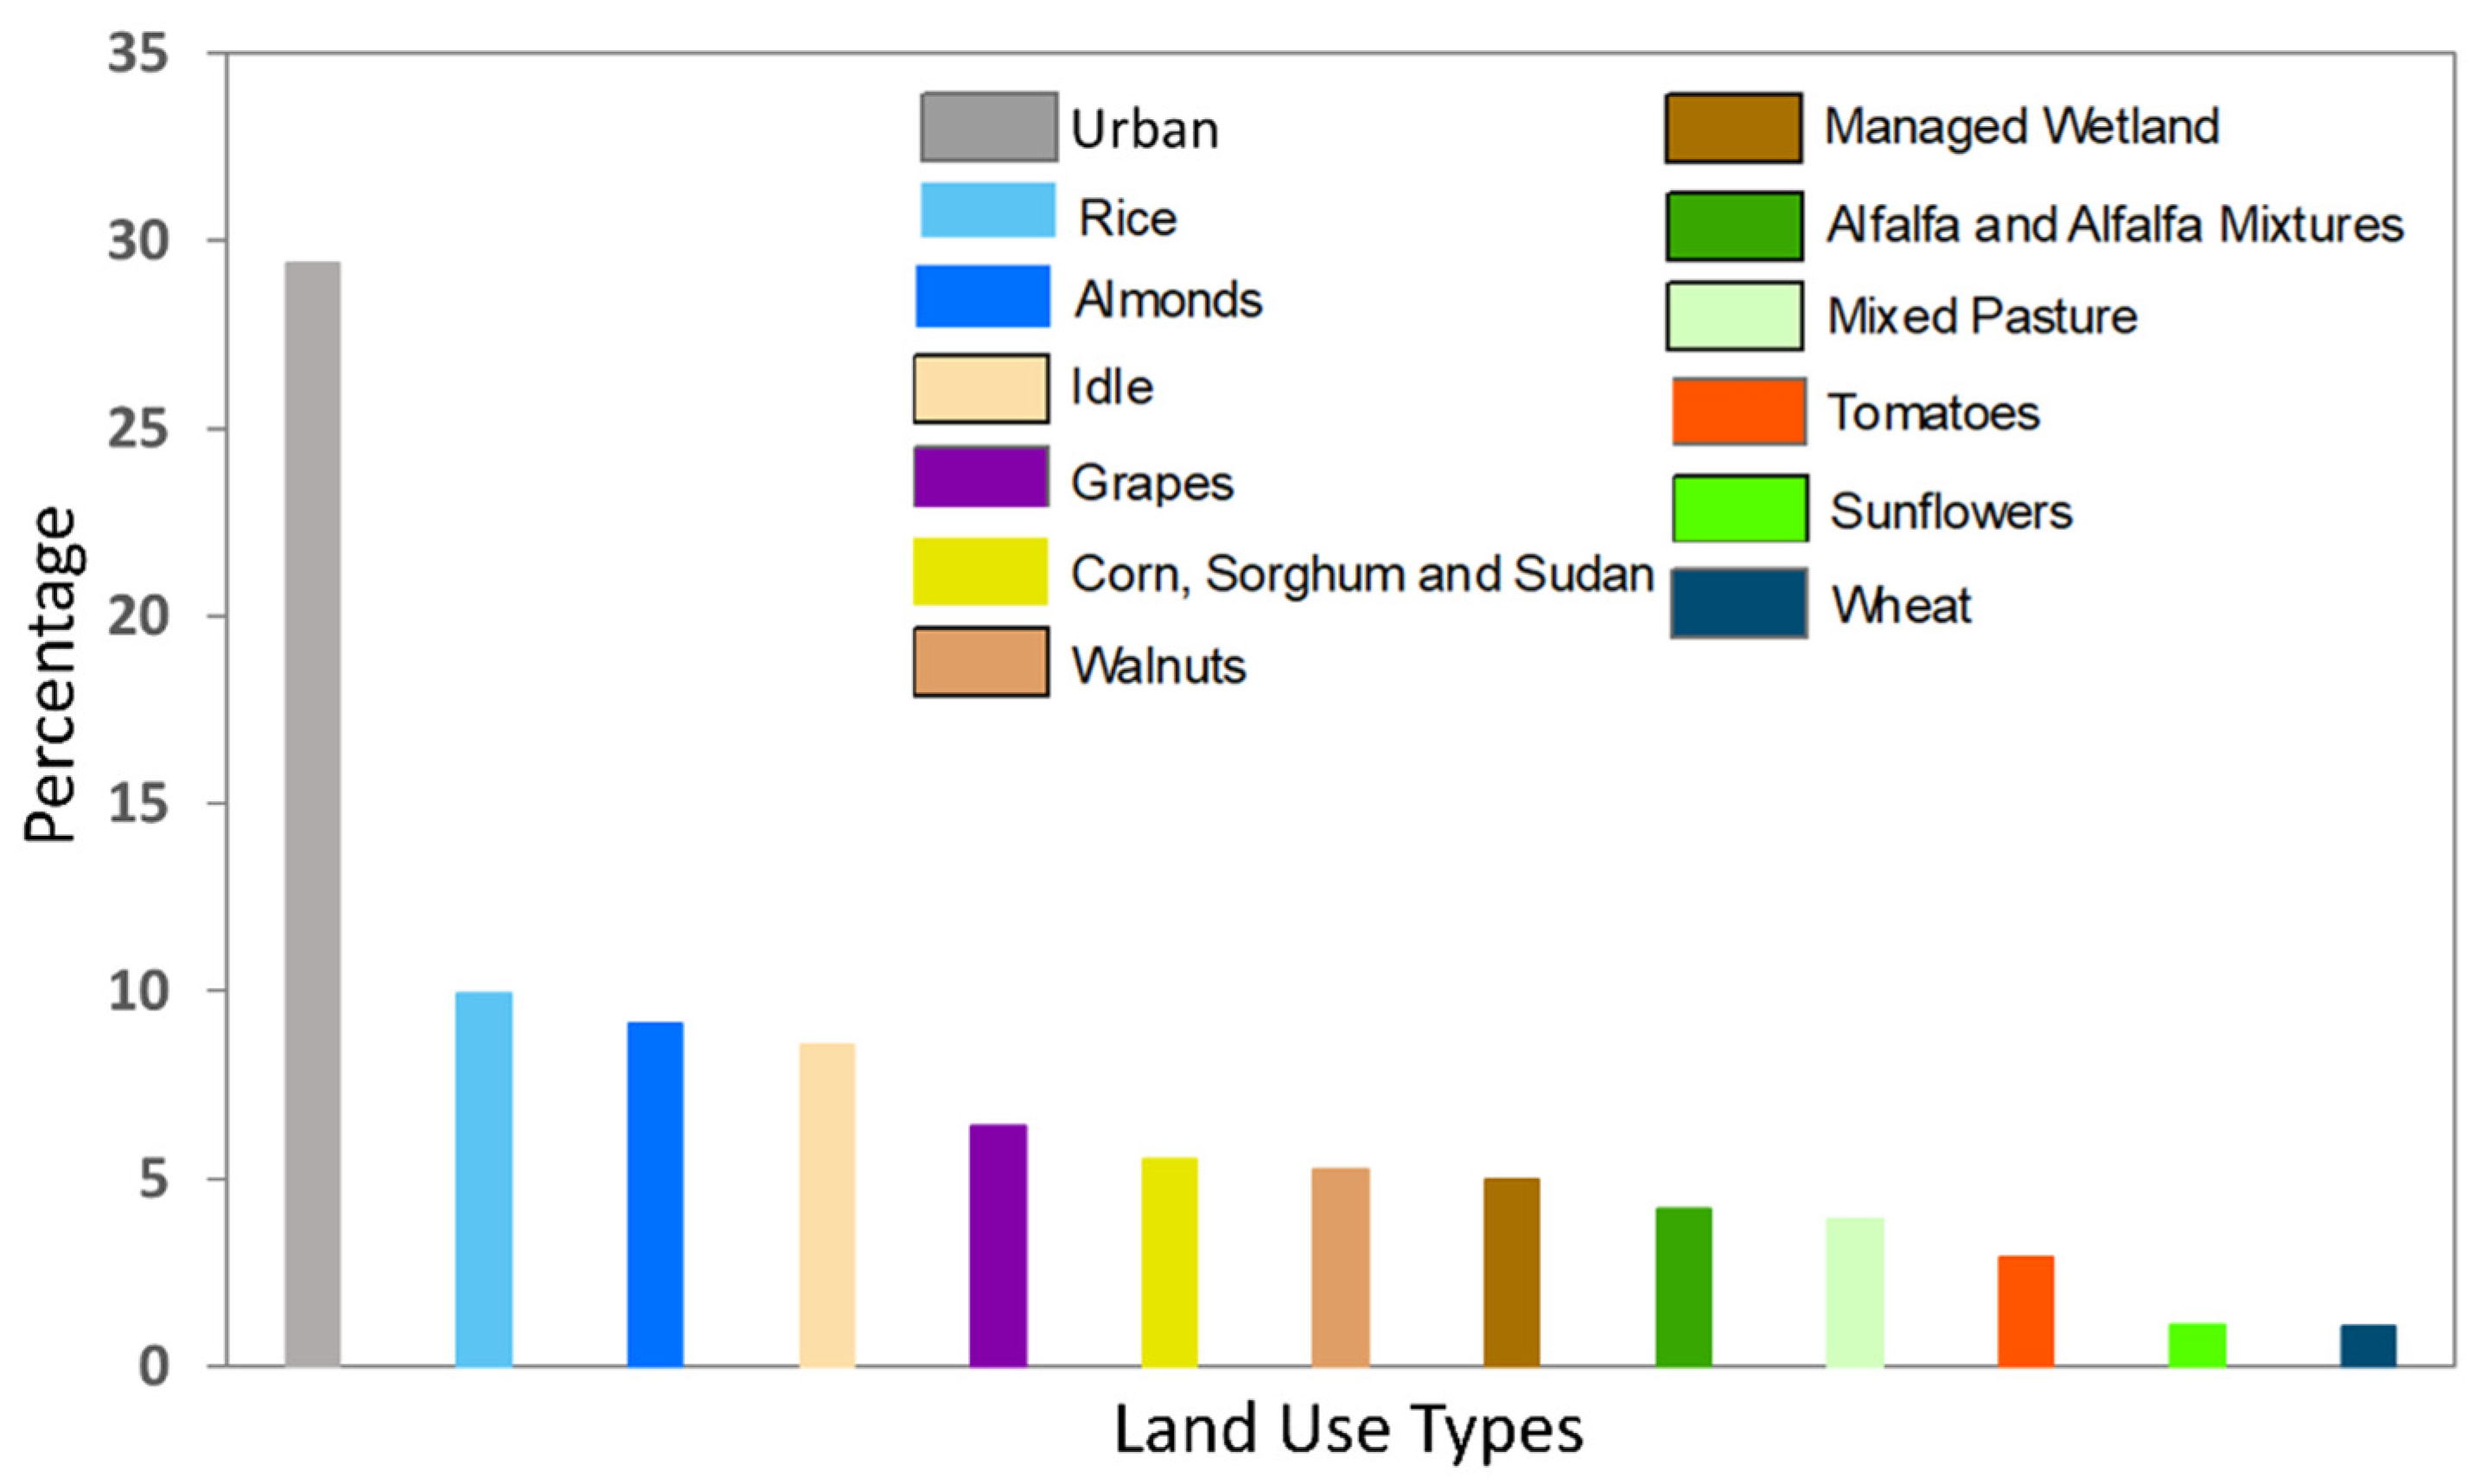
Observations from several flux towers operating within the modeling domain during the study period were used for qualitative assessment of the fused ET image timeseries. These flux tower sites are listed in Table 1 and include US-Tw3, US-Twt, SLM001 and SLM002. Data for US-Tw3 (alfalfa; doi:10.17910/AMF/1246149) and US-Twt (rice; doi:10.17190/AMF/1246151) were extracted from the FLUXNET 2015 data set, which provides a global dataset of water and energy fluxes at ecosystem scale processed using a set of well-established and published methods [44]. The data are quality checked, gapfilled and a correction factor for energy fluxes estimating the deviation from energy balance closure is estimated and provided. The SLM001 and SLM002 data were collected over vineyards outside of Lodi, CA as part of the GRAPEX project, which provides water use information for improved vineyard irrigation management [5]. The flux tower observations were processed following the method described in Volk et al. [45] for gapfilling and energy balance closure correction.

3.2.3. Land Use Map

A detailed land use map for 2014 (CROP2014) obtained from California Department of Water Resources website (https://gis.water.ca.gov/app/CADWRLandUseViewer/, 22 December 2021) was used for analysis of impacts of STARFM strategies on estimates of water use by different land use types. The land use survey was prepared by Land IQ, LLC and provided to the California Department of Water Resources for land use information. This dataset presents approximately 50 crop and land use types of the 2014 agricultural land use and managed wetlands for all 58 counties in California.
Figure 3 shows the percentage of main land use types in the study area in 2014 from the land use survey data. The land use types are varied and mainly agricultural, except for urban areas. Rice, almond and vineyards are the most common agricultural classes in this study area, with another large portion classified as idle.

4. Results

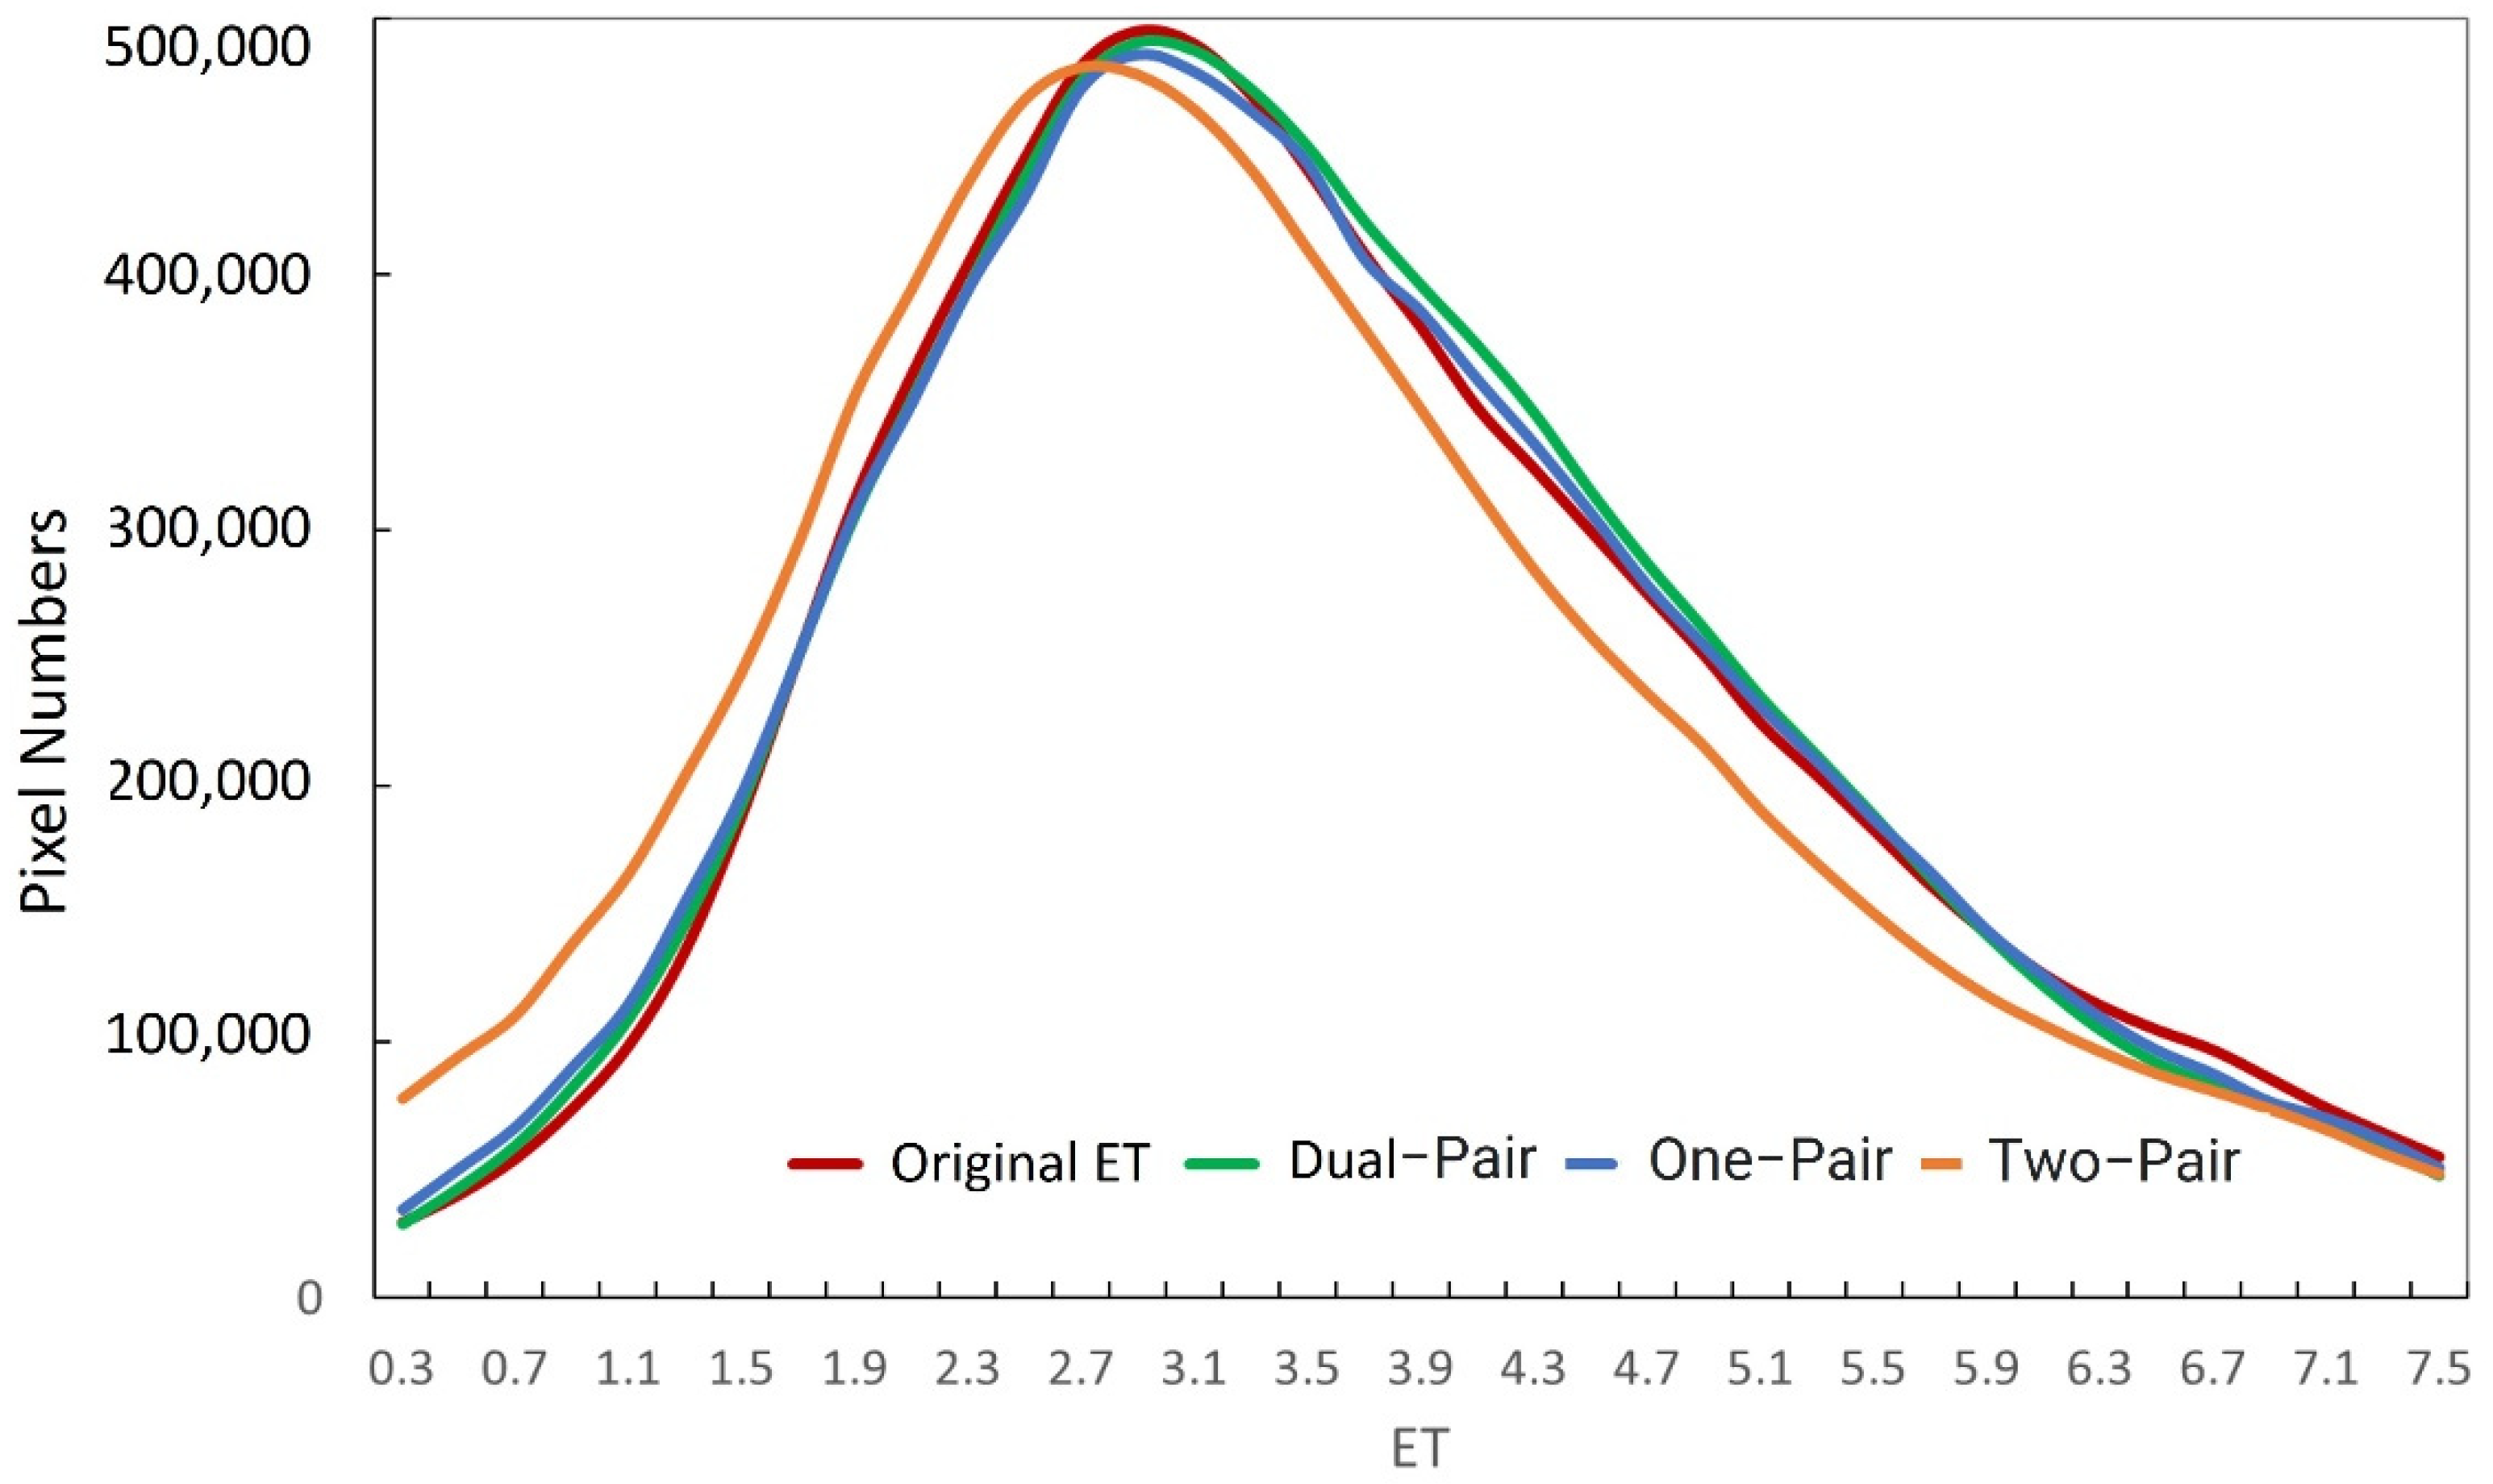
4.1. Comparison of STARFM Strategies Using Synthetic MODIS ET Aggregated from 30 m Landsat ET

The standard one-pair and two-pair STARFM and the proposed dual-pair STARFM methods were first evaluated by using the fusion methods to reconstruct ET images on Landsat overpass days, and by comparing the reconstructions with ET images directly retrieved from the Landsat imagery. To remove the impact of spatial dissimilarity between the Landsat and MODIS ET in the fusion process and focus on the difference in fusion method, we used synthetic MODIS images created by aggregating the Landsat ET from 30 m to 480-m, close to the 500 m resolution of the MODIS ET timeseries. We then used the aggregated 480 m ET as MODIS ET to pair with Landsat ET and applied STARFM in the three modes (one, both and dual-pair). The days that are used for this test are clear Landsat 8 overpass days in 2014, including Day of Year (DOY) 141, 157, 173, 205, 221 and 237.
To highlight the differences among models, Figure 4 shows one example of the fused ET images from the different STARFM methods for DOY 205 generated from Landsat-synthetic MODIS pairs on bracketing dates or 173 and 221, and also compared with the original Landsat ET on DOY 205. The one-pair result used the pair from DOY 221. All three methods show similar spatial patterns as in the original image. However, the standard two-pair STARFM results in lower ET patches in the northeast part of the domain, due to pairing with DOY 173 rather than DOY 221. Figure 5 shows histograms of average ET computed from all reconstructed images for each method in comparison with average directly retrieved ET. The standard two-pair STARFM results shift to lower values compared to the direct retrievals. While the standard one-pair and dual-pair method had similar performance, the new dual-pair method better reconstructed very high and low values of ET and compares better with the original Landsat-retrieved ET. Overall, the dual-pair results have lower RMSE and higher R2 comparing with the one- and two-pair modes. Because the dual-pair method outperformed the standard two-pair STARFM method in this test, we use only the standard one-pair and dual-pair STARFM methods in the following analyses.

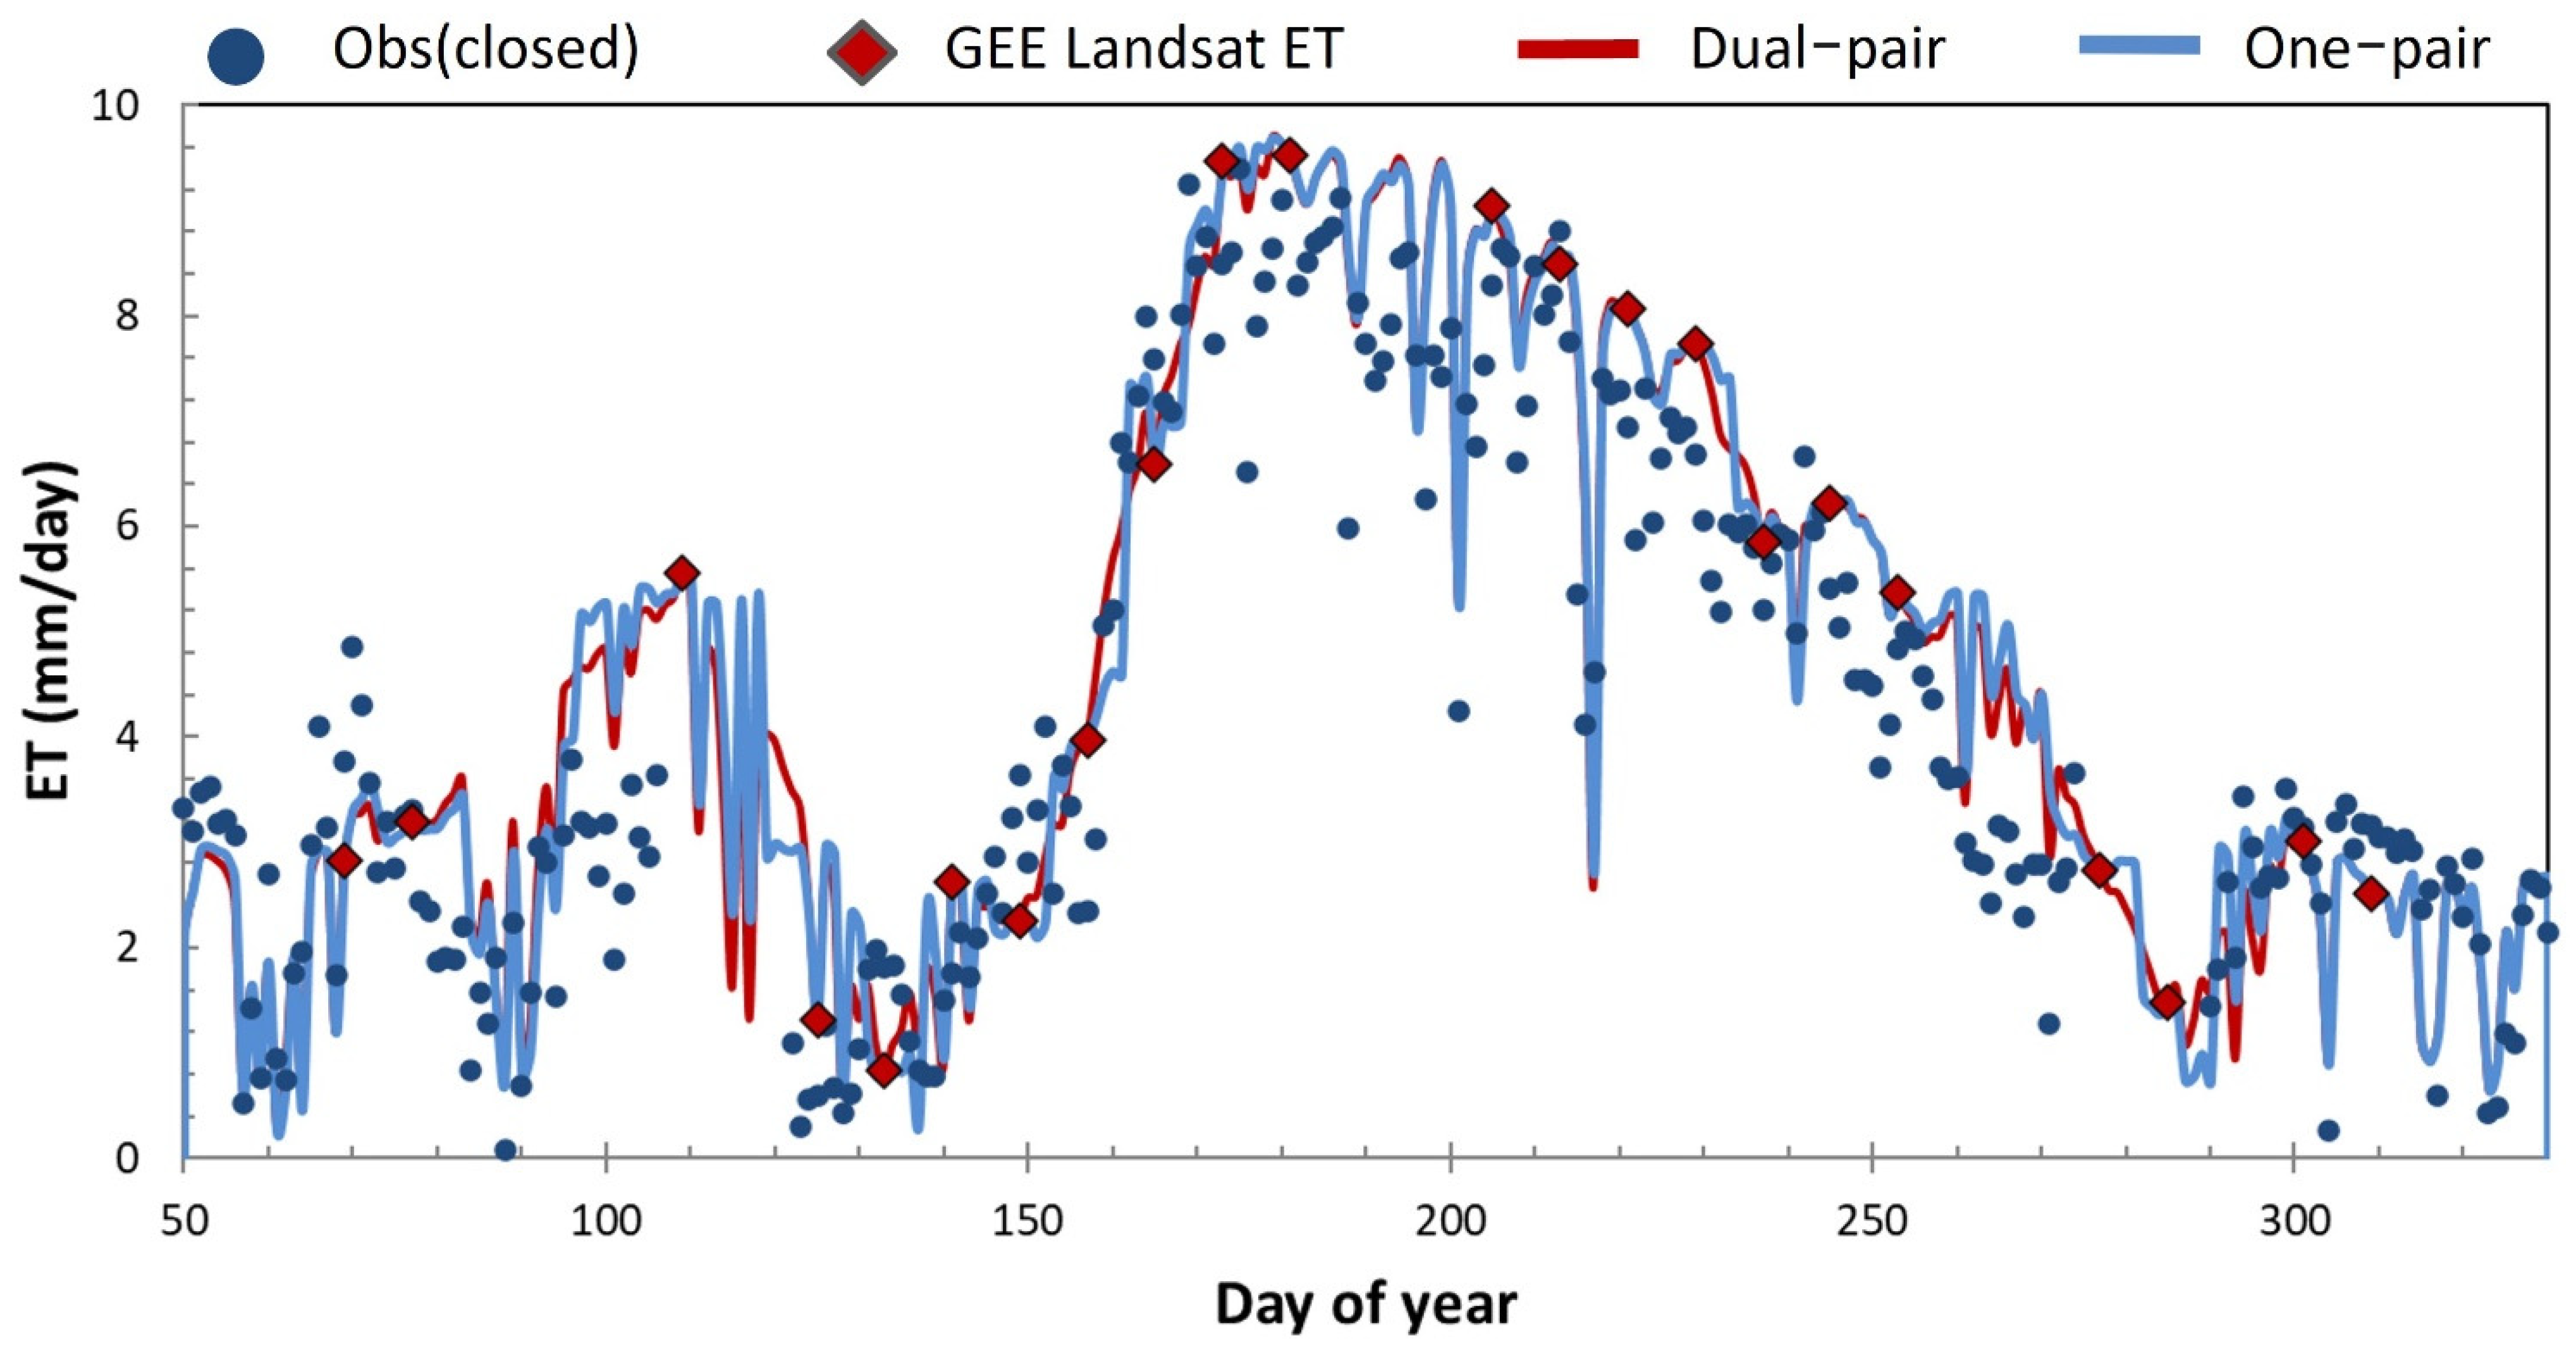
4.2. Evaluation of Time-Series Daily ET at Flux Tower Sites

The fused daily ET over 2014–2018 from DOY 30 to DOY 300 generated using the standard one-pair and dual-pair STARFM methods, and using both Landsat 7- and 8-retrieved ET and only Landsat 8-retrieved ET, were compared with daily ET observations at the four flux tower sites. At most sites, the dual-pair STARFM performs better than the one-pair STARFM. MAE, MBE and RMSE for the dual-pair results are less than those for one-pair results for almost all the sites (Table 1). The exception is US-Tw3, where the MBE of the dual-pair is slightly higher than that of one-pair.
Assessing impacts of Landsat image temporal frequency, the RMSE for fused ET timeseries using only Landsat 8-retrieved ET is higher than when both Landsat 7 and Landsat 8 are used for both dual-pair and one-pair results (Table 1). This suggests that higher frequency in Landsat-like observations can improve the performance of STARFM. Although Landsat 7 has gaps due to the SLC-off issue, including Landsat 7 images still provides useful time-series information and helps STARFM under both dual-pair and one-pair modes. Considering the amount of clear Landsat observations is already relatively high, given the low cloud cover characteristic of the study area during the growing season, more frequent 30 m resolution ET retrievals—obtained from multiple Landsat-like thermal sensors [21]—could be even more beneficial for data fusion in areas with higher cloud coverage.
Figure 6 compares fused daily ET timeseries generated using dual-pair and one-pair STARFM with flux tower observations from US-Twt in 2014. This site is planted in rice, with the early season peak in ET corresponding to a period when the field is flooded for wildlife habitat. Around DOY 100, the field was drained and planted in rice. Rapid crop growth from DOY 130–170 lead to a second peak in ET. While ET estimated from both methods agrees well with the observed data, there are notable periods of discrepancy particularly when there are larger gaps between Landsat ET retrievals. Around DOY 110, the one-pair results show a quick drop in the fused daily ET at the transition between pair dates. In contrast, the dual-pair results are smoother and show a gradual decrease during this period, which better represents the drainage process in the rice field.

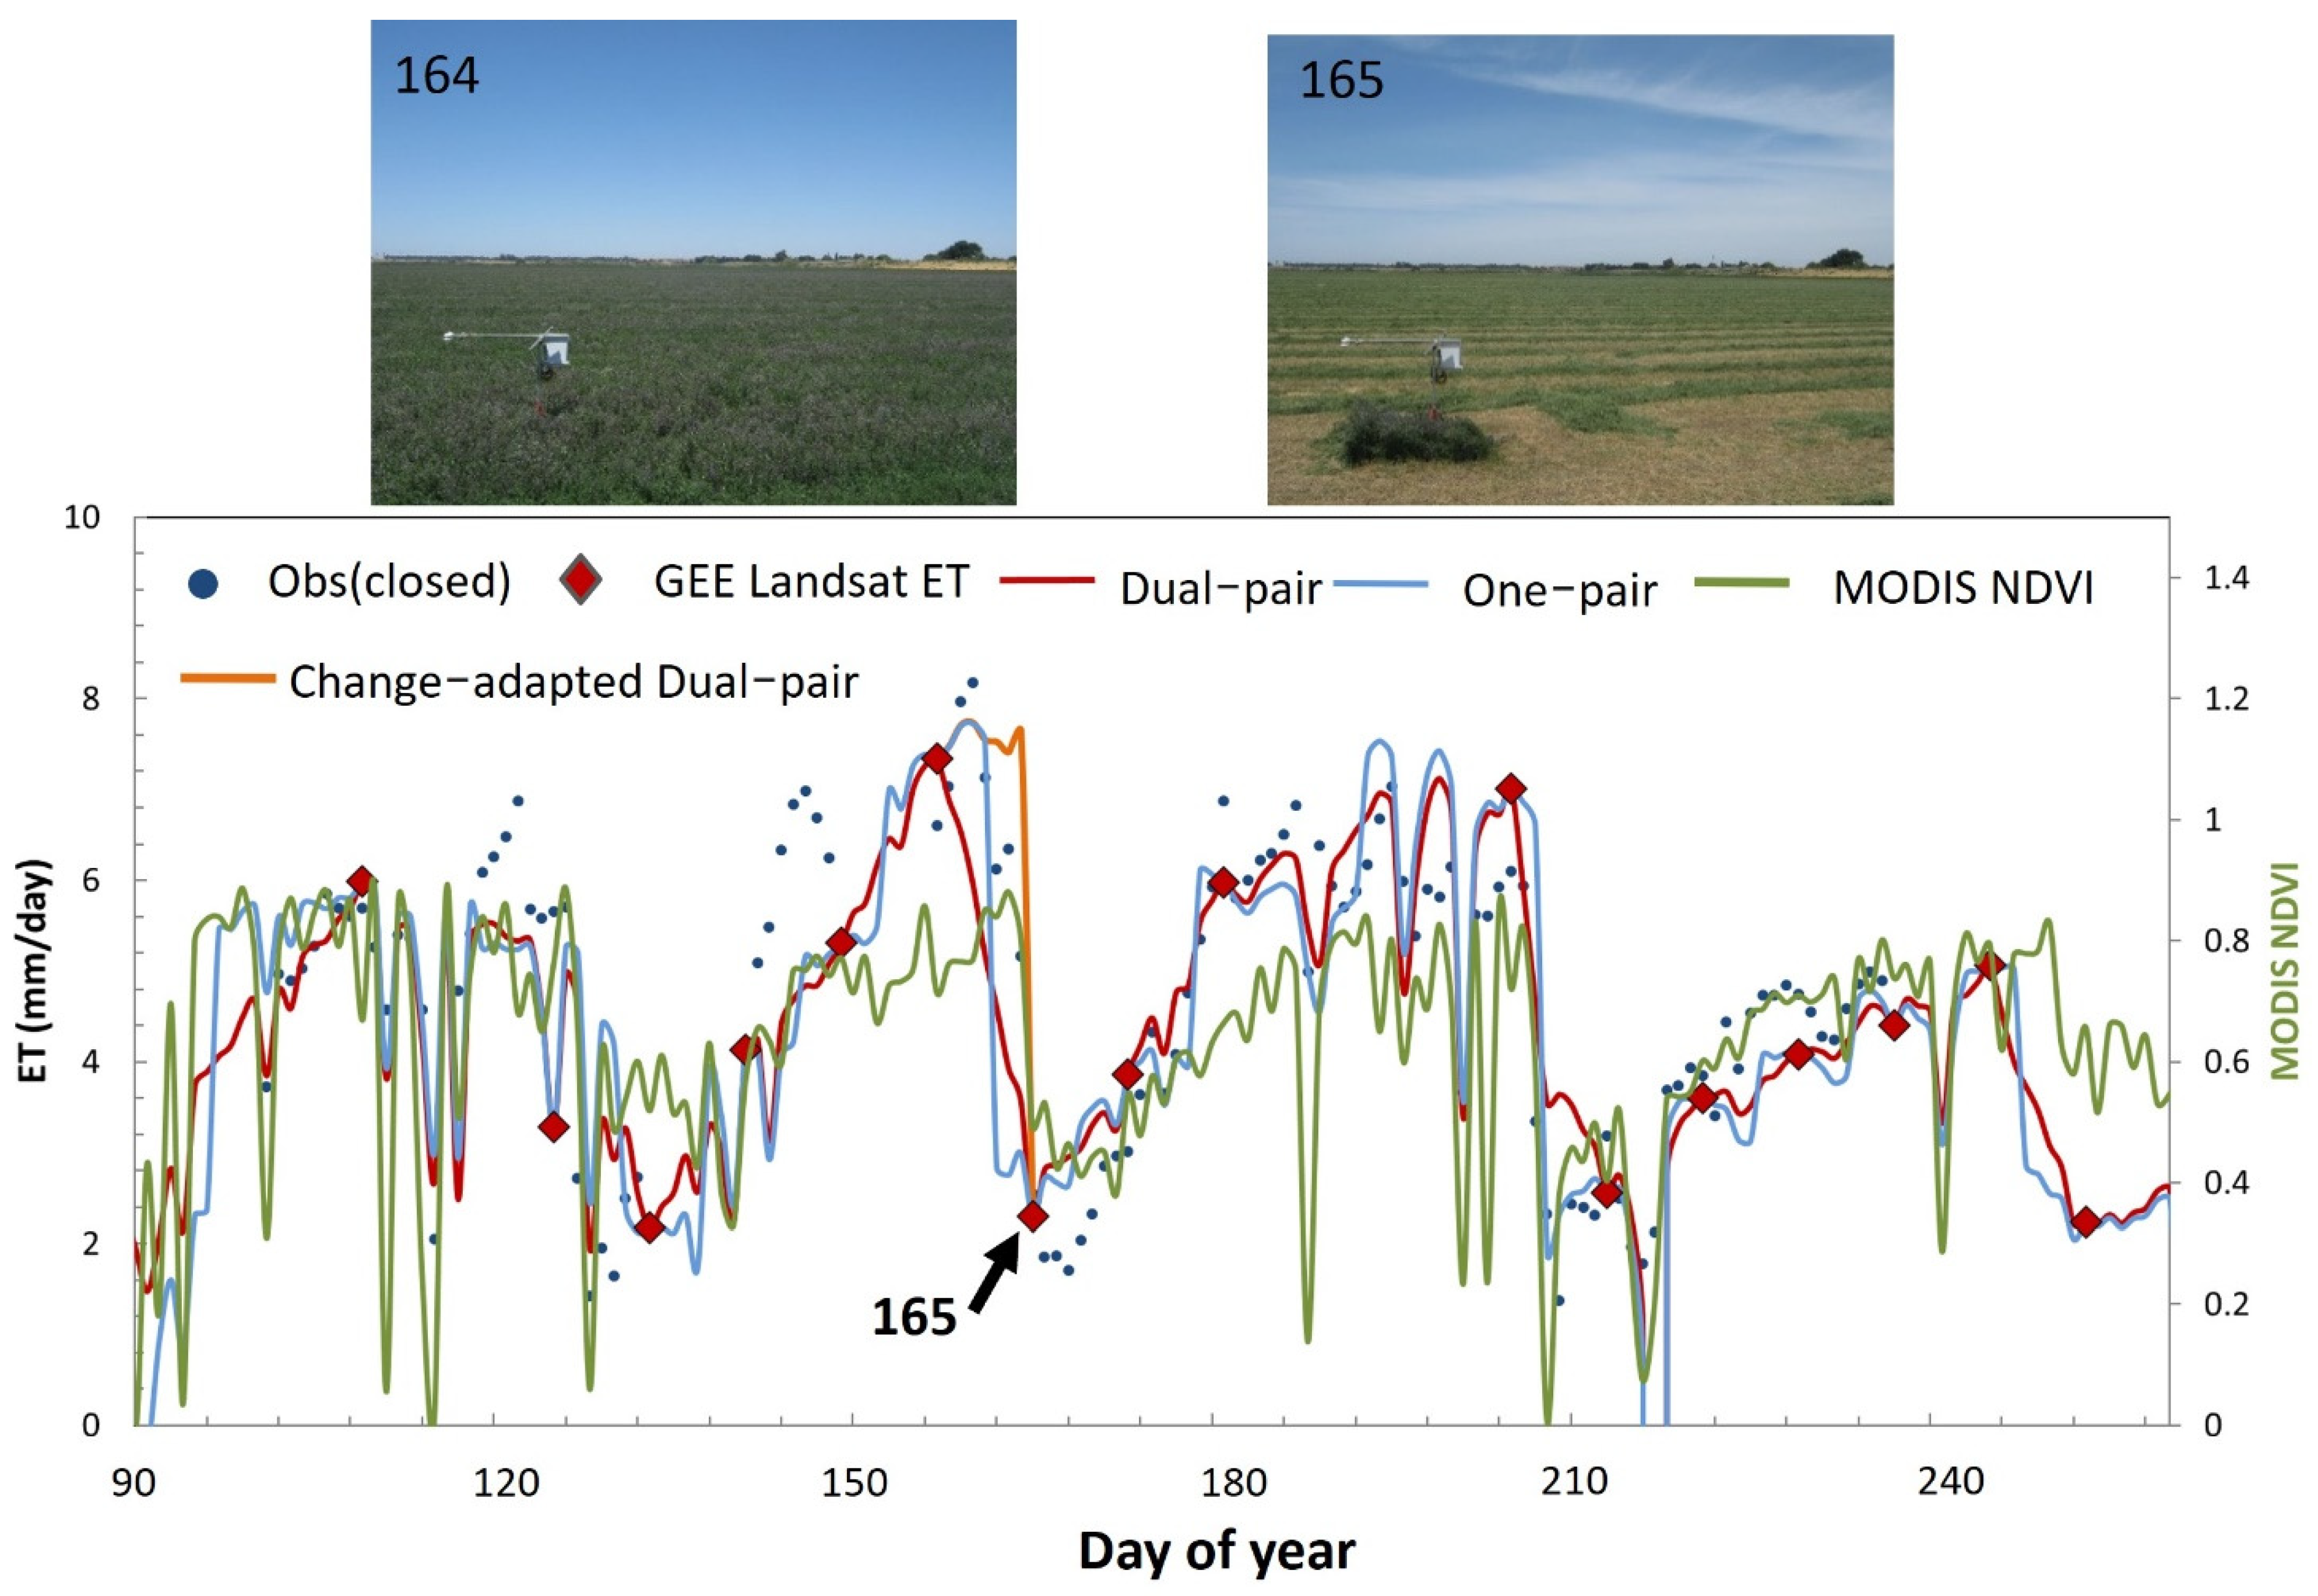
4.3. Performance of Dual-Pair and Standard One-Pair STARFM over Different Crop Types

The performance of dual-pair and one-pair STARFM was further evaluated over the major crop types in the study area. The evaluation was conducted by reproducing Landsat-scale ET for the Landsat 8 overpass days in 2014 using the two STARFM methods and then comparing with the original direct retrieval of Landsat ET. RMSE for all Landsat dates from both methods are shown in Figure 7. For the crop types examined, RMSE in reconstructed ET from both STARFM methods is typically highest at the peak of the growing season, following the magnitude of the seasonal water use curve. Exceptions are alfalfa, which has relatively consistent RMSE throughout the growing season, and rice where RMSE peaks in the early growing season. The high RMSE of alfalfa is related with the frequent harvest cycle, which is difficult to reconstruct using either method. The high RMSE for rice in the early growing season relates to rapid changes in ET during the draining and planting stage of cultivation.
Comparing the results from the two STARFM methods, the dual-pair generally out-performs the one-pair method (Figure 7) for all crops and most Landsat dates. The improvement using dual-pair STARFM is highest for corn on DOY 205 and rice on DOY 141. On average, the improvement is highest for corn, alfalfa, rice and sunflower, which is possibly due to more frequent change in field conditions (harvest and replanting, flooding and draining) or in water use patterns during different growth stages. There is relatively low improvement for grape using dual-pair, which might relate to relatively steady water use under irrigation. Still, even for vineyards the improvement in performance using the dual-pair method is demonstrable.
Figure 8a shows a scatter plot comparison of ET for grape pixels on DOY 173 reconstructed using both fusion methods with directly retrieved ET. The one-pair method has a much broader scatter in comparison with the dual-pair method. From the box plots in Figure 8b, the interquartile range and 1.5 interquartile range of the dual-pair results is similar to that of the direct Landsat ET retrieval, but slightly lower. The one-pair results have a broader interquartile range than that of the original Landsat ET, as well as higher maximum and lower minimum values. The histogram comparison in Figure 8c shows that the one-pair method overestimates ET in the range between 5.5 to 6.8 mm/day, while underestimating ET in the highest ET range. The dual-pair histogram better matches the original distribution, underestimating when ET is higher than ~4 mm/day and overestimating rates lower than 4 mm/day.
Alfalfa sites typically have multiple rounds of harvest during the growing season, which poses challenges for data fusion methods. Here, we chose one alfalfa site (US-Tw3) to further explore the capabilities of proposed dual-pair method with a phenology-dependent weighting factor. Figure 9 shows time series of daily ET from the one-pair, dual-pair with date-based weighting, and a change-adapted weighted dual-pair methods over US-Tw3 site. In the latter case, the weighting factors W1 and W2 (Equstion (3)) were set to 1 and 0 prior to harvest and 0 and 1 after harvest, with the harvest date (165) determined from the MODIS 250 m NDVI timeseries. The fused daily ET data from the three methods have similar trends that generally correspond well with the observed daily ET, except during this period of rapid vegetation change. The Landsat overpass on DOY 165 captured the exact day of harvest, as verified in imagery collected by the Phenocam installed on the flux tower. The red line shows dual-pair results when both pairs have the weight based on date as in Equstion (3). This option causes ET to decrease too early, before the harvest event on DOY 165. The blue line shows one-pair mode results, which give an abrupt change at the transition between image pairs on DOY 162, again prior to the actual harvest date. Using the change-adapted dual-pair weighting (orange line), we can adjust the weighting factor based on the change of NDVI to more accurately capture the rapid change in ET caused by harvest.

5. Discussion

5.1. Advantages and Limitations of the Dual-Pair Option

This study demonstrates better performance of the dual-pair over the one-pair STARFM method for all the major crop types in the study area. The fused daily ET from the dual-pair STARFM method compares better with the observed ET than the ET from the one-pair STARFM (Table 1). Both MAE and RMSE of dual-pair results are improved for all four flux tower sites in comparison with the observations. Comparing reproduced 30 m ET maps using the two STARFM methods with direct retrievals of Landsat ET also demonstrates better performance of the dual-pair method (Figure 4, Figure 7 and Figure 8) for all the major crop types in the study area, although the difference of average ET from the two methods are small. The temporal variation of fused ET timeseries from the one-pair STARFM is larger than that from the dual-pair STARFM, while the dual-pair STARFM tends to smooth the peaks. The dual-pair method also better reconstructs spatial variability in ET across the modeling domain, especially in areas that are undergoing rapid changes (Figure 8a1,a2).
The newly developed dual-pair option has built-in weighting factors that can be adapted with a coupled change-detection algorithm. For pixels that do not experience abrupt changes in land surface conditions between pair dates, the date-based weight is given to each of the dual pairs. However, if abrupt disturbance changes (e.g., fire, thinning and harvest) occur, such as the harvest of alfalfa around day 165 in Figure 9, the weighting factors can be adjusted to better capture this change, effectively decoupling post-change predictions from the pre-change pair date. This change-based adjustment of the weighting factors requires information derived from other satellite systems with temporal frequency higher than that of Landsat. In this study, we used MODIS NDVI as an indicator of abrupt changes, since the studied alfalfa site is large and fairly homogenous. In future work, we plan to integrate vegetation index (VI) information from combined data sources, including MODIS, harmonized Landsat and Sentinel-2 (HLS) and Planet data, to increase the accuracy of disturbance detection for heterogenous areas.
The dual-pair option requires two image pairs bracketing the prediction date and therefore is not suitable for near real-time ET monitoring where only one image pair from the past is available. In this case, a projection from the last available image to present might be accomplished by using a VI-dependent scaling flux such as ETo*NDVI, where ETo is the reference ET. Therefore, both prior time-series (determined by STARFM weighted dual pair) and the projected times-series would be responsive to changes in vegetation cover.

5.2. Impact of Landcover Type and Patch Scale

As demonstrated in Figure 7, the dual-pair STARFM method was found to outperform the standard one-pair method for all major crop types represented in the study domain. Characteristic water use curves for crops grown in the CA Delta region are given in Anderson et al. [18] (Figure 18). Relative improvement was strongest in crops with more compressed peak water use cycles (e.g., corn, tomatoes), or multi-model water use curves (e.g., rice, alfalfa).
In general, the largest benefit of the dual-pair STARFM scheme will be realized over smaller landcover patches (well resolved at the 30 m Landsat scale) that exhibit changes in water use with a significantly temporal pattern than does the background vegetation (dominating at the coarser MODIS 500 m scale). These changes are not captured by the MODIS fusion backbone timeseries, and thus the STARFM downscaling weights evolve rapidly between MODIS-Landsat pairs, leading to discontinuities in fused ET on the transition date between pairs in the one-pair mode. Less benefit will be observed over landcovers where temporal water use is more consistent from the 30 to 500 m scale, such as in forests and natural grasslands.

5.3. Impact of Landsat ET Frequency

Comparison between the performance of the STARFM dual-pair method applied to both Landsat 7 and 8 compared to using Landsat 8 alone (Table 1) demonstrates that data fusion accuracy is improved with more frequent high resolution samples. The successful launch of Landsat 9 will certainly benefit ET monitoring using data fusion methods, especially for sites with sudden disturbance, rapid change, or persistent cloud cover. Incorporation of additional Landsat-scale thermal data sources (e.g., ECOSTRESS, VIIRS, and proposed SBG and LSTM missions) can also serve to improve temporal sampling of moisture status at that critical field scale [21].

6. Conclusions

Data fusion has been widely used to combine data with different spatiotemporal resolutions to obtain higher spatiotemporal resolution image timeseries. The one-pair STARFM method has been used to fuse ET estimated from Landsat and MODIS for simplicity, but it can result in a sudden change of fused values when switching image pairs. Here, we improved the one-pair STARFM by using both pairs of images bracketing the prediction day and developed a new dual-pair STARFM method. The dual-pair STARFM method out-performed the standard one-pair method both in point comparisons with flux tower observations collected in the Central Valley, CA, study area, and in reproducing Landsat-scale ET maps directly retrieved on Landsat overpass dates. The study demonstrates that the newly developed dual-pair STARFM method advances the one-pair STARFM for all the major crop types in this study region. We also demonstrate the value of more frequent Landsat observations in improving the performance of data fusion. The findings from this study can help to improve the time series ET estimation and to provide higher quality of information for water resource and watershed management.

Author Contributions

Conceptualization: Y.Y., M.A., F.G.; Data Fusion system: Y.Y., M.A., F.G., K.K., J.X., C.H.; Formal analysis: Y.Y., M.A., F.G., J.X.; Writing—original draft: Y.Y.; Writing—review and editing: M.A., F.G., J.X., K.K., C.H. All authors have read and agreed to the published version of the manuscript.

Funding

This work was funded in part by the NASA’s Land Cover and Land Use MuSLI Program (Grant Number: NNH17ZDA001N-LCLUC), the NASA’s Science of TERRA, AQUA, and SUOMI NPP Program (Grant Number: NNH17ZDA001N- TASNPP), and the NASA ECOSTRESS Program.

Data Availability Statement

Not applicable.

Conflicts of Interest

The authors declare no conflict of interest.

References

  1. Cf, O. Transforming Our World: The 2030 Agenda for Sustainable Development; United Nations: New York, NY, USA, 2015. Available online: https://sdgs.un.org/2030agenda (accessed on 10 January 2022).
  2. Dai, A. Increasing Drought under Global Warming in Observations and Models. Nat. Clim. Chang. 2013, 3, 52–58. [Google Scholar] [CrossRef]
  3. Flörke, M.; Schneider, C.; McDonald, R.I. Water Competition between Cities and Agriculture Driven by Climate Change and Urban Growth. Nat. Sustain. 2018, 1, 51–58. [Google Scholar] [CrossRef]
  4. Wada, Y.; Gleeson, T.; Esnault, L. Wedge Approach to Water Stress. Nat. Geosci. 2014, 7, 615–617. [Google Scholar] [CrossRef]
  5. Kustas, W.P.; Anderson, M.C.; Alfieri, J.G.; Knipper, K.; Torres-Rua, A.; Parry, C.K.; Nieto, H.; Agam, N.; White, W.A.; Gao, F.; et al. The Grape Remote Sensing Atmospheric Profile and Evapotranspiration Experiment. Bull. Am. Meteorol. Soc. 2018, 99, 1791–1812. [Google Scholar] [CrossRef] [PubMed] [Green Version]
  6. Baldocchi, D.; Dralle, D.; Jiang, C.; Ryu, Y. How Much Water Is Evaporated Across California? A Multiyear Assessment Using a Biophysical Model Forced With Satellite Remote Sensing Data. Water Resour. Res. 2019, 55, 2722–2741. [Google Scholar] [CrossRef]
  7. Semmens, K.A.; Anderson, M.C.; Kustas, W.P.; Gao, F.; Alfieri, J.G.; McKee, L.; Prueger, J.H.; Hain, C.R.; Cammalleri, C.; Yang, Y. Monitoring Daily Evapotranspiration over Two California Vineyards Using Landsat 8 in a Multi-Sensor Data Fusion Approach. Remote Sens. Environ. 2016, 185, 155–170. [Google Scholar] [CrossRef] [Green Version]
  8. Duveiller, G.; Hooker, J.; Cescatti, A. The Mark of Vegetation Change on Earth’s Surface Energy Balance. Nat. Commun. 2018, 9, 679. [Google Scholar] [CrossRef] [PubMed] [Green Version]
  9. Yang, Y.; Anderson, M.; Gao, F.; Hain, C.; Noormets, A.; Sun, G.; Wynne, R.; Thomas, V.; Sun, L. Investigating Impacts of Drought and Disturbance on Evapotranspiration over a Forested Landscape in North Carolina, USA Using High Spatiotemporal Resolution Remotely Sensed Data. Remote Sens. Environ. 2020, 238, 111018. [Google Scholar] [CrossRef]
  10. Anderson, M.; Kustas, W. Thermal Remote Sensing of Drought and Evapotranspiration. Eos Trans. Am. Geophys. Union 2008, 89, 233. [Google Scholar] [CrossRef]
  11. Yang, Y.; Anderson, M.C.; Gao, F.; Wardlow, B.; Hain, C.R.; Otkin, J.A.; Alfieri, J.; Yang, Y.; Sun, L.; Dulaney, W. Field-Scale Mapping of Evaporative Stress Indicators of Crop Yield: An Application over Mead, NE, USA. Remote Sens. Environ. 2018, 210, 387–402. [Google Scholar] [CrossRef]
  12. Knipper, K.R.; Kustas, W.P.; Anderson, M.C.; Alfieri, J.G.; Prueger, J.H.; Hain, C.R.; Gao, F.; Yang, Y.; McKee, L.G.; Nieto, H.; et al. Evapotranspiration Estimates Derived Using Thermal-Based Satellite Remote Sensing and Data Fusion for Irrigation Management in California Vineyards. Irrig. Sci. 2018. [Google Scholar] [CrossRef]
  13. Fisher, J.B.; Melton, F.; Middleton, E.; Hain, C.; Anderson, M.; Allen, R.; McCabe, M.F.; Hook, S.; Baldocchi, D.; Townsend, P.A. The Future of Evapotranspiration: Global Requirements for Ecosystem Functioning, Carbon and Climate Feedbacks, Agricultural Management, and Water Resources. Water Resour. Res. 2017, 53, 2618–2626. [Google Scholar] [CrossRef]
  14. Anderson, M.; Yang, Y.; Xue, J.; Knipper, K.; Yang, Y.; Gao, F.; Hain, C.; Kustas, W.P.; Cawse-Nicholson, K.; Hulley, G.; et al. Interoperability of ECOSTRESS and Landsat for Mapping Evapotranpiration Time Series at Sub-Field Scales. Remote Sens. Environ. 2021, 252, 112189. [Google Scholar] [CrossRef]
  15. Anderson, M.C.; Kustas, W.P.; Alfieri, J.G.; Gao, F.; Hain, C.; Prueger, J.H.; Evett, S.; Colaizzi, P.; Howell, T.; Chávez, J.L. Mapping daily evapotranspiration at Landsat spatial scales during the BEAREX’08 field campaign. Adv. Water Resour. 2012, 50, 162–177. [Google Scholar]
  16. Allen, R.G.; Tasumi, M.; Trezza, R. Satellite-Based Energy Balance for Mapping Evapotranspiration with Internalized Calibration (METRIC)—Model. J. Irrig. Drain. Eng. 2007, 133, 380–394. [Google Scholar] [CrossRef]
  17. Gao, F.; Kustas, W.P.; Anderson, M.C. A data mining approach for sharpening thermal satellite imagery over land. Remote Sens. 2012, 44, 3287–3319. [Google Scholar]
  18. Anderson, M.; Gao, F.; Knipper, K.; Hain, C.; Dulaney, W.; Baldocchi, D.; Eichelmann, E.; Hemes, K.; Yang, Y.; Medellin-Azuara, J. Field-Scale Assessment of Land and Water Use Change over the California Delta Using Remote Sensing. Remote Sens. 2018, 10, 889. [Google Scholar] [CrossRef] [Green Version]
  19. Sun, L.; Anderson, M.C.; Gao, F.; Hain, C.; Alfieri, J.G.; Sharifi, A.; McCarty, G.W.; Yang, Y.; Yang, Y.; Kustas, W.P. Investigating Water Use over the Choptank River Watershed Using a Multisatellite Data Fusion Approach. Water Resour. Res. 2017. [Google Scholar] [CrossRef] [Green Version]
  20. Cammalleri, C.; Anderson, M.C.; Gao, F.; Hain, C.R.; Kustas, W.P. A Data Fusion Approach for Mapping Daily Evapotranspiration at Field Scale. Water Resour. Res. 2013, 49, 4672–4686. [Google Scholar] [CrossRef]
  21. Xue, J.; Anderson, M.C.; Gao, F.; Hain, C.; Yang, Y.; Knipper, K.R.; Kustas, W.P.; Yang, Y. Mapping Daily Evapotranspiration at Field Scale Using the Harmonized Landsat and Sentinel-2 Dataset, with Sharpened VIIRS as a Sentinel-2 Thermal Proxy. Remote Sens. 2021, 13, 3420. [Google Scholar] [CrossRef]
  22. Xie, D.; Gao, F.; Sun, L.; Anderson, M. Improving Spatial-Temporal Data Fusion by Choosing Optimal Input Image Pairs. Remote Sens. 2018, 10, 1142. [Google Scholar] [CrossRef] [Green Version]
  23. Zhu, X.; Cai, F.; Tian, J.; Williams, T.K.-A. Spatiotemporal Fusion of Multisource Remote Sensing Data: Literature Survey, Taxonomy, Principles, Applications, and Future Directions. Remote Sens. 2018, 10, 527. [Google Scholar] [CrossRef] [Green Version]
  24. Norman, J.M.; Kustas, W.P.; Humes, K.S. Source Approach for Estimating Soil and Vegetation Energy Fluxes in Observations of Directional Radiometric Surface Temperature. Agric. For. Meteorol. 1995, 77, 263–293. [Google Scholar] [CrossRef]
  25. Kustas, W.P.; Norman, J.M. Evaluation of Soil and Vegetation Heat Flux Predictions Using a Simple Two-Source Model with Radiometric Temperatures for Partial Canopy Cover. Agric. For. Meteorol. 1999, 94, 13–29. [Google Scholar] [CrossRef]
  26. Kustas, W.P.; Norman, J.M. A Two-Source Energy Balance Approach Using Directional Radiometric Temperature Observations for Sparse Canopy Covered Surfaces. Agron. J. 2000, 92, 847–854. [Google Scholar] [CrossRef]
  27. Anderson, M.C.; Norman, J.M.; Diak, G.R.; Kustas, W.P.; Mecikalski, J.R. A Two-Source Time-Integrated Model for Estimating Surface Fluxes Using Thermal Infrared Remote Sensing. Remote Sens. Environ. 1997, 60, 195–216. [Google Scholar] [CrossRef]
  28. Anderson, M.C.; Kustas, W.P.; Norman, J.M. Upscaling Flux Observations from Local to Continental Scales Using Thermal Remote Sensing. Agron. J. 2007, 99, 240. [Google Scholar] [CrossRef] [Green Version]
  29. Anderson, M.C.; Norman, J.M.; Mecikalski, J.R.; Torn, R.D.; Kustas, W.P.; Basara, J.B. A Multiscale Remote Sensing Model for Disaggregating Regional Fluxes to Micrometeorological Scales. J. Hydrometeorol. 2004, 5, 343–363. [Google Scholar] [CrossRef]
  30. Anderson, M.C.; Kustas, W.P.; Norman, J.M.; Hain, C.R.; Mecikalski, J.R.; Schultz, L.; González-Dugo, M.P.; Cammalleri, C.; d’Urso, G.; Pimstein, A.; et al. Mapping Daily Evapotranspiration at Field to Continental Scales Using Geostationary and Polar Orbiting Satellite Imagery. Hydrol. Earth Syst. Sci. 2011, 15, 223–239. [Google Scholar] [CrossRef] [Green Version]
  31. Yang, Y.; Anderson, M.; Gao, F.; Hain, C.; Kustas, W.; Meyers, T.; Crow, W.; Finocchiaro, R.; Otkin, J.; Sun, L. Impact of Tile Drainage on Evapotranspiration in South Dakota, USA, Based on High Spatiotemporal Resolution Evapotranspiration Time Series From a Multisatellite Data Fusion System. IEEE J. Sel. Top. Appl. Earth Obs. Remote Sens. 2017, 10, 2550–2564. [Google Scholar] [CrossRef]
  32. Melton, F.; Huntington, J.L.; Grimm, R.; Herring, J.; Hall, M.; Rollison, D.; Erickson, T.; Allen, R.; Anderson, M.; Fisher, J.B.; et al. OpenET: Filling a Critical Data Gap in Water Management for the Western United States. J. Am. Water Resour. Assoc. 2021. [Google Scholar] [CrossRef]
  33. Yang, Y.; Anderson, M.C.; Gao, F.; Hain, C.R.; Semmens, K.A.; Kustas, W.P.; Noormets, A.; Wynne, R.H.; Thomas, V.A.; Sun, G. Daily Landsat-Scale Evapotranspiration Estimation over a Forested Landscape in North Carolina, USA Using Multi-Satellite Data Fusion. Hydrol. Earth Syst. Sci. 2017, 21, 1017–1037. [Google Scholar] [CrossRef] [Green Version]
  34. Savitzky, A.; Golay, M.J.E. Smoothing and Differentiation of Data by Simplified Least Squares Procedures. Anal. Chem. 1964, 36, 1627–1639. [Google Scholar] [CrossRef]
  35. Weng, Q.; Fu, P.; Gao, F. Generating Daily Land Surface Temperature at Landsat Resolution by Fusing Landsat and MODIS Data. Remote Sens. Environ. 2014, 145, 55–67. [Google Scholar] [CrossRef]
  36. Wu, B.; Huang, B.; Cao, K.; Zhuo, G. Improving Spatiotemporal Reflectance Fusion Using Image Inpainting and Steering Kernel Regression Techniques. Int. J. Remote Sens. 2017, 38, 706–727. [Google Scholar] [CrossRef]
  37. Wang, Q.; Zhang, Y.; Onojeghuo, A.O.; Zhu, X.; Atkinson, P.M. Enhancing Spatio-Temporal Fusion of MODIS and Landsat Data by Incorporating 250 m MODIS Data. IEEE J. Sel. Top. Appl. Earth Obs. Remote Sens. 2017, 10, 4116–4123. [Google Scholar] [CrossRef]
  38. Hilker, T.; Wulder, M.A.; Coops, N.C.; Linke, J.; McDermid, G.; Masek, J.G.; Gao, F.; White, J.C. A New Data Fusion Model for High Spatial-and Temporal-Resolution Mapping of Forest Disturbance Based on Landsat and MODIS. Remote Sens. Environ. 2009, 113, 1613–1627. [Google Scholar] [CrossRef]
  39. Zhu, X.; Chen, J.; Gao, F.; Chen, X.; Masek, J.G. An Enhanced Spatial and Temporal Adaptive Reflectance Fusion Model for Complex Heterogeneous Regions. Remote Sens. Environ. 2010, 114, 2610–2623. [Google Scholar] [CrossRef]
  40. Zhu, Z.; Woodcock, C.E. Continuous Change Detection and Classification of Land Cover Using All Available Landsat Data. Remote Sens. Environ. 2014, 144, 152–171. [Google Scholar] [CrossRef] [Green Version]
  41. Liang, S. Narrowband to Broadband Conversions of Land Surface Albedo I: Algorithms. Remote Sens. Environ. 2001, 76, 213–238. [Google Scholar] [CrossRef]
  42. Tsaumi, M.; Richard, G.A.; Trezza, R. At-Surface Reflectance and Albedo from Satellite for Operational Calculation of Land Surface Energy Balance. J. Hydrol. Eng. 2008, 13, 51–63. [Google Scholar] [CrossRef]
  43. Kang, Y.; Ozdogan, M.; Gao, F.; Anderson, M.C.; White, W.A.; Yang, Y.; Yang, Y.; Erickson, T.A. A Data-Driven Approach to Estimate Leaf Area Index for Landsat Images over the Contiguous US. Remote Sens. Environ. 2021, 258, 112383. [Google Scholar] [CrossRef]
  44. Pastorello, G.; Trotta, C.; Canfora, E.; Chu, H.; Christianson, D.; Cheah, Y.-W.; Poindexter, C.; Chen, J.; Elbashandy, A.; Humphrey, M. The FLUXNET2015 Dataset and the ONEFlux Processing Pipeline for Eddy Covariance Data. Sci. Data 2020, 7, 1–27. [Google Scholar]
  45. Volk, J.; Huntington, J.; Allen, R.; Melton, F.; Anderson, M.; Kilic, A. Flux-Data-Qaqc: A Python Package for Energy Balance Closure and Post-Processing of Eddy Flux Data. J. Open Source Softw. 2021, 6, 3418. [Google Scholar] [CrossRef]
Figure 1. Study area in the Central Valley of California, USA (left) and land-use classes from the CROP2014 dataset (right).
Remotesensing 14 01772 g001
Figure 2. Schematic diagram of different STARFM modes operating under consistent change and abrupt change conditions. On the top of each panel is an example of pair information at the pixel level. (a) One-pair STARFM; (b) two-pair STARFM; (c) proposed dual-pair STARFM.
Remotesensing 14 01772 g002
Figure 3. Percentage of major land use types in the study area based on the 2014 land use data.
Remotesensing 14 01772 g003
Figure 4. Reproduced Landsat-scale ET on DOY 2014205 using different STARFM methods comparing with direct retrievals of Landsat ET.
Remotesensing 14 01772 g004
Figure 5. Histogram of average ET reproduced using the three fusion methods compared average ET from the direct retrievals.
Remotesensing 14 01772 g005
Figure 6. Comparison of observed flux tower ET and fused daily ET using dual-pair and one-pair STARFM over the US-Twt site in 2014.
Remotesensing 14 01772 g006
Figure 7. Comparison of RMSE between dual-pair and one-pair for the tested Landsat overpass days in 2014 for major crop types.
Remotesensing 14 01772 g007
Figure 8. Performance of one-pair and dual-pair STARFM method over vineyards in the study area for DOY2014173. (a1) The scatter plot of original Landsat ET and reproduced Landsat ET using dual-pair method. (a2) The scatter plot of original Landsat ET and reproduced Landsat ET using the one-pair method. (b) The box plot of original Landsat ET, reproduced ET using the dual-pair and one-pair methods. (c) The histogram of original Landsat ET, reproduced ET using the dual-pair and one-pair methods.
Remotesensing 14 01772 g008
Figure 9. Time series of daily fused ET using different STARFM modes over the growing season of 2014 for US-Tw3 alfalfa site.
Remotesensing 14 01772 g009
Table 1. Statistical metrics of evaluation of STARFM fused daily ET. Observation Average is the average value from flux tower observed closed ET (mm/day); n is the total number of observations; MAE is mean absolute error (mm/day); MBE is mean bias error (mm/day); RMSE is root mean square error (mm/day). The grey color highlights the method of best performance, comparing dual-pair and one-pair.
TowersPAIRSMAEMBERMSEMAEMBERMSEObservation
Average
n
Landsat 7&8Landsat 8 Only
US-TwtDualPair0.980.621.231.130.711.414.14797
OnePair1.030.651.291.210.791.534.14797
US-Tw3DualPair1.08−0.481.321.11−0.381.373.931090
OnePair1.12−0.471.381.15−0.361.443.931090
SLM001DualPair0.820.431.020.850.421.053.94726
OnePair0.870.441.060.900.451.103.94726
SLM002DualPair0.880.651.080.920.701.143.93706
OnePair0.920.661.120.960.721.183.93706
Publisher’s Note: MDPI stays neutral with regard to jurisdictional claims in published maps and institutional affiliations.

