
Monitoring Oasis Cotton Fields Expansion in Arid Zones Using the Google Earth Engine: A Case Study in the Ogan-Kucha River Oasis, Xinjiang, China

Abstract
:1. Introduction
2. Materials and Methods
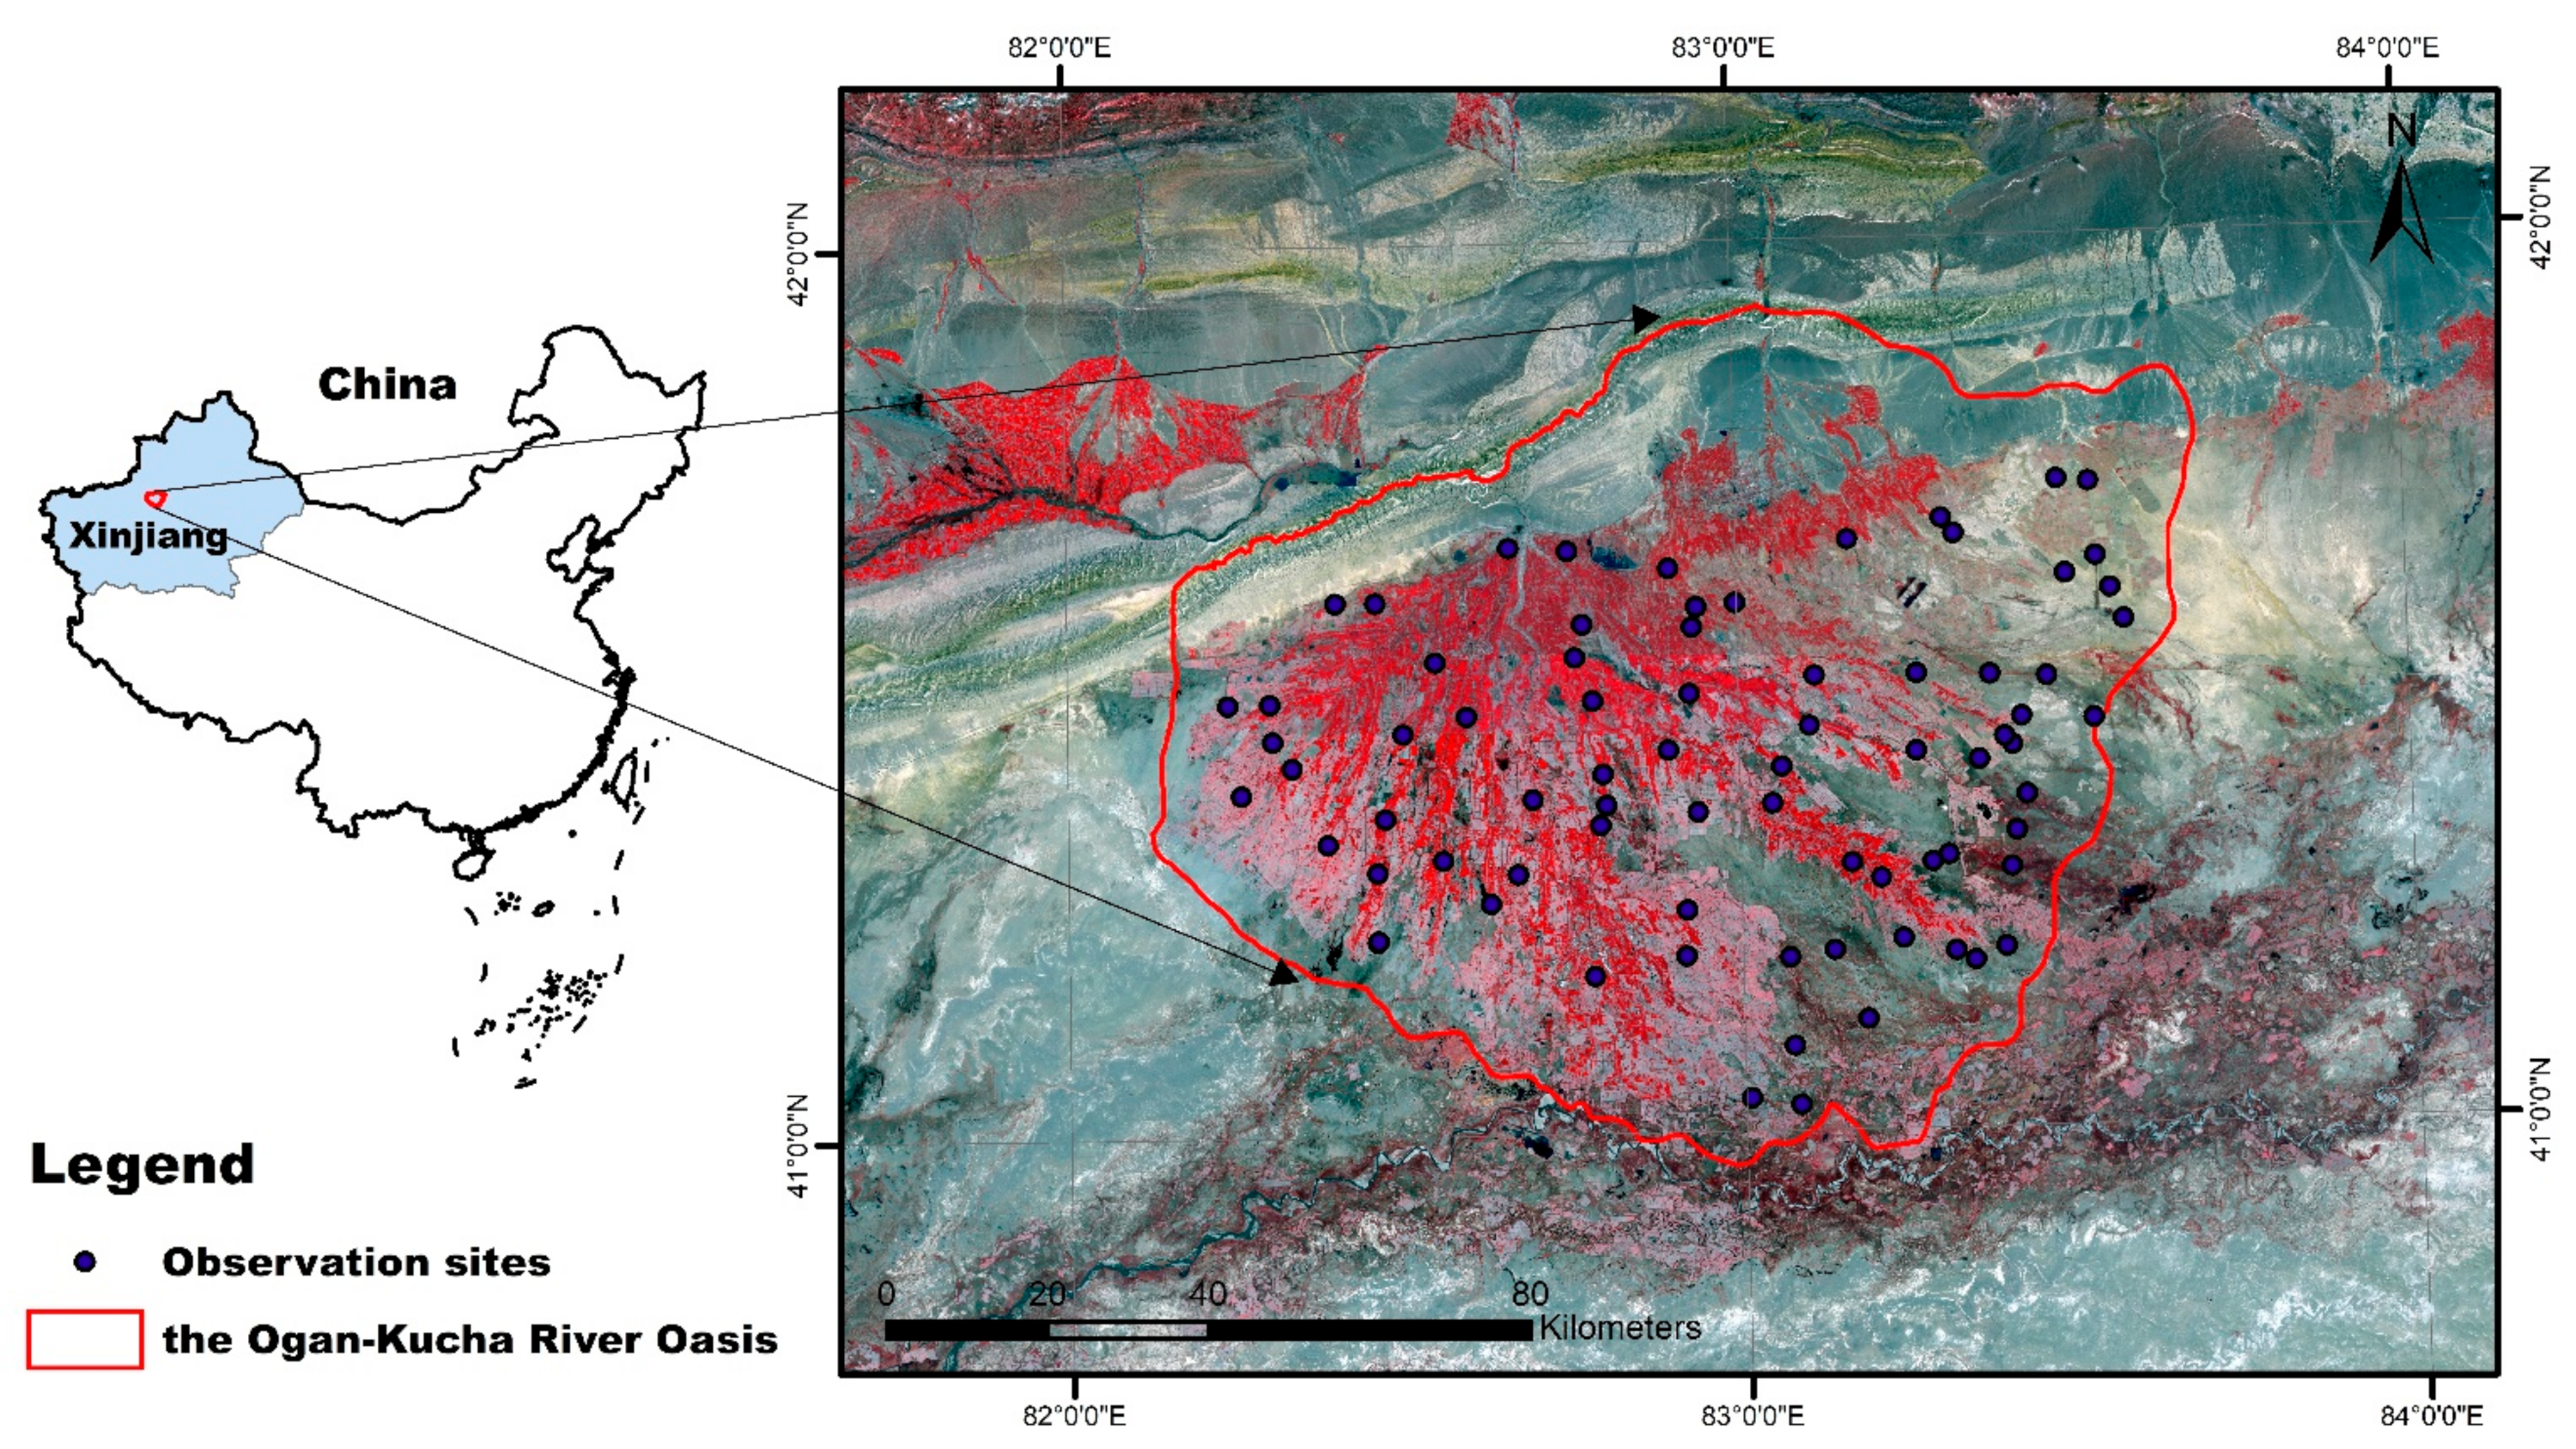
2.1. Study Area
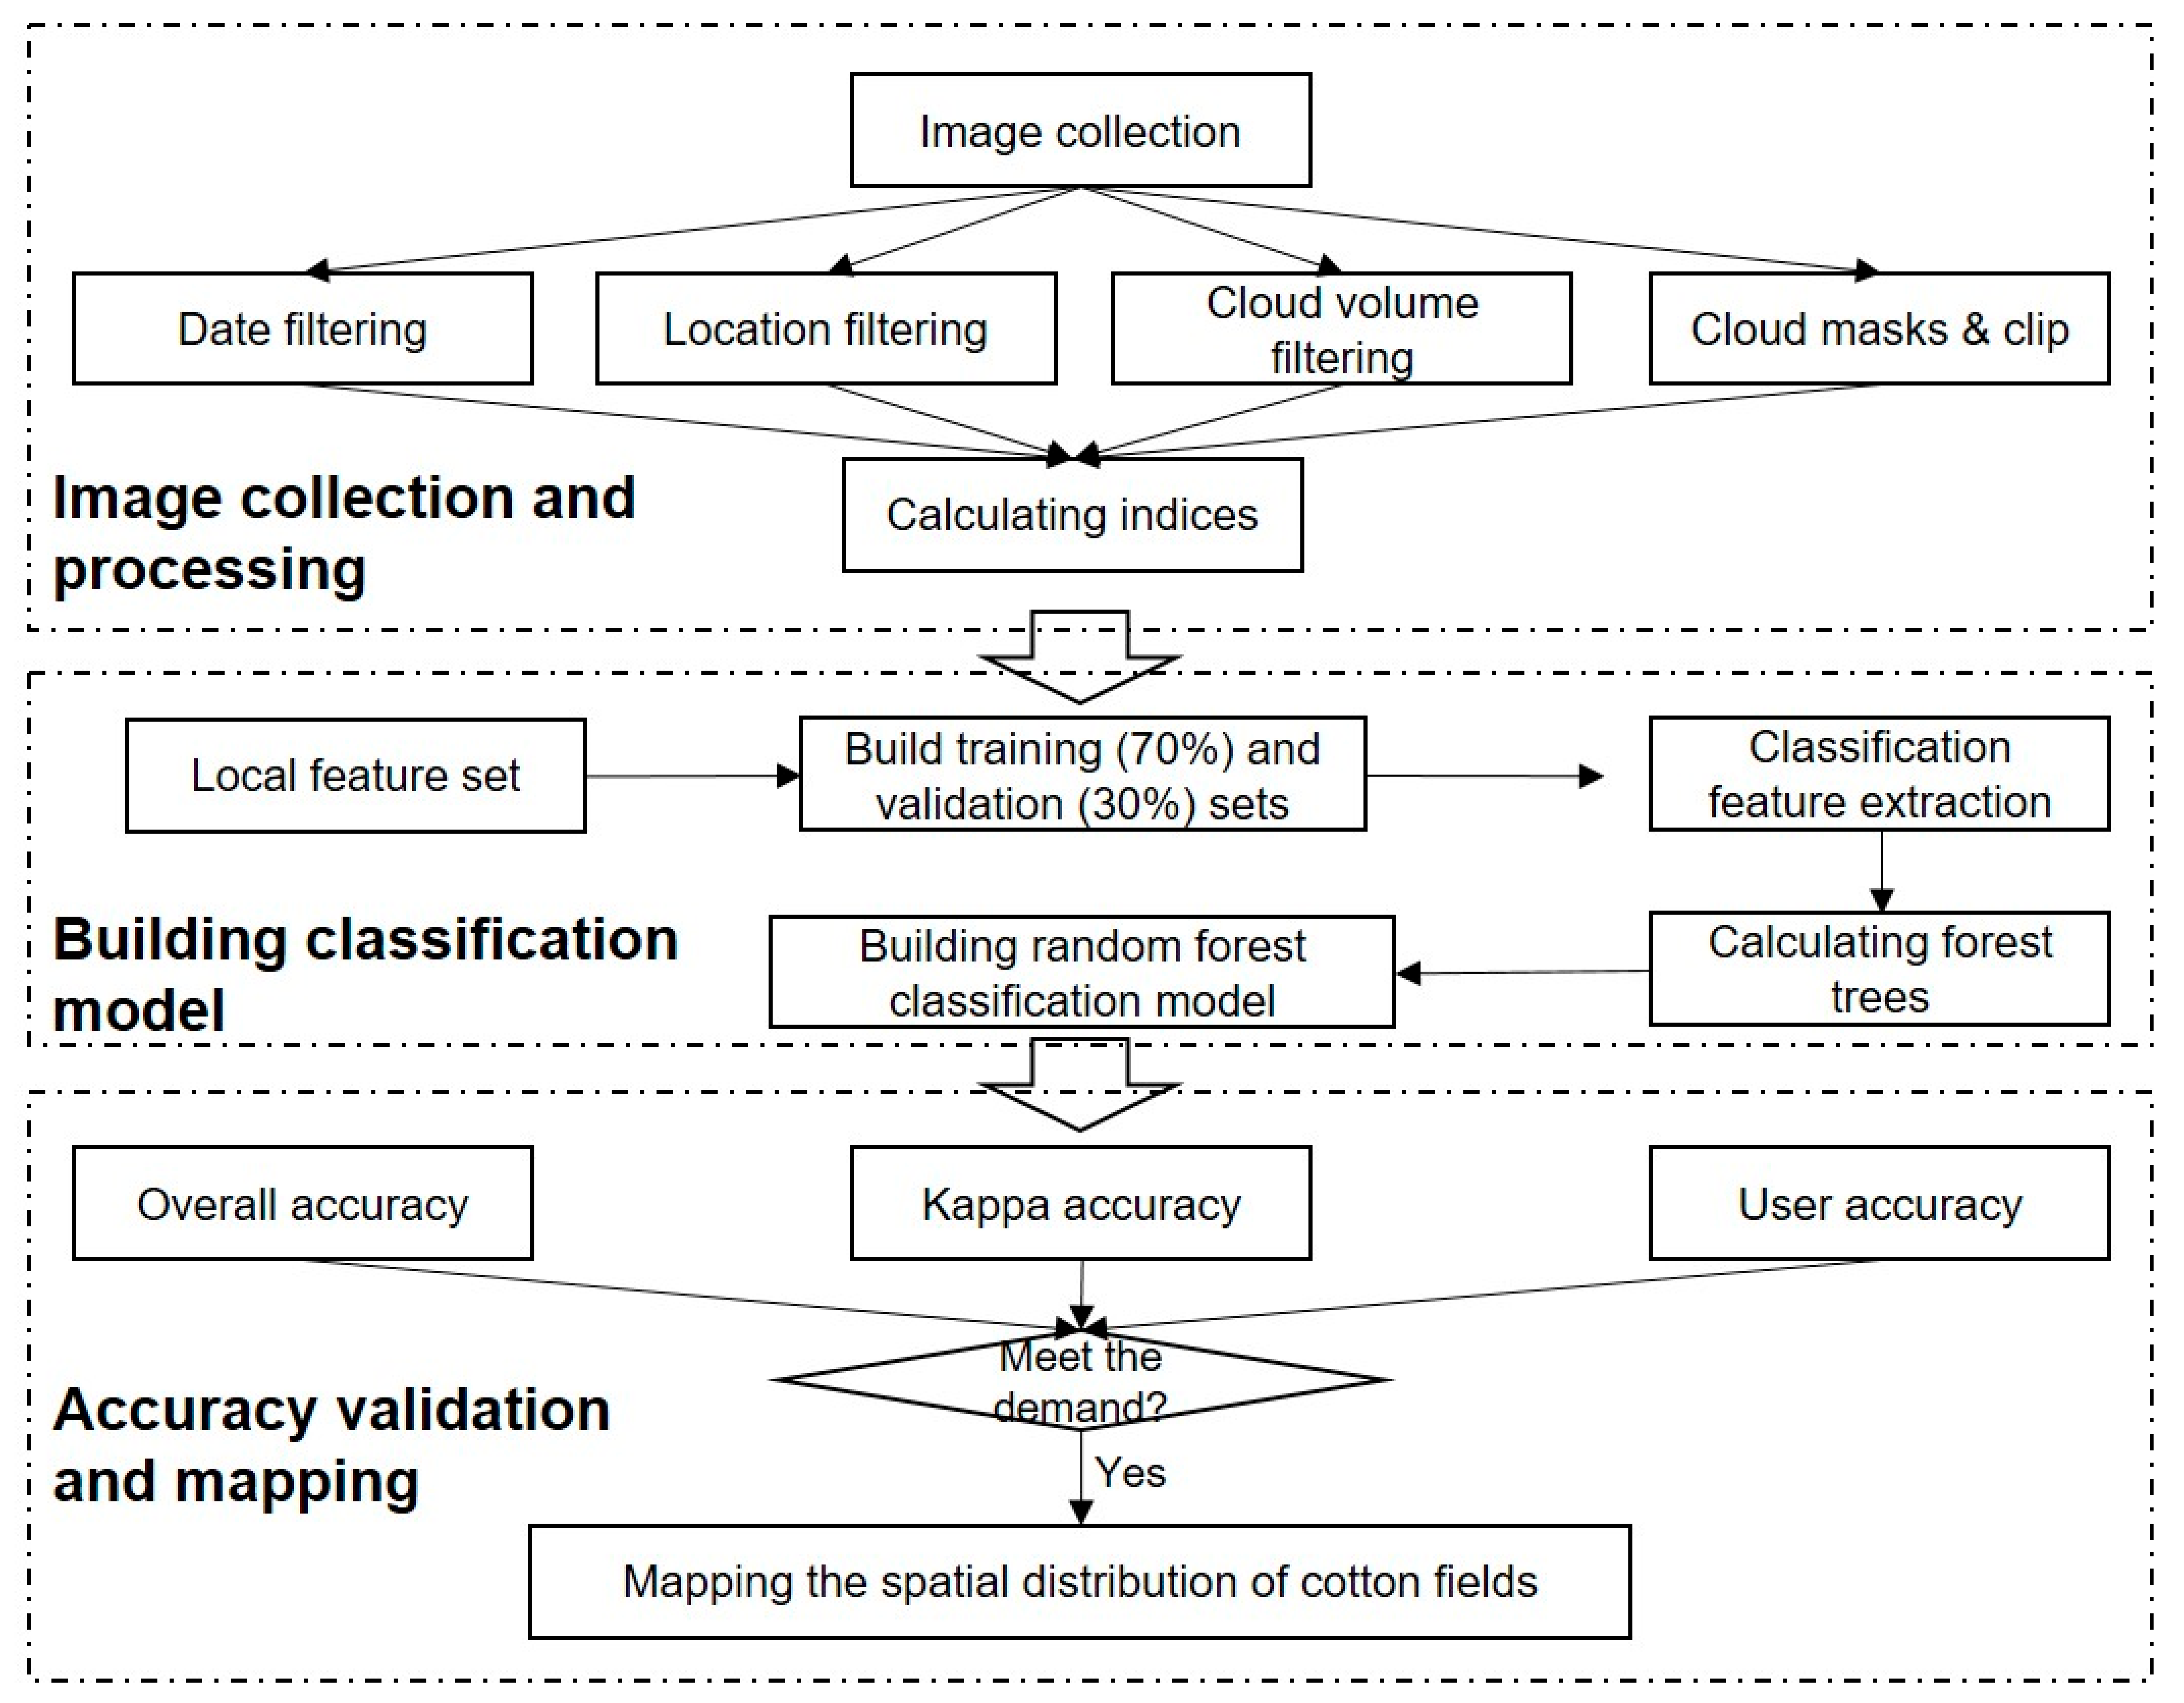
2.2. Methods
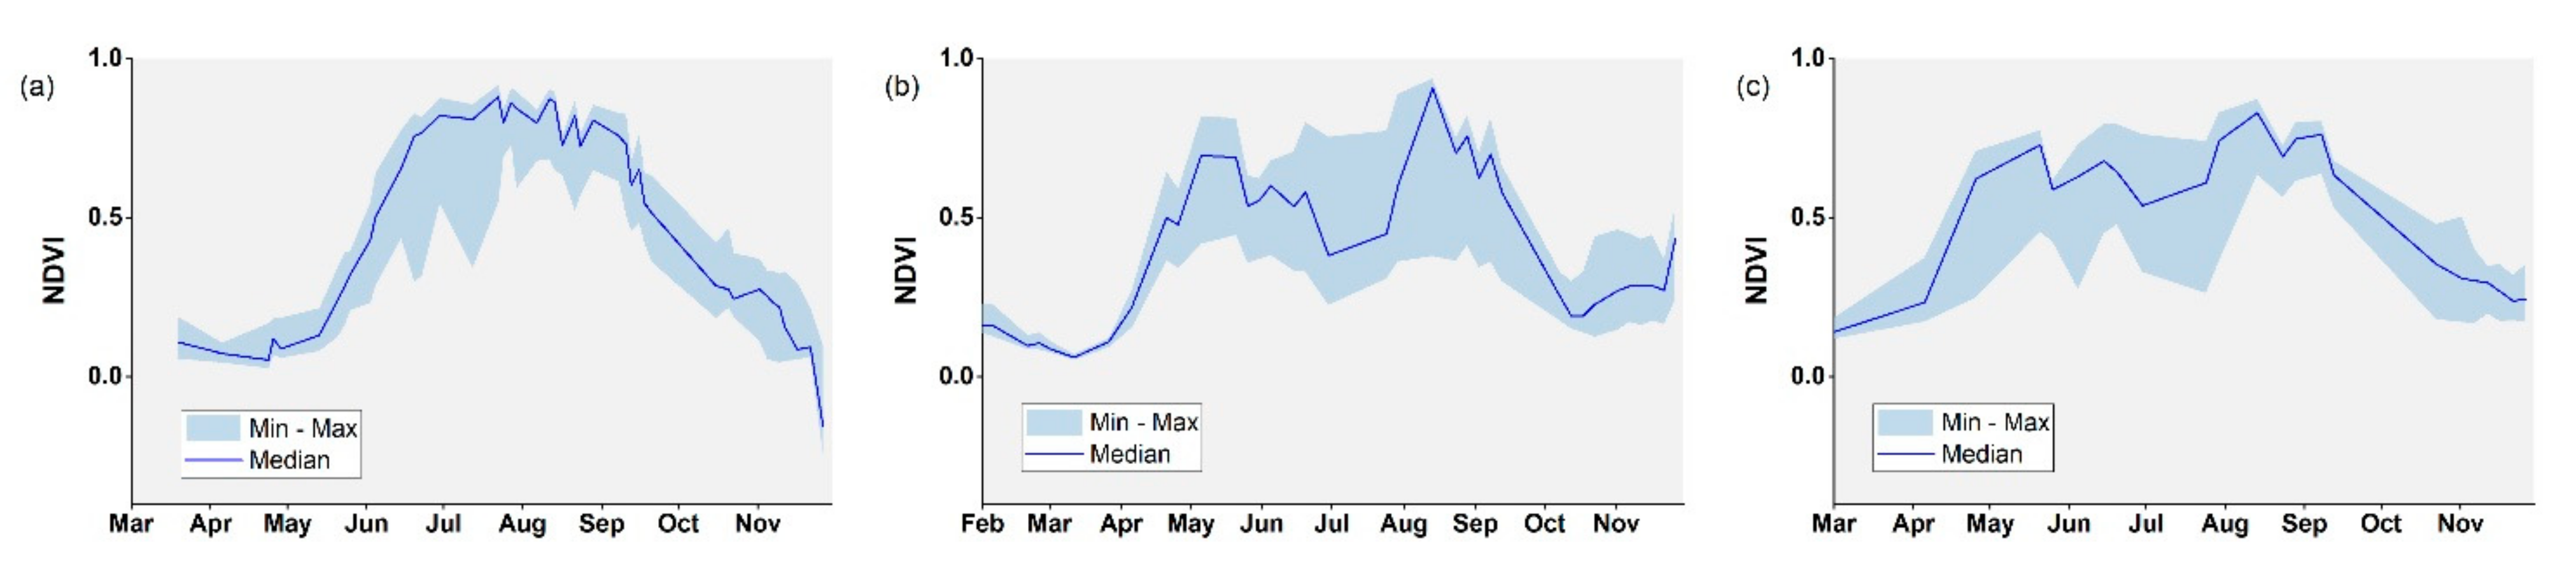
2.2.1. Cotton Phenology Information
2.2.2. GEE Image Collection
2.2.3. Supervised Classification Model
2.3. Accuracy Assessment
3. Results
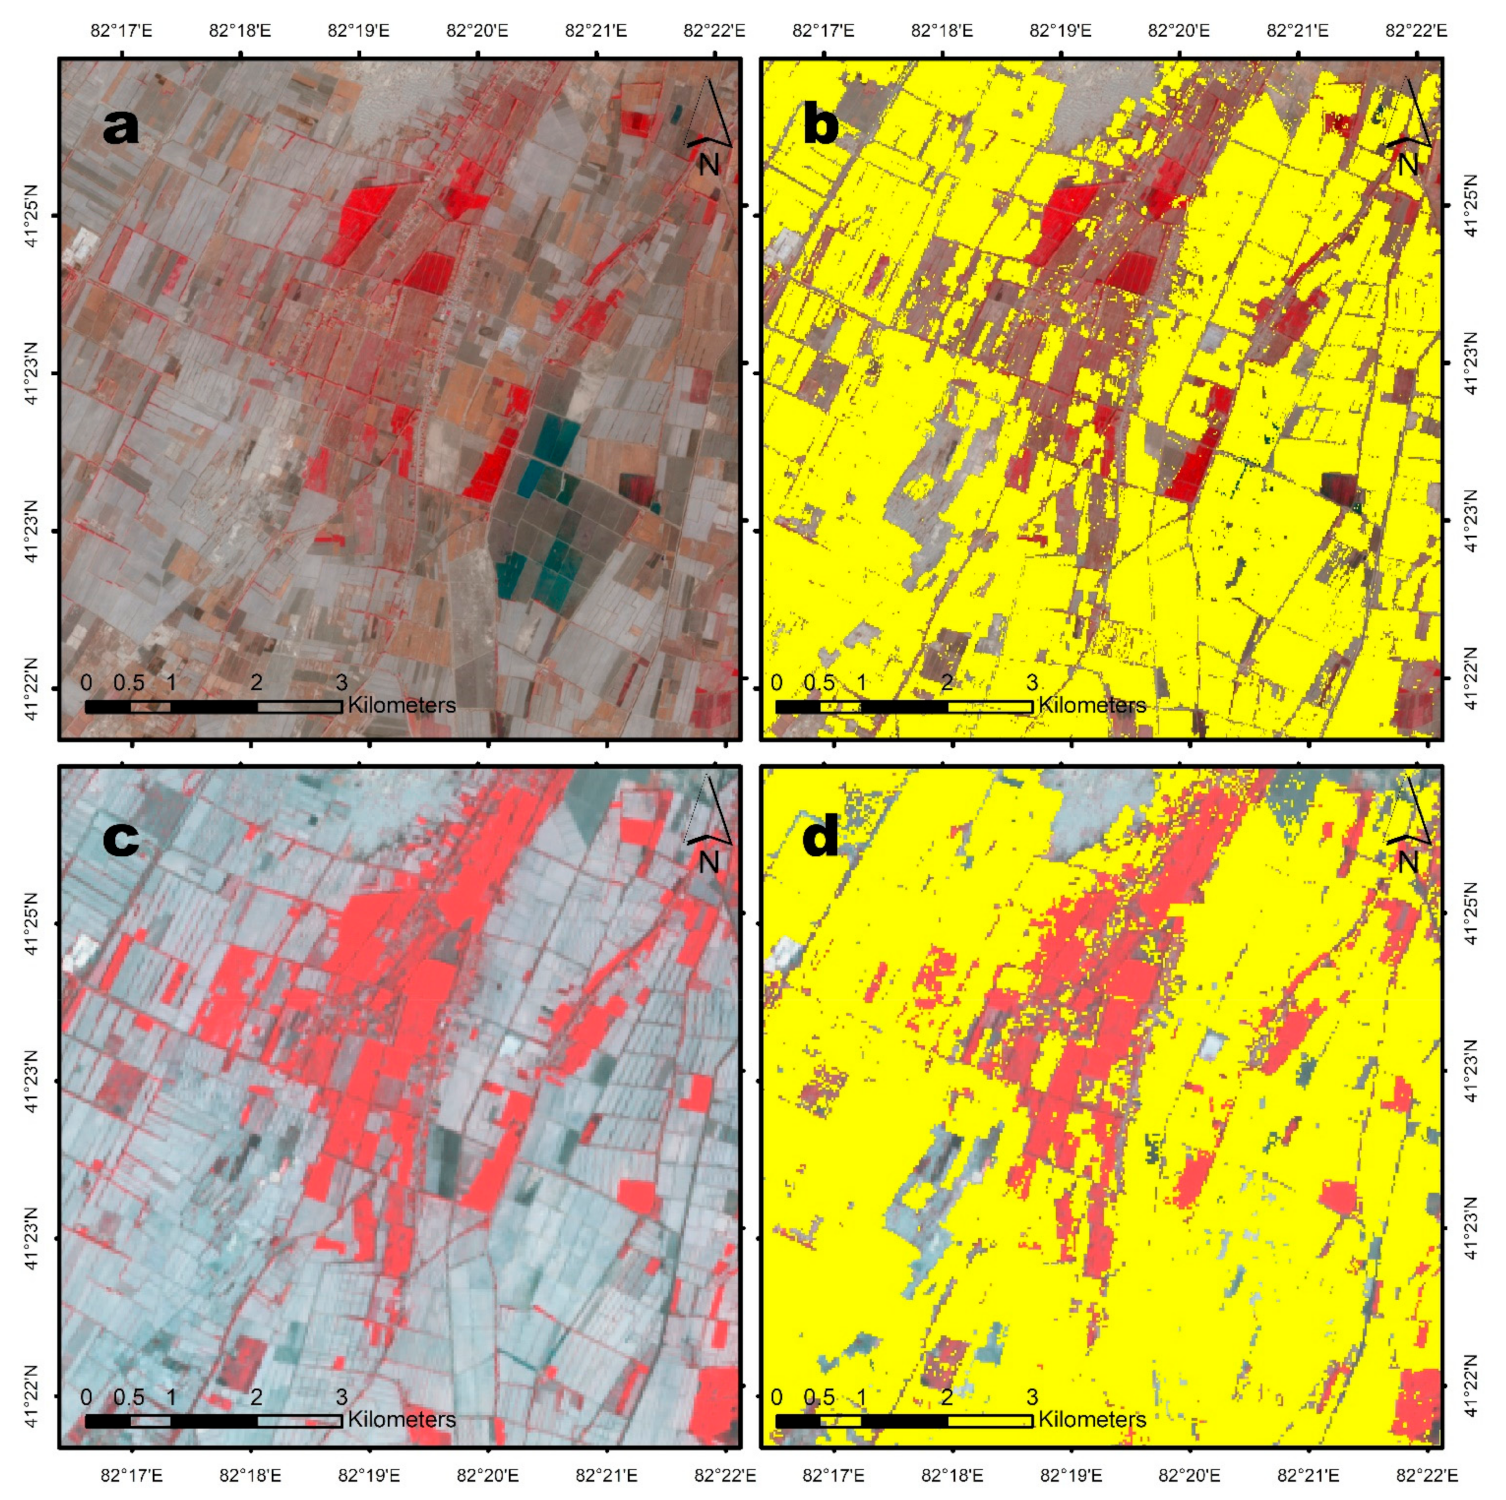
3.1. Classification Accuracy
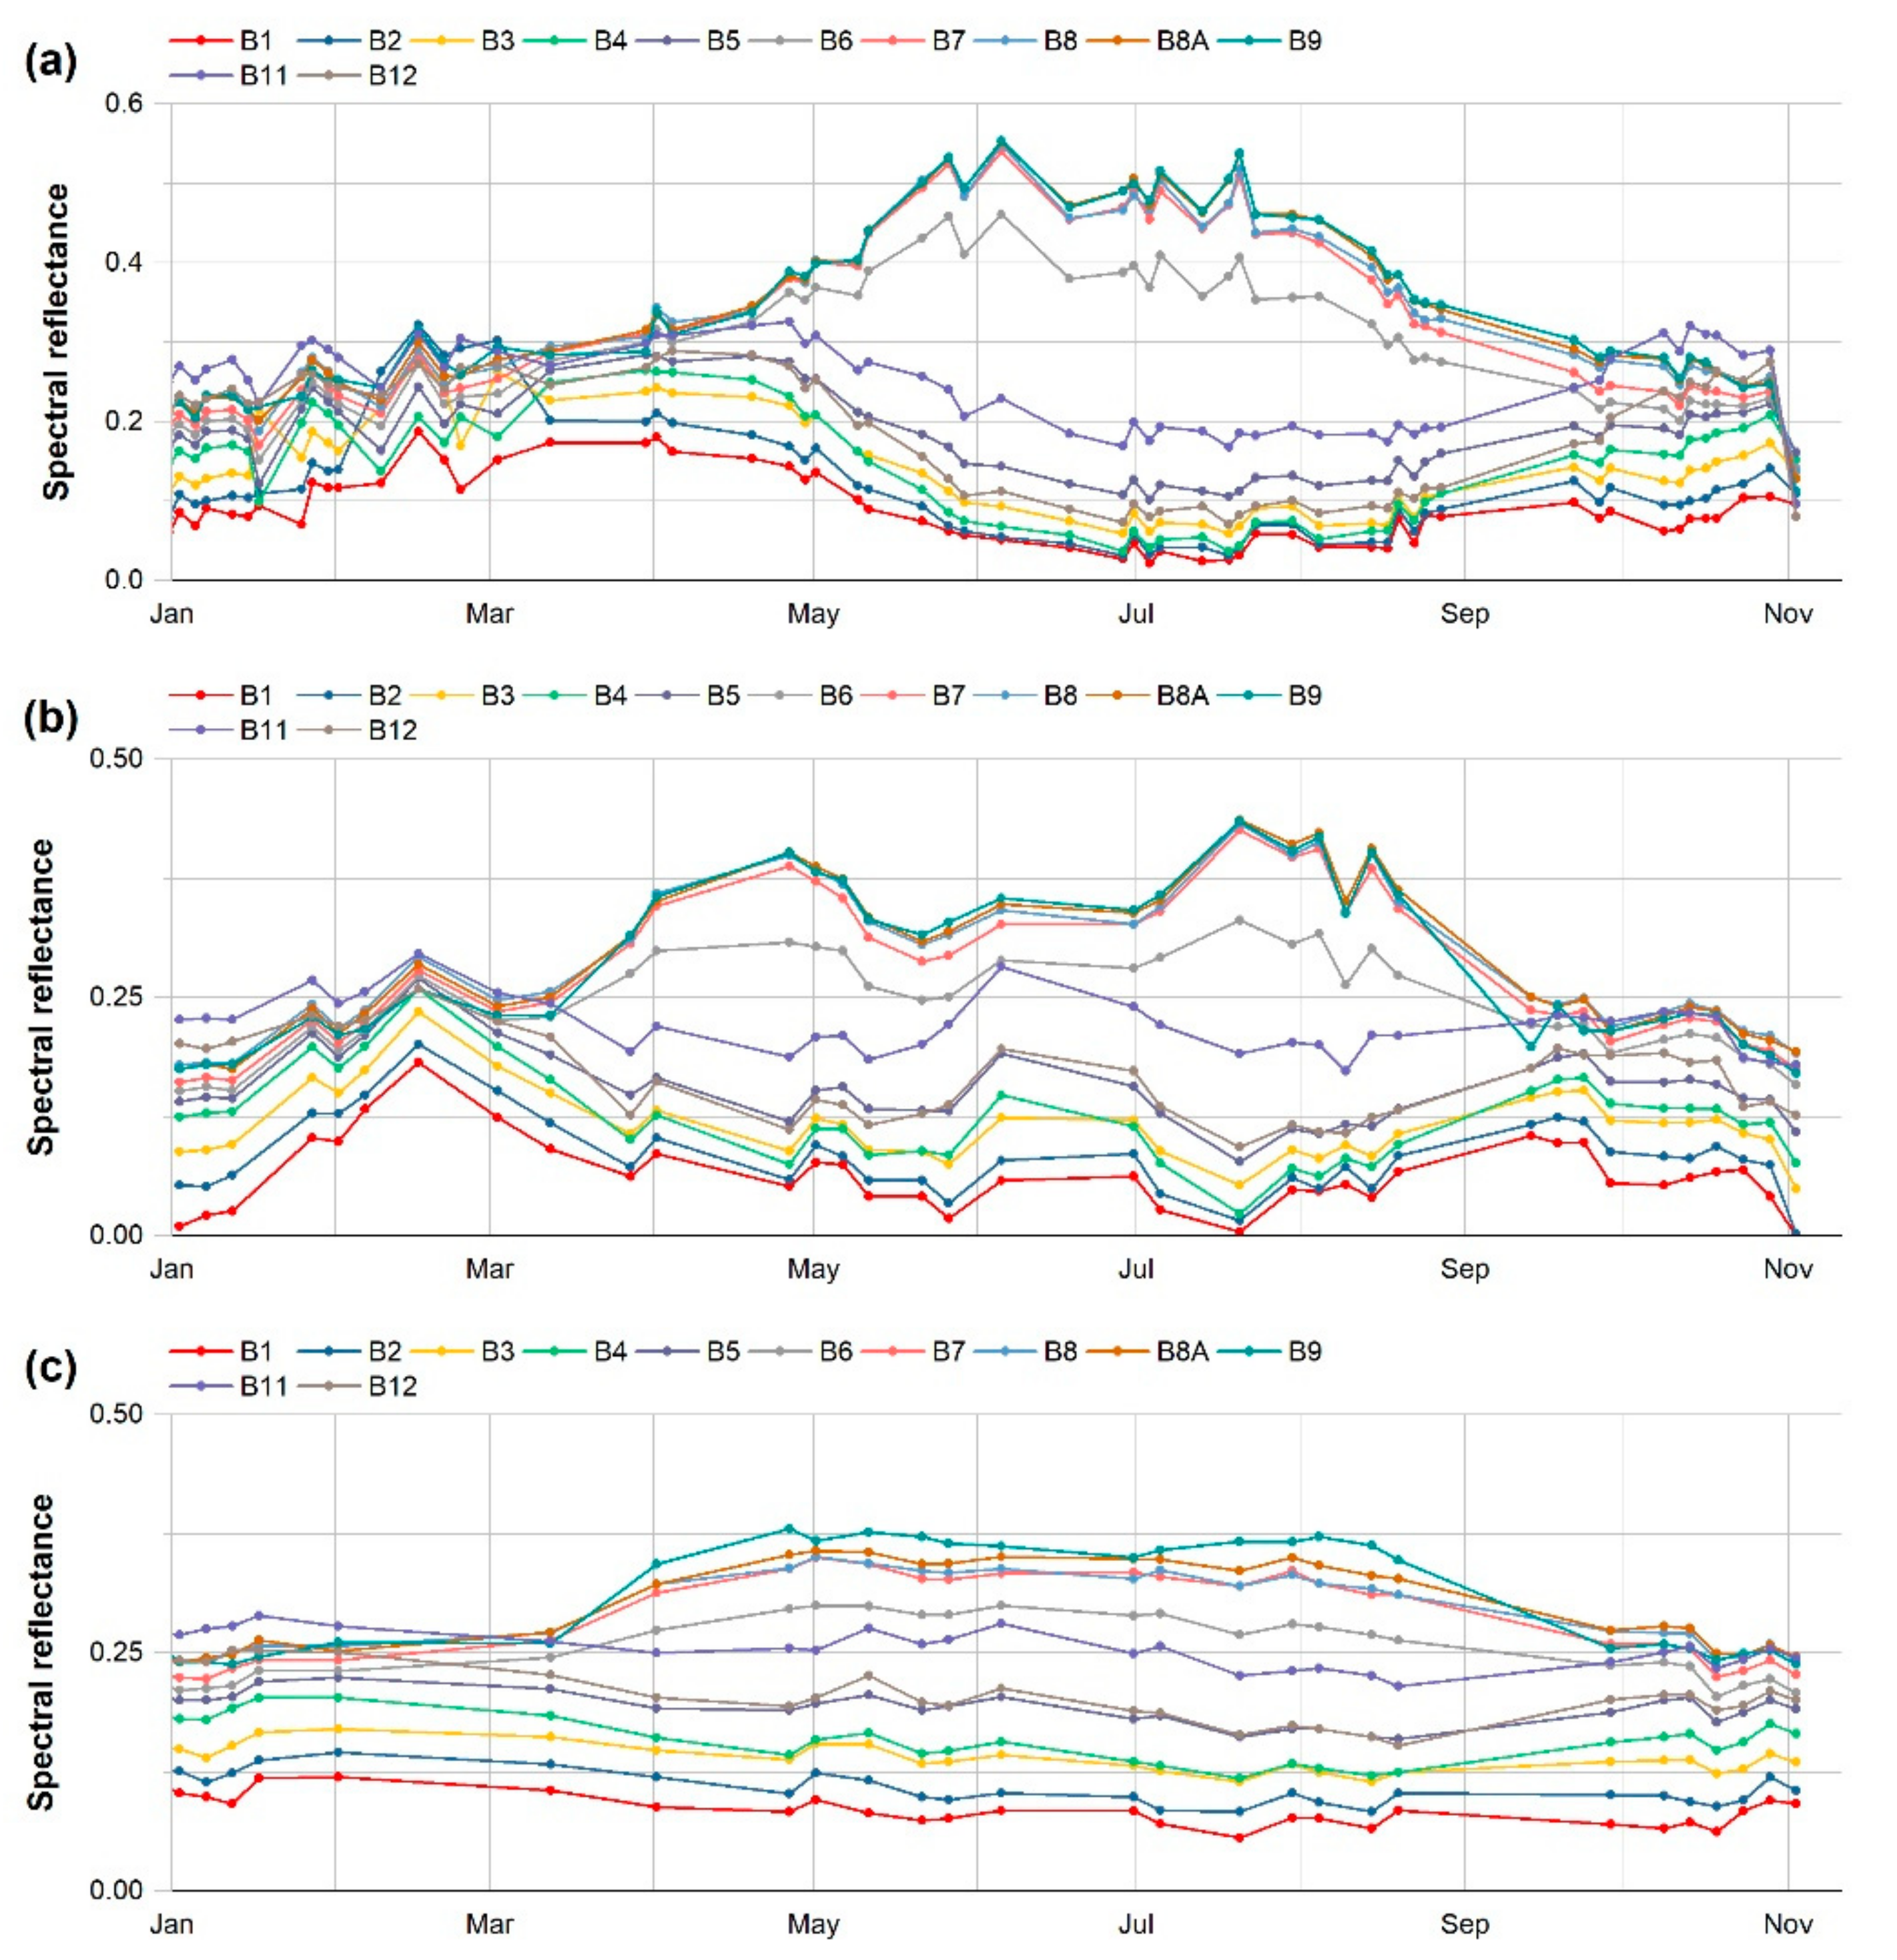
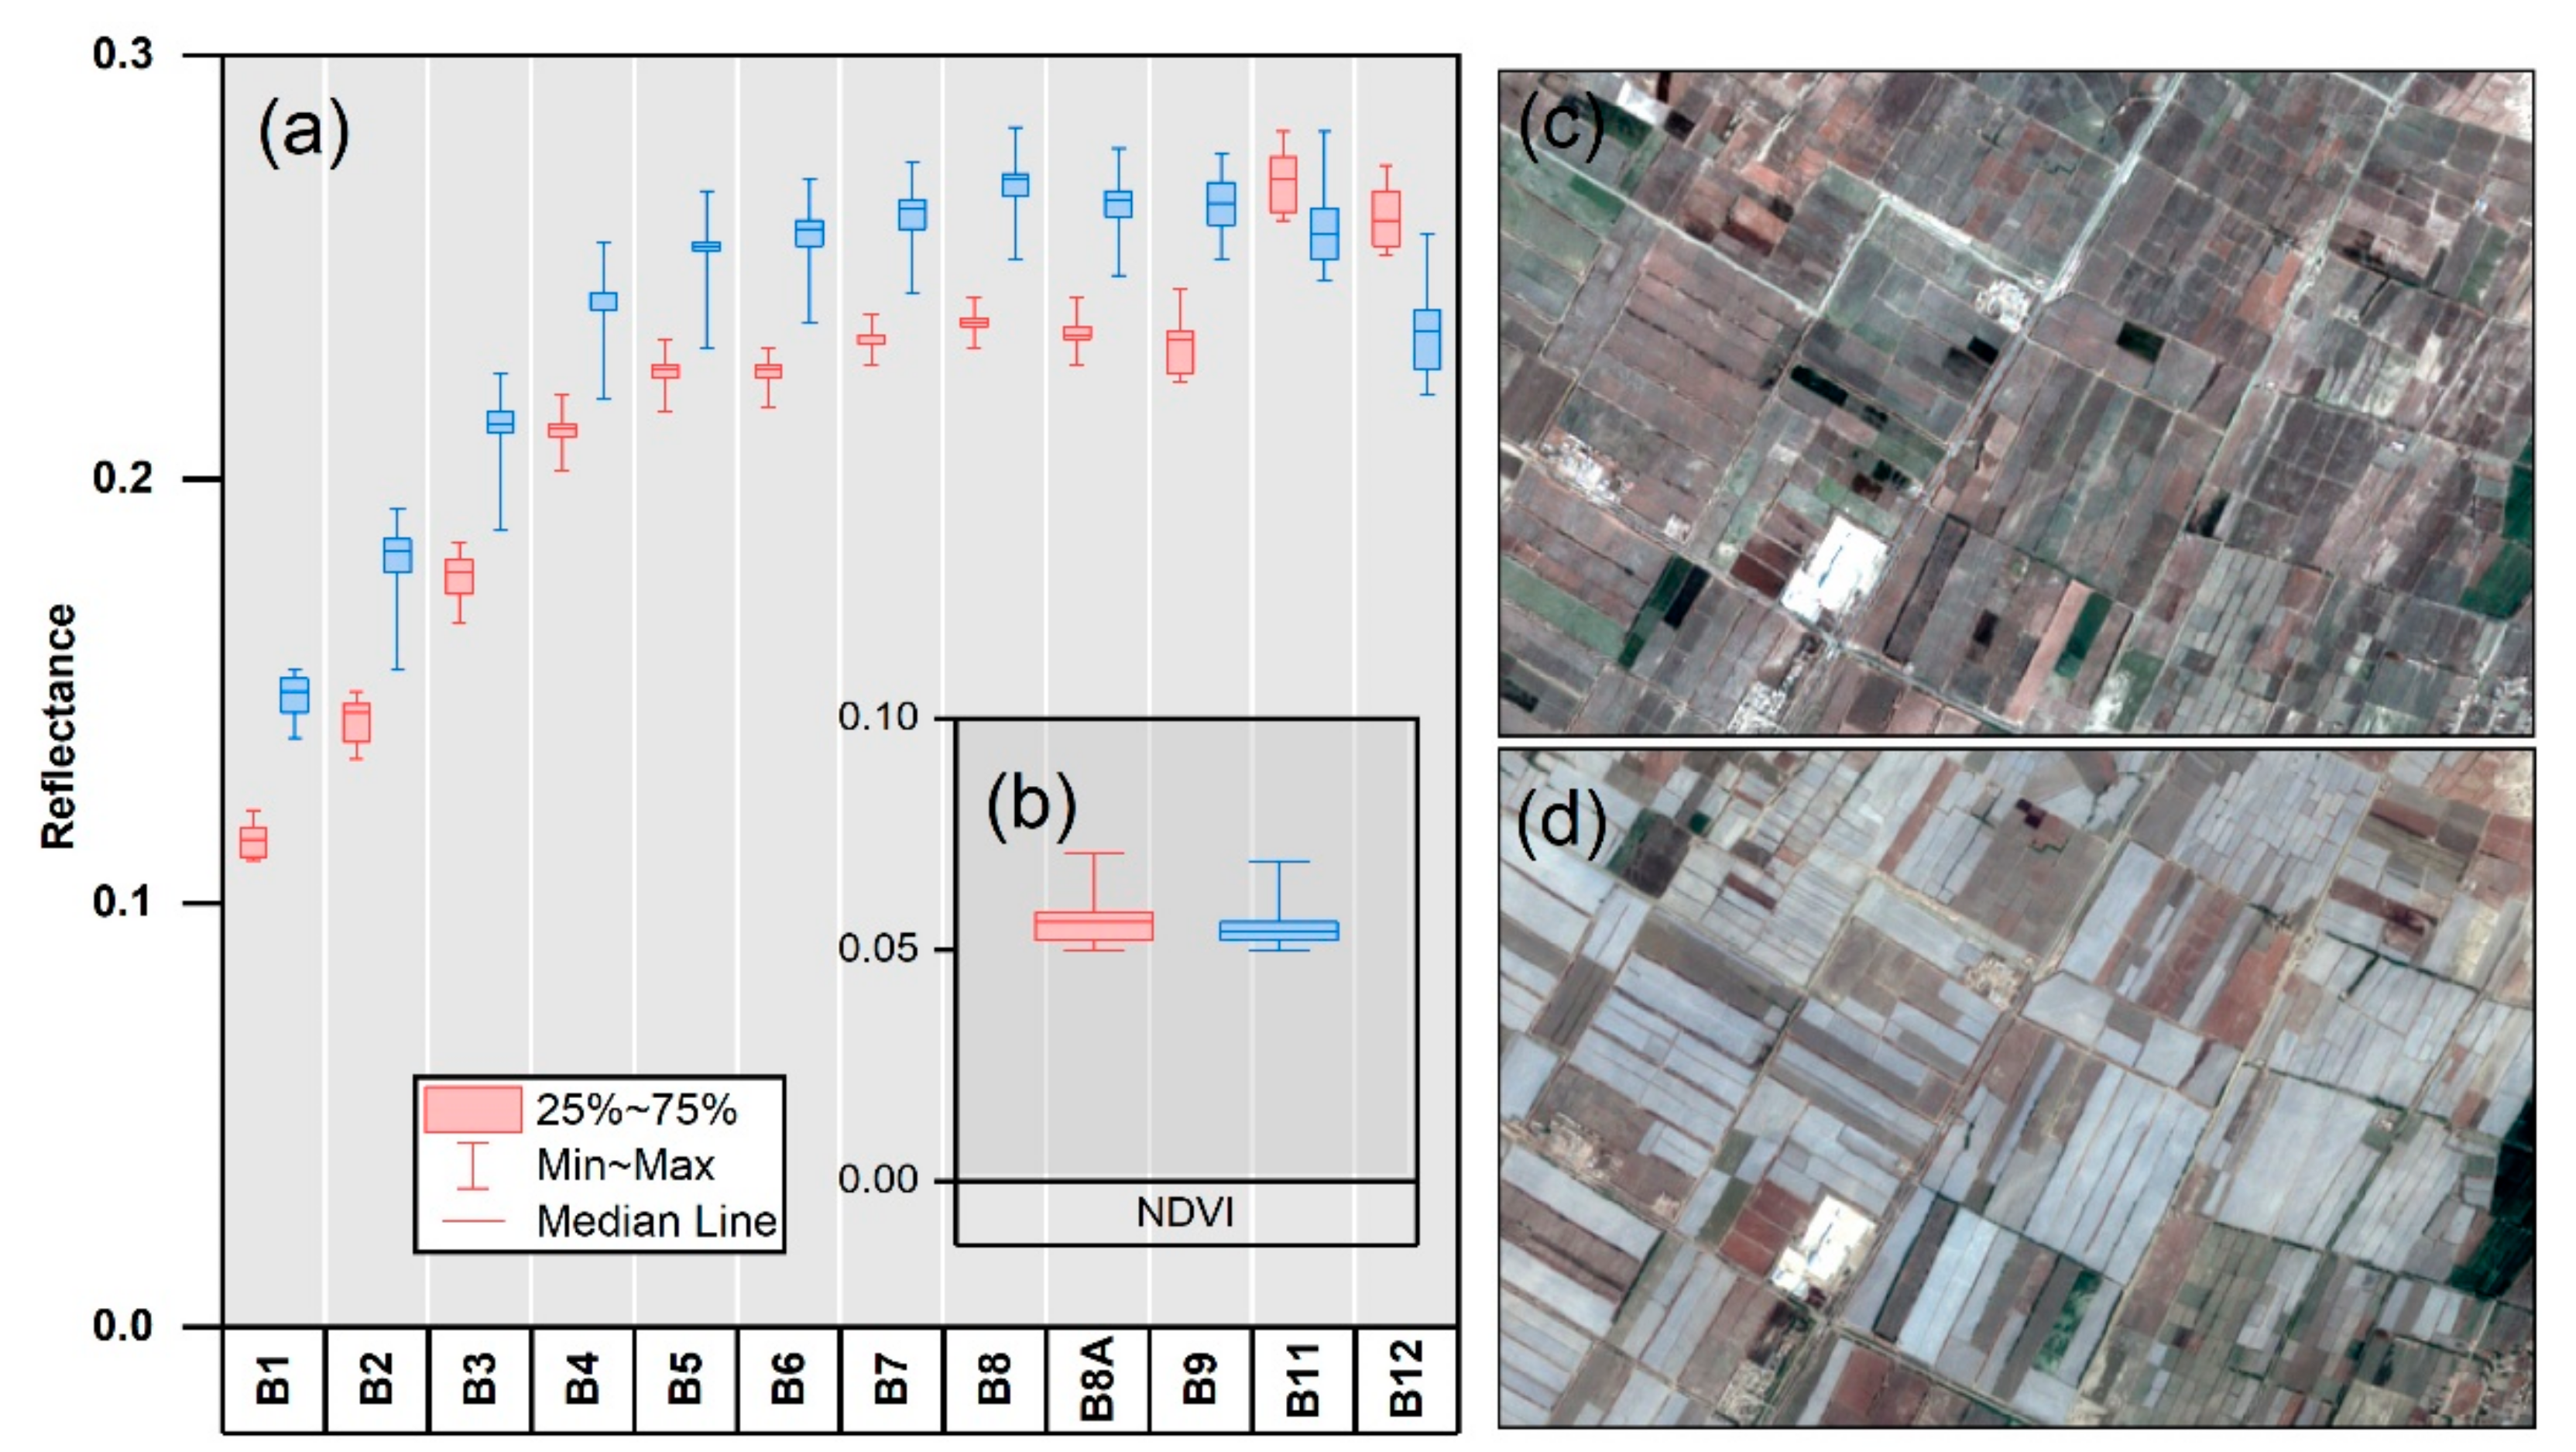
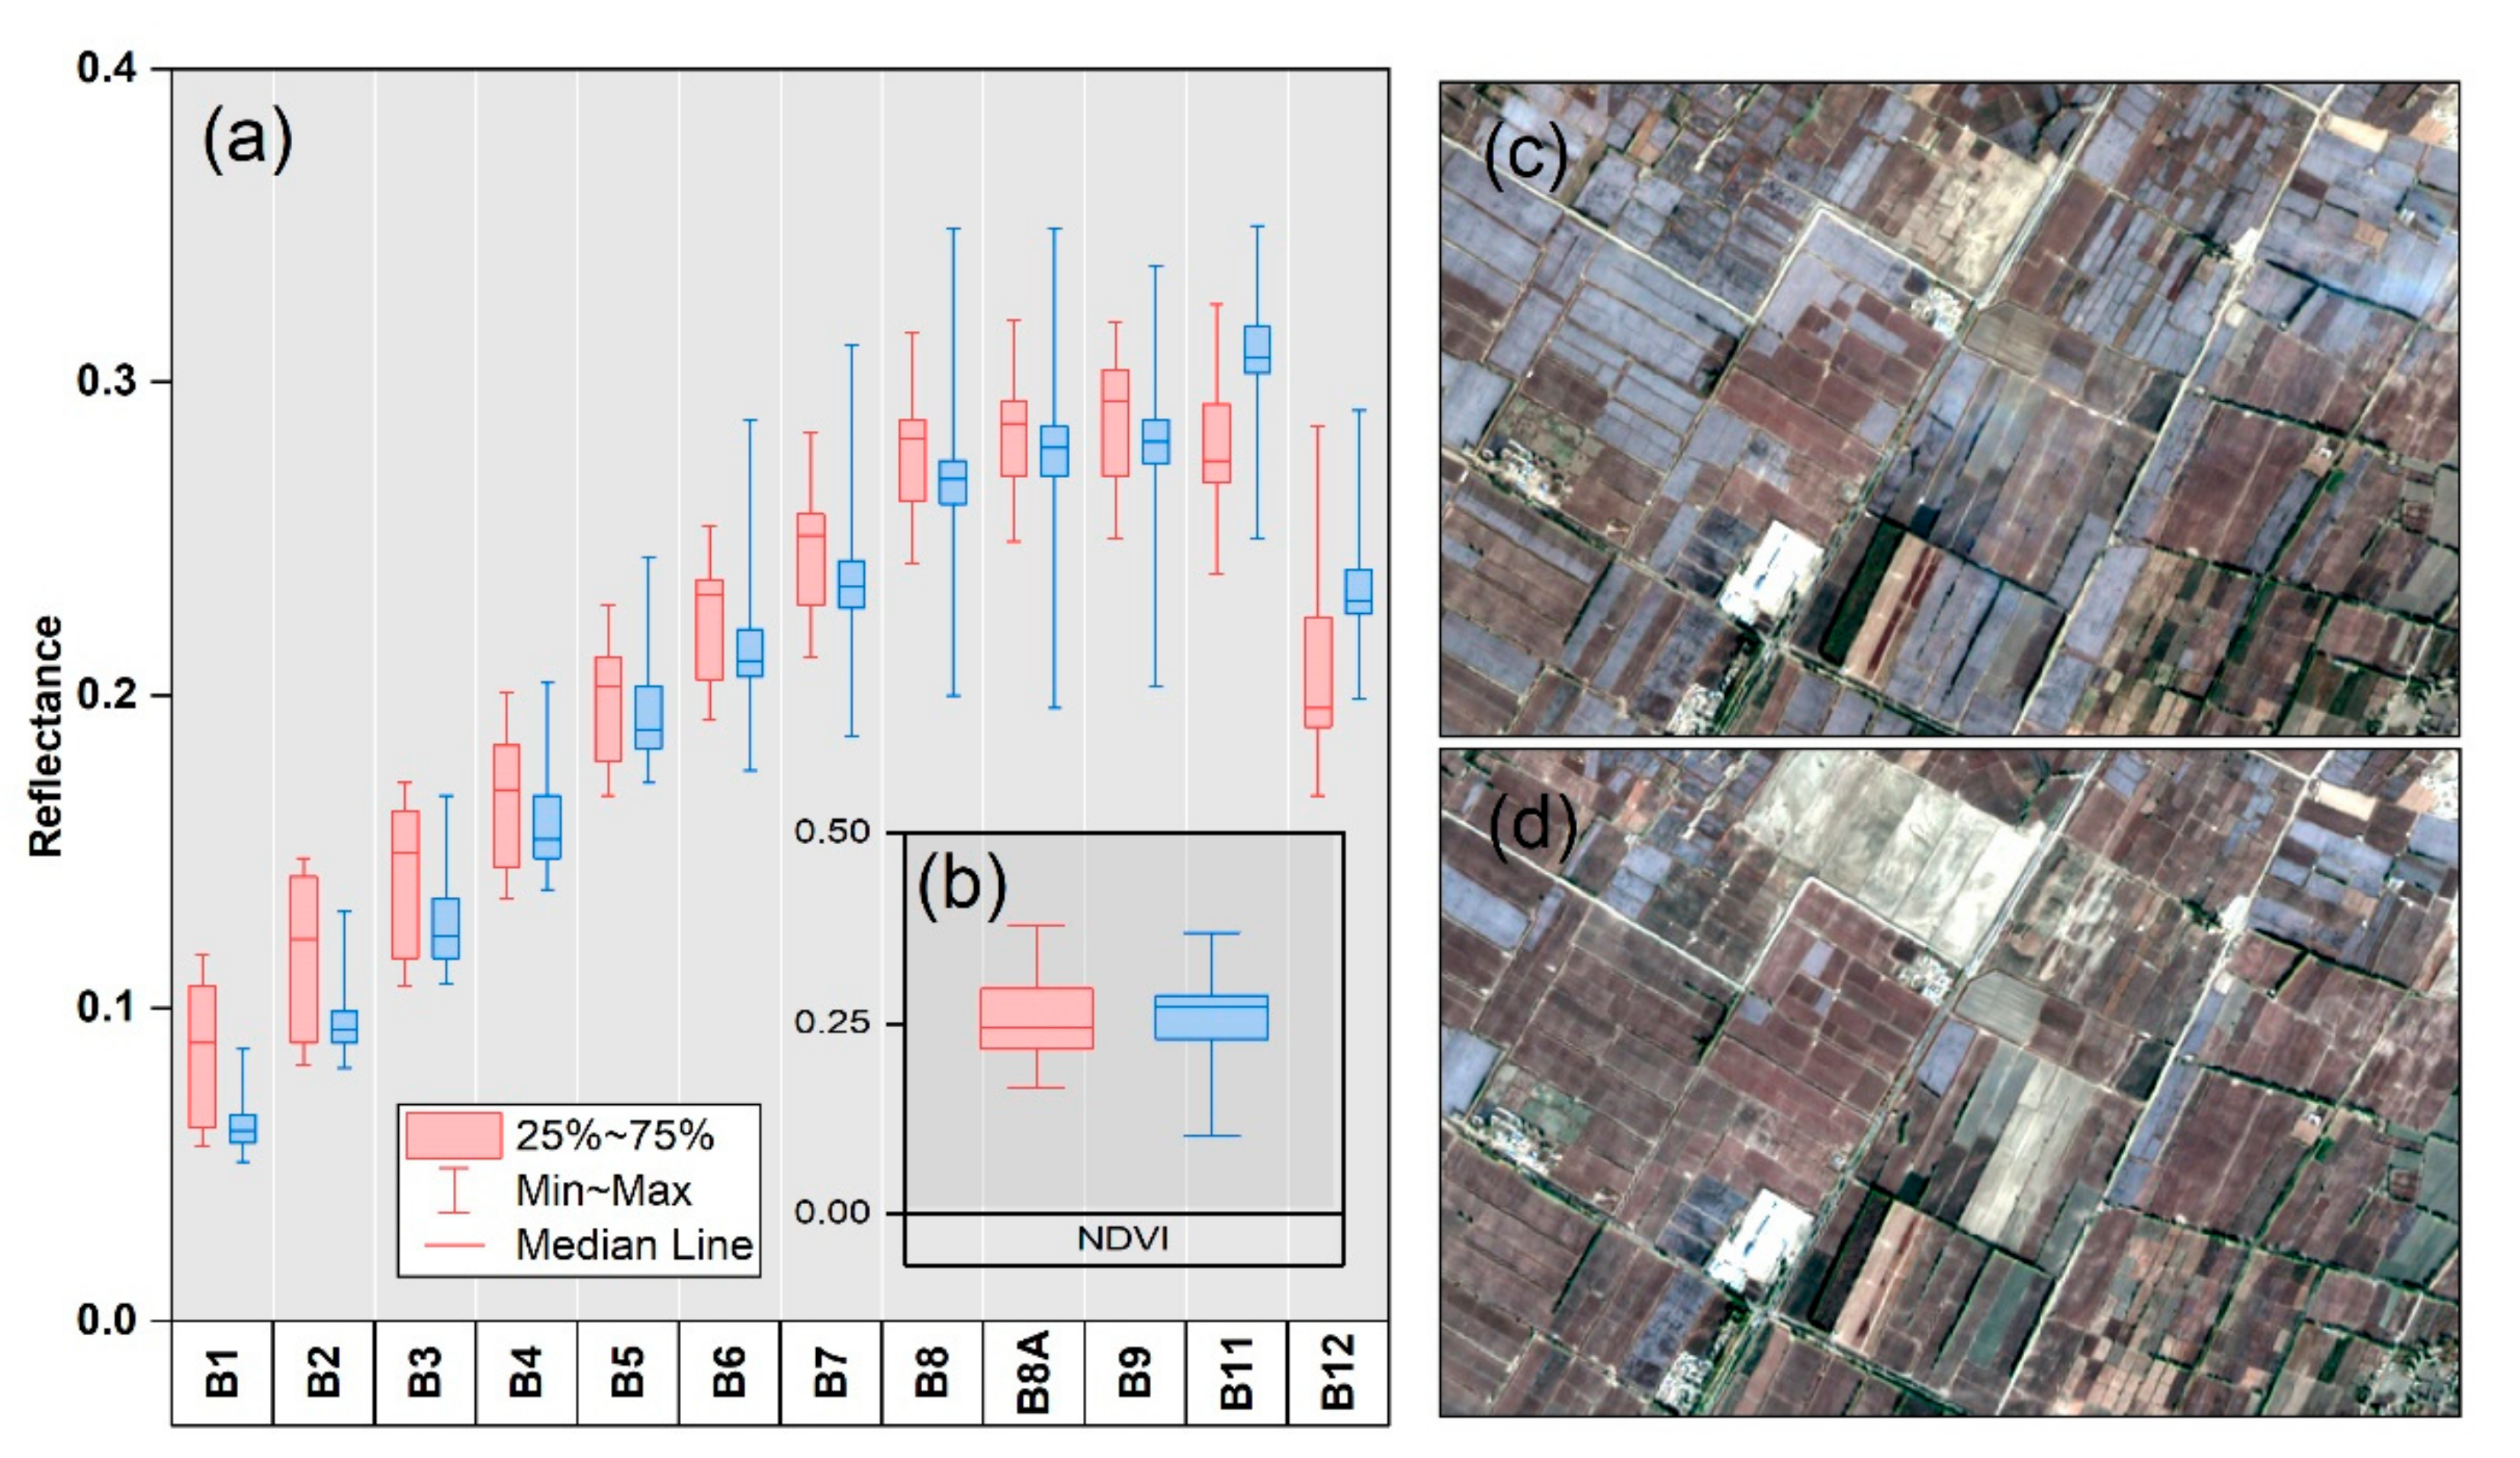
3.2. Differences in Reflectance between Cotton Fields and Other Fields during the Growing Season
3.3. Changes in Spectral Reflectance Due to Mulching and Cotton Picking in Cotton Fields
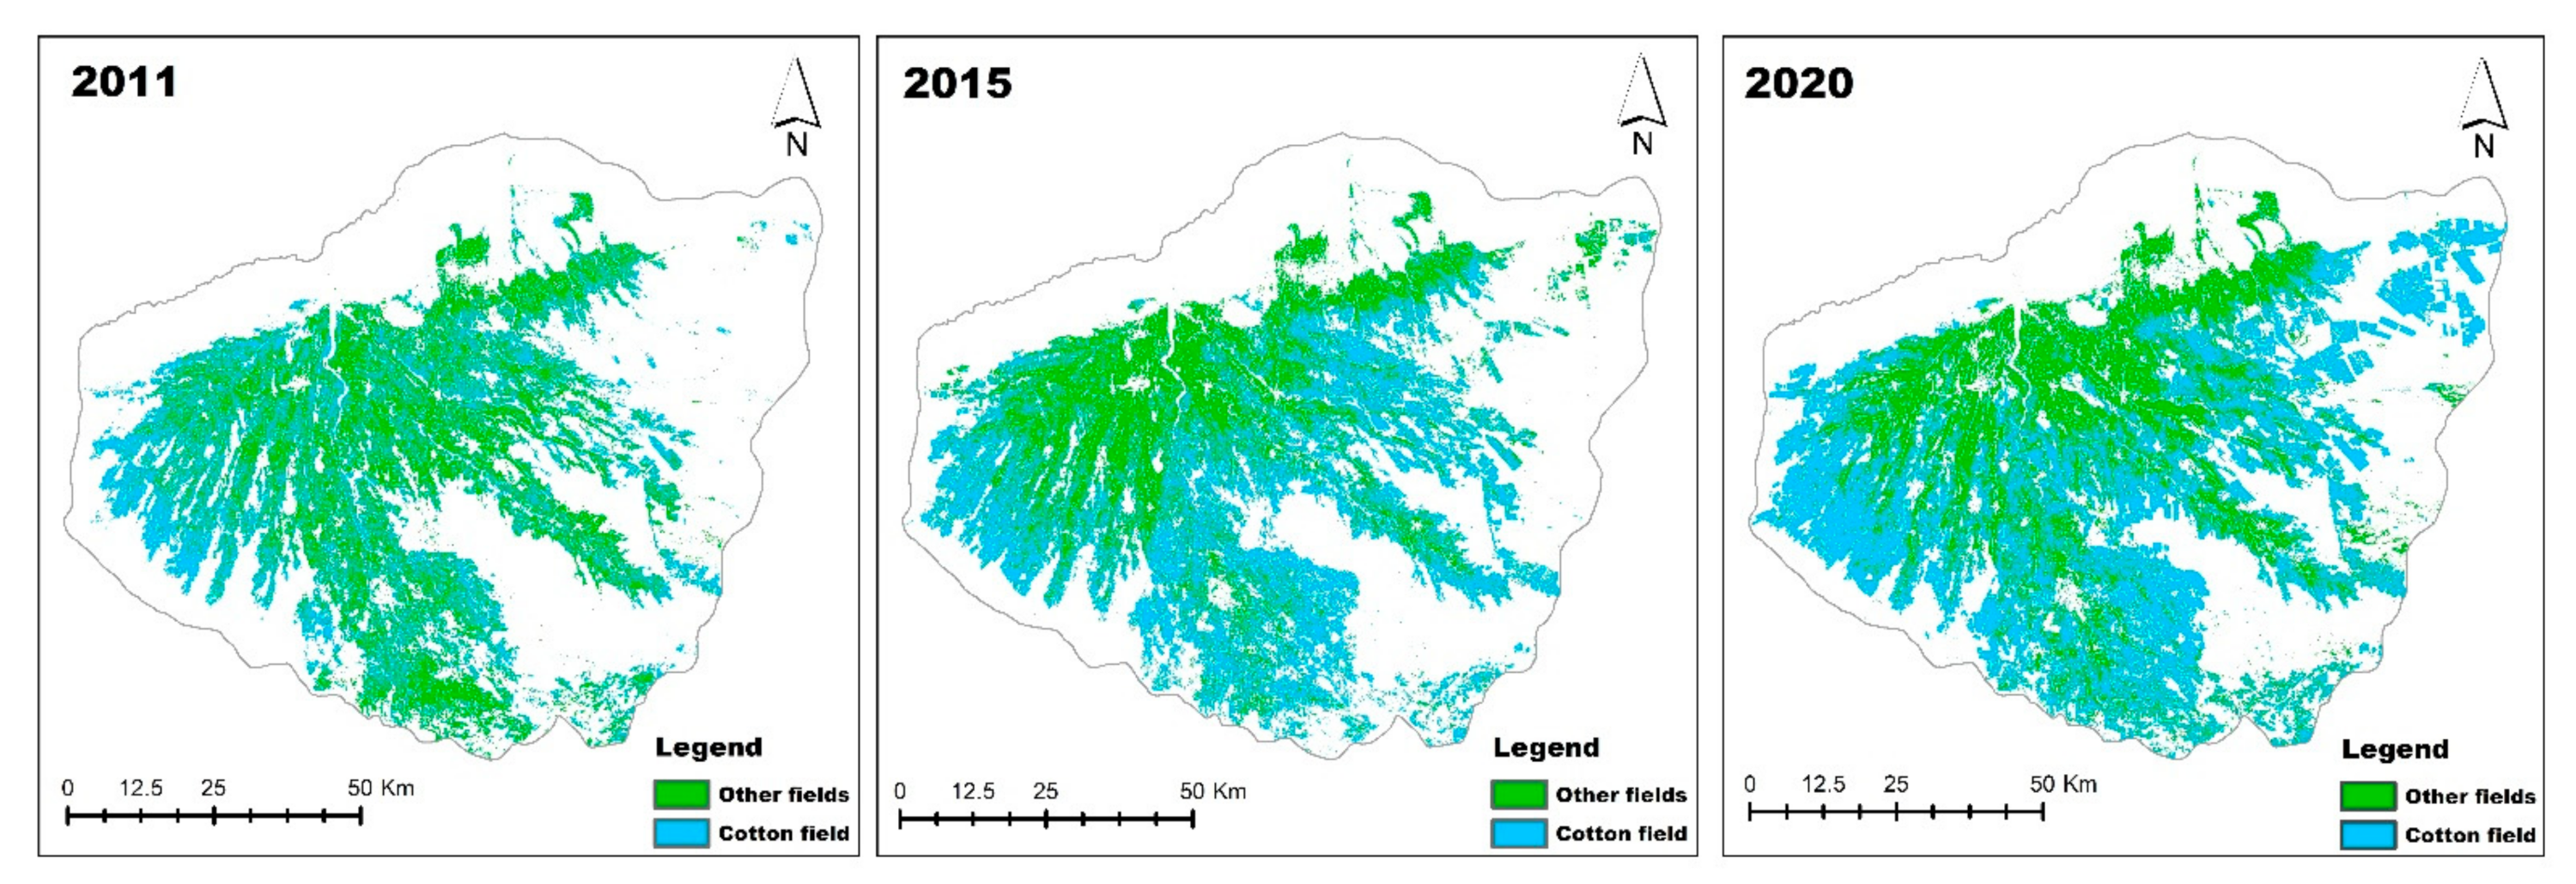
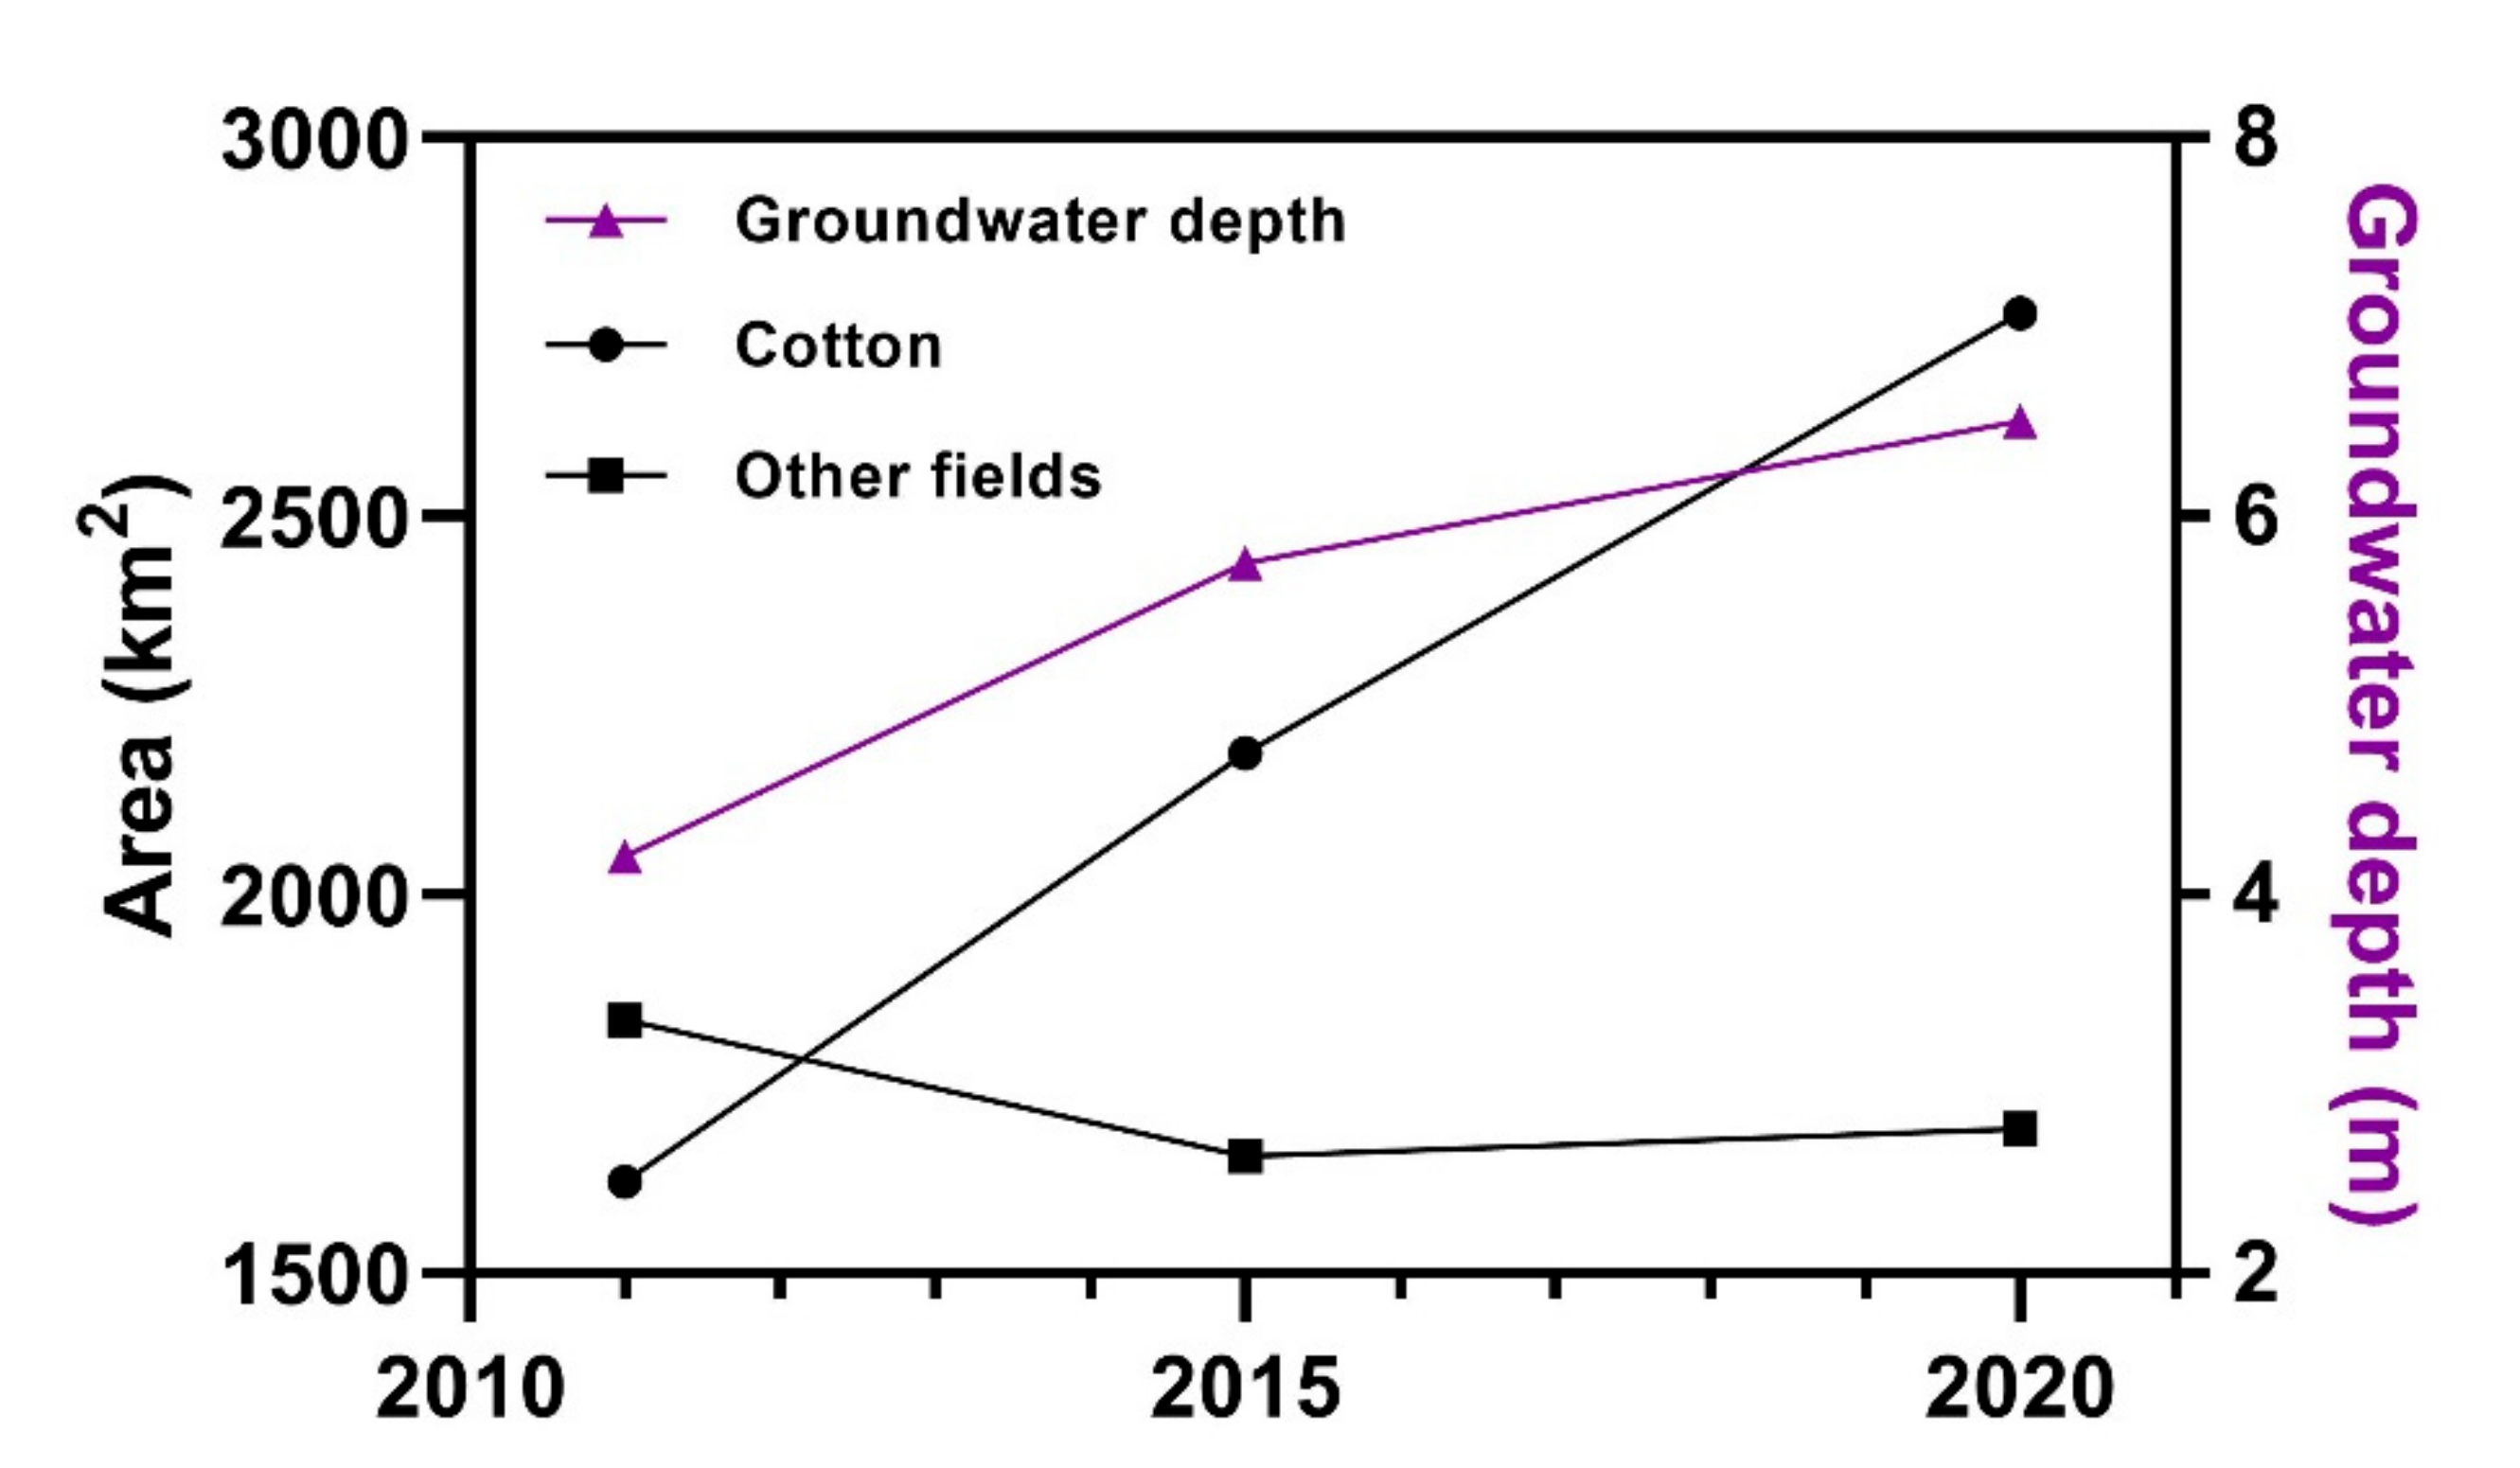
3.4. Spatial Trends of Oasis Farmland and Its Relationship to Groundwater Depth
4. Discussion
5. Conclusions
Author Contributions
Funding
Data Availability Statement
Acknowledgments
Conflicts of Interest
References
- China Statistical Yearbook; China Statistical Publishing House: Beijing, China, 2020.
- Tan, B.; Wang, H.; Ma, C.; Wang, X.; Zhou, J. Spatial and Temporal Measurement of the Interaction between the County Economy and Rural Transformation in Xinjiang, China. Sustainability 2021, 13, 5318. [Google Scholar] [CrossRef]
- Gorelick, N.; Hancher, M.; Dixon, M.; Ilyushchenko, S.; Thau, D.; Moore, R. Google Earth Engine: Planetary-scale geospatial analysis for everyone. Remote Sens. Environ. 2017, 202, 18–27. [Google Scholar] [CrossRef]
- Azzari, G.; Jain, M.; Lobell, D.B. Towards fine resolution global maps of crop yields: Testing multiple methods and satellites in three countries. Remote Sens. Environ. 2017, 202, 129–141. [Google Scholar] [CrossRef]
- Shelestov, A.; Lavreniuk, M.; Kussul, N.; Novikov, A.; Skakun, S. Exploring Google Earth Engine platform for big data processing: Classification of multi-temporal satellite imagery for crop mapping. Front. Earth Sci. 2017, 5, 17. [Google Scholar] [CrossRef] [Green Version]
- Xiong, J.; Thenkabail, P.S.; Gumma, M.K.; Teluguntla, P.; Poehnelt, J.; Congalton, R.G.; Yadav, K.; Thau, D. Automated cropland mapping of continental Africa using Google Earth Engine cloud computing. ISPRS J. Photogramm. Remote Sens. 2017, 126, 225–244. [Google Scholar] [CrossRef] [Green Version]
- Xiong, J.; Thenkabail, P.S.; Tilton, J.C.; Gumma, M.K.; Teluguntla, P.; Oliphant, A.; Congalton, R.G.; Yadav, K.; Gorelick, N. Nominal 30-m Cropland Extent Map of Continental Africa by Integrating Pixel-Based and Object-Based Algorithms Using Sentinel-2 and Landsat-8 Data on Google Earth Engine. Remote Sens. 2017, 9, 1065. [Google Scholar] [CrossRef] [Green Version]
- Teluguntla, P.; Thenkabail, P.S.; Oliphant, A.; Xiong, J.; Gumma, M.K.; Congalton, R.G.; Yadav, K.; Huete, A. A 30-m landsat-derived cropland extent product of Australia and China using random forest machine learning algorithm on Google Earth Engine cloud computing platform. ISPRS J. Photogramm. Remote Sens. 2018, 144, 325–340. [Google Scholar] [CrossRef]
- Jin, Z.; Azzari, G.; You, C.; Di Tommaso, S.; Aston, S.; Burke, M.; Lobell, D.B. Smallholder maize area and yield mapping at national scales with Google Earth Engine. Remote Sens. Environ. 2019, 228, 115–128. [Google Scholar] [CrossRef]
- Aneece, I.; Thenkabail, P. Accuracies achieved in classifying five leading world crop types and their growth stages using optimal Earth Observing-1 hyperion hyperspectral narrowbands on Google Earth Engine. Remote Sens. 2018, 10, 2027. [Google Scholar] [CrossRef] [Green Version]
- Al-Shammari, D.; Fuentes, I.; Whelan, B.M.; Filippi, P.; Bishop, T.F.A. Mapping of cotton fields within-season using phenology-based metrics derived from a time series of Landsat imagery. Remote Sens. 2020, 12, 3038. [Google Scholar] [CrossRef]
- Yan, Y.; Ryu, Y. Exploring Google Street View with deep learning for crop type mapping. ISPRS J. Photogramm. Remote Sens. 2021, 171, 278–296. [Google Scholar] [CrossRef]
- Wang, Z.; Fan, B.; Guo, L. Soil salinization after long-term mulched drip irrigation poses a potential risk to agricultural sustainability. Eur. J. Soil Sci. 2019, 70, 20–24. [Google Scholar] [CrossRef] [Green Version]
- Dong, H.; Li, W.; Tang, W.; Zhang, D. Early plastic mulching increases stand establishment and lint yield of cotton in saline fields. Field Crops Res. 2009, 111, 269–275. [Google Scholar] [CrossRef]
- Dai, J.; Dong, H. Intensive cotton farming technologies in China: Achievements, challenges and countermeasures. Field Crops Res. 2014, 155, 99–110. [Google Scholar] [CrossRef] [Green Version]
- Hasituya; Chen, Z. Mapping plastic-mulched farmland with multi-temporal Landsat-8 data. Remote Sens. 2017, 9, 557. [Google Scholar] [CrossRef] [Green Version]
- Xun, L.; Zhang, J.; Cao, D.; Wang, J.; Zhang, S.; Yao, F. Mapping cotton cultivated area combining remote sensing with a fused representation-based classification algorithm. Comput. Electron. Agric. 2021, 181, 105940. [Google Scholar] [CrossRef]
- Anchang, J.Y.; Prihodko, L.; Ji, W.; Kumar, S.S.; Ross, C.W.; Yu, Q.; Lind, B.; Sarr, M.A.; Diouf, A.A.; Hanan, N.P. Toward operational mapping of woody canopy cover in tropical savannas using Google Earth Engine. Front. Environ. Sci. 2020, 8, 4. [Google Scholar] [CrossRef] [Green Version]
- Ivšinović, J.; Litvić, N. Application of the bootstrap method on a large input data set-case study western part of the Sava Depression. Rud.-Geološko-Naft. Zb. (Min.-Geol.-Pet. Eng. Bull.) 2021, 36, 13–19. [Google Scholar] [CrossRef]
- Foody, G.M. Thematic map comparison. Photogramm. Eng. Remote Sens. 2004, 70, 627–633. [Google Scholar] [CrossRef]
- Paul, S.; Kumar, D.N. Comparison of landsat-8 and sentinel-2 data for classification of rabi crops over Karnataka, India. Int. Arch. Photogramm. Remote Sens. Spat. Inf. Sci. 2019, XLII-3/W6, 579–584. [Google Scholar] [CrossRef] [Green Version]
- Liu, L.; Xiao, X.; Qin, Y.; Wang, J.; Xu, X.; Hu, Y.; Qiao, Z. Mapping cropping intensity in China using time series Landsat and Sentinel-2 images and Google Earth Engine. Remote Sens. Environ. 2020, 239, 111624. [Google Scholar] [CrossRef]
- Wang, N.; Zhai, Y.; Zhang, L. Automatic cotton mapping using time series of Sentinel-2 images. Remote Sens. 2021, 13, 1355. [Google Scholar] [CrossRef]
- Wang, C.; Chen, Q.; Fan, H.; Yao, C.; Sun, X.; Chan, J.; Deng, J. Evaluating satellite hyperspectral (Orbita) and multispectral (Landsat 8 and Sentinel-2) imagery for identifying cotton acreage. Int. J. Remote Sens. 2021, 42, 4042–4063. [Google Scholar] [CrossRef]
- Csillik, O.; Belgiu, M. Cropland mapping from Sentinel-2 time series data using object-based image analysis. In Proceedings of the Societal Geo-Innovation, the 20th AGILE Conference on Geographic Information Science, Wageningen, The Netherlands, 9–12 May 2017. [Google Scholar]
- Liu, G. Understanding cotton cultivation dynamics in Aksu Oases (NW China) by reconstructing change trajectories using multi-temporal Landsat and Sentinel-2 data. Geocarto Int. 2021, 1–19. [Google Scholar] [CrossRef]
- Ainiwaer, M.; Ding, J.; Wang, J.; Nasierding, N. Spatiotemporal Dynamics of Water Table Depth Associated with Changing Agricultural Land Use in an Arid Zone Oasis. Water 2019, 11, 637. [Google Scholar] [CrossRef] [Green Version]
- Li, H.; Wang, G.; Dong, Z.; Wei, X.; Wu, M.; Song, H.; Amankwah, S.O. Identifying cotton fields from remote sensing images using multiple deep learning networks. Agronomy 2021, 11, 174. [Google Scholar] [CrossRef]
- Imin, B.; Dai, Y.; Shi, Q.; Guo, Y.; Li, H.; Nijat, M. Responses of two dominant desert plant species to the changes in groundwater depth in hinterland natural oasis, Tarim Basin. Ecol. Evol. 2021, 11, 9460–9471. [Google Scholar] [CrossRef]
- Wang, D.; Zhao, C.; Zheng, J.; Zhu, J.; Gui, Z.; Yu, Z. Evolution of soil salinity and the critical ratio of drainage to irrigation (CRDI) in the Weigan Oasis in the Tarim Basin. CATENA 2021, 201, 105210. [Google Scholar] [CrossRef]
- Zarubin, M.; Zarubina, V.; Fionin, E.; Salykov, B.; Salykova, O. Digital system of quarry management as a SAAS solution: Mineral Deposit Module. Min. Miner. Depos. 2019, 13, 91–102. [Google Scholar] [CrossRef] [Green Version]


| Input Variables | Sentinel 2 | Landsat 8 | Landsat 5 |
|---|---|---|---|
| Visible bands | B2, B3, B4 | B2, B3, B4 | B1, B2, B3 |
| Red-edge bands | B5, B6, B7, B8A | ||
| Near infrared band | B8 | B5 | B4 |
| Short-wave infrared bands | B11, B12 | B6, B7 | B5, B7 |
| NDVI | (B8 − B4)/(B8 + B4) | (B5 − B4)/(B5 + B4) | (B4 − B3)/(B4 + B3) |
| NDBI | (B11 − B8)/(B11 + B8) | (B6 − B5)/(B6 + B5) | (B5 − B4)/(B5 + B4) |
| MNDWI | (B11 − B3)/(B11 + B3) | (B6 − B3)/(B6 + B3) | (B5 − B2)/(B5 + B2) |
| Classification Types | Detailed Characterization |
|---|---|
| Cotton field | Regular rectangle, irrigation, mulching and other agricultural activities starting in March, cotton picking from September to November. |
| City | Impervious surfaces and building lands. |
| Other fields | It consists mainly of economic forestry, winter wheat, etc. The economic forestry consists mainly of walnut trees, date palms, pear trees, etc. Winter wheat is sown in October and harvested in June of the following year, after which crops such as maize are planted. |
| Salinizedland | Saline land mainly located on the periphery of the oasis, with white salt crystals deposited on the surface. The vegetation is mainly sparse salt-tolerant vegetation. |
| Water | It consists mainly of reservoirs and wetlands. |
| Desert | Montane desert with very sparse or bare vegetation. |
| Satellite Image | Year | Date | Overall Accuracy | Kappa Accuracy | User Accuracy |
|---|---|---|---|---|---|
| Sentinel 2 | 2020 | 1 March–15 November | 0.967 | 0.952 | 0.947 |
| Sentinel 2 | 2020 | 20 September–15 November | 0.943 | 0.924 | 0.803 |
| Landsat 8 | 2020 | 1 March–15 November | 0.981 | 0.973 | 0.842 |
| Landsat 8 | 2015 | 1 March–15 November | 0.986 | 0.975 | 0.842 |
| Landsat 5 | 2011 | 1 March–15 November | 0.981 | 0.972 | 0.838 |
| Cotton Field | City | Other Field | Salinizedland | Water | Desert | |
|---|---|---|---|---|---|---|
| Cotton field | 11,414 | 56 | 31 | 14 | 0 | 0 |
| City | 50 | 1274 | 48 | 231 | 2 | 67 |
| Other field | 71 | 27 | 1481 | 41 | 0 | 0 |
| Salinizedland | 29 | 97 | 19 | 17,695 | 0 | 373 |
| Water | 0 | 3 | 1 | 3 | 489 | 0 |
| Desert | 0 | 20 | 0 | 649 | 0 | 21,161 |
| Cotton Field | City | Other Field | Salinizedland | Water | Desert | |
|---|---|---|---|---|---|---|
| Cotton field | 11,344 | 19 | 55 | 54 | 0 | 8 |
| City | 85 | 1159 | 125 | 209 | 0 | 189 |
| Other field | 159 | 68 | 1363 | 11 | 0 | 34 |
| Salinizedland | 81 | 47 | 9 | 17,386 | 0 | 627 |
| Water | 6 | 8 | 2 | 0 | 470 | 0 |
| Desert | 1 | 15 | 8 | 1080 | 0 | 20,481 |
Publisher’s Note: MDPI stays neutral with regard to jurisdictional claims in published maps and institutional affiliations. |
© 2022 by the authors. Licensee MDPI, Basel, Switzerland. This article is an open access article distributed under the terms and conditions of the Creative Commons Attribution (CC BY) license (https://creativecommons.org/licenses/by/4.0/).
Share and Cite
Han, L.; Ding, J.; Wang, J.; Zhang, J.; Xie, B.; Hao, J. Monitoring Oasis Cotton Fields Expansion in Arid Zones Using the Google Earth Engine: A Case Study in the Ogan-Kucha River Oasis, Xinjiang, China. Remote Sens. 2022, 14, 225. https://0-doi-org.brum.beds.ac.uk/10.3390/rs14010225
Han L, Ding J, Wang J, Zhang J, Xie B, Hao J. Monitoring Oasis Cotton Fields Expansion in Arid Zones Using the Google Earth Engine: A Case Study in the Ogan-Kucha River Oasis, Xinjiang, China. Remote Sensing. 2022; 14(1):225. https://0-doi-org.brum.beds.ac.uk/10.3390/rs14010225
Chicago/Turabian StyleHan, Lijing, Jianli Ding, Jinjie Wang, Junyong Zhang, Boqiang Xie, and Jianping Hao. 2022. "Monitoring Oasis Cotton Fields Expansion in Arid Zones Using the Google Earth Engine: A Case Study in the Ogan-Kucha River Oasis, Xinjiang, China" Remote Sensing 14, no. 1: 225. https://0-doi-org.brum.beds.ac.uk/10.3390/rs14010225