Article

Forest Fire Assessment Using Remote Sensing to Support the Development of an Action Plan Proposal in Ecuador

by
Fernando Morante-Carballo
1,2,3,
Lady Bravo-Montero
1,2,4,*,
Paúl Carrión-Mero
2,5,
Andrés Velastegui-Montoya
2,5,6 and
Edgar Berrezueta
7
1
Facultad de Ciencias Naturales y Matemáticas (FCNM), Campus Gustavo Galindo, ESPOL Polytechnic University, Km. 30.5 Vía Perimetral, Guayaquil P.O. Box 09-01-5863, Ecuador
2
Centro de Investigación y Proyectos Aplicados a las Ciencias de la Tierra (CIPAT), Campus Gustavo Galindo, ESPOL Polytechnic University, Km. 30.5 Vía Perimetral, Guayaquil P.O. Box 09015863, Ecuador
3
Geo-Recursos y Aplicaciones (GIGA), Campus Gustavo Galindo, ESPOL Polytechnic University, Km. 30.5 Vía Perimetral, Guayaquil P.O. Box 09-01-5863, Ecuador
4
Centro del Agua y Desarrollo Sustentable (CADS), ESPOL Polytechnic University, Guayaquil P.O. Box 09-01-5863, Ecuador
5
Facultad de Ingeniería en Ciencias de la Tierra (FICT), ESPOL Polytechnic University, Guayaquil P.O. Box 09-01-5863, Ecuador
6
Geoscience Institute, Federal University of Pará, Belém 66075-110, Brazil
7
Departamento de Recursos para la Transición Ecológica, Instituto Geológico y Minero de España (IGME, CSIC), 33005 Oviedo, Spain
*
Author to whom correspondence should be addressed.
Submission received: 2 March 2022 / Revised: 25 March 2022 / Accepted: 2 April 2022 / Published: 7 April 2022
(This article belongs to the Special Issue Remote Sensing of Burnt Area)

Abstract

:
Worldwide, forest fires exert effects on natural ecosystems, contributing to economic/human losses, health effects, and climate change. Spectral indices are an essential tool for monitoring and analyzing forest fires. These indices make it possible to evaluate the affected areas and help mitigate possible future events and reduce damage. The case study addressed in this work corresponds to the Cerro of the Guadual community of La Carolina parish (Ibarra, Ecuador). This work aims to evaluate the degree of severity and the recovery of post-fire vegetation, employing the multitemporal analysis of spectral indices and correlating these with the climatological aspects of the region. The methodological process was based on (i) background information collection, (ii) remote sensing data, (iii) spectral index analysis, (iv) multivariate analysis, and (v) a forest fire action plan proposal. Landsat-8 OLI satellite images were used for multitemporal analysis (2014–2020). Using the dNDVI index, the fire’s severity was classified as unburned and very low severity in regard to the areas that did not regenerate post-fire, which represented 10,484.64 ha. In contrast, the areas classified as high and very high severity represented 5859.06 ha and 2966.98 ha, respectively. In addition, the dNBR was used to map the burned areas. The high enhanced regrowth zones represented an area of 8017.67 ha, whereas the moderate/high-severity to high-severity zones represented 3083.72 ha and 1233.49 ha, respectively. The areas with a high severity level corresponded to native forests, which are challenging to recover after fires. These fire severity models were validated with 31 in situ data from fire-starting points and they presented an accuracy of 99.1% in the high severity category. In addition, through the application of principal component analysis (PCA) with data from four meteorological stations in the region, a bimodal behavior was identified corresponding to the climatology of the area (dry season and rainy season), which is related to the presence of fires (in the dry season). It is essential to note that after the 2014 fire, locally, rainfall decreased and temperatures increased. Finally, the proposed action plan for forest fires made it possible to define a safe and effective evacuation route to reduce the number of victims during future events.

1. Introduction

The human influence on climate change is increasingly well-recognized and one of its manifestations is the increase in the global average temperature by 0.8 °C between 1900 and 2005 [1,2]. The analysis of various climate change indices with precipitation and temperature data indicates significant warming in the 20th century [3,4,5]. Modelling strategies allow the prediction of the possible impacts of climate change on biodiversity [6,7]. General circulation models (GCM) evaluate climate change through the representation of various terrestrial systems, studying climate change and variability [8,9,10,11].
Forest fires contribute to climate change by emitting large amounts of gases and particles into the atmosphere. In addition, these emissions cause a decrease in air quality and, consequently, health problems for people [12,13]. Forest fires or vegetation fires are unique disturbances of the earth system that affect the biosphere, hydrosphere, geosphere, cryosphere and atmosphere [14,15,16]. Fire contributes between 25% and 35% of the emissions of carbon dioxide ( C O 2 ), carbon monoxide (CO) and methane ( C O 4 ) [17,18]. Therefore, fire has become one of the essential climate variables (ECVs) in the study of climate change [19,20].
Forest fires occur mainly in forests, disturbing biodiversity and species richness [21,22]. Thereby, estimating forest fires’ impacts and their recovery using remote sensing is complex as the history of fires—in terms of frequency, severity and time since the last fire—is heterogeneous [23]. Burned forest areas have patterns of different severity due to topographic, vegetation and meteorological factors, which can be detected and mapped with satellite data [24]. For forest fire studies, remote sensing allows the determination of their severity [25], the plant cover loss [26] and plant communities’ recovery rate [27]. The application of spectral indices obtained from the different bands of the multispectral image allows the estimation of the severity of fires [28,29,30].
Forest fires worldwide are closely monitored and studied. In the United States, warming trends are related to the increase in the size, frequency and severity of fires [31,32]. In South Korea, more fires occur during the dry season and are caused mainly by humans [21]. California is one of the leading zones in terms of catastrophic wildfires, with the fires of recent years representing a burned area of 8.13 ×   10 6 ha [33,34]. In Australia’s 2019–2020 mega-fires, 5.8 × 10 6 ha of broadleaf forests were burned [35]. In California and western Nevada, 120 × 10 6 ha were burned between 1984 and 2006 [36]. The May 2000 fire in Los Alamos, New Mexico, burned 17,500 ha and 235 structures [37]. In Tasmania, Australia, the severity and intensity of the 2013 fire lasted 16 days and burned 25,950 ha [38]. In Argentina, from December 2016 to January 2017, more than 3 × 10 6 ha of shrubs and grasslands were burned [39].
In Ecuador, Quito city usually registers forest fires every year, leading the local authorities design a prototype wireless sensor network (WSN) [40]. This prototype allows the detection and monitoring of fires in the Guanguiltagua Park located in the Metropolitan District of Quito [41,42]. In the Amazon basin, south of Ecuador, anthropogenic forest fires are the primary source of sulfur and nitrogen compounds, fertilizing the mountainous forest [43]. Therefore, this suggests that fire is a disturbance that contributes to the functioning and biodiversity of this ecosystem [44].
Due to human-induced fires and deforestation, with the downhill displacement of the upper forest line (UFL) with the subsequent expansion of the Central Valley of Ecuador, the development of moorland vegetation occurred as a result [45,46]. The limit of the UFL altitude position between the montane forest and the moor has ecological and social importance in the region [47]. In Ecuador, from 2016 to 2018, 2684 forest fires affected 48,714.18 ha [48,49]. Among the provinces that have registered the most significant damage is Imbabura with 1294.04 ha [48], where La Carolina parish is located.
The area of study in this work includes the La Carolina parish, Ibarra canton, where most of the forest fires occur in indigenous communities, associated with anthropogenic activities. The inhabitants of the region depend mainly on agriculture, and when they prepare the land for sowing, they burn the residues that remain from the harvest on the land, causing fires [50]. Therefore, it is essential to understand the severity of rural fires to assess the damage and analyze recovery processes economically and effectively [51,52].
In recent years, the application of satellite images and, specifically, spectral signatures of the terrain (e.g., vegetation) allows researchers to obtain information on the severity of fires. According to Veraverbeke and Tran [53,54], the application of spectral indices allows one to evaluate the severity of fires. Spectral indices are calculated based on spectral bands from satellite images [28,55]. In addition, these indices have correlation levels with vegetation biophysical parameters, such as biomass amount, photosynthetic activity, productivity and water content [56,57].
The correlations between the multitemporal spectral indices allow researchers to estimate the fire’s burn severity and the recovery of vegetation [58,59]. There are various spectral indices, but the most frequently used in fire assessment are the normalized difference vegetation index (NDVI) and the delta-normalized difference vegetation index (dNDVI), which are transformations involving a mathematical combination of the digital levels stored in two or more spectral bands of the same image [60,61]. These indices are conditioned by changes in the physiological state of plant covers, and their variations are used in spatio-temporal studies of vegetation behavior [62,63]. Additionally, the normalized burn ratio (NBR) is used to discriminate between burned and unburned areas [64], and the delta-normalized burnt ratio (dNBR) for mapping fire severity in wooded forests [53].
In this work, we aimed to evaluate the degree of severity and the recovery of post-fire vegetation in La Carolina parish, through the multitemporal analysis of the spectral indices NDVI, NBR, dNDVI and dNBR, analyzing the correlation between the severity and vegetation recovery with the climatological aspects (i.e., rain) of the study area. This work will analyze the fire of 2 September 2014, which occurred in the dry season and burned 700 ha [65]. Several spectral indices were used to determine the degree of vegetation damage and its regeneration from the fire event and to provide information on the fire severity [53,54]. This study was complemented with the application of principal component analysis (PCA) to understand the rainfall regime behavior based on historical monthly rainfall data (2000–2016).

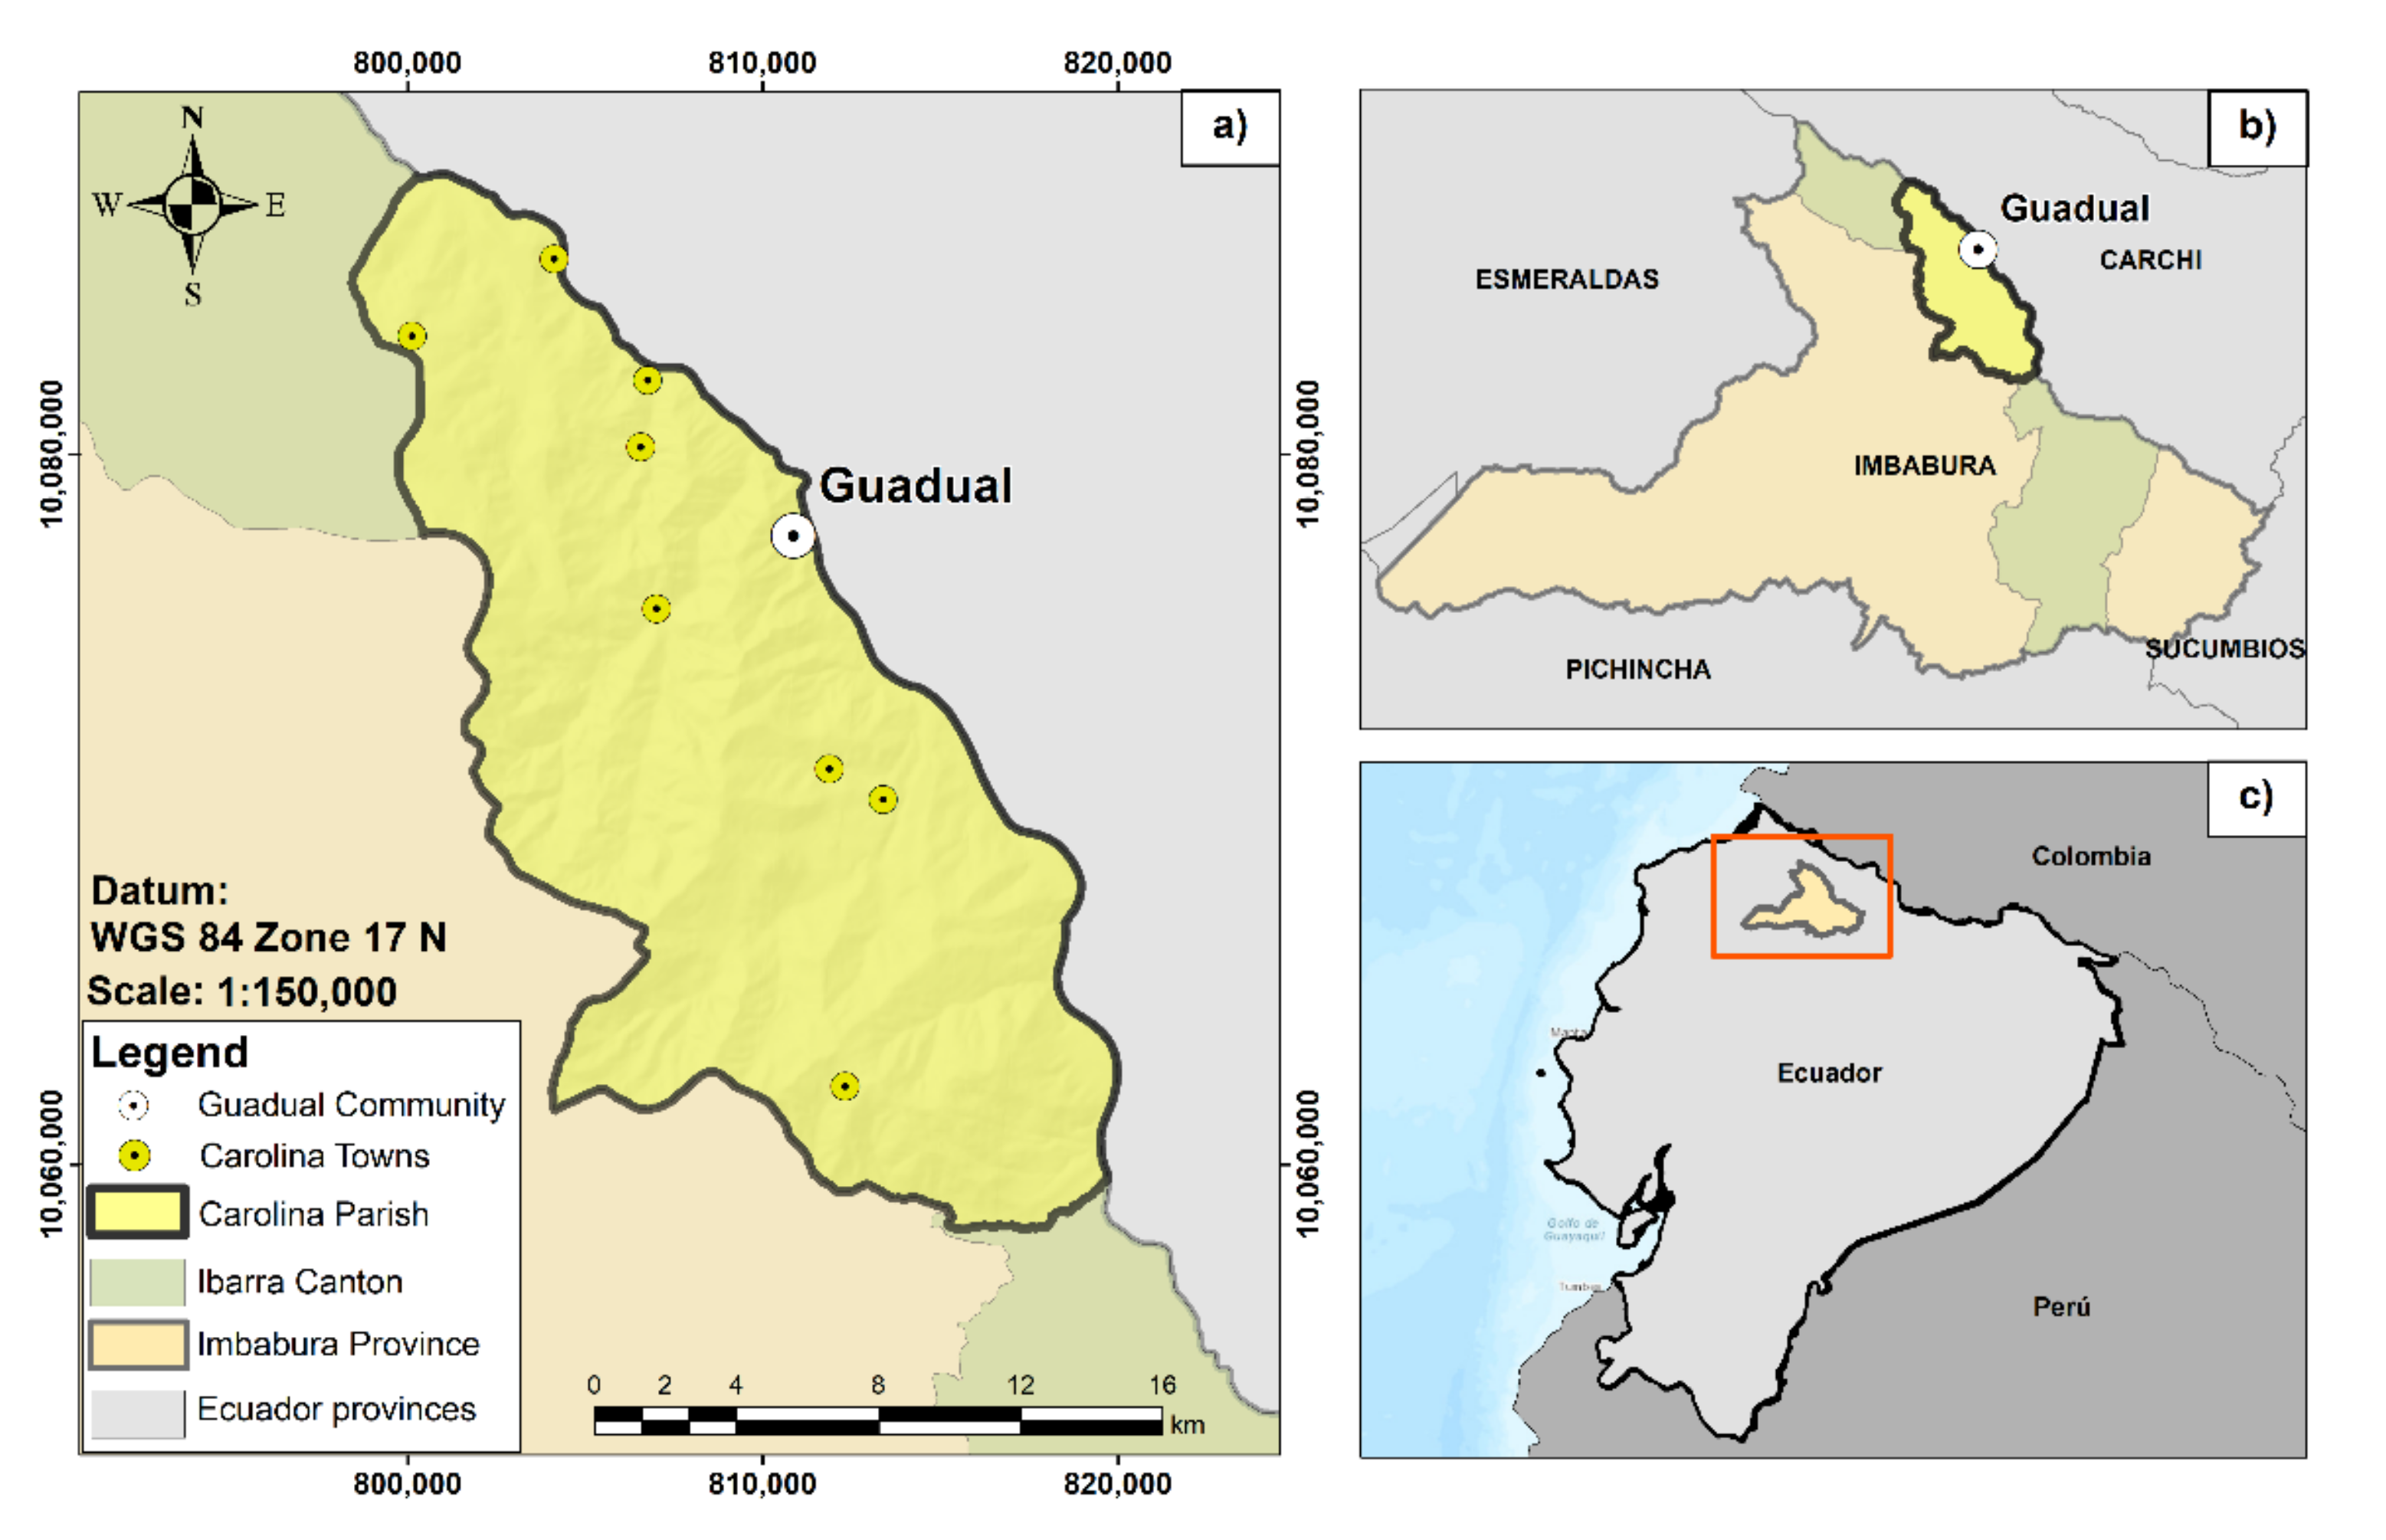
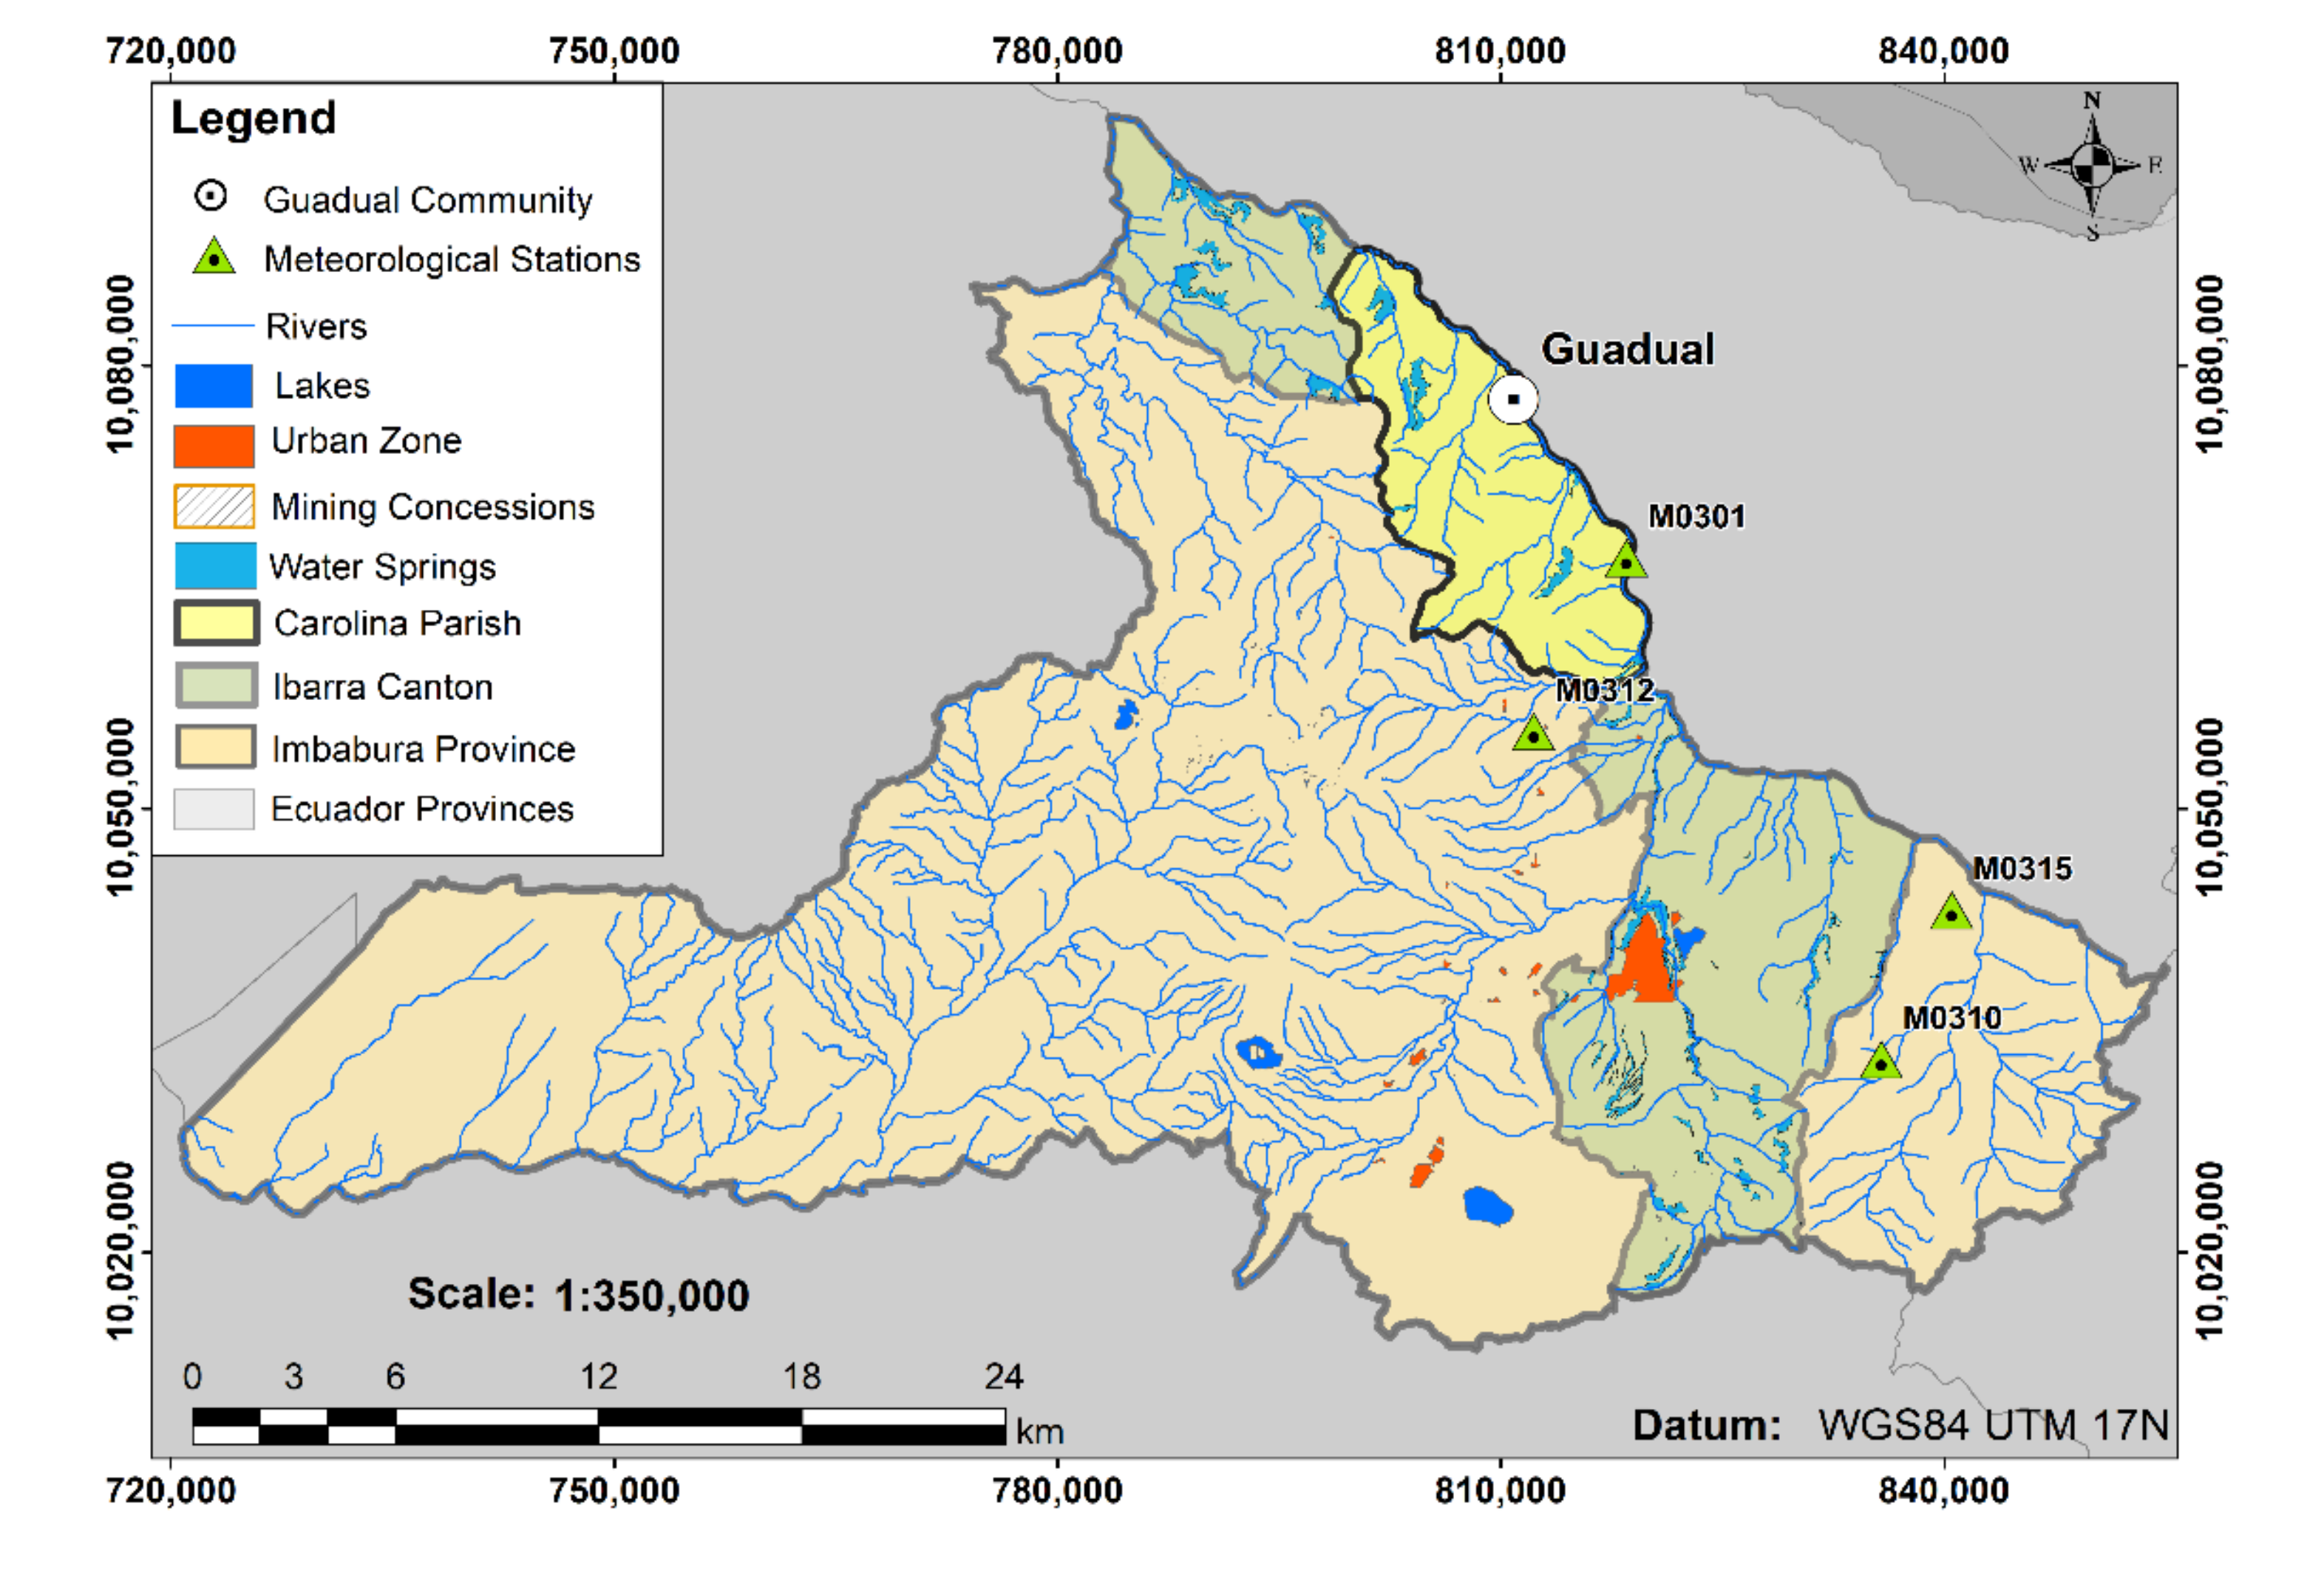
2. Geographical Setting

The Guadual community is located in La Carolina rural parish, with a population of 2739 inhabitants [66], and belongs to the Ibarra canton, Imbabura province (Figure 1). The natural vegetation cover is threatened by the extraction of wood and the expansion of agriculture and livestock, and contains several deforested areas [67]. In addition, within the La Carolina parish is the Carbonería forest, which represents the last remnants of the upper montane evergreen forest in the northeastern Andes Mountains [68,69]. This ecosystem constitutes a refuge for various species of flora and fauna. It is also a water source for the local inhabitants and the people who live in the lowlands. However, the Carbonería is threatened by agricultural expansion and productive activities [70].
Ibarra canton has an area of 242 km2 and 181,175 inhabitants [71]. According to the Köppen climate classification, the region has a warm-summer Mediterranean climate [72], with an elevation of 2225 m.a.s.l. in the Ecuadorian Andes, which provide cooler temperatures and seasonal rain shadow features [73]. During the summer months (June–September), the precipitation does not exceed 500 mm/month.

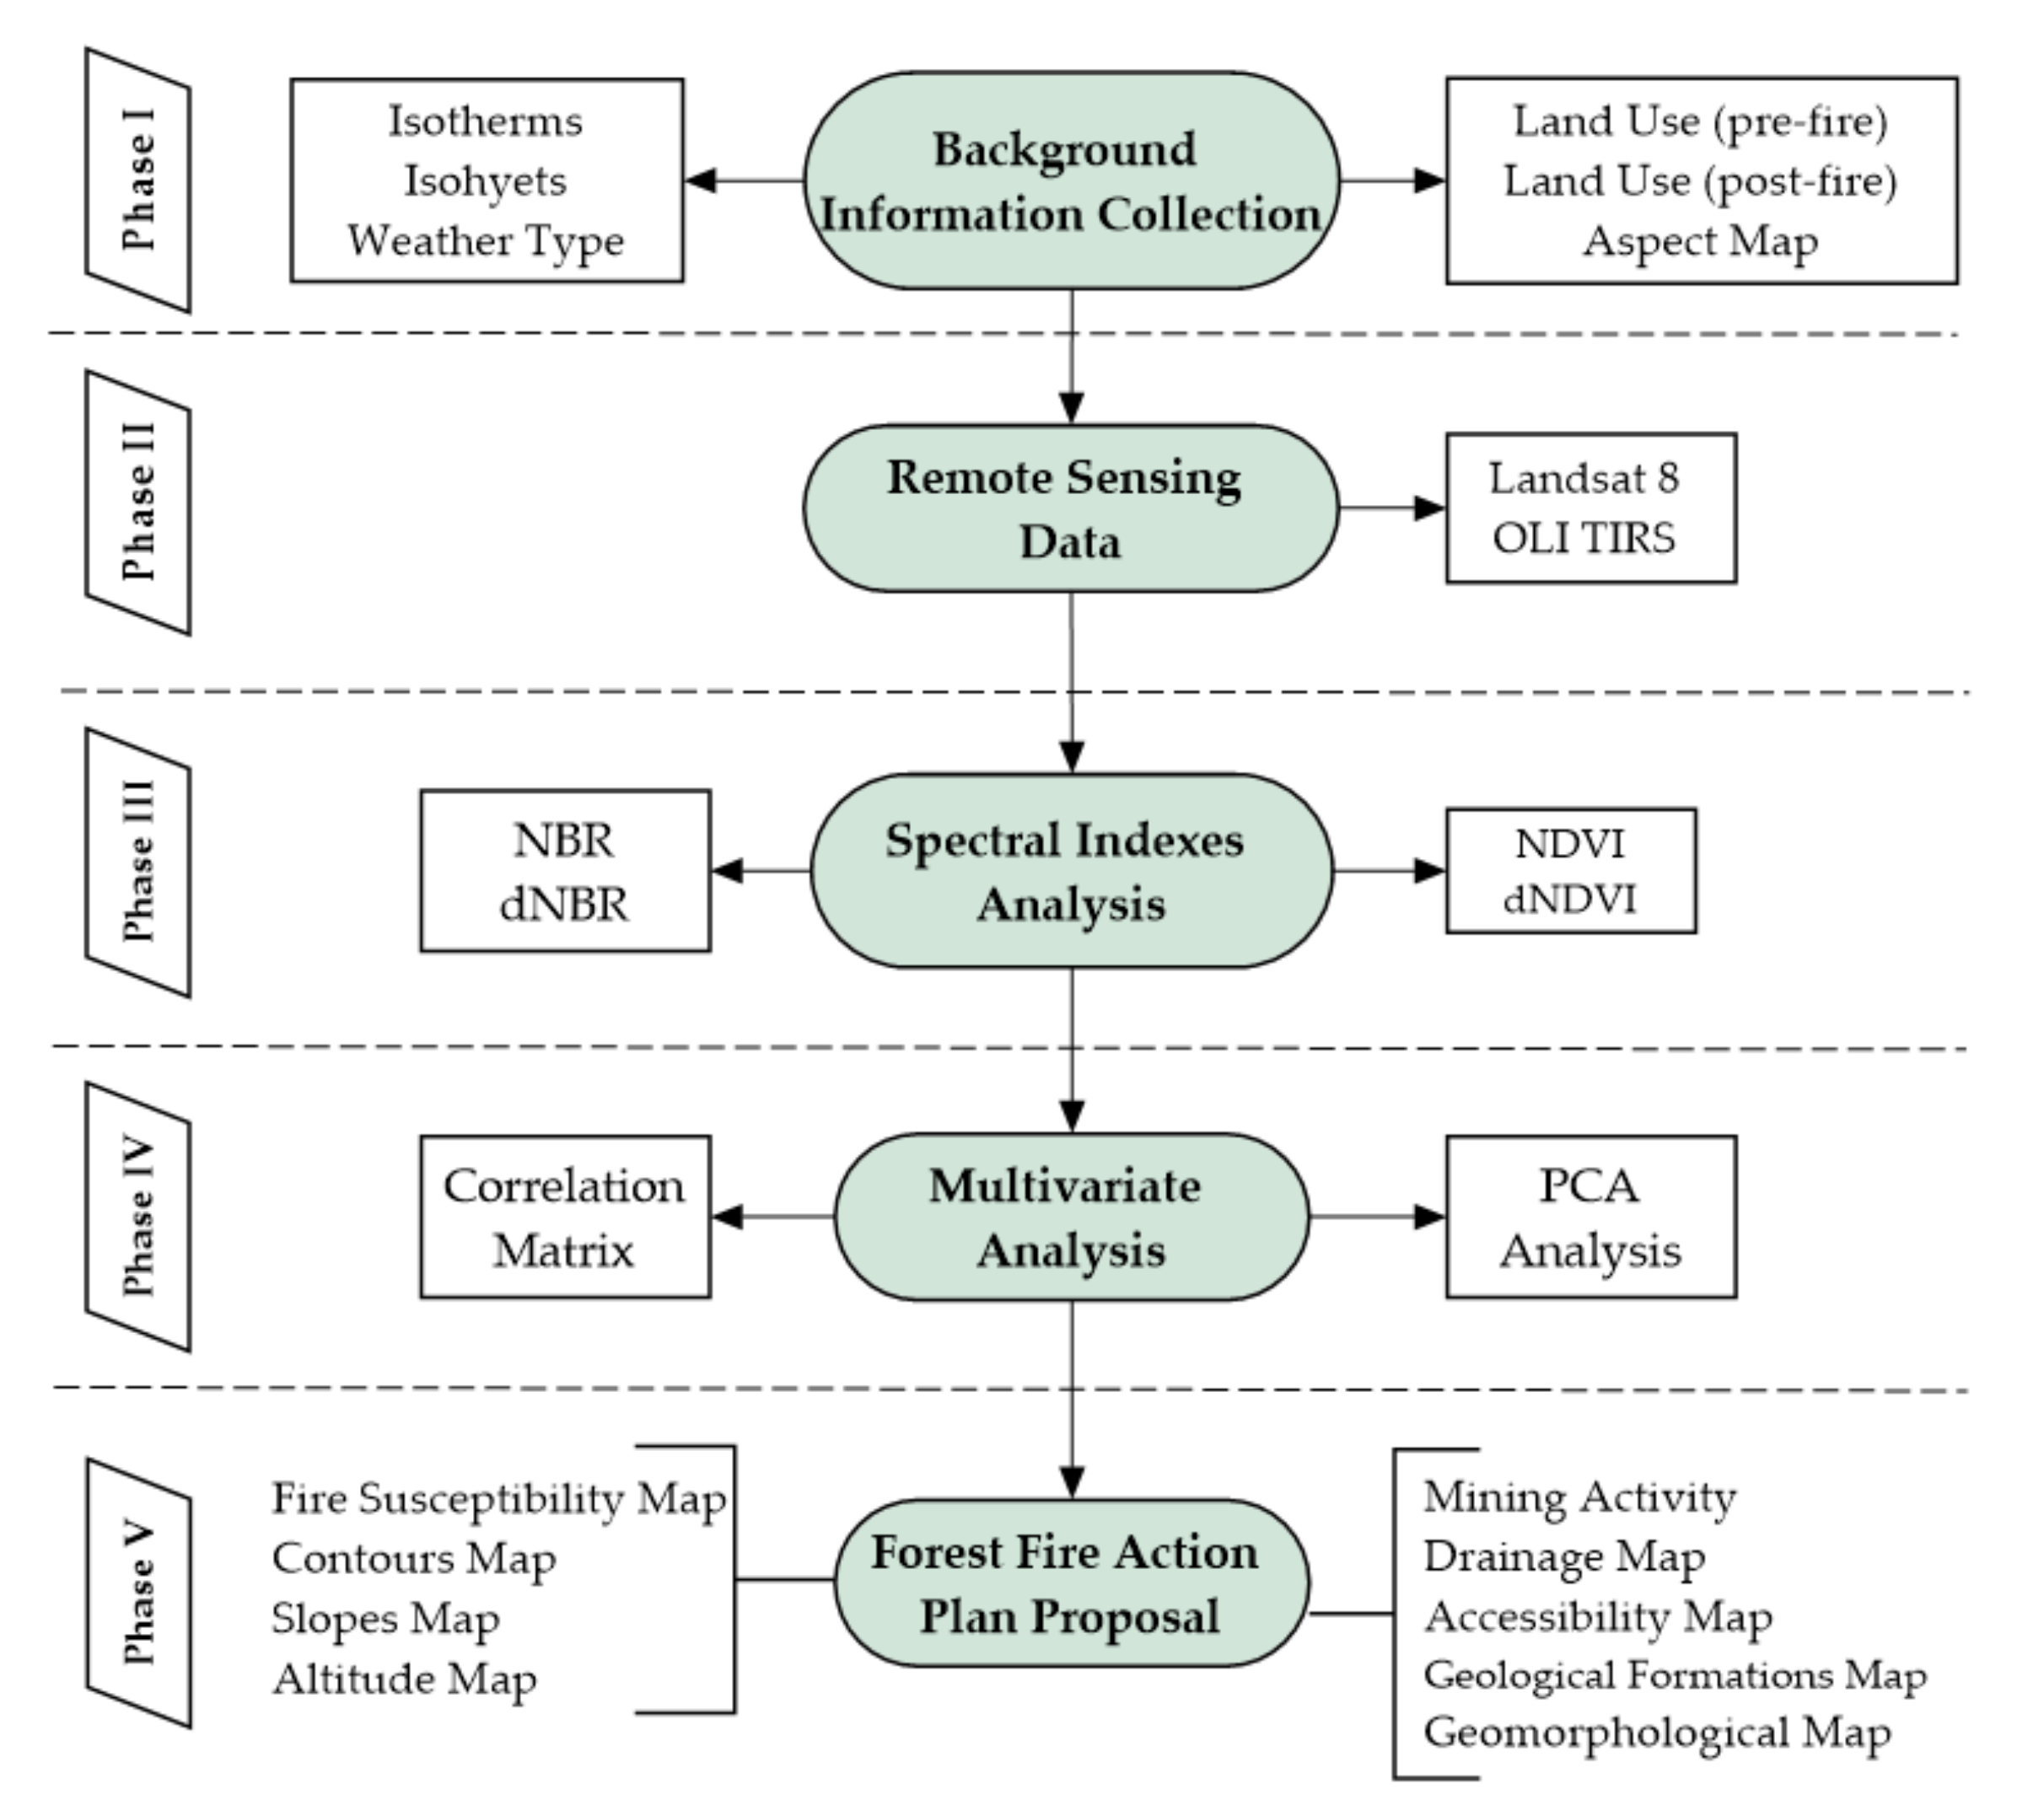
3. Materials and Methods

The methodology of this work includes four investigation phases (see Figure 2): (i) background information collection; (ii) remote sensing data; (iii) spectral index analysis, (iv) multivariate analysis, and (v) forest fire action plan proposal.

3.1. Background Information Collection

In this phase, study area information was collected, including vegetation cover (in pre-fire and post-fire scenarios), climate types, isotherms, isohyets and aspects or sun orientation. This information was taken from the national geoportals of Ecuador, such as the National Land Information System (SIGTIERRAS); the Military Geographical Institute (IGM); the National Information System (SNI); and the Ministry of the Environment, Water and Ecological Transition [74,75,76,77]. These data were represented using Geographic Information Systems (GIS).

3.2. Remote Sensing Data

The satellite images used were obtained from the Landsat-8 Operational Land Imager (OLI) and Thermal Infrared Sensor (TIRS), as shown in Table 1. There are frequent clouds in the region; for that reason, the image search used a percentage cloud cover <25%, from June to September during the dry season. The images were acquired from the image collection of the United States Geological Survey (USGS) [78].
Free-access images from the Landsat were used in this study. Landsat 8 images are L1TP level (level 1 terrain precision correction), atmospherically corrected, orthorectified with Universal Transversal Mercator (UTM) projection, a WGS1984 datum/spheroid and precision greater than 0.8 pixels [79,80]. For the fire severity analysis, the spectral bands of near-infrared (NIR), shortwave infrared (SWIR-1), and red (R) were used. Additionally, Landsat 8 includes two Thermal Infrared (TIR) thermal bands that determine the Earth’s surface temperature [81,82]. The satellite images were processed using the following software: ArcGIS Pro for Landsat 8 images [83]. The pre-fire and post-fire images underwent a resampling process in ArcGIS with the panchromatic spectral band 8 to achieve a spatial resolution of 15 m.

3.3. Spectral Indexes Analysis

In our study of forest fires, the spectral indices NDVI, NBR, dNBR and dNDVI were used to measure the vegetation state in the pre-fire scenario and the degree of severity in the post-fire scenarios. The NDVI allowed us to measure the degree of recovery of vegetation before and after fire [84,85]. The NDVI is used for the relationship between the area burned and the decrease in vegetation cover [86]. In addition, good relationships are obtained with this index between the severity of the fire and the amount of vegetation consumed [27]. NDVI quantifies vegetation by measuring the difference between NIR (a wavelength which vegetation strongly reflects) and red light (a wavelength which vegetation absorbs) [87], as shown in equation 1.
NDVI = NIR Red NIR + Red
The NBR was used to analyze the fire’s degree of severity since this index classifies satellite images based on living vegetation [88,89]. This index combines two spectral bands (NIR and SWIR) that respond better to the effects of fire [90], as shown in Equation (2). The NIR reflectivity decreases due to the disappearance of the active vegetation. The SWIR reflectivity increases due to the humidity loss, greater soil exposure, and fewer shadows cast by the vegetation [91,92]. The calculation of NBR from remote sensing optical platforms such as Landsat-8 is useful as a proxy indicator of burn severity when compared to in situ field measurements [93,94].
NBR = NIR SWIR NIR + SWIR
The fire’s severity corresponds to a fire impact measure, operationally defined by the organic matter loss above and below the ground [91]. For this reason, spectral indices of normalized difference were also applied, which analyzed the difference between pre- and post-fire satellite images, the dNDVI [85] and dNBR [95,96,97], as observed in equations 3 and 4, respectively.
dNDVI = pre-fire NDVI − post-fire NDVI
dNBR = NBRpre     NBRpos t
Once the severity maps (dNDVI and dNBR) were generated, a general verification of these was approached from their comparison with 31 fire points described in the literature, specifically, the degree of occurrence of these fires according to the assigned categorization. After that, the percentage of points that were in each fire severity category according to the two proposed models (dNDVI and dNBR) was analyzed and their accuracy was verified by comparing their results with each other.

3.4. Multivariate Analysis

Precipitation plays an essential role in the characterization of forest fires [98]. Therefore, we proposed to identify the region’s seasons with the highest and lowest precipitation and their influence on the post-fire scenario, applying the multivariate technique, principal component analysis (PCA). This technique is widely used for data analysis and processing [99]. PCA transforms several correlated variables into linearly uncorrelated variables named principal components [100,101].
Previously, we applied a correlation matrix to data from four meteorological stations located in the surroundings of the La Carolina parish: (i) Carchi (M0301), (ii) Pablo Arenas (M0312), (iii) Pimampiro (M0315) and (iv) Mariano Acosta (M310), as is shown in Figure 3. This matrix allowed us to analyze the level of correlation between these three meteorological stations and, in this way, to work with data that were close to the climatic reality of the region. The data from these stations came from the National Institute of Meteorology and Hydrology (INAHMI, acronym in Spanish) [102].
In this study, the PCA application worked with two variables: monthly precipitation and months. These variables were represented in a 14 × 69 matrix (14 columns by 69 rows). The columns include the 12 months of the year, the meteorological stations’ names and the year of analysis. The rows include monthly precipitation data in the 2000–2016 period, representing 17 rows by each meteorological station analyzed. In this analysis, R software (version 4.1.0) was used for the statistical processing and visualization of information. R is a free statistical software package and has an integrated development environment called RStudio, which provides comprehensive tools to visualize and analyze quantitative data [103,104].

3.5. Forest Fire Action Plan Proposal

In this phase, developing a general management plan for the territory against fires was addressed based on the existing information obtained in this work. It also included the identification of impacts, of which the environmental effects associated with the natural environment are a consequence of human activity.
The importance of developing an action plan in La Carolina parish lies in the fact that the main socio-economic activity in the region is livestock farming (95%), which leads to changes in land use. Therefore, the owners’ traditional practice is to burn the scrub and bushes to produce grass for cattle. In some cases, they burn the same grass to generate better grass, sometimes causing forest fires [105].
Nine parameters were considered for the establishment of the fire action plan: (i) mining activity, (ii) drainage, (iii) accessibility, (iv) geological formations, (v) geomorphology, (vi) fire susceptibility, (vii) contours, (viii) slopes and (ix) altitude. As a result of the interpretation of these nine parameters, we generated evacuation routes for forest fires and proposals for the prevention of these events.

4. Results

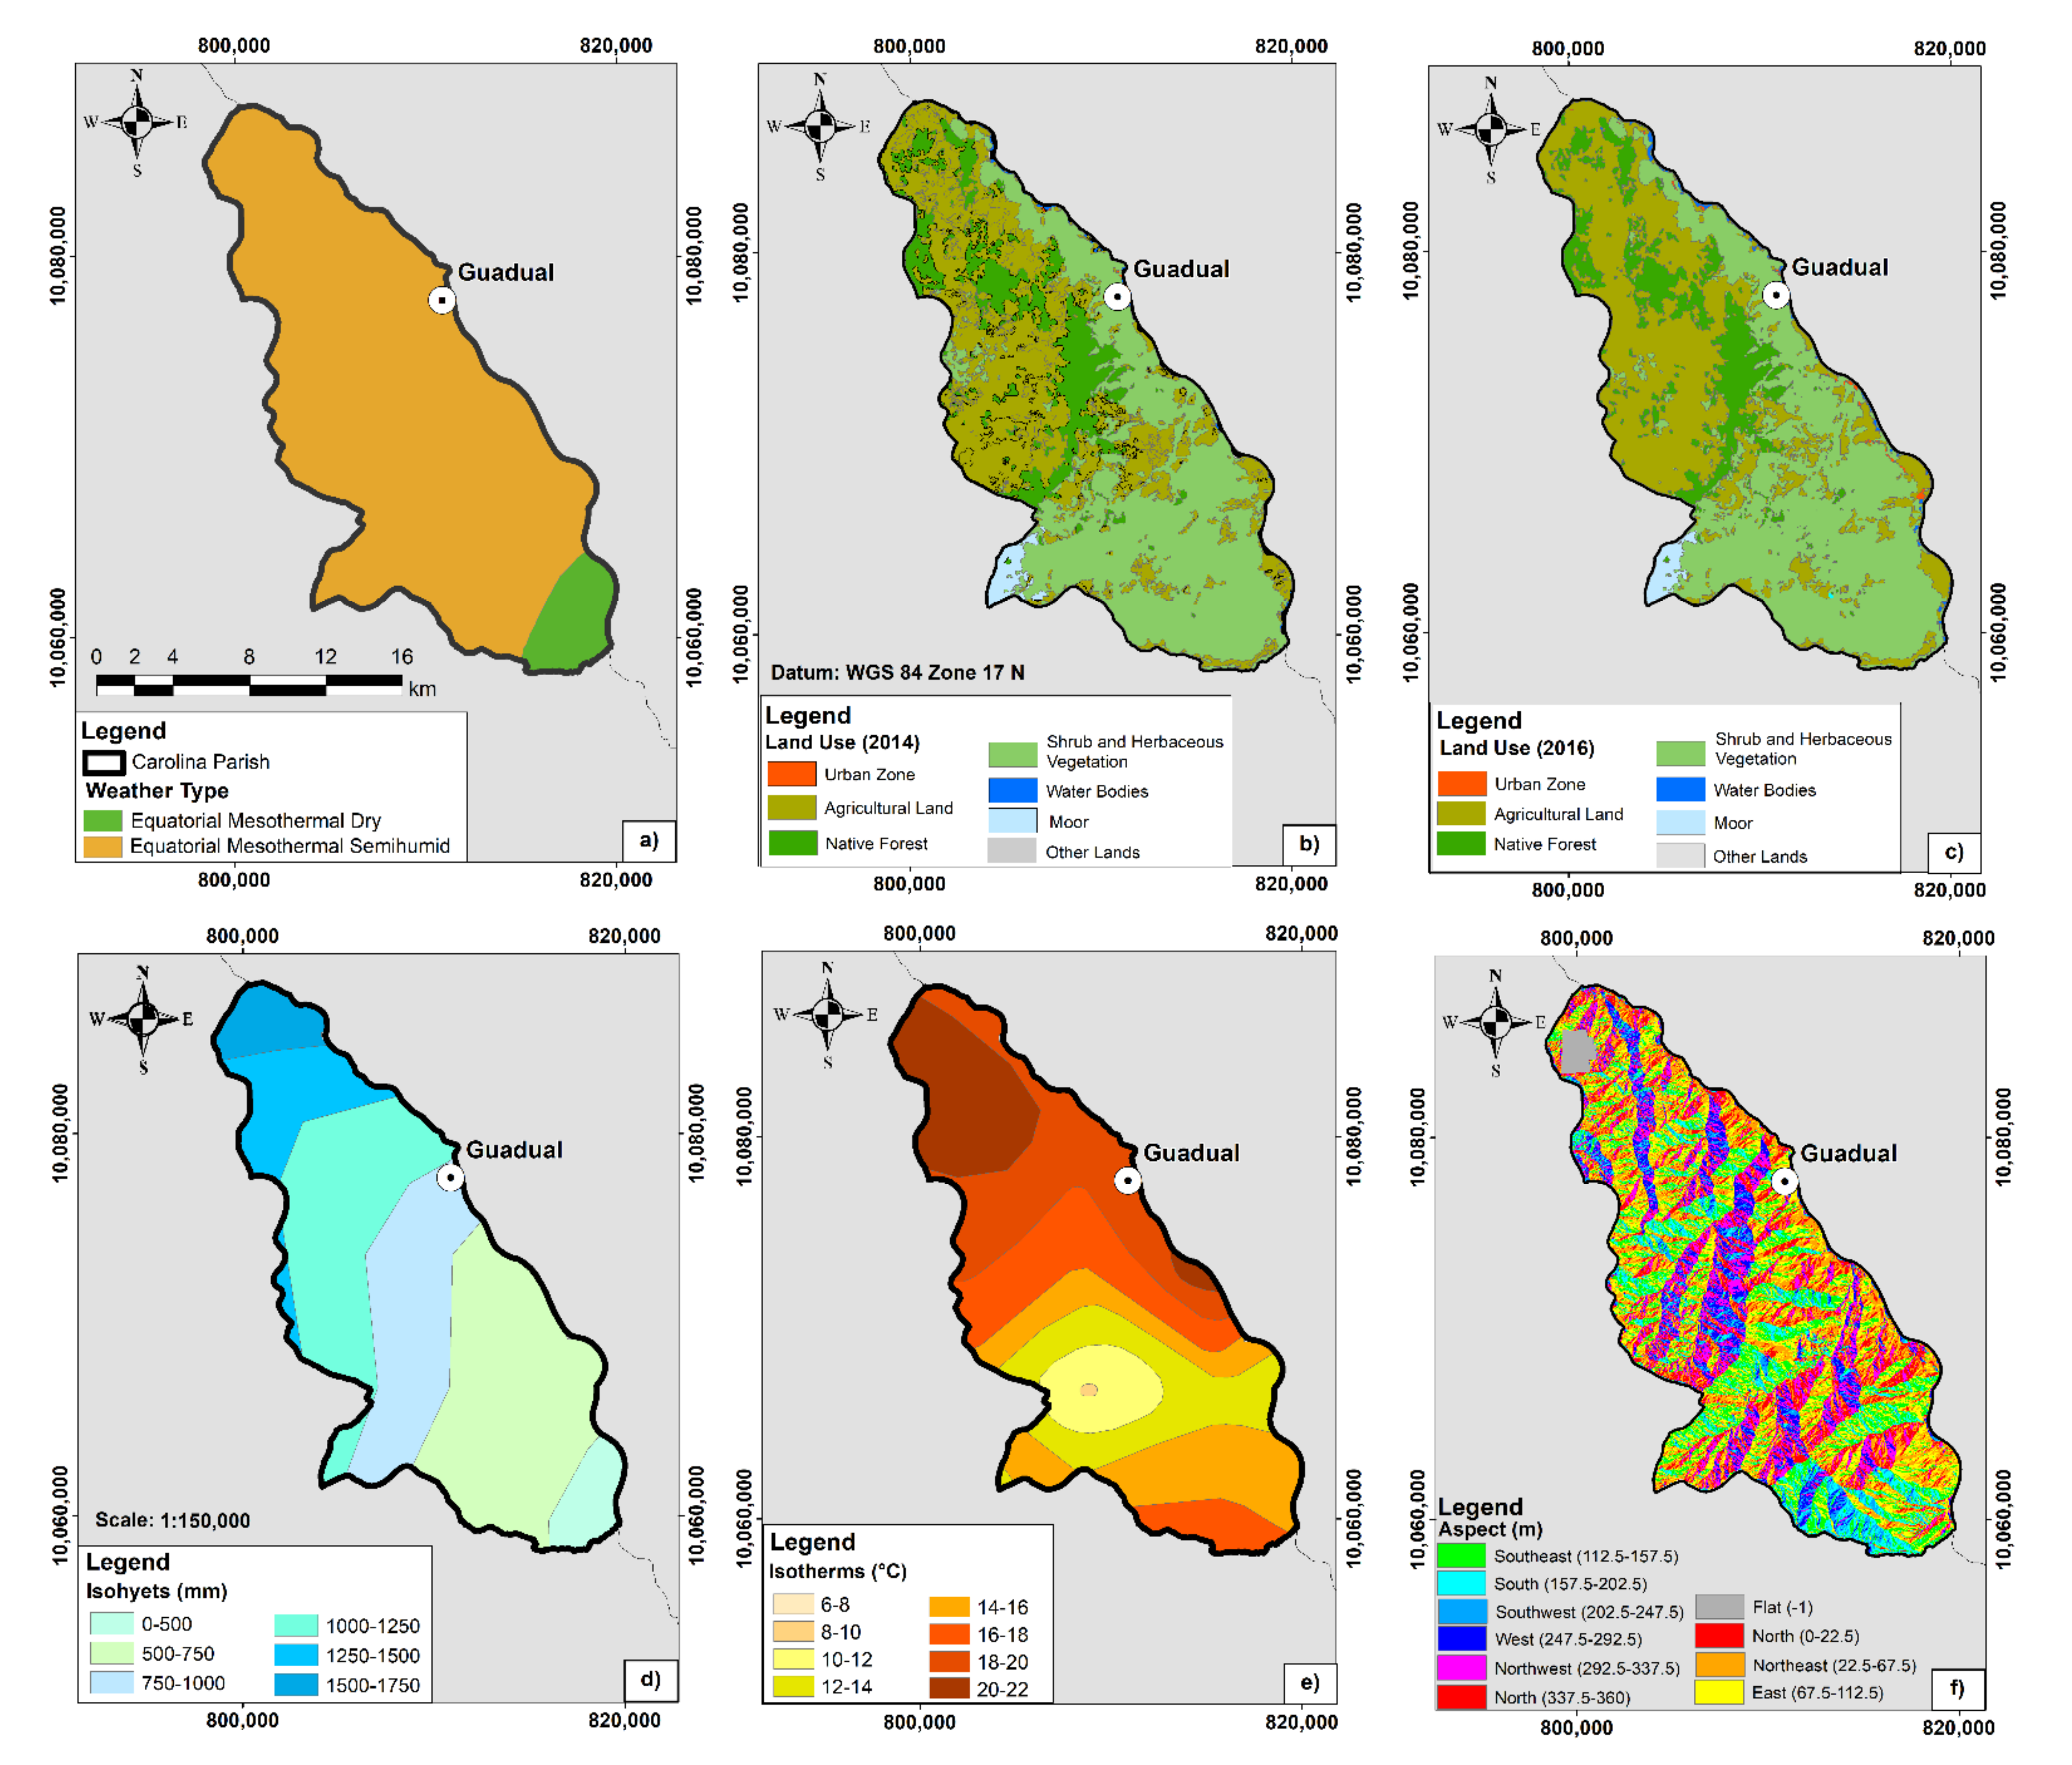
4.1. Collection and Presentation of Base Cartographies

In Carolina parish, there is an equatorial mesothermal climate ranging from dry to semi-humid [105]. The land use categories that stand out in the region are native forest, moors, shrub and herbaceous vegetation and agricultural land [77]. These kinds of vegetation could be considered combustible material in forest fire scenarios [71]. Table 2 shows the change in land use in the pre-fire (2014) and post-fire (2016) scenarios. The main effects are observed in the increase from 42.54% (2014) to 45.82% (2016) in the shrub and herbaceous vegetation and the expansion in the urban area from 0.03% (2014) to 0.24% (2016). Furthermore, there is a temperature range between 10 °C and 22 °C (isotherms), which are considerably high and could be another factor favoring the rapid spread of fire. Finally, precipitation varies between 500 and 1250 mm/year (isohyets), as shown in Figure 4. Considering that the fire under study occurred in September (dry season), this is another factor that affected the spread of the fire because with the lack of rain, the vegetation dries up, and the fire spreads easily. Finally, the map of aspects or sun orientation indicates the slope direction as a reference in predicting a fire’s propagation if it starts within the study area [106].

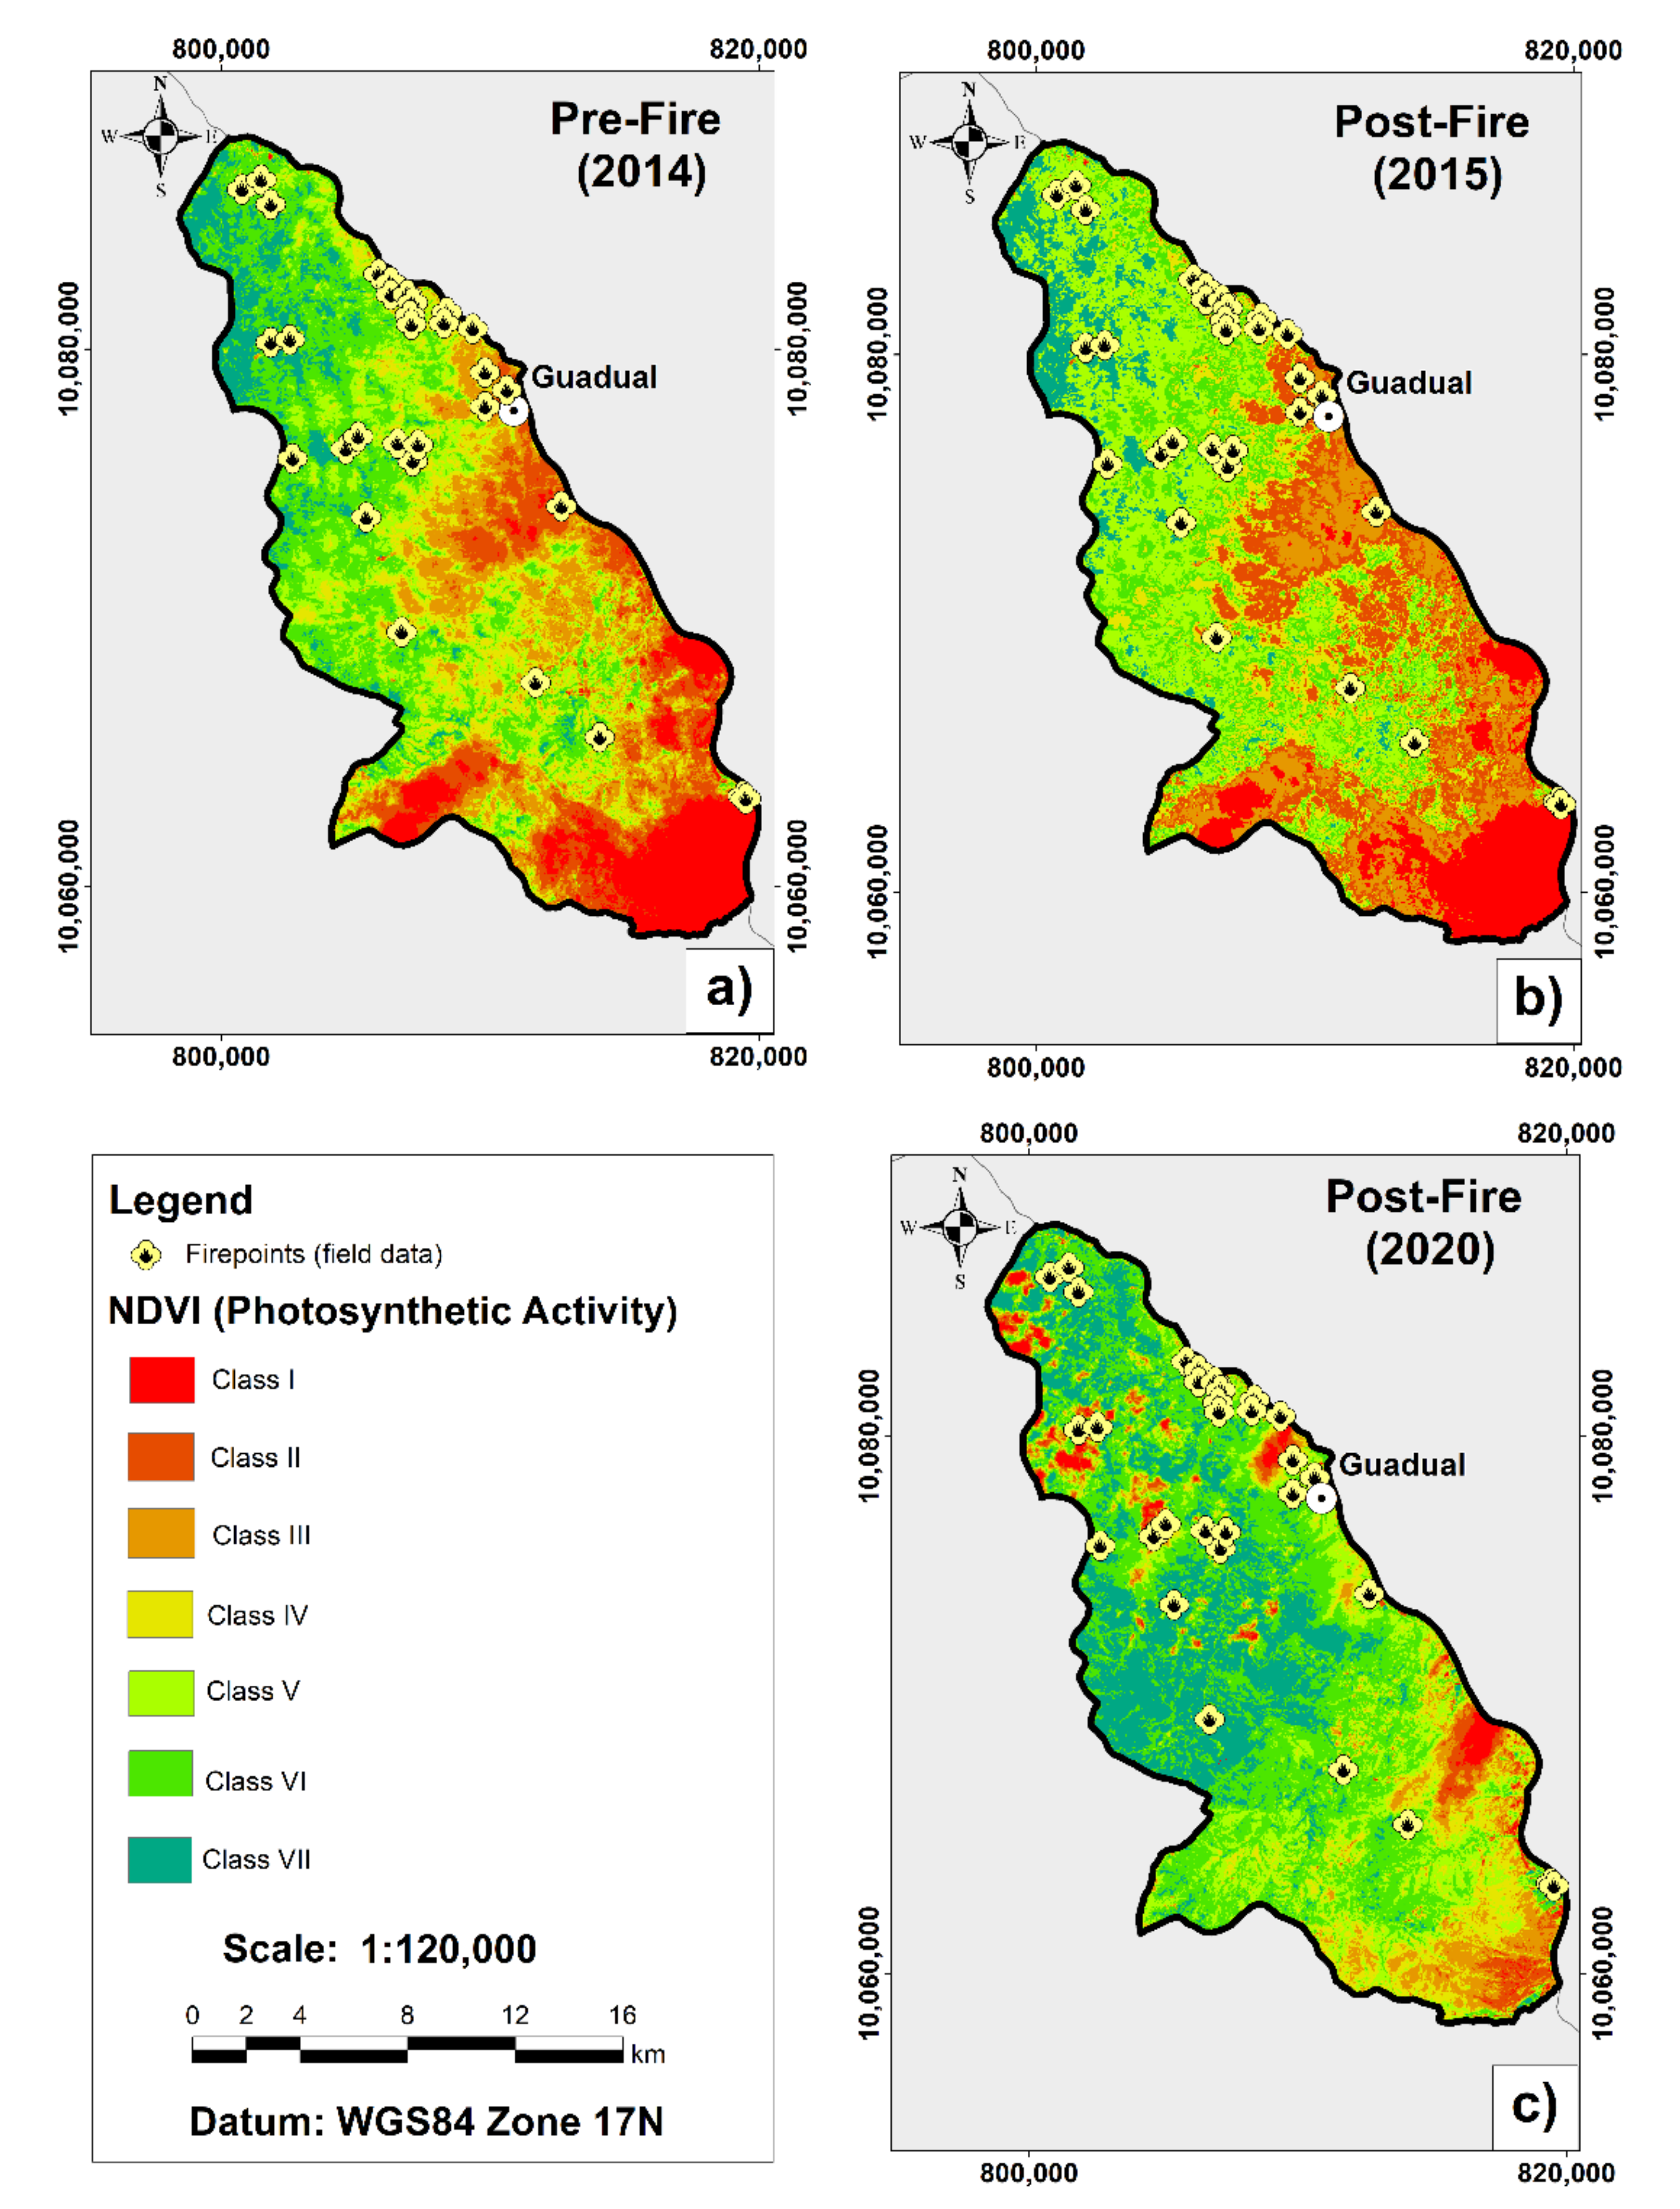
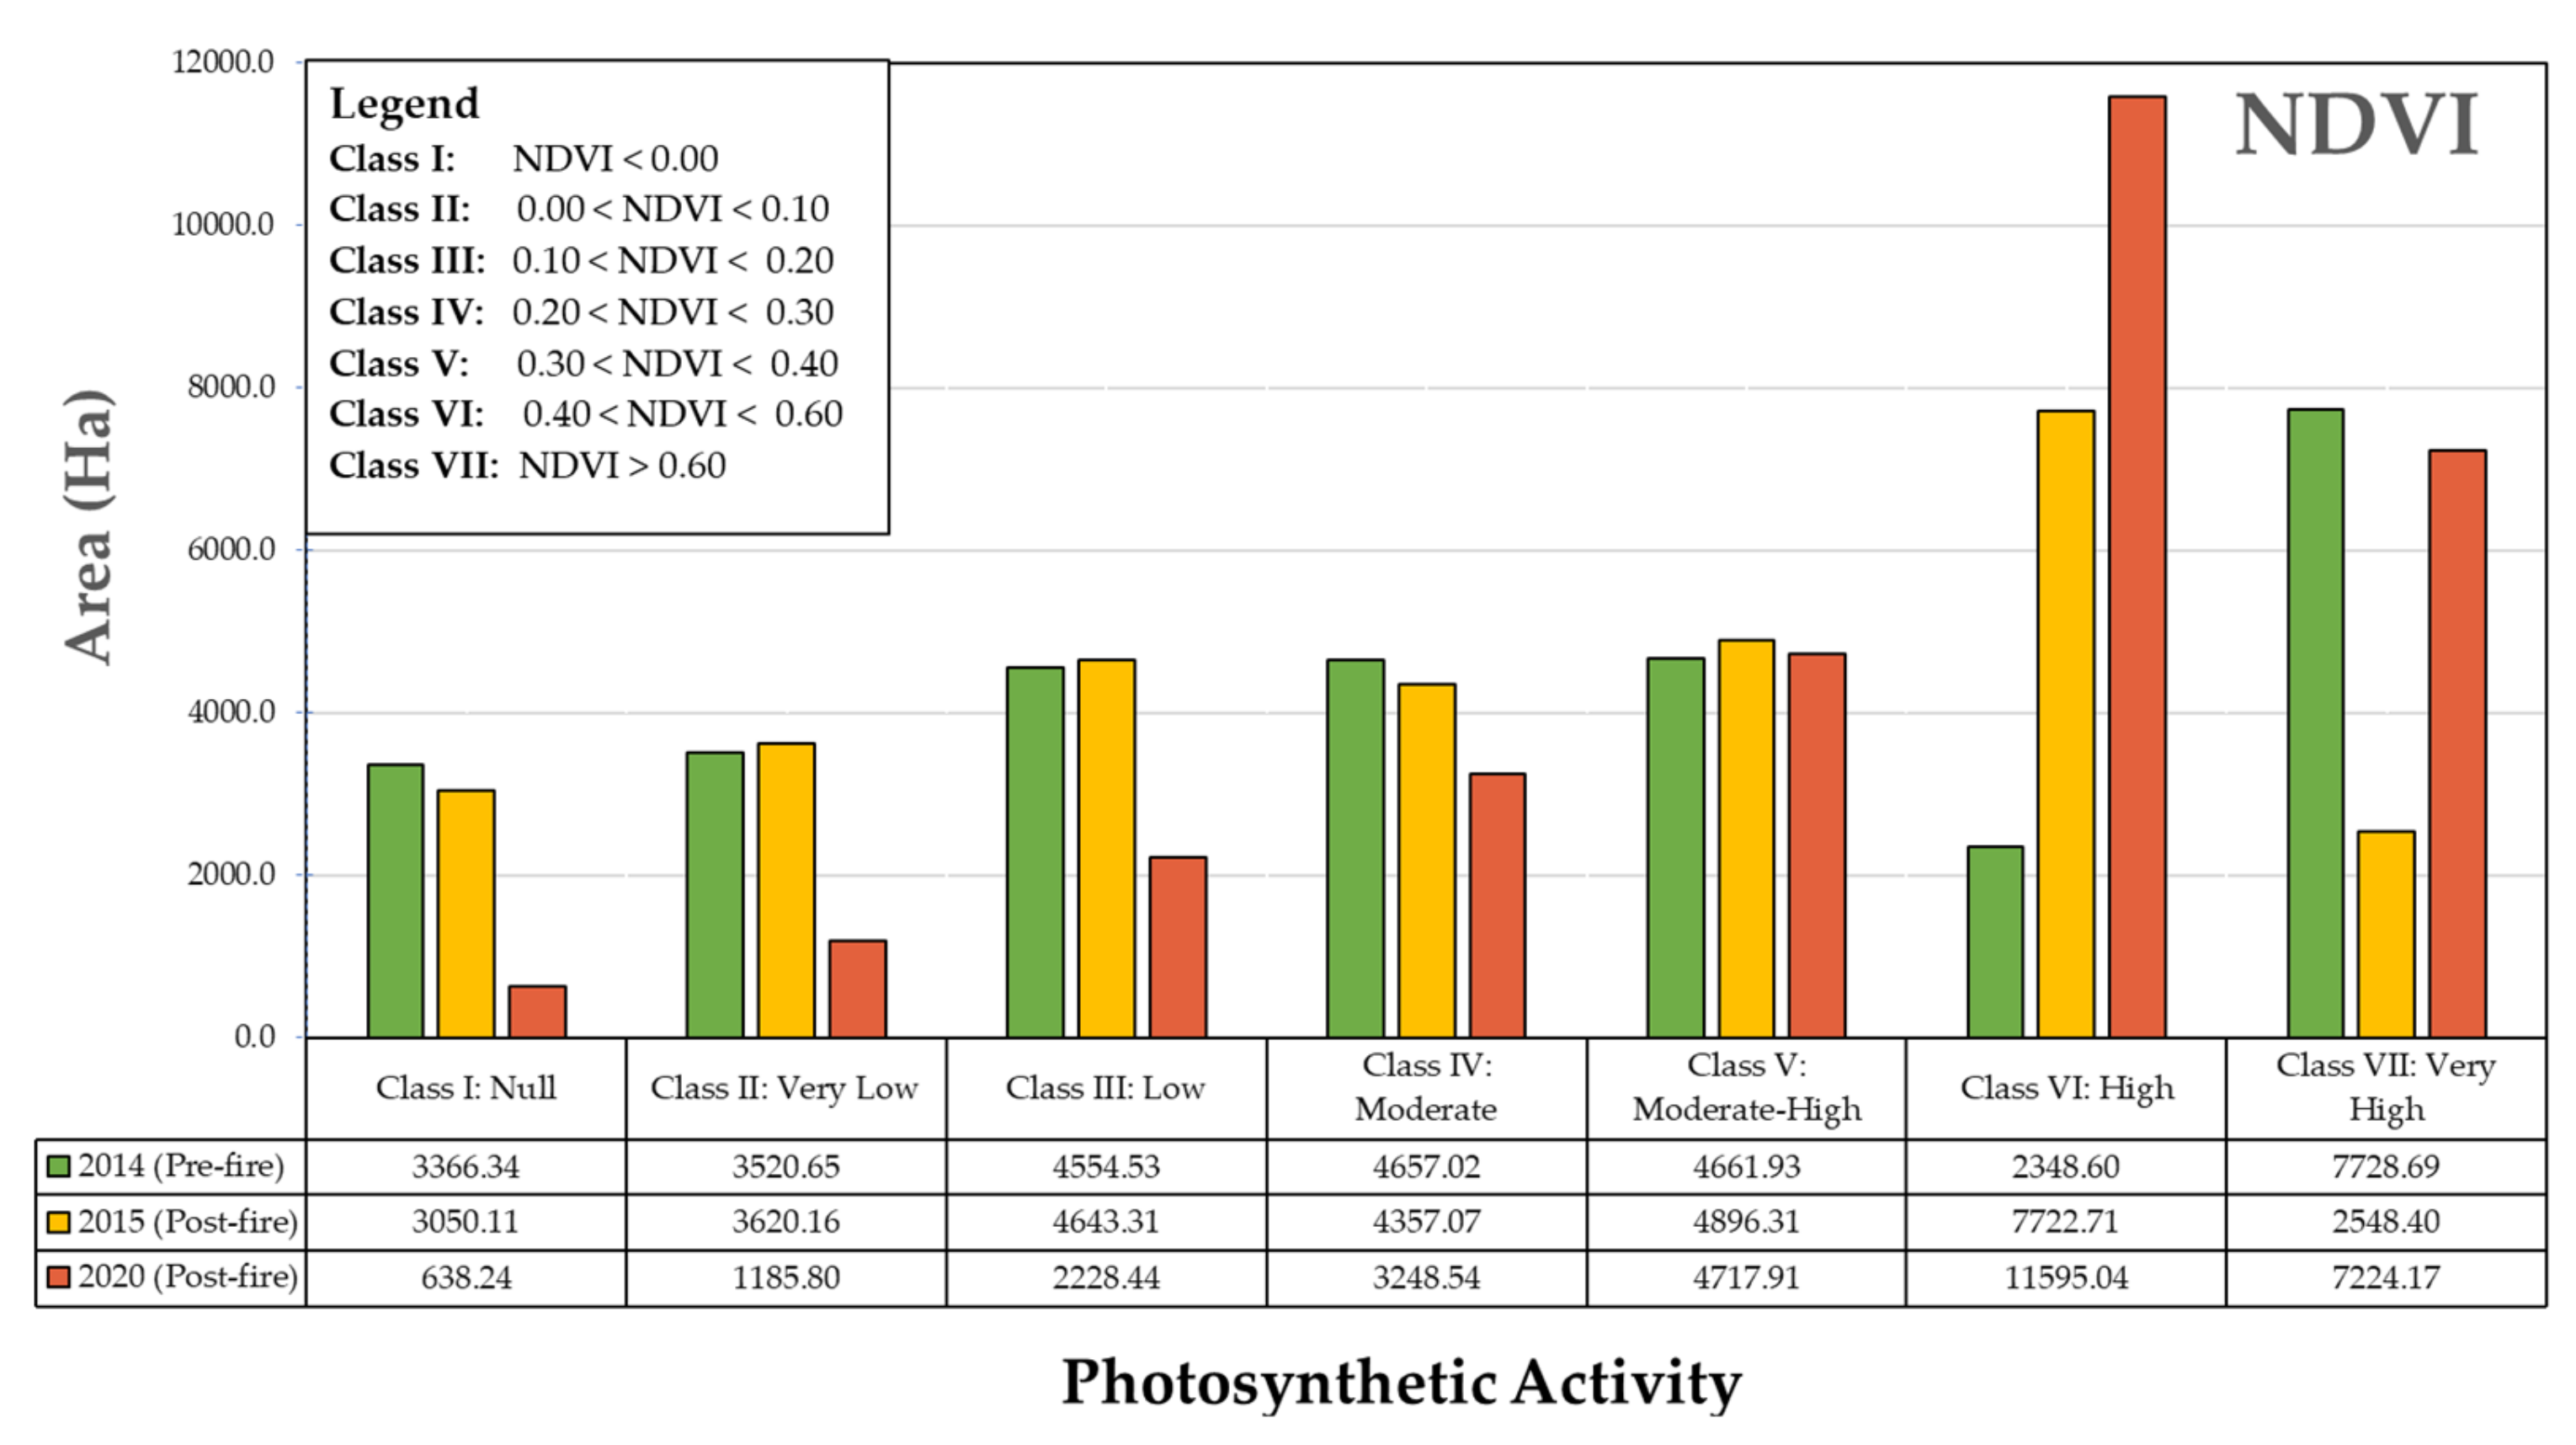
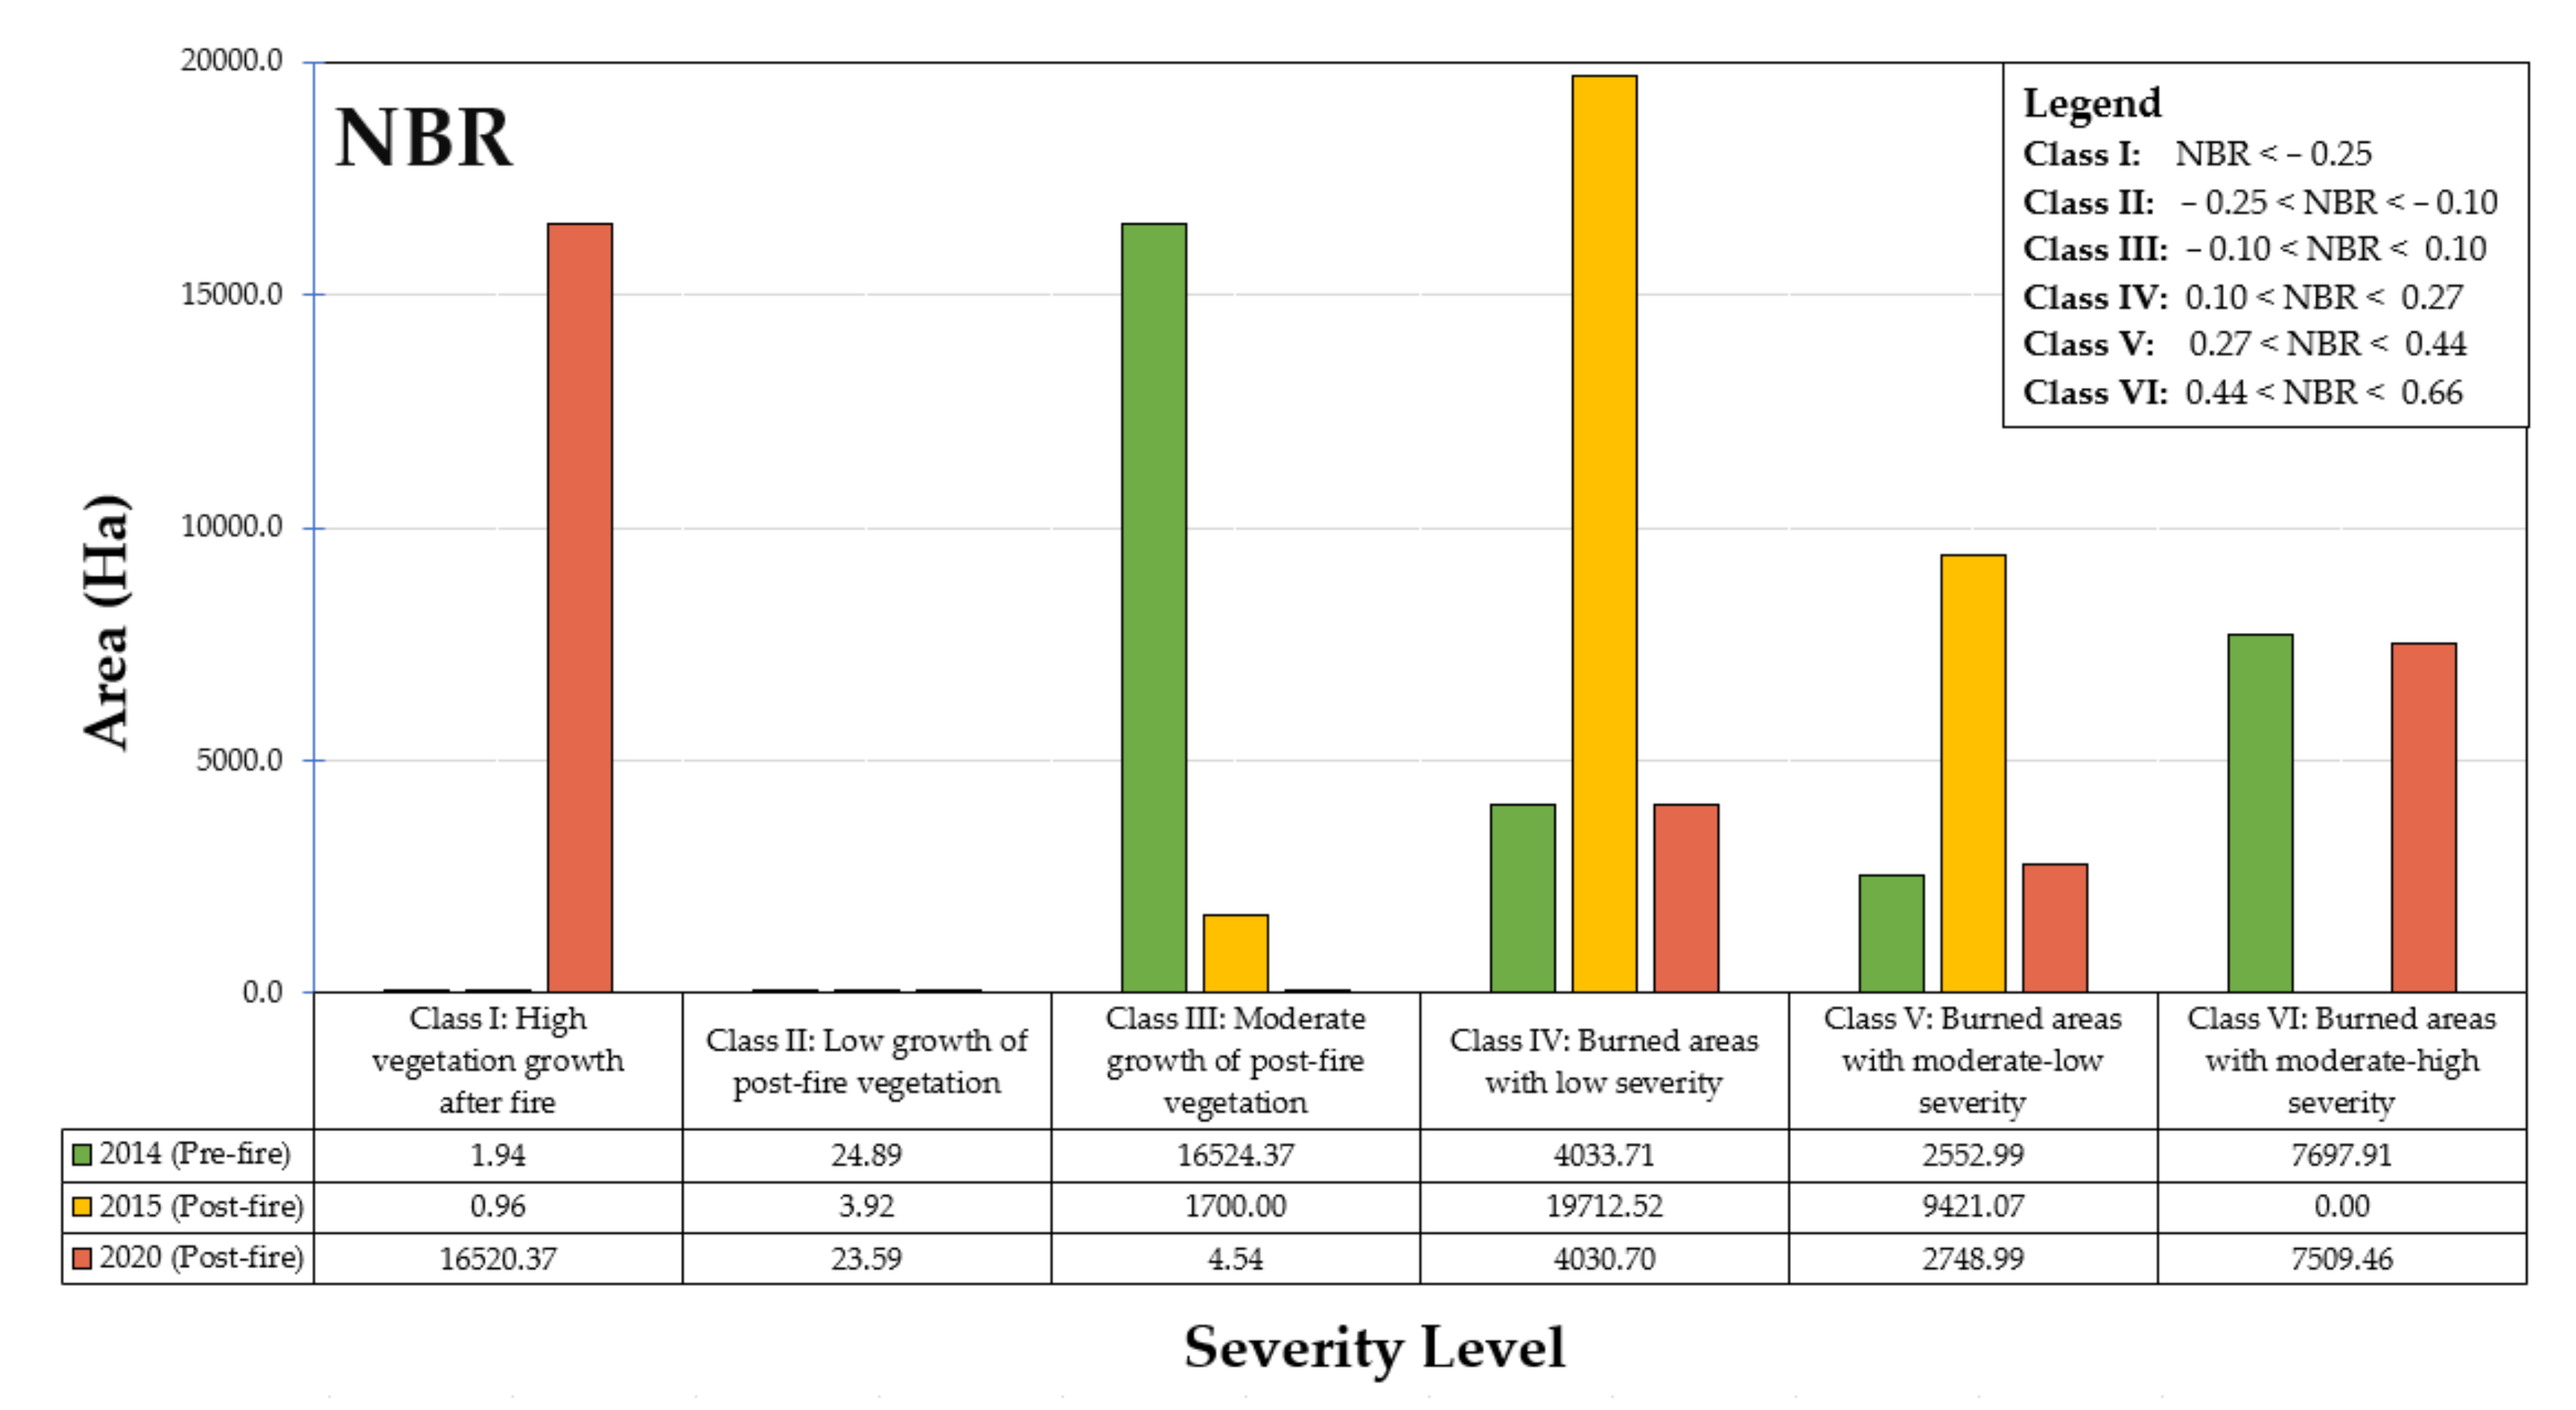
4.2. Spectral Index Calculation

The NDVI was calculated using the NIR and red bands to qualify and quantify the affected vegetation cover (see Figure 5). This index is classified into seven classes according to photosynthetic activity, with values range between −1 and 1 [107]. In vegetated areas, NDVI takes positive values, whereas its negative values correspond to bare soil [108]. In this specific area, negative and close-to-zero NDVI values (class I and II) represent areas with cloudiness and material with no photosynthetic activity, and values greater than 0.6 (class VII) indicate very high photosynthetic activity, which confirms the presence of vigorous or healthy vegetation. Thirty-one field points from areas where forest fires were recorded from June to September 2015 (post-fire) were also included [105], as shown in Figure 5.
Table 3 shows each class of the NDVI map with their respective photosynthetic activity. These ranges were based on a previous study [107].
Figure 6 presents the seven NDVI categories according to photosynthetic activity in the three scenarios: 2014 (pre-fire), 2015 (post-fire) and 2020 (post-fire). It was observed that in 2014 (pre-fire), 25.06% corresponded to very high photosynthetic activity, 30.22% between the moderate to moderate/high categories, and there 10.92% was null, in areas where there was mainly shrubby and herbaceous vegetation. Next, in 2015 (post-fire), 25.04% corresponded to high photosynthetic activity, 30.01% corresponded to the very high category and 9.89% to null. Finally, in 2020 (post-fire), 23.43% corresponded to very high photosynthetic activity and 37.60% corresponded to high, indicating the recovery of the vegetation six years after the fire in the Guadual community.
Figure 7 shows the monthly mean values of NDVI for 22 consecutive years. Since October 2014 (post-fire), the NDVI values decreased without exceeding the value of 0.25.
Figure 8 shows the NBR for a pre-fire image and three post-fire images from the Landsat 8 satellite. This index also ranges between −1 and 1, where values less than 0.25 (class I) represent areas of high vegetation repopulation and values between 0.44 and 0.66 (class VI) indicate moderate/high severity [110]. The 31 field points mentioned in the NDVI section were also included [105].
Table 4 shows each class of the NBR map with their respective fire severity levels. These ranges were based on previous studies [91,111,112], including a United States Geological Survey (USGS) classification [111].
Figure 9 presents the six NBR categories according to the fire severity level in the three scenarios: 2014 (pre-fire), 2015 (post-fire) and 2020 (post-fire). It was observed that in 2014 (pre-fire), 53.59% of the area had a classification of moderate growth of post-fire vegetation, and 24.96% corresponded to burned areas with moderate-high severity. Subsequently, in 2015 (post-fire), 63.92% corresponded to burned areas with low severity and 30.55% to burned areas with moderate/low severity. Finally, in 2020 (post-fire), 53.57% of the area achieved a high vegetation growth after fire, demonstrating the recovery of the vegetation in the region six years after the fire of September 2014. However, 13.07% was still classified as burned areas with low severity as a remnant of this event.

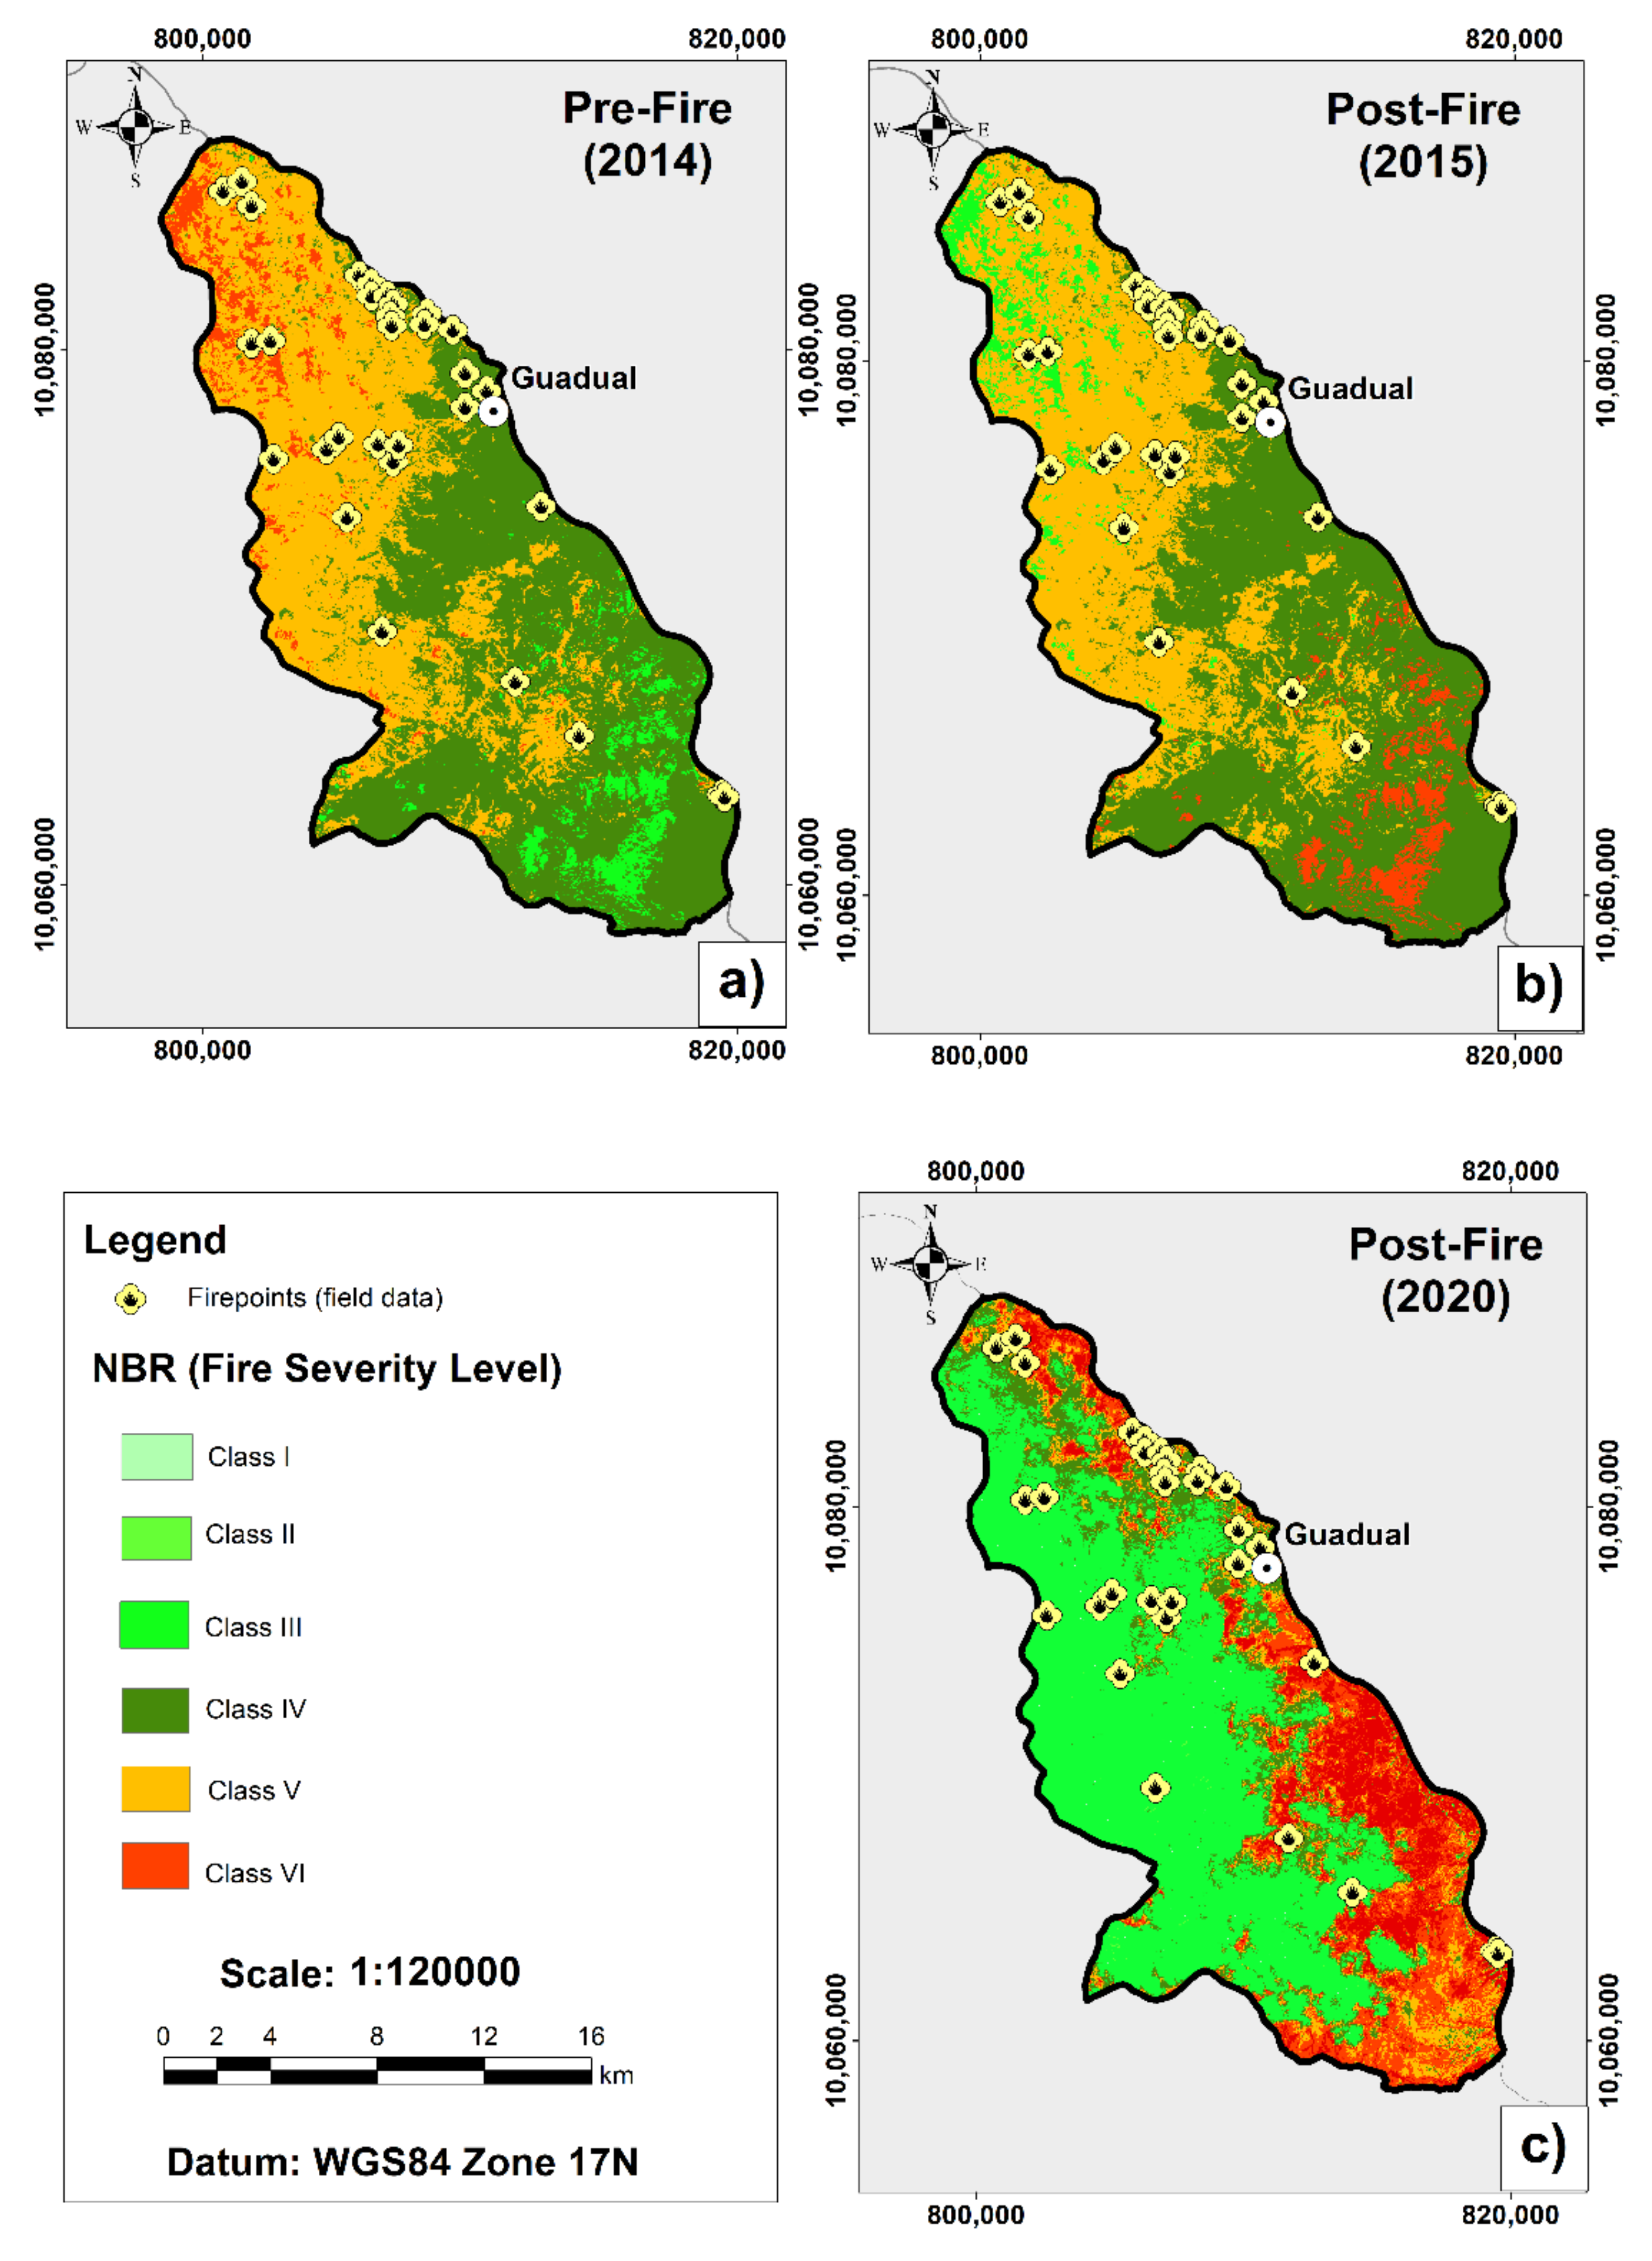
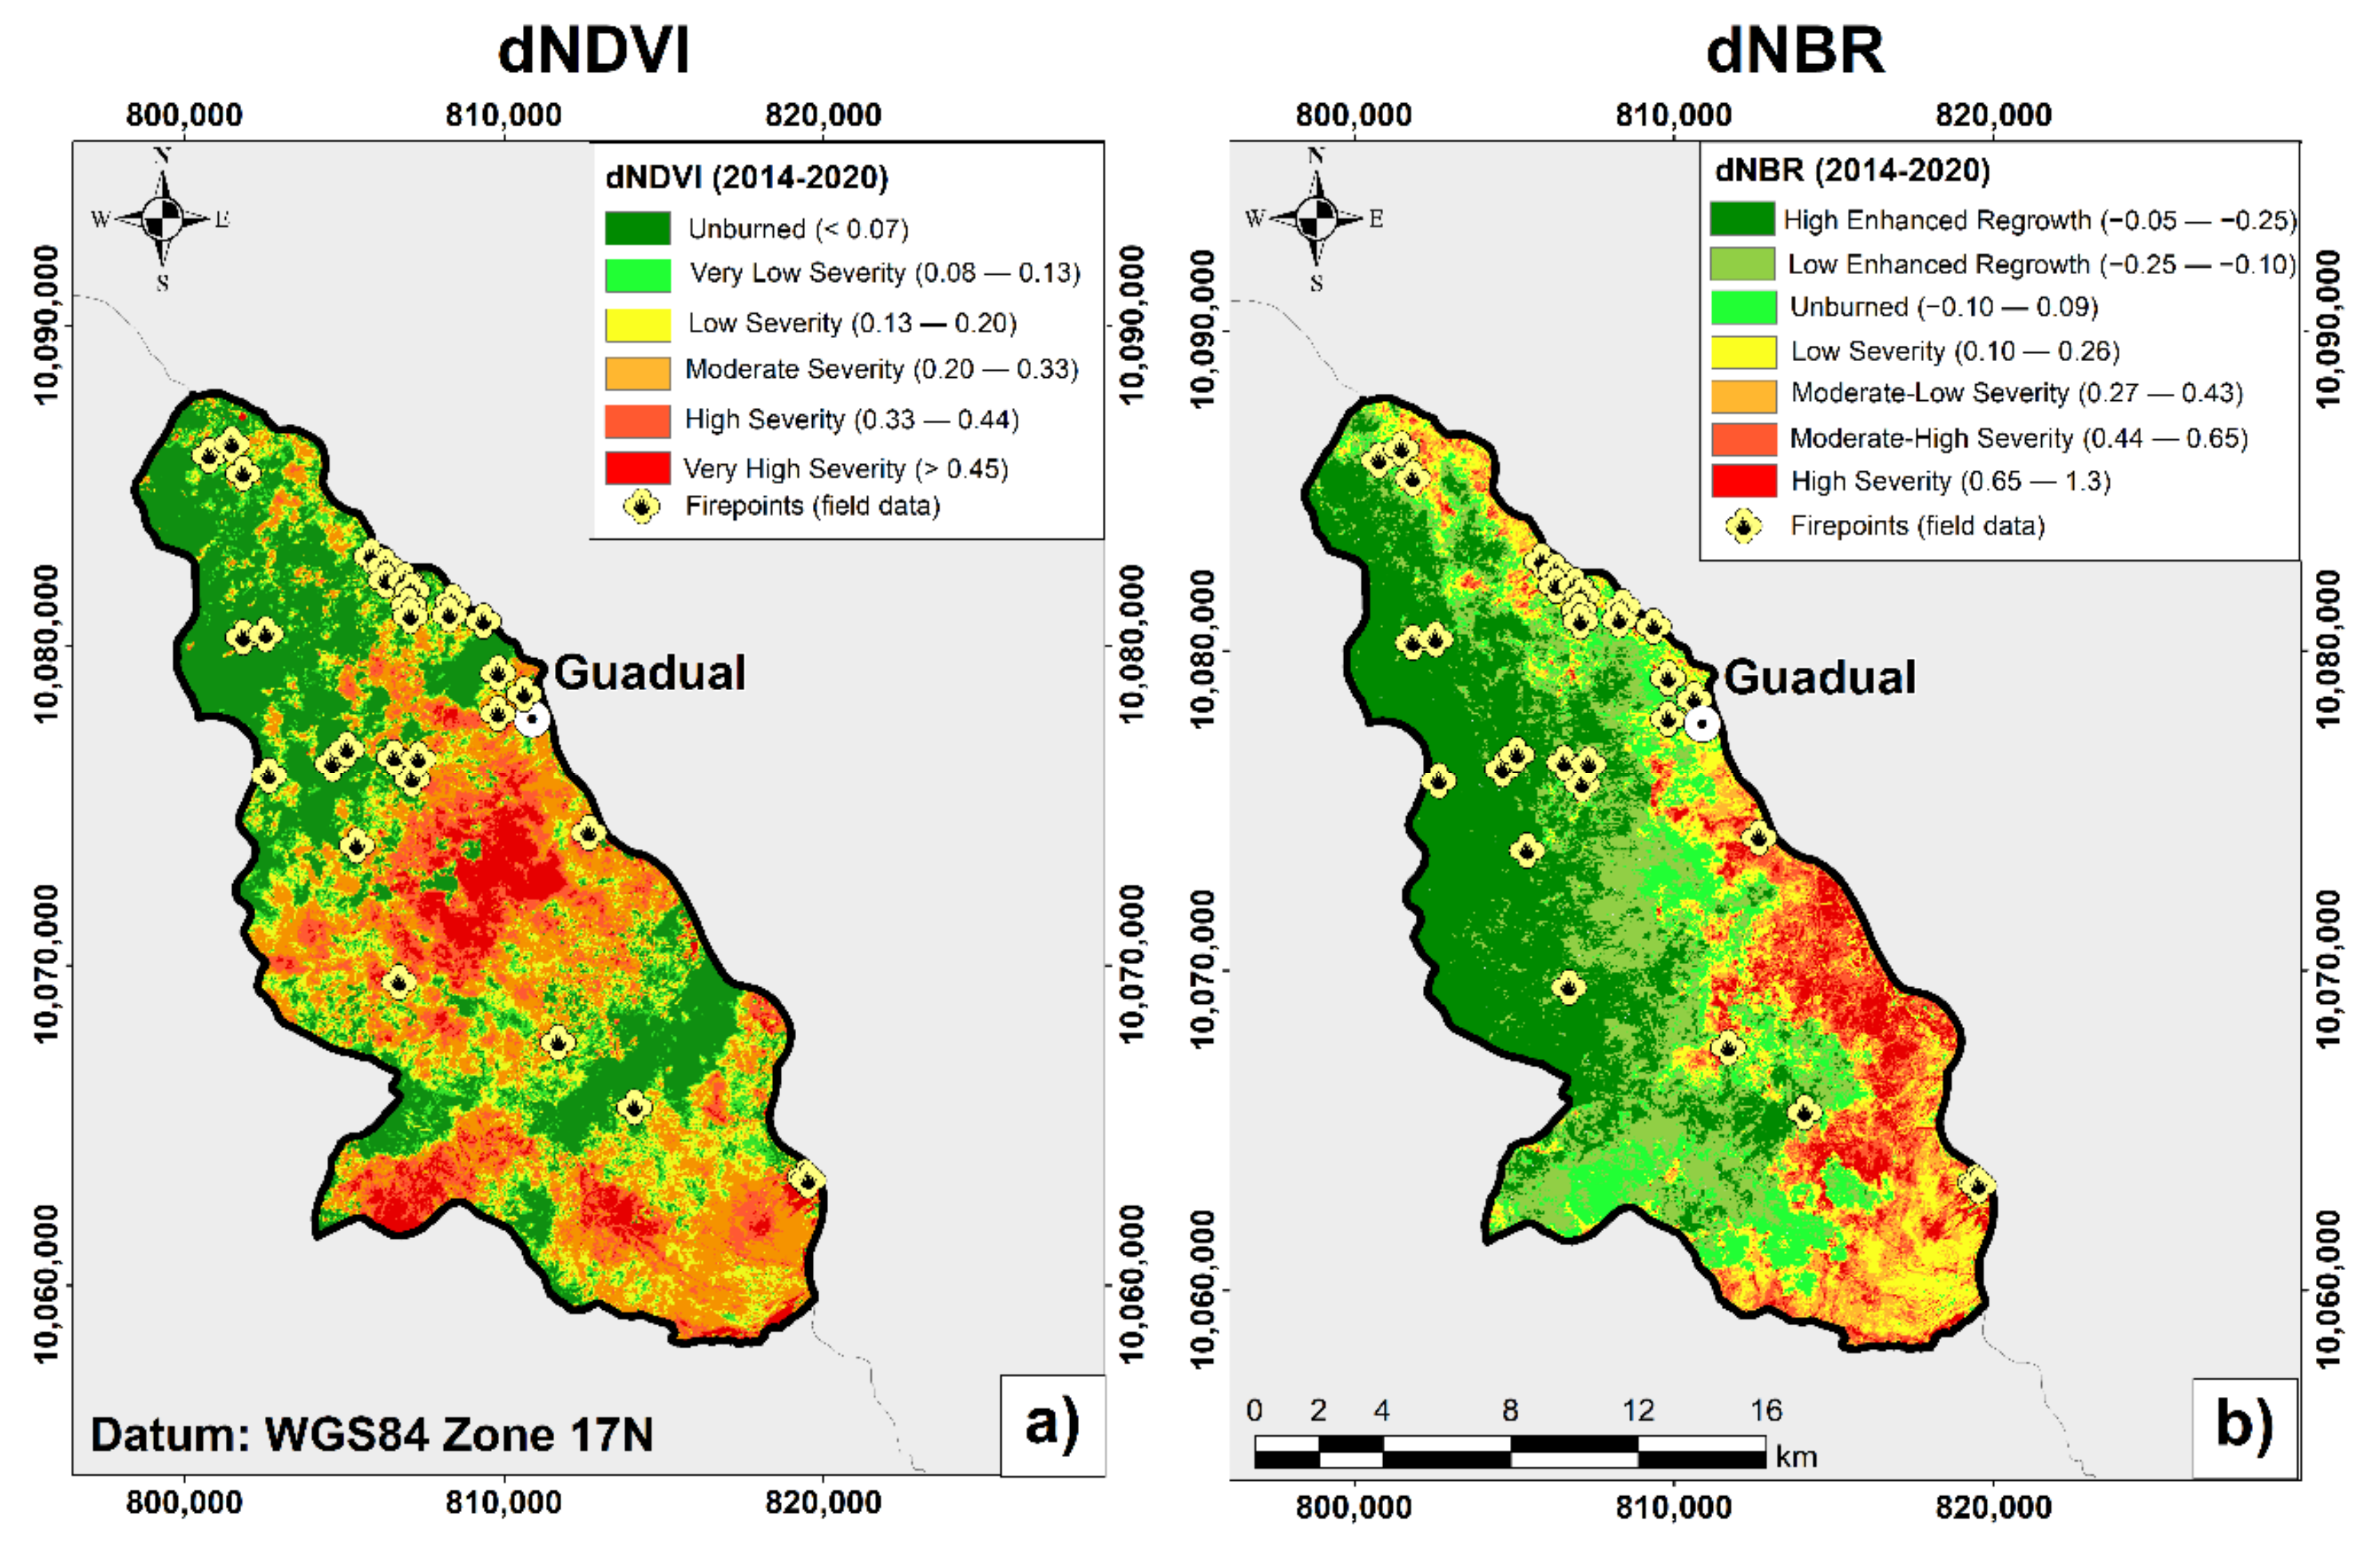
4.3. Fire Severity Grade with dNDVI and dNBR

The dNDVI and dNBR spectral indices were calculated. These indices are based on the differences between the pre-fire and post-fire scenarios. The dNBR was used to qualify the severity of the fire analyzed. This exact procedure was performed to calculate the dNDVI. The dNDVI index is classified into six categories [113], as shown in Figure 10a. In contrast, the dNBR index is classified into seven categories according to United States Geological Survey (USGS) classification [91,114], ranging between 0.07 and 1.3, as shown in Figure 10b.

Fire Severity Model Validation

The results of the fire severity models (dNDVI and dNBR) were verified with 31 fire-starting points taken in the field from June to September 2015 in a previous study in the region [105], as shown in Table 5.
The fire severity model’s accuracy was determined by performing calculations according to the equivalence of the categories for dNDVI and dNBR, as shown in Table 5, and according to the percentages of accuracy obtained with the field data concerning the two models with remote sensing data (dNDVI and dNBR), as shown Table 6.

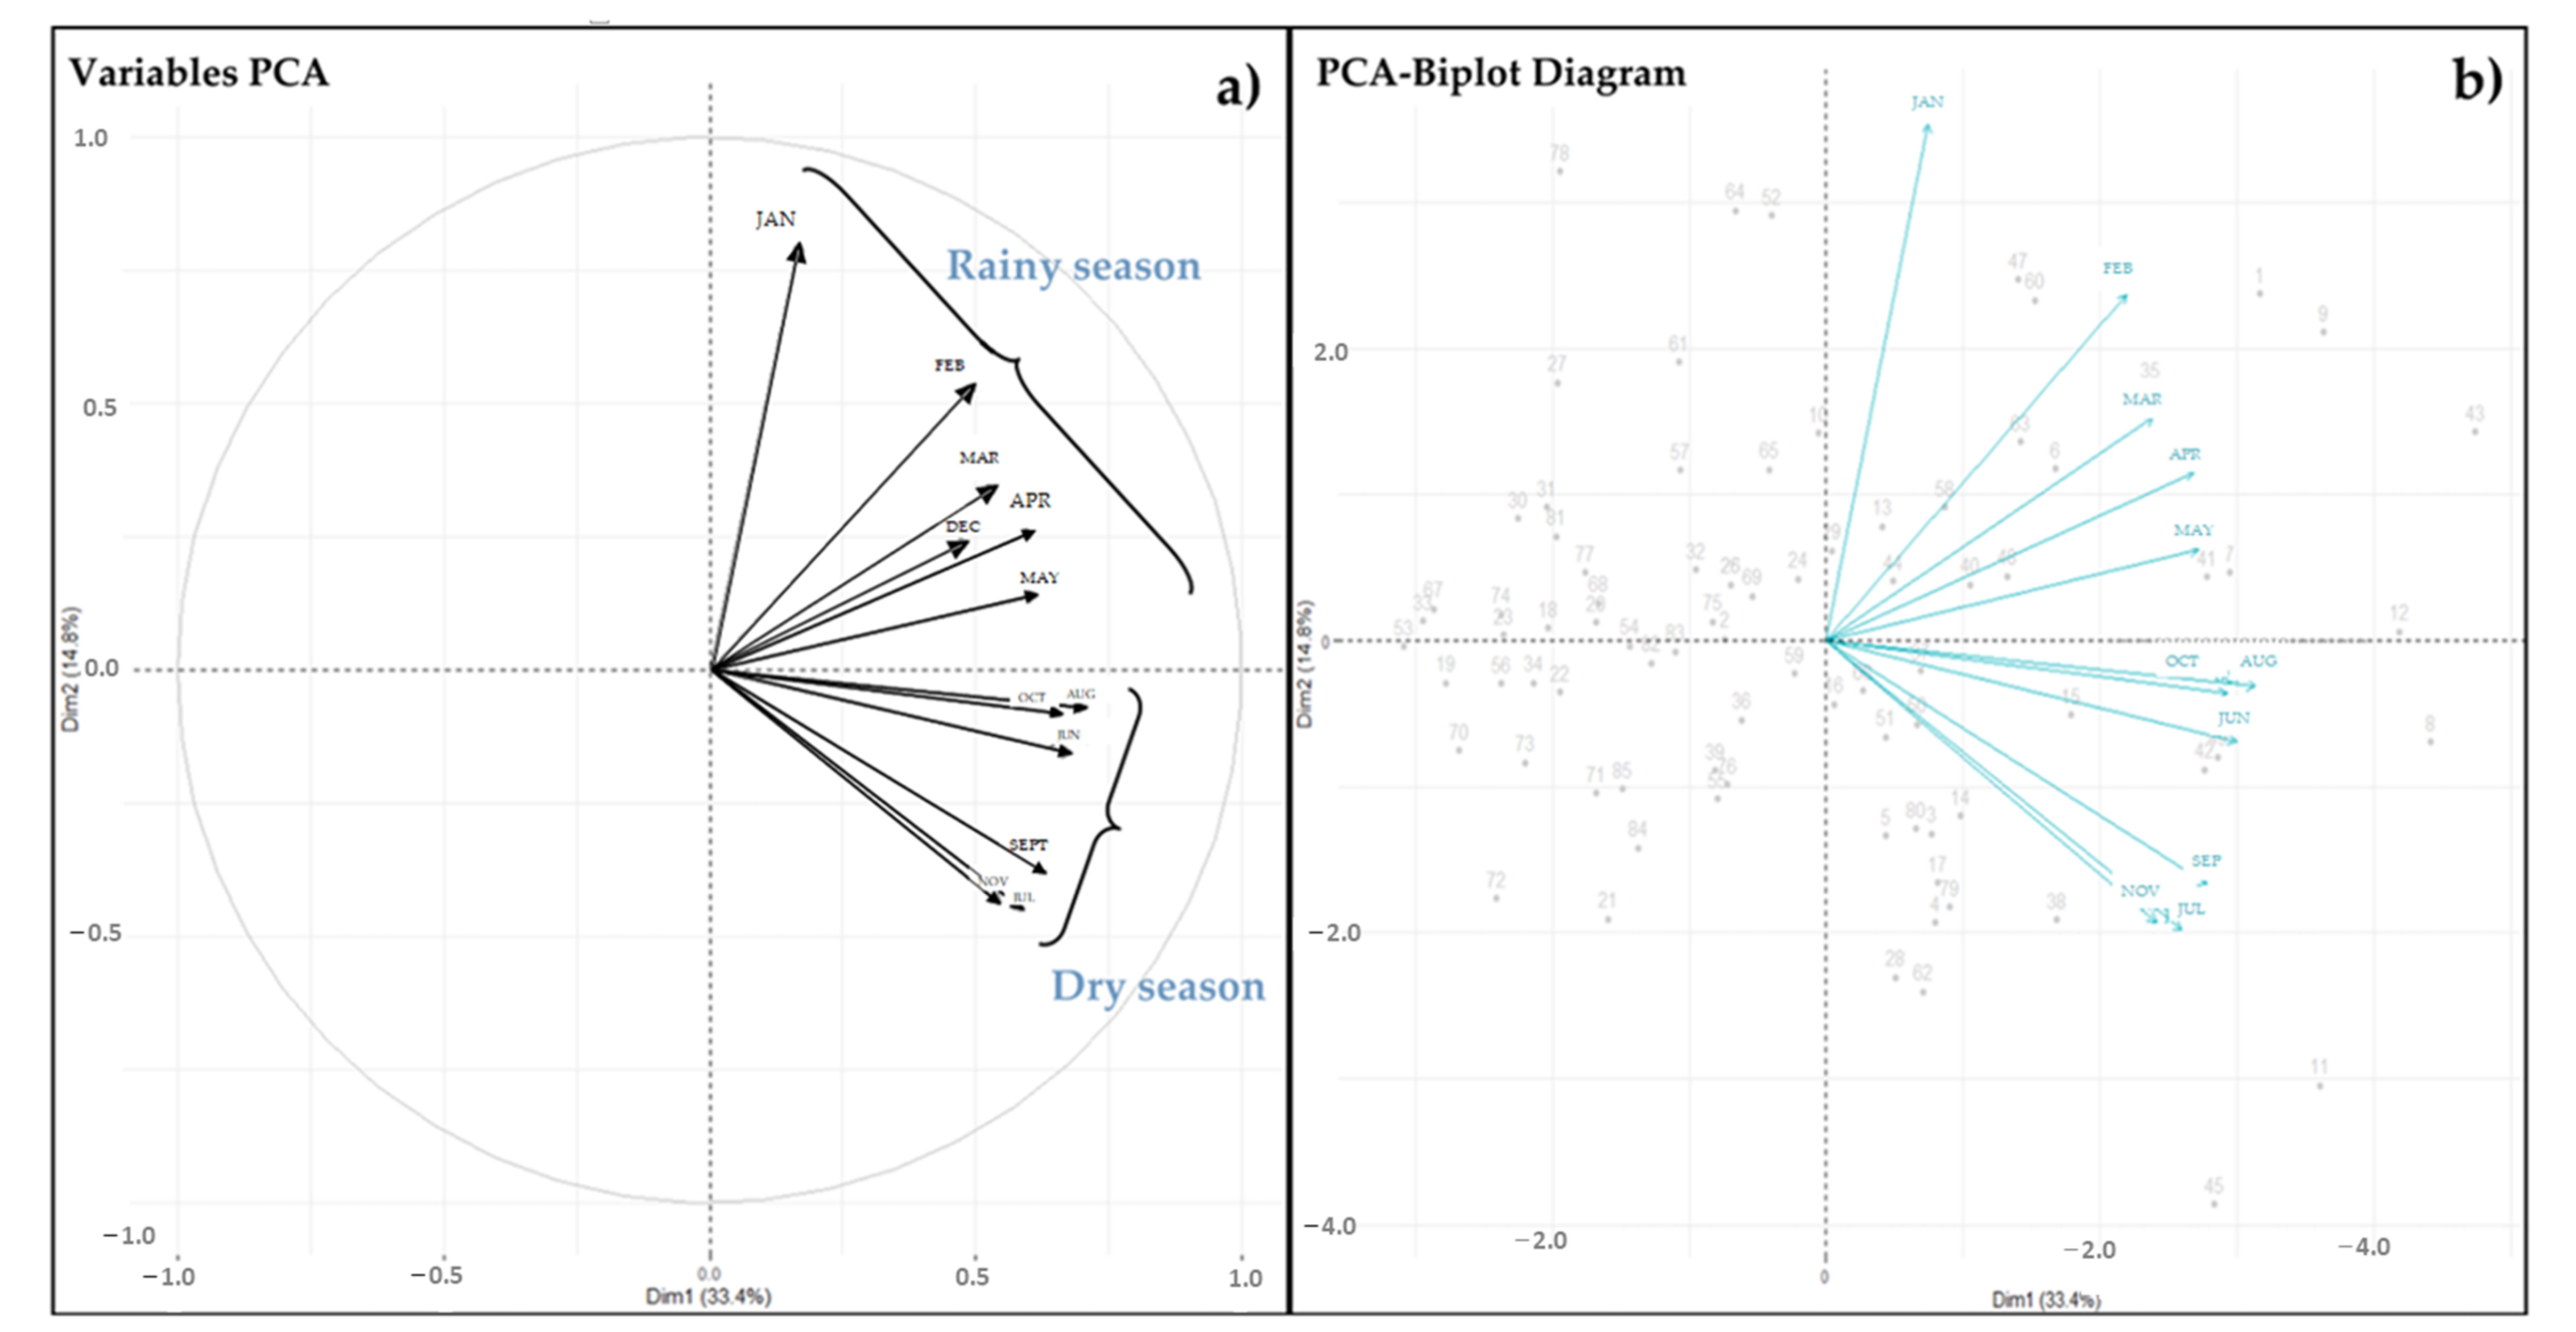
4.4. Multivariate Analysis

The factors that control precipitation’s spatial and temporal structure cannot always be discerned solely as qualitative data [115]. Therefore, multivariate statistical methods such as principal component analysis (PCA) are applied to examine each component of variation within the variance structure. PCA is a reliable method for reducing and examining the structure of variance in data [116]. Figure S1 (see Supplementary Materials) shows the correlation matrix between the variables analyzed (months of the year and the monthly precipitation data). The data did not follow a normal distribution and therefore to there was no correlation greater than 0.7 between the four meteorological stations’ data, which can thus be treated independently. Therefore, the precipitation and maximum temperature were analyzed using data from the meteorological station named Carchi (M0301) because it was located in La Carolina parish. As a result, precipitation reached 143 mm in the rainy season (October–April). In the dry season months (June–September), it presented values close to 0 mm, as observed in Figure 11. Similar behavior in rainfall can be observed with the satellite data obtained from CHIRPS (see Figure S2). These data are reliable and have been validated in several previous studies [117,118,119].
Finally, in Figure 12, the variation in the maximum monthly temperatures in 2000–2016 was analyzed. We observed that up to 2003 the maximum temperature was 22.65 °C, whereas, in 2014, it reached 23.74 °C due to the effects of climate change and the forest fire that occurred that year. Temperature data were obtained from the European Center for Medium-Range Weather Forecasts (ECMWF) ERA5 from the Copernicus Climate Change Service [109,120].
The principal component analysis applied in the Carolina Parish included as variables the precipitations and months. PCA application is fundamental because it describes the local climatological behavior since the area has different microclimates, which is related to forest fire incidence. As a result, the diagram of PCA variables showed a bimodal behavior, which correlated with the region’s two seasonal periods. In other words, the months with the highest precipitation (first quadrant) represent the rainy season and the months with low precipitation (fourth quadrant) represent the dry season (see Figure 13a). This is demonstrated with the inverse relation between January and November, which is perpendicular between them, showing that these months belong to two periods with different meteorological characteristics. This technique involves analyzing a data table in which several interrelated quantitative dependent variables describe observations [121]. These variables represent principal components, showing the similarities of observations (monthly precipitation data) and variables as points on maps, as shown in Figure 13b.

4.5. Forest Fire Action Plan Proposal

The Forestry and Conservation of Natural Areas and Wildlife Law, in articles 57 to 60, ensures the prevention and control of forest fires that may affect forests and natural vegetation and recommends educational campaigns on the subject [122]. According to data reported by the Secretariat for Risk Management (SGR, acronym in Spanish) during 2014–2015, 41 fires were recorded in the La Carolina parish. In 2014 there were 11 fires, with the Guadual community exhibiting the highest rate of occurrence, and in 2015, there were 30 fires [105].

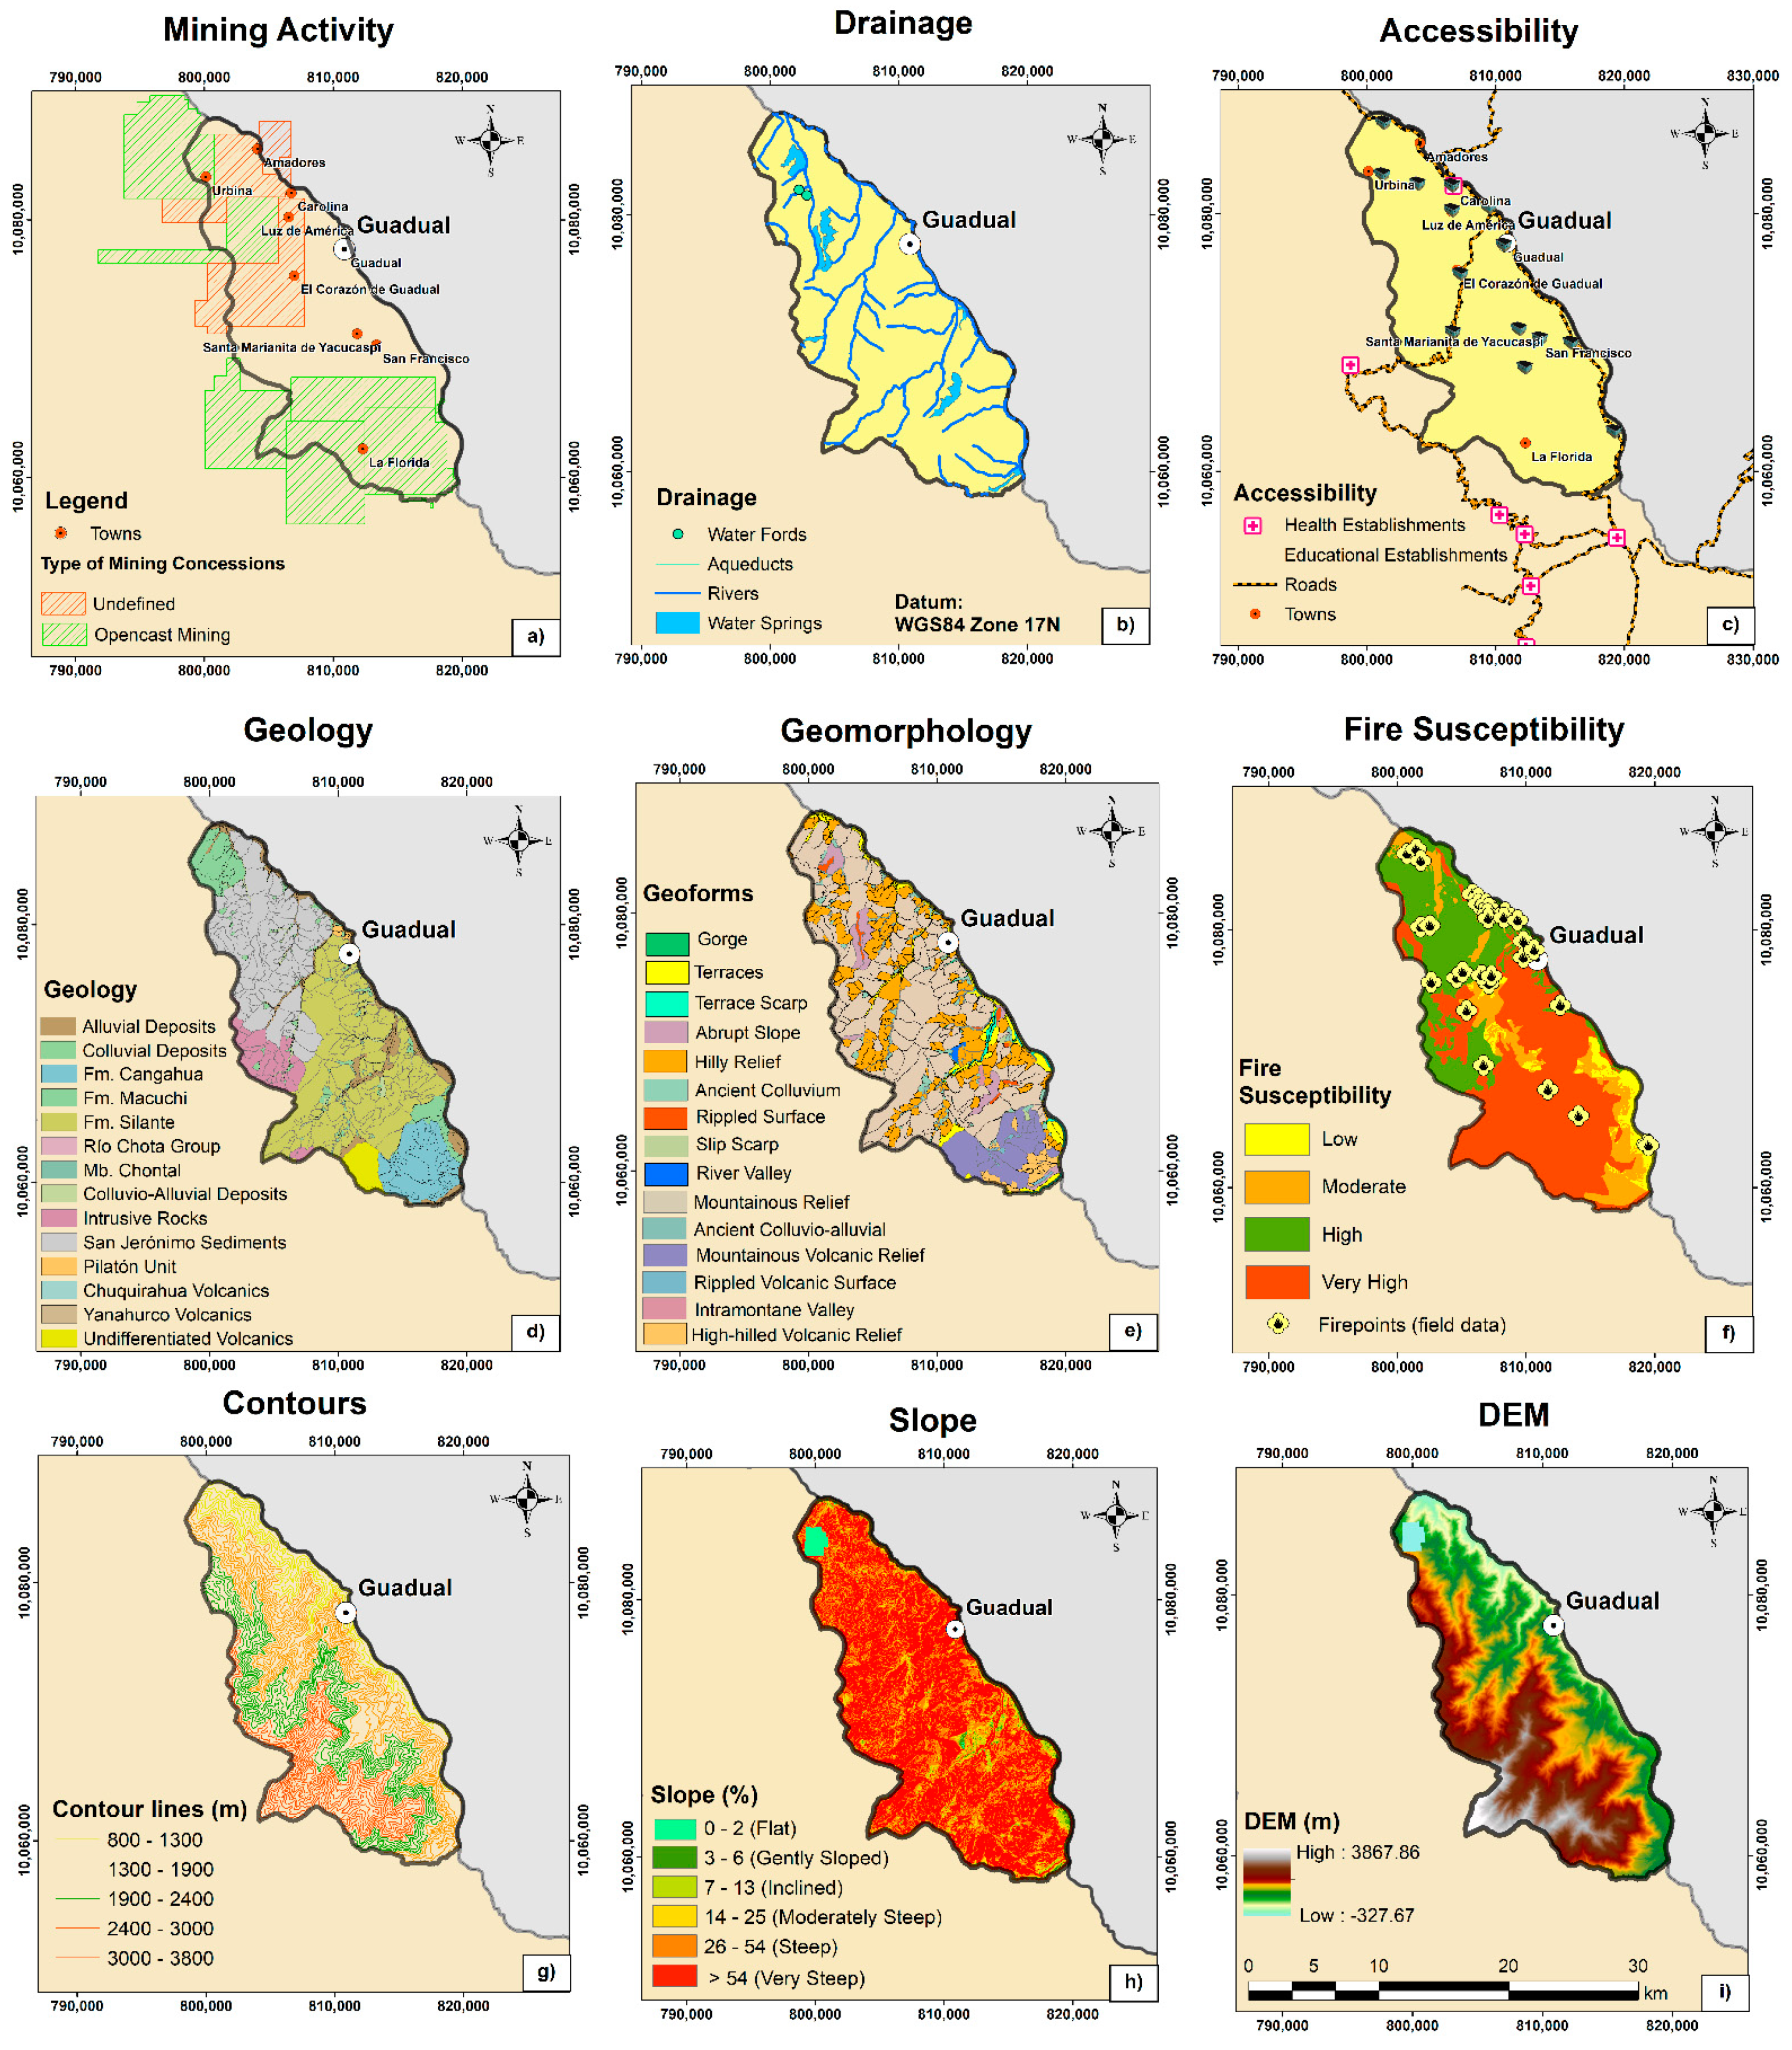
4.5.1. Mining Activity Map

Artisanal and illegal mining activity is recorded in the region. There are 23 mining concessions in the vicinity of the region, of which nine are located in the La Carolina parish (see Figure 14a).

4.5.2. Drainage Map

The drainages of the region correspond to currents ranging from the dendritic to the subdendritic type in high mountain areas, as shown in Figure 14b [76].

4.5.3. Accessibility Map (Health, Educational Establishments and Roads)

There are six health establishments in the region, one in the La Carolina parish and the rest in its surroundings (~10 km). Furthermore, there are 14 educational establishments. The main and secondary access roads were also added in order to analyze the possible evacuation routes in fires events, as shown in Figure 14c.

4.5.4. Geological Formation Map

The geology of the region mainly comprises volcanic formations, intrusive rocks, alluvial deposits and colluvial deposits, as shown in Figure 14d [123].

4.5.5. Geomorphological Map

The geomorphology of the region is an important indicator in relation to the occurrence of fires since it can allow the identification of the areas most likely to spread the fire due to their morphology. The most representative geoforms are mountainous reliefs (50.87%), hilly reliefs (21.64%), mountainous volcanic reliefs (8.71%) and terraces (5.58%), as shown in Figure 14e.

4.5.6. Fire Susceptibility Map

In 2015, the Risk Management Secretariat (SGR, acronym in Spanish) generated a fire susceptibility map, which included four categories: low (5.17%), medium (13.16%), moderate (30.01%) and high (51.66%), as shown in Figure 14f.

4.5.7. Contour Map

According to the contour information from the Military Geographic Institute with a resolution of 100 m, it was observed that the area has elevations in the range between 800 and 3800 m [75], as shown in Figure 14g.

4.5.8. Slope Map

Slopes are directly involved in increasing the speed of the spread of forest fires. There is an influence of the slope on the vegetation; with steep slopes, there is less water availability and more risk of runoff and erosion, so the vegetation will tend to be more xerophilous and frugal (adapted to dry environments) [106]. As a result, 37.53% are moderately steep slopes and 29.69% steep slopes, as shown in Figure 14h.

4.5.9. Altitude Map

According to the digital elevation model (DEM), the La Carolina parish has an altitude between 800 m.a.s.l. and 3800 m.a.s.l. This altitude factor reduces the risk of a fire occurring, since the higher the altitude, the lower the temperature; all this is due to the thermal gradient that causes the temperature to decrease by 1 °C with every 180 m of altitude [124]. Altitude also determines the type of vegetation in the area since the higher the altitude, the lower the elevation of the vegetation, causing higher levels of humidity to be present in it [106], as shown in Figure 14i.
As a result of the interpretation of these nine parameters explained above, a map was generated with three proposed evacuation routes for forest fires in the region, considering the safe areas and the starting points of the fire. We also determined eight strategic refuge sites, considering the slopes and their direction (preferably south–southwest), the presence of mining activity, drainage and altitude (see Figure 15).
Principal Impacts:
  • Most of the territory that includes the La Carolina parish has slopes greater than 25°.
  • There is no signage to help prevent fires in the region.
  • Cattle ranchers burn brush and bushes to produce grass for cattle, burning the same grass to make better grass, which leads to forest fires.
  • During 2014–2015, 41 fires were recorded in the La Carolina parish.
Suggested Fire Actions:
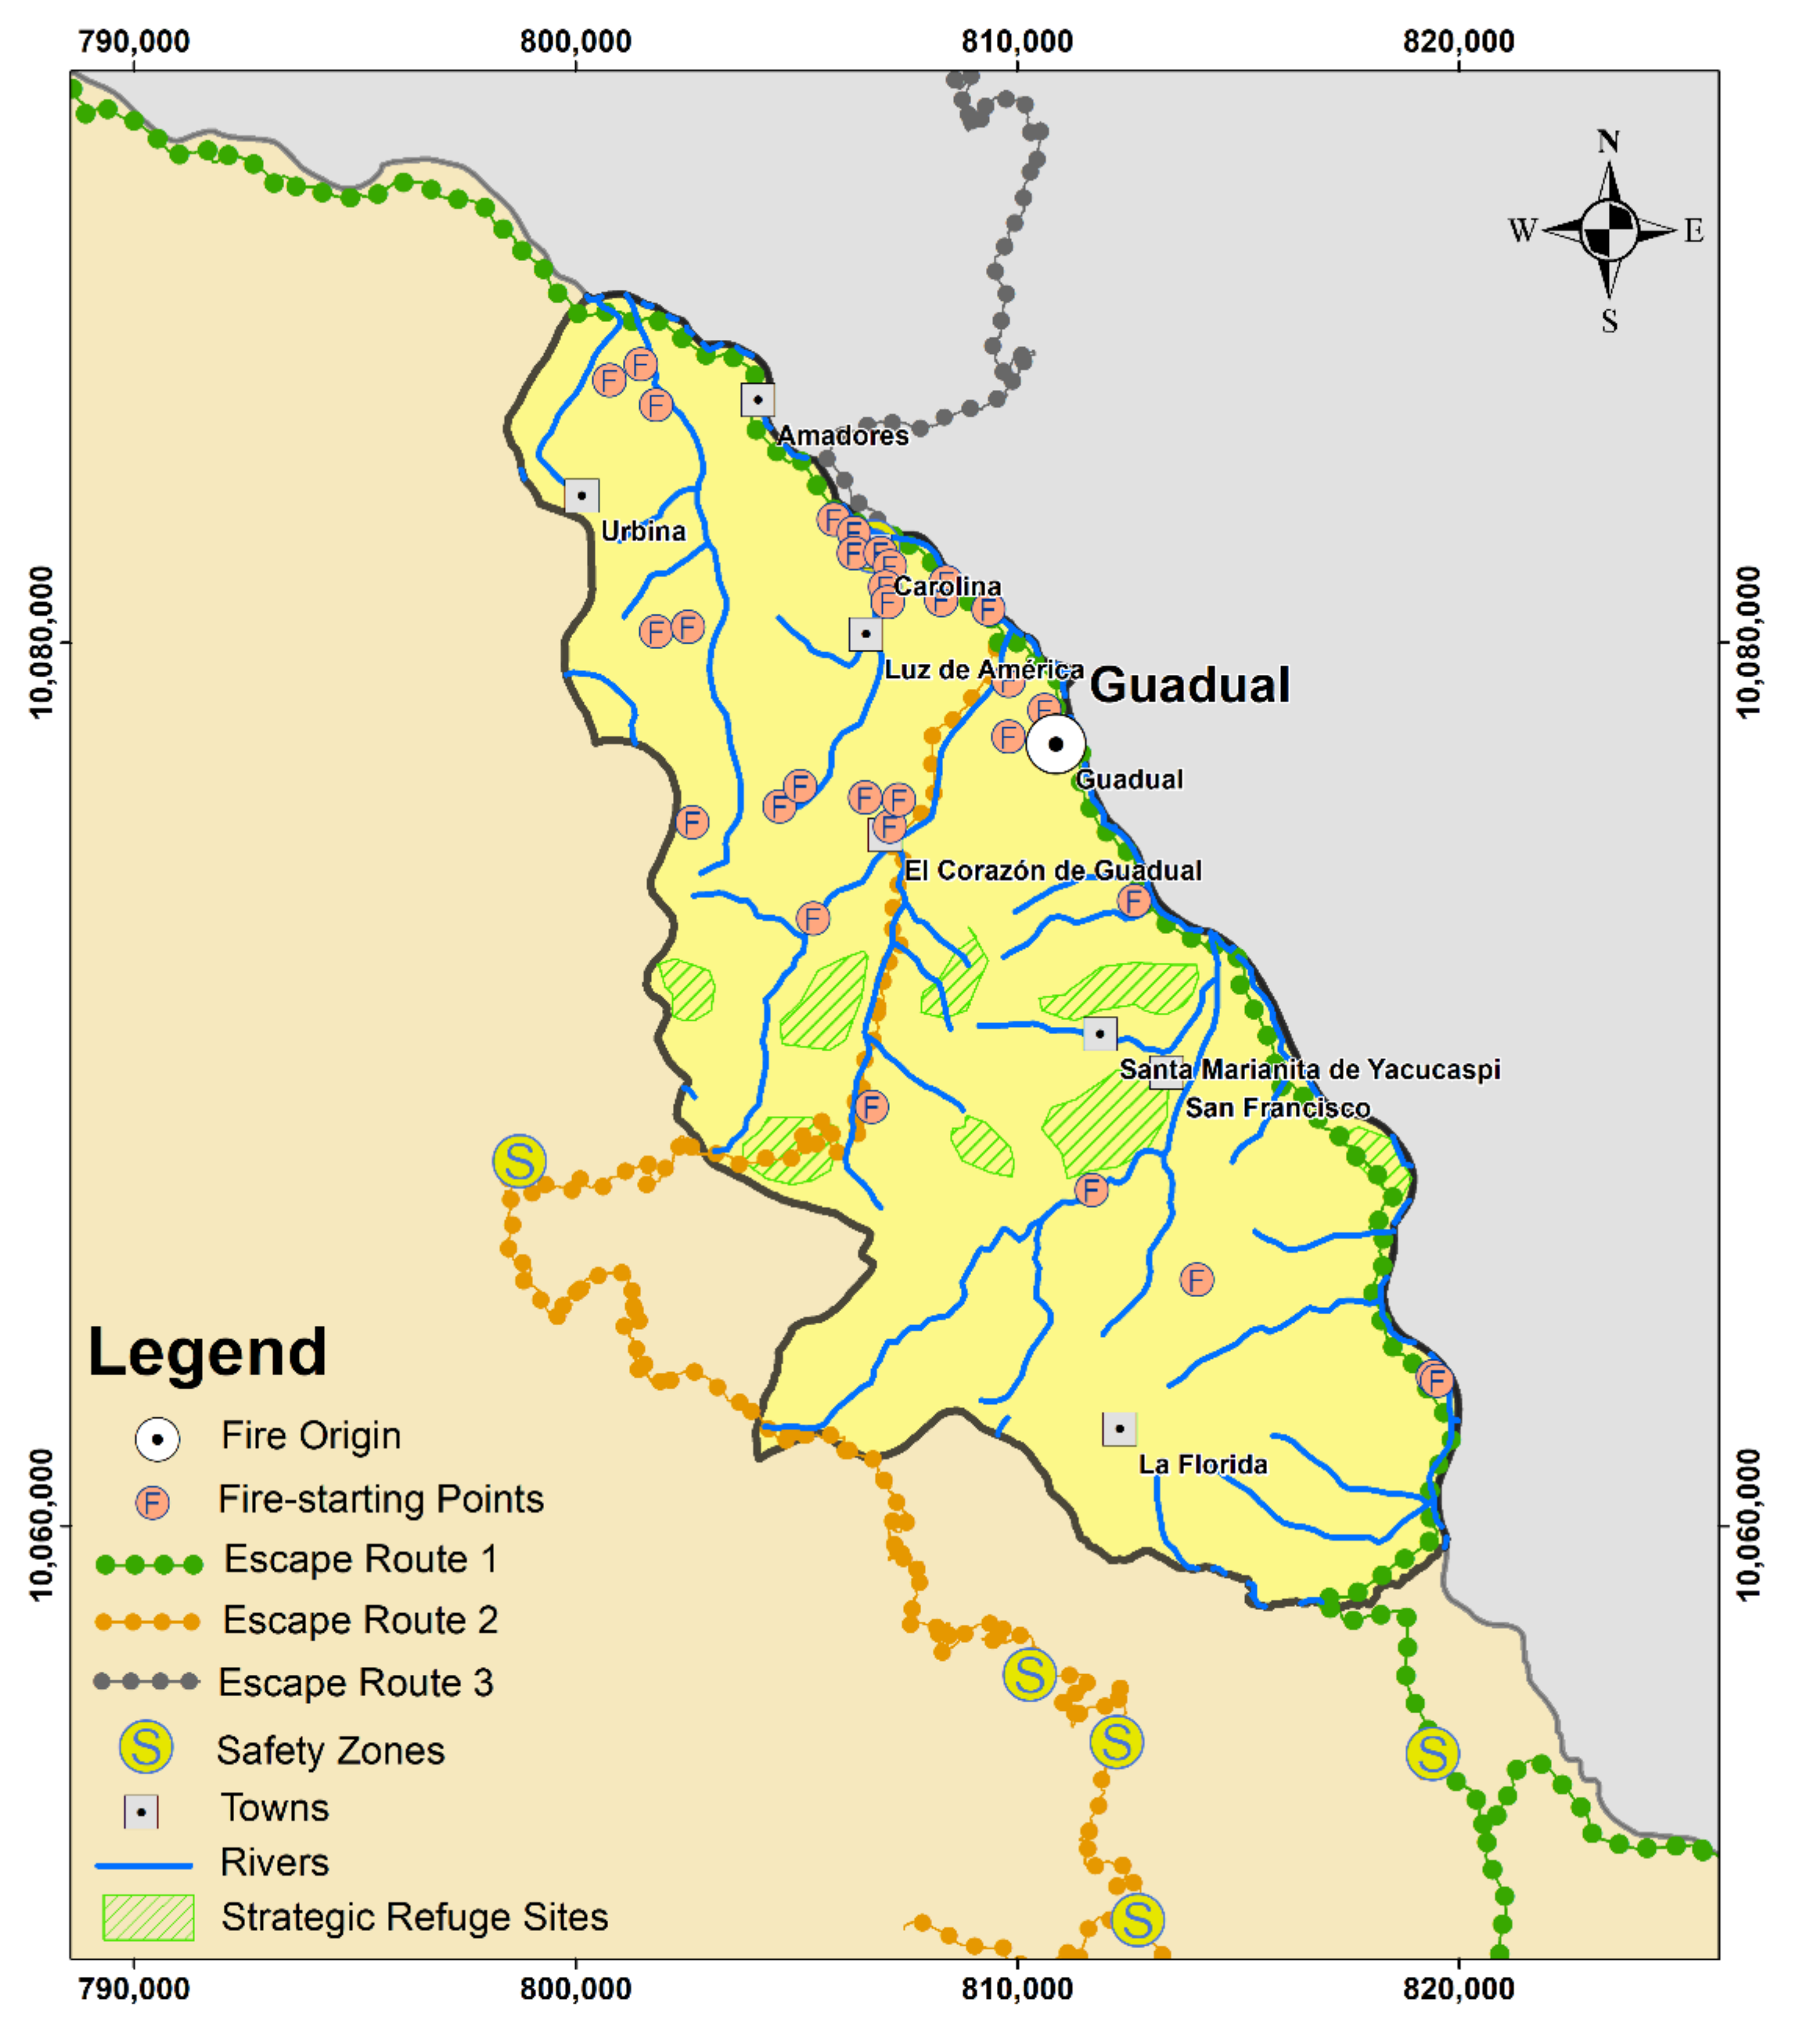
  • Eight strategic safe refuge areas were designated in case of fires that meet the conditions of not having very steep slopes, being safe (no mining activity nearby), and favored by the direction of the slopes and proximity to water bodies.
  • Install signage such as signs with messages related to the prevention of forest fires.
  • Make the surrounding people and the cattle ranchers aware of the damage they cause by not having a burning plan.
  • Three evacuation routes have been proposed in preparation for future fires, along with safe zones and fire severity models using satellite data (Landsat-8).

5. Interpretation of Results and Discussion

In this region, 99% of forest fires are caused by human influence and these fires cause irreparable damage to nature. Up to 2015, 841 fires were registered in the Imbabura province, which consumed 3271.38 ha, with the Ibarra canton registering the highest number of events (58) [126]. Winds and strong temperatures fuel fires. However, many of these events were caused by agricultural burning [127]. Finally, both artisanal and illegal mining activity constitute unexplored factors that could also cause forest fires in the region. Therefore, La Carolina parish is an area that suffers from multiple forest fires, mainly attributed to the reasons stated above. Additionally, its vegetation cover is mostly made up of native tropical forests, moors and grasslands. This type of coverage could also facilitate the spread of fires and could make their recovery difficult, as demonstrated in the NDVI results, which showed a decrease in this index in recent years (post-fire). Therefore, the type of analysis of spectral indices carried out in this study is essential for assessments of forest fire severity, in regard to the fire which occurred in September 2014.
Likewise, the implementation of multivariate techniques allows us to study the relationship between water availability and its incidence in fires in the region. For example, in a study in the Qilian Mountains in China, NDVI responses to temperature and precipitation were the strongest over a long time series [128]. Consequently, extreme climatic and drought events have a more significant effect at the end or beginning of the season, depending on the vegetation type [129].
The resulting NDVI values show a greater coverage of healthy vegetation or greater photosynthetic activity in the pre-fire scenario (2014), with 7728.69 ha due to many tropical forests in the region. However, in the post-fire scenario of 2015, its value was reduced to 2348.40 ha, and by 2020, it increased to 7206.87 ha. This indicates that the vegetation recovered 93.24% compared to the pre-fire scenario. In the case study presented, there was evidence of a decrease in the NDVI values in recent years after the fire, with values exceeding 0.25, indicating vegetation with little photosynthetic activity. Other factors influencing the decrease in NDVI in La Carolina parish are artisanal and illegal mining, contributing to the region’s exploitation and land-use changes.
With the analysis of the degree of severity of fire using multispectral indices, NBR pre-fire and NBR post-fire values were obtained, ranging from 0.27, related to burned areas of low severity, and higher than 0.66, indicating areas of high severity. The burned areas increased for the years 2015 and 2020, in post-fire scenarios. Furthermore, it is essential to mention that NBR values lower than −0.25 indicate high vegetation growth after a fire. In this sense, by 2020, 16,520.37 ha of recovered vegetation were obtained.
The dependence between extreme precipitation and temperature allows researchers to develop an understanding of climatic relationships and to evaluate future changes in precipitation [130,131]. For this reason, the principal component analysis (PCA) technique was applied to correlate rainfall data from four meteorological stations in the region. As a result, a bimodal behavior was observed, corresponding to the climatology of the area (dry season and rainy season), which is related to the presence of fires (in the dry season). Monthly rainfall decreased markedly after the September 2014 fire, and temperatures increased locally.
A proposal for an action plan in response to forest fires in the region was carried out, making it possible to define a safe evacuation route, minimizing exposure to dangerous fire effluents, such as toxic smoke, during evacuation [132]. The long-term approach in regard to this plan would be the responsibility of the emergency management authorities [133].

6. Conclusions

The forest fire on the Guadual community hill caused a significant deterioration in the vegetation, with considerable losses of flora and fauna, in a large area of territory. To determine the severity of this event, climatological and remote sensing data were used to evaluate the severity of the studied fire. Spectral indices (NDVI, NBR, dNDVI and dNBR) were applied, and precipitation data and maximum temperatures were correlated to determine areas of high severity of fires. Field mapping is crucial in diagnosing fire incidents. However, its immediate assessment is limited by its accessibility due to mining activity, mainly when the affected area has a complex topography, steep slopes and heterogeneous vegetation, usually in high mountain areas. Therefore, the management of satellite images poses a rapid response to these events. Furthermore, this methodology provided a decision-making tool for local authorities in forest fire events in high mountain areas. The NDVI provided information on the density and type of vegetation present. The NBR, for its part, integrated two spectral bands that contributed to the calculation of the area burned in the fire. The dNDVI and dNBR indices made it possible to quantify the degree of fire severity by comparing two pre-and post-fire scenarios. Consequently, the rainfall importance, temperature, and the fire’s characteristics caused by anthropic action and bad agricultural practices in the region were verified.
The fire severity analysis, studied through the spectral indices, showed that the application of remote sensing techniques fulfilled their function. The NDVI allowed for the evaluation of the level of photosynthetic activity of the vegetation in three scenarios: pre-fire (2014), post-fire (2015) and post-fire (2020). NDVI values lower than 0.1 corresponded to areas with cloudiness due to the presence of the moors. In 2014, it was determined that 25.1% of the territory of the La Carolina parish presented very high photosynthetic activity; in 2015, it decreased to 7.6%; and in 2020, it increased to 23.4%, demonstrating a significant recovery in the shrub vegetation of the area. These results could provide valuable information to farmers in crop monitoring to show which parts of their fields have dense, moderate or sparse vegetation at any given time.
The NBR index made it possible to quantify the areas burned in the fire. The areas burned with moderate/high severity in 2014 (pre-fire) represented 4.2% of the total territory of the La Carolina parish. For 2015 (post-fire), they reached 5.1%, and for 2020 (post-fire) they increased to 13.3%, showing that the area is prone to forest fires, and the spread of fire is also favored by the fact that it is an area of high mountain moorland and the presence of forests. Likewise, with the dNBR, areas of medium-to-high severity were identified in the La Carolina parish. A medium severity was observed in its surroundings and the regions furthest from the fire were designated as not burned. The dNDVI analysis also showed a moderate-to-high severity in La Carolina parish, which coincided with the dNBR result. The fire severity models generated using remote sensing data (Landsat-8) showed excellent accuracy (99.1%) in regard to the in situ data (31 field fire-starting points) vs. the models generated with the spectral indices in the areas of high severity (dNBR) and very high severity (dNDVI).
With the application of principal component analysis, bimodal behavior was observed in the rainfall regime of the region, with zones that coincided with the two environmental seasons (the rainy season and dry season) of the region. The rainfall regime observed at the Carchi meteorological station (M0301) allowed the analysis of rainfall values in the months prior to the fire. From June to September 2014, rainfall did not exceed 30 mm, whereas the months of October-December showed increased rainfall, as a consequence of the recovery of vegetation on the ground. The proposed action plan for forest fires in La Carolina parish made it possible to define a safe and effective evacuation route to reduce the numbers of victims during future events.
The main limitation of this study was the availability of cloud-free satellite images due to its location in an Andean páramo area. However, the combination of spectral indices and the multivariate PCA technique allows this methodology to be replicated in other areas with similar climatological characteristics, providing fire mitigation strategies and helping local authorities to make decisions.

Supplementary Materials

The following are available online at https://0-www-mdpi-com.brum.beds.ac.uk/article/10.3390/rs14081783/s1. Figure S1: Correlation matrix in monthly rainfall data in the study area. Figure S2: Hydrograph of CHIRPS Precipitation Data in 2000–2016.

Author Contributions

Conceptualization, F.M.-C., L.B.-M., P.C.-M. and A.V.-M.; methodology, F.M.-C., L.B.-M., P.C.-M. and A.V.-M.; software, L.B.-M.; validation, F.M.-C. and A.V.-M. formal analysis, F.M.-C., P.C.-M., A.V.-M. and E.B.; investigation, F.M.-C., L.B.-M., P.C.-M. and A.V.-M.; data curation, L.B.-M. and A.V.-M.; writing—original draft preparation, F.M.-C. and L.B.-M.; writing—review and editing, F.M.-C., L.B.-M., P.C.-M., A.V.-M. and E.B.; supervision, F.M.-C., P.C.-M., A.V.-M. and E.B. All authors have read and agreed to the published version of the manuscript.

Funding

The APC was funded by ESPOL Polytechnic University.

Data Availability Statement

Not applicable.

Acknowledgments

The financial support of this article is in charge of Registro del Patrimonio Geológico y Minero y su incidencia en la defensa y preservación de la geodiversidad en Ecuador (Registry of Geological and Mining Heritage and its impact on the defense and preservation of geodiversity in Ecuador), with code No. CIPAT-01-2018. We would also like to thank the editorial office for the editorial handling and three anonymous reviewers for their constructive comments and corrections.

Conflicts of Interest

The authors declare no conflict of interest.

References

  1. Lindner, M.; Maroschek, M.; Netherer, S.; Kremer, A.; Barbati, A.; Garcia-Gonzalo, J.; Seidl, R.; Delzon, S.; Corona, P.; Kolström, M.; et al. Climate change impacts, adaptive capacity, and vulnerability of European forest ecosystems. For. Ecol. Manage. 2010, 259, 698–709. [Google Scholar] [CrossRef]
  2. Hansen, J.; Sato, M.; Ruedy, R.; Lo, K.; Lea, D.W.; Medina-Elizade, M. Global temperature change. Proc. Natl. Acad. Sci. 2006, 103, 14288–14293. [Google Scholar] [CrossRef] [PubMed] [Green Version]
  3. Alexander, L.V.; Zhang, X.; Peterson, T.C.; Caesar, J.; Gleason, B.; Klein Tank, A.M.G.; Haylock, M.; Collins, D.; Trewin, B.; Rahimzadeh, F.; et al. Global observed changes in daily climate extremes of temperature and precipitation. J. Geophys. Res. 2006, 111, D05109. [Google Scholar] [CrossRef] [Green Version]
  4. Dosio, A. Projections of climate change indices of temperature and precipitation from an ensemble of bias-adjusted high-resolution EURO-CORDEX regional climate models. J. Geophys. Res. Atmos. 2016, 121, 5488–5511. [Google Scholar] [CrossRef]
  5. Dash, S.; Maity, R. Temporal evolution of precipitation-based climate change indices across India: Contrast between pre- and post-1975 features. Theor. Appl. Climatol. 2019, 138, 1667–1678. [Google Scholar] [CrossRef]
  6. Pearson, R.G.; Dawson, T.P. Predicting the impacts of climate change on the distribution of species: Are bioclimate envelope models useful? Glob. Ecol. Biogeogr. 2003, 12, 361–371. [Google Scholar] [CrossRef] [Green Version]
  7. Araujo, M.B.; Rahbek, C. How Does Climate Change Affect Biodiversity? Science 2006, 313, 1396–1397. [Google Scholar] [CrossRef]
  8. Fowler, H.J.; Blenkinsop, S.; Tebaldi, C. Linking climate change modelling to impacts studies: Recent advances in downscaling techniques for hydrological modelling. Int. J. Climatol. 2007, 27, 1547–1578. [Google Scholar] [CrossRef]
  9. Grotch, S.L.; MacCracken, M.C. The Use of General Circulation Models to Predict Regional Climatic Change. J. Clim. 1991, 4, 286–303. [Google Scholar] [CrossRef] [Green Version]
  10. Liang, X.; Lettenmaier, D.P.; Wood, E.F.; Burges, S.J. A simple hydrologically based model of land surface water and energy fluxes for general circulation models. J. Geophys. Res. 1994, 99, 14415. [Google Scholar] [CrossRef]
  11. Yira, Y.; Diekkrüger, B.; Steup, G.; Bossa, A.Y. Impact of climate change on hydrological conditions in a tropical West African catchment using an ensemble of climate simulations. Hydrol. Earth Syst. Sci. 2017, 21, 2143–2161. [Google Scholar] [CrossRef] [Green Version]
  12. Miranda, A.I.; Borrego, C.; Martins, H.; Martins, V.; Amorim, J.H.; Valente, J.; Carvalho, A. Forest Fire Emissions and Air Pollution in Southern Europe. In Earth Observation of Wildland Fires in Mediterranean Ecosystems; Springer Berlin Heidelberg: Berlin, Heidelberg, 2009; pp. 171–187. [Google Scholar]
  13. Wiedinmyer, C.; Quayle, B.; Geron, C.; Belote, A.; McKenzie, D.; Zhang, X.; O’Neill, S.; Wynne, K.K. Estimating emissions from fires in North America for air quality modeling. Atmos. Environ. 2006, 40, 3419–3432. [Google Scholar] [CrossRef]
  14. Bowman, D.M.J.S.; Kolden, C.A.; Abatzoglou, J.T.; Johnston, F.H.; van der Werf, G.R.; Flannigan, M. Vegetation fires in the Anthropocene. Nat. Rev. Earth Environ. 2020, 1, 500–515. [Google Scholar] [CrossRef]
  15. van Konijnenburg-van Cittert, J.H.A.H. Fire on earth: An introduction by Andrew C. Scott, David M. S. J. Bowman, William J. Bond, Stephen J. Pyne & Martin E. Alexander. Wiley-Blackwell, Chichester, 2014. No. of pages: xix+413. Price: UK£39.95. ISBN 978-1-119-952356 (paperback). Geol. J. 2014, 49, 656–657. [Google Scholar] [CrossRef]
  16. Ward, D.S.; Kloster, S.; Mahowald, N.M.; Rogers, B.M.; Randerson, J.T.; Hess, P.G. The changing radiative forcing of fires: Global model estimates for past, present and future. Atmos. Chem. Phys. 2012, 12, 10857–10886. [Google Scholar] [CrossRef] [Green Version]
  17. Hollmann, R.; Merchant, C.J.; Saunders, R.; Downy, C.; Buchwitz, M.; Cazenave, A.; Chuvieco, E.; Defourny, P.; de Leeuw, G.; Forsberg, R.; et al. The ESA Climate Change Initiative: Satellite Data Records for Essential Climate Variables. Bull. Am. Meteorol. Soc. 2013, 94, 1541–1552. [Google Scholar] [CrossRef] [Green Version]
  18. GCOS. The Second Report on the Adequacy of the Global Observing Systems for Climate in Support of the UNFCC—Executive Summary. GCOS – 82; GCOS: Geneva, Switzerland, 2003. [Google Scholar]
  19. Cruz-López, M.I.; de Manzo-Delgado, L.; Aguirre-Gómez, R.; Chuvieco, E.; Equihua-Benítez, J.A. Spatial Distribution of Forest Fire Emissions: A Case Study in Three Mexican Ecoregions. Remote Sens. 2019, 11, 1185. [Google Scholar] [CrossRef] [Green Version]
  20. Bojinski, S.; Verstraete, M.; Peterson, T.C.; Richter, C.; Simmons, A.; Zemp, M. The Concept of Essential Climate Variables in Support of Climate Research, Applications, and Policy. Bull. Am. Meteorol. Soc. 2014, 95, 1431–1443. [Google Scholar] [CrossRef]
  21. Shin, J.; Seo, W.; Kim, T.; Park, J.; Woo, C. Using UAV Multispectral Images for Classification of Forest Burn Severity—A Case Study of the 2019 Gangneung Forest Fire. Forests 2019, 10, 1025. [Google Scholar] [CrossRef] [Green Version]
  22. Joshi, N.R.; Tewari, A.; Chand, D.B. Impact of Forest fire and aspect on phytosociology, tree biomass and carbon stock in Oak and Pine mixed Forests of Kumaun central Himalaya, India. Researcher 2013, 5, 1–8. [Google Scholar]
  23. Numata, I.; Cochrane, M.A.; Galvão, L.S. Analyzing the Impacts of Frequency and Severity of Forest Fire on the Recovery of Disturbed Forest using Landsat Time Series and EO-1 Hyperion in the Southern Brazilian Amazon. Earth Interact. 2011, 15, 1–17. [Google Scholar] [CrossRef] [Green Version]
  24. White, J.; Ryan, K.; Key, C.; Running, S. Remote Sensing of Forest Fire Severity and Vegetation Recovery. Int. J. Wildl. Fire 1996, 6, 125. [Google Scholar] [CrossRef] [Green Version]
  25. Lentile, L.B.; Holden, Z.A.; Smith, A.M.S.; Falkowski, M.J.; Hudak, A.T.; Morgan, P.; Lewis, S.A.; Gessler, P.E.; Benson, N.C. Remote sensing techniques to assess active fire characteristics and post-fire effects. Int. J. Wildl. Fire 2006, 15, 319. [Google Scholar] [CrossRef]
  26. Miller, J.D.; Yool, S.R. Mapping forest post-fire canopy consumption in several overstory types using multi-temporal Landsat TM and ETM data. Remote Sens. Environ. 2002, 82, 481–496. [Google Scholar] [CrossRef]
  27. Díaz-Delgado, R.; Lloret, F.; Pons, X. Influence of fire severity on plant regeneration by means of remote sensing imagery. Int. J. Remote Sens. 2003, 24, 1751–1763. [Google Scholar] [CrossRef]
  28. Mallinis, G.; Mitsopoulos, I.; Chrysafi, I. Evaluating and comparing Sentinel 2A and Landsat-8 Operational Land Imager (OLI) spectral indices for estimating fire severity in a Mediterranean pine ecosystem of Greece. GIScience Remote Sens. 2018, 55, 1–18. [Google Scholar] [CrossRef]
  29. Harris, S.; Veraverbeke, S.; Hook, S. Evaluating Spectral Indices for Assessing Fire Severity in Chaparral Ecosystems (Southern California) Using MODIS/ASTER (MASTER) Airborne Simulator Data. Remote Sens. 2011, 3, 2403–2419. [Google Scholar] [CrossRef] [Green Version]
  30. Fornacca, D.; Ren, G.; Xiao, W. Evaluating the Best Spectral Indices for the Detection of Burn Scars at Several Post-Fire Dates in a Mountainous Region of Northwest Yunnan, China. Remote Sens. 2018, 10, 1196. [Google Scholar] [CrossRef] [Green Version]
  31. van Mantgem, P.J.; Nesmith, J.C.B.; Keifer, M.; Knapp, E.E.; Flint, A.; Flint, L. Climatic stress increases forest fire severity across the western United States. Ecol. Lett. 2013, 16, 1151–1156. [Google Scholar] [CrossRef]
  32. Westerling, A.L. Warming and Earlier Spring Increase Western U.S. Forest Wildfire Activity. Science 2006, 313, 940–943. [Google Scholar] [CrossRef] [Green Version]
  33. Miller, R.K.; Field, C.B.; Mach, K.J. Barriers and enablers for prescribed burns for wildfire management in California. Nat. Sustain. 2020, 3, 101–109. [Google Scholar] [CrossRef]
  34. Delfino, R.J.; Brummel, S.; Wu, J.; Stern, H.; Ostro, B.; Lipsett, M.; Winer, A.; Street, D.H.; Zhang, L.; Tjoa, T.; et al. The relationship of respiratory and cardiovascular hospital admissions to the southern California wildfires of 2003. Occup. Environ. Med. 2009, 66, 189–197. [Google Scholar] [CrossRef] [Green Version]
  35. Boer, M.M.; Resco de Dios, V.; Bradstock, R.A. Unprecedented burn area of Australian mega forest fires. Nat. Clim. Chang. 2020, 10, 171–172. [Google Scholar] [CrossRef]
  36. Miller, J.D.; Safford, H.D.; Crimmins, M.; Thode, A.E. Quantitative Evidence for Increasing Forest Fire Severity in the Sierra Nevada and Southern Cascade Mountains, California and Nevada, USA. Ecosystems 2009, 12, 16–32. [Google Scholar] [CrossRef]
  37. Brumby, S.P.; Harvey, N.R.; Bloch, J.J.; Theiler, J.P.; Perkins, S.J.; Young, A.C.; Szymanski, J.J. Evolving forest fire burn severity classification algorithms for multi-spectral imagery. In Proceedings of the Algorithms for Multispectral, Hyperspectral, and Ultraspectral Imagery VII, Orlando, FL, USA, 16–20 April 2001; Shen, S.S., Descour, M.R., Eds.; pp. 236–245. [Google Scholar]
  38. Ndalila, M.N.; Williamson, G.J.; Bowman, D.M.J.S. Geographic Patterns of Fire Severity Following an Extreme Eucalyptus Forest Fire in Southern Australia: 2013 Forcett-Dunalley Fire. Fire 2018, 1, 40. [Google Scholar] [CrossRef] [Green Version]
  39. Delegido, J.; Pezzola, A.; Casella, A.; Winschel, C.; Urrego, E.P.; Jimenez, J.C.; Sobrino, J.A.; Soria, G.; Moreno, J. Estimación del grado de severidad de incendios en el sur de la provincia de Buenos Aires, Argentina, usando Sentinel-2 y su comparación con Landsat-8. Rev. Teledetección 2018, 47. [Google Scholar] [CrossRef]
  40. Lazarescu, M. Design and Field Test of a WSN Platform Prototype for Long-Term Environmental Monitoring. Sensors 2015, 15, 9481–9518. [Google Scholar] [CrossRef] [PubMed] [Green Version]
  41. Granda Cantuna, J.; Bastidas, D.; Solorzano, S.; Clairand, J.-M. Design and implementation of a Wireless Sensor Network to detect forest fires. In Proceedings of the 2017 Fourth International Conference on eDemocracy & eGovernment (ICEDEG), Quito, Ecuador, 19–21 April 2017; pp. 15–21. [Google Scholar]
  42. Pan, L. Preventing forest fires using a wireless sensor network. J. For. Sci. 2020, 66, 97–104. [Google Scholar] [CrossRef]
  43. Brummitt, N.; Lughadha, E.N. Biodiversity: Where’s Hot and Where’s Not. Conserv. Biol. 2003, 17, 1442–1448. [Google Scholar] [CrossRef]
  44. Fabian, P.; Kohlpaintner, M.; Rollenbeck, R. Biomass Burning in the Amazon-Fertilizer for the Mountaineous Rain Forest in Ecuador (7 pp). Environ. Sci. Pollut. Res. Int. 2005, 12, 290–296. [Google Scholar] [CrossRef]
  45. Bakker, J.; Moscol Olivera, M.; Hooghiemstra, H. Holocene environmental change at the upper forest line in northern Ecuador. The Holocene 2008, 18, 877–893. [Google Scholar] [CrossRef]
  46. Moscol Olivera, M.C.; Cleef, A.M. Vegetation composition and altitudinal distribution of Andean rain forests in El Angel and Guandera reserves, northern Ecuador. Phytocoenologia 2009, 39, 175–204. [Google Scholar] [CrossRef]
  47. Moscol Olivera, M.C.; Cleef, A.M. A phytosociological study of the páramo along two altitudinal transects in El Carchi province, northern Ecuador. Phytocoenologia 2009, 39, 79–107. [Google Scholar] [CrossRef]
  48. Secretaría de Gestión de Riesgos (SGR). Informe de Situación—Incendios Forestales; Secretaría de Gestión de Riesgos (SGR): Samborondón, Ecuador, 2017. [Google Scholar]
  49. Gras-Rodríguez, R.; Ramos-Rodríguez, M.P.; Medranda-Mendieta, J.A.; Manrique-Toala, T.O.; Estévez-Valdés, I. Comportamiento histórico de los incendios forestales en el Cantón Rocafuerte, provincia Manabí, Ecuador, en el periodo 2016 – 2019. Rev. For. Mesoam. Kurú 2020, 17, 37–46. [Google Scholar] [CrossRef]
  50. Gobierno Parroquial de La Carolina. Plan de Desarrollo y Ordenamiento Territorial; Gobierno Parroquial de La Carolina: Ibarra, Ecuador, 2015. [Google Scholar]
  51. Chuvieco, E.; Riaño, D.; Danson, F.M.; Martin, P. Use of a radiative transfer model to simulate the postfire spectral response to burn severity. J. Geophys. Res. Biogeosciences 2006, 111. [Google Scholar] [CrossRef] [Green Version]
  52. Andela, N.; Morton, D.C.; Giglio, L.; Chen, Y.; van der Werf, G.R.; Kasibhatla, P.S.; DeFries, R.S.; Collatz, G.J.; Hantson, S.; Kloster, S.; et al. A human-driven decline in global burned area. Science 2017, 356, 1356–1362. [Google Scholar] [CrossRef] [Green Version]
  53. Tran, B.; Tanase, M.; Bennett, L.; Aponte, C. Evaluation of Spectral Indices for Assessing Fire Severity in Australian Temperate Forests. Remote Sens. 2018, 10, 1680. [Google Scholar] [CrossRef] [Green Version]
  54. Veraverbeke, S.; Verstraeten, W.W.; Lhermitte, S.; Goossens, R. Evaluating Landsat Thematic Mapper spectral indices for estimating burn severity of the 2007 Peloponnese wildfires in Greece. Int. J. Wildl. Fire 2010, 19, 558. [Google Scholar] [CrossRef] [Green Version]
  55. Veraverbeke, S.; Hook, S.J. Evaluating spectral indices and spectral mixture analysis for assessing fire severity, combustion completeness and carbon emissions. Int. J. Wildl. Fire 2013, 22, 707. [Google Scholar] [CrossRef]
  56. De Santis, A.; Chuvieco, E. Burn severity estimation from remotely sensed data: Performance of simulation versus empirical models. Remote Sens. Environ. 2007, 108, 422–435. [Google Scholar] [CrossRef]
  57. De Santis, A.; Asner, G.P.; Vaughan, P.J.; Knapp, D.E. Mapping burn severity and burning efficiency in California using simulation models and Landsat imagery. Remote Sens. Environ. 2010, 114, 1535–1545. [Google Scholar] [CrossRef]
  58. Chen, X.; Vogelmann, J.E.; Rollins, M.; Ohlen, D.; Key, C.H.; Yang, L.; Huang, C.; Shi, H. Detecting post-fire burn severity and vegetation recovery using multitemporal remote sensing spectral indices and field-collected composite burn index data in a ponderosa pine forest. Int. J. Remote Sens. 2011, 32, 7905–7927. [Google Scholar] [CrossRef]
  59. Navarro, G.; Caballero, I.; Silva, G.; Parra, P.-C.; Vázquez, Á.; Caldeira, R. Evaluation of forest fire on Madeira Island using Sentinel-2A MSI imagery. Int. J. Appl. Earth Obs. Geoinf. 2017, 58, 97–106. [Google Scholar] [CrossRef] [Green Version]
  60. Fernández García, V. Effects of fire recurrence and burn severity in fire-prone pin ecosystems. Basis for forest management. Ph.D. Thesis, Universidad de León, León, Spain, 2019. [Google Scholar]
  61. Gitelson, A.A. Remote estimation of crop fractional vegetation cover: The use of noise equivalent as an indicator of performance of vegetation indices. Int. J. Remote Sens. 2013, 34, 6054–6066. [Google Scholar] [CrossRef]
  62. Ayele, G.T.; Tebeje, A.K.; Demissie, S.S.; Belete, M.A.; Jemberrie, M.A.; Teshome, W.M.; Mengistu, D.T.; Teshale, E.Z. Time Series Land Cover Mapping and Change Detection Analysis Using Geographic Information System and Remote Sensing, Northern Ethiopia. Air, Soil Water Res. 2018, 11, 117862211775160. [Google Scholar] [CrossRef] [Green Version]
  63. Ariza, A.; Salas Rey, J.; Merino de Miguel, S. Comparison of maximum likelihood estimators and regression models for burn severity mapping in Mediterranean forests using Landsat TM and ETM+ data. Rev. Cart. 2019, 145–177. [Google Scholar] [CrossRef]
  64. Schepers, L.; Haest, B.; Veraverbeke, S.; Spanhove, T.; Vanden Borre, J.; Goossens, R. Burned Area Detection and Burn Severity Assessment of a Heathland Fire in Belgium Using Airborne Imaging Spectroscopy (APEX). Remote Sens. 2014, 6, 1803–1826. [Google Scholar] [CrossRef] [Green Version]
  65. El Universo Incendio forestal afectó 700 hectáreas de la comuna Guadual, en Ibarra. Available online: https://www.eluniverso.com/noticias/2014/09/02/nota/3674241/incendio-forestal-afecto-700-hectareas-comuna-guadual-ibarra/ (accessed on 7 May 2021).
  66. INEC VII Censo de Población y VI de Vivienda. Sistema Integrado de Consultas. Available online: http://redatam.inec.gob.ec/ (accessed on 8 October 2021).
  67. Benavides, M. Daysi Pozo Diagnóstico del Estado Actual de Conservación y Propuesta de intervención en las vertientes que abastecen de agua para consumo humano a la Parroquia La Carolina; Universidad Técnica del Norte: Cantón Ibarra, Ecuador, 2015. [Google Scholar]
  68. Santiana, J.; Baez, S.; Guevara, J. Sistema de Clasificación de los Ecosistemas del Ecuador Continental, Quito, Ecuador, 2013.
  69. Chamorro, C.; Mishell, K. Identificación y caracterización de las zonas de recarga hídrica mediante herramientas Sig de los acuíferos la carbonería, Guaraczapas, Yuyucocha y Santa Clara para la protección de las fuentes de aprovisionamiento de agua en la zona urbana de Ibarra; Universiad Técnica del Norte: Ibarra, Ecuador, 2017. [Google Scholar]
  70. Tobar, F.; López, M.F.; Muñoz-Upegui, D.; Richter, F. Two new species of Lepanthes (Pleurothallidinae; Orchidaceae) from Andean forest remnants in Ibarra, Ecuador. Phytotaxa 2018, 375, 221. [Google Scholar] [CrossRef]
  71. Martínez-Vásquez, J. Plan de Desarrollo y Ordenamiento Territorial (PDOT) del Cantón Ibarra, Ibarra, Ecuador, 2015.
  72. Peel, M.C.; Finlayson, B.L.; McMahon, T.A. Updated world map of the Köppen-Geiger climate classification. Hydrol. Earth Syst. Sci. 2007, 11, 1633–1644. [Google Scholar] [CrossRef] [Green Version]
  73. Zapata-Ríos, X.; Lopez-Fabara, C.; Navarrete, A.; Torres-Paguay, S.; Flores, M. Spatiotemporal patterns of burned areas, fire drivers, and fire probability across the equatorial Andes. J. Mt. Sci. 2021, 18, 952–972. [Google Scholar] [CrossRef]
  74. SNI Sistema Nacional de Información. Available online: https://sni.gob.ec (accessed on 15 May 2021).
  75. IGM Capas de Información Geográfica Básica del IGM de Libre Acceso. Available online: http://www.geoportaligm.gob.ec/portal/index.php/cartografia-de-libre-acceso-escala-50k/ (accessed on 5 June 2021).
  76. SIGTIERRAS-MAG Ministerio de Agrilcultura y Ganadería SIGTIERRAS. Available online: http://geoportal.agricultura.gob.ec/index.php/visor-geo (accessed on 3 November 2021).
  77. MAE Ministerio del Ambiente, Agua y Transición Ecológica. Mapa Interactivo. Available online: http://ide.ambiente.gob.ec/mapainteractivo/ (accessed on 10 September 2021).
  78. USGS United States Geological Survey. Available online: https://earthexplorer.usgs.gov/ (accessed on 10 April 2021).
  79. Gutman, G.; Huang, C.; Chander, G.; Noojipady, P.; Masek, J.G. Assessment of the NASA–USGS Global Land Survey (GLS) datasets. Remote Sens. Environ. 2013, 134, 249–265. [Google Scholar] [CrossRef]
  80. Velastegui-Montoya, A.; de Lima, A.; Adami, M. Multitemporal Analysis of Deforestation in Response to the Construction of the Tucuruí Dam. ISPRS Int. J. Geo-Information 2020, 9, 583. [Google Scholar] [CrossRef]
  81. Rongali, G.; Keshari, A.K.; Gosain, A.K.; Khosa, R. Split-Window Algorithm for Retrieval of Land Surface Temperature Using Landsat 8 Thermal Infrared Data. J. Geovisualization Spat. Anal. 2018, 2, 14. [Google Scholar] [CrossRef]
  82. Gerace, A.; Kleynhans, T.; Eon, R.; Montanaro, M. Towards an Operational, Split Window-Derived Surface Temperature Product for the Thermal Infrared Sensors Onboard Landsat 8 and 9. Remote Sens. 2020, 12, 224. [Google Scholar] [CrossRef] [Green Version]
  83. ESRI ArcGIS Desktop; ESRI: Redlands, CA, USA, 2021.
  84. Tucker, C.J. Red and photographic infrared linear combinations for monitoring vegetation. Remote Sens. Environ. 1979, 8, 127–150. [Google Scholar] [CrossRef] [Green Version]
  85. Xu, D. Compare NDVI Extracted from Landsat 8 Imagery with that from Landsat 7 Imagery. Am. J. Remote Sens. 2014, 2, 10. [Google Scholar] [CrossRef] [Green Version]
  86. Thapa, S.; Garcia Millan, V.E.; Eklundh, L. Assessing Forest Phenology: A Multi-Scale Comparison of Near-Surface (UAV, Spectral Reflectance Sensor, PhenoCam) and Satellite (MODIS, Sentinel-2) Remote Sensing. Remote Sens. 2021, 13, 1597. [Google Scholar] [CrossRef]
  87. Hyndavi, A.; James, L.; Anjaneyulu, R.V.G.; Suresh, S.; Venkateswara Rao, C.; Bothale, V.M. Evolution of value addition process for generation of Normalised Difference Vegetation Index (NDVI) product – A case study. In Proceedings of the 2019 IEEE Recent Advances in Geoscience and Remote Sensing: Technologies, Standards and Applications (TENGARSS), Kochi, India, 17–20 October 2019; pp. 86–91. [Google Scholar]
  88. Stankova, N.; Nedkov, R. Monitoring forest regrowth with different burn severity using aerial and Landsat data. In Proceedings of the 2015 IEEE International Geoscience and Remote Sensing Symposium (IGARSS), Milan, Italy, 26–31 July 2015; 2015; pp. 2166–2169. [Google Scholar]
  89. García-Llamas, P.; Suárez-Seoane, S.; Fernández-Guisuraga, J.M.; Fernández-García, V.; Fernández-Manso, A.; Quintano, C.; Taboada, A.; Marcos, E.; Calvo, L. Evaluation and comparison of Landsat 8, Sentinel-2 and Deimos-1 remote sensing indices for assessing burn severity in Mediterranean fire-prone ecosystems. Int. J. Appl. Earth Obs. Geoinf. 2019, 80, 137–144. [Google Scholar] [CrossRef]
  90. Li, P.; Jiang, L.; Feng, Z. Cross-Comparison of Vegetation Indices Derived from Landsat-7 Enhanced Thematic Mapper Plus (ETM+) and Landsat-8 Operational Land Imager (OLI) Sensors. Remote Sens. 2013, 6, 310–329. [Google Scholar] [CrossRef] [Green Version]
  91. Keeley, J.E. Fire intensity, fire severity and burn severity: A brief review and suggested usage. Int. J. Wildl. Fire 2009, 18, 116. [Google Scholar] [CrossRef]
  92. Barboza Castillo, E.; Turpo Cayo, E.Y.; de Almeida, C.M.; Salas López, R.; Rojas Briceño, N.B.; Silva López, J.O.; Barrena Gurbillón, M.Á.; Oliva, M.; Espinoza-Villar, R. Monitoring Wildfires in the Northeastern Peruvian Amazon Using Landsat-8 and Sentinel-2 Imagery in the GEE Platform. ISPRS Int. J. Geo-Information 2020, 9, 564. [Google Scholar] [CrossRef]
  93. Chasmer, L.E.; Hopkinson, C.D.; Petrone, R.M.; Sitar, M. Using Multitemporal and Multispectral Airborne Lidar to Assess Depth of Peat Loss and Correspondence with a New Active Normalized Burn Ratio for Wildfires. Geophys. Res. Lett. 2017, 44, 11851–11859. [Google Scholar] [CrossRef] [Green Version]
  94. Hudak, A.T.; Morgan, P.; Bobbitt, M.J.; Smith, A.; Lewis, S.A.; Lentile, L.B.; McKinley, R.A. The relationship of multispectral satellite imagery to immediate fire effects. Fire Ecol. 2007, 3, 64–90. [Google Scholar] [CrossRef]
  95. Soverel, N.O.; Perrakis, D.D.B.; Coops, N.C. Estimating burn severity from Landsat dNBR and RdNBR indices across western Canada. Remote Sens. Environ. 2010, 114, 1896–1909. [Google Scholar] [CrossRef]
  96. Botella-Martínez, M.A.; Fernández-Manso, A. Estudio de la severidad post-incendio en la Comunidad Valenciana comparando los índices dNBR, RdNBR y RBR a partir de imágenes Landsat 8. Rev. Teledetección 2017, 33. [Google Scholar] [CrossRef] [Green Version]
  97. Quintano, C.; Fernández-Manso, A.; Fernández-Manso, O. Combination of Landsat and Sentinel-2 MSI data for initial assessing of burn severity. Int. J. Appl. Earth Obs. Geoinf. 2018, 64, 221–225. [Google Scholar] [CrossRef]
  98. Campo, J.; Merino, A. Variations in soil carbon sequestration and their determinants along a precipitation gradient in seasonally dry tropical forest ecosystems. Glob. Chang. Biol. 2016, 22, 1942–1956. [Google Scholar] [CrossRef]
  99. Tipping, M.E.; Bishop, C.M. Probabilistic Principal Component Analysis. J. R. Stat. Soc. Ser. B 1999, 61, 611–622. [Google Scholar] [CrossRef]
  100. Mahmoudi, M.R.; Heydari, M.H.; Qasem, S.N.; Mosavi, A.; Band, S.S. Principal component analysis to study the relations between the spread rates of COVID-19 in high risks countries. Alexandria Eng. J. 2021, 60, 457–464. [Google Scholar] [CrossRef]
  101. Velastegui-Montoya, A.; de Lima, A.; Herrera-Matamoros, V. What Is the Socioeconomic Impact of the Tucuruí Dam on Its Surrounding Municipalities? Sustainability 2022, 14, 1630. [Google Scholar] [CrossRef]
  102. INAHMI Instituto Nacional de Meteorología e Hidrología. Available online: http://www.inamhi.gob.ec/ (accessed on 7 August 2021).
  103. Komperda, R. Likert-Type Survey Data Analysis with R and RStudio. In Computer-Aided Data Analysis in Chemical Education Research (CADACER): Advances and Avenues; Gupta, T., Ed.; ACS Symposium Series: Washington, DC, USA, 2017; pp. 91–116. [Google Scholar]
  104. Basu, T.; Das, A. Identification of backward district in India by applying the principal component analysis and fuzzy approach: A census based study. Socioecon. Plann. Sci. 2020, 72, 100915. [Google Scholar] [CrossRef]
  105. Quistial-Valencia, G.M. Propuesta de un Plan de Prevención de Incendios Forestales en las Parroquias La Carolina y Salinas; UNIVERSIDAD TÉCNICA DEL NORTE,: Cantón Ibarra, Ecuador, 2016. [Google Scholar]
  106. Morales-Salguero, J.R. Determinación del Riesgo de Ignición y Propagación de Incendios Forestales en los Cerros Orientales de Bogotá a Través del Algebra de Mapas y Simulación. Ph.D. Thesis, Universidad Distrital Francisco José de Caldas, Bogotá, Colombia, 2017. [Google Scholar]
  107. Duncan, J.; Stow, D.; Franklin, J.; Hope, A. Assessing the relationship between spectral vegetation indices and shrub cover in the Jornada Basin, New Mexico. Int. J. Remote Sens. 1993, 14, 3395–3416. [Google Scholar] [CrossRef]
  108. Escuin, S.; Navarro, R.; Fernández, P. Fire severity assessment by using NBR (Normalized Burn Ratio) and NDVI (Normalized Difference Vegetation Index) derived from LANDSAT TM/ETM images. Int. J. Remote Sens. 2008, 29, 1053–1073. [Google Scholar] [CrossRef]
  109. FAO Earth Map 1.2. Available online: https://earthmap.org/ (accessed on 9 December 2021).
  110. Key, C.; Benson, N. Measuring and remote sensing of burn severity: The CBI and NBR. In Proceedings of the Proceedings Joint Fire Science Conference and Workshop, Moscow, Russia, 15–17 June 1999; Volume II, p. 2. [Google Scholar]
  111. United Nations Normalized Burn Ratio (NBR). Available online: https://www.un-spider.org/advisory-support/recommended-practices/recommended-practice-burn-severity/in-detail/normalized-burn-ratio (accessed on 1 February 2022).
  112. Cortenbach, J.; Williams, R.; Madurapperuma, B. Determining Fire Severity of the Santa Rosa, CA 2017 Fire. IdeaFest Interdiscip. J. Creat. Work. Res. from Humboldt State Univ. 2019, 3, 1–10. [Google Scholar]
  113. Hammill, K.A.; Bradstock, R.A. Remote sensing of fire severity in the Blue Mountains: Influence of vegetation type and inferring fire intensity. Int. J. Wildl. Fire 2006, 15, 213. [Google Scholar] [CrossRef]
  114. Xulu, S.; Mbatha, N.; Peerbhay, K. Burned Area Mapping over the Southern Cape Forestry Region, South Africa Using Sentinel Data within GEE Cloud Platform. ISPRS Int. J. Geo-Information 2021, 10, 511. [Google Scholar] [CrossRef]
  115. Vrieling, A.; de Jong, S.M.; Sterk, G.; Rodrigues, S.C. Timing of erosion and satellite data: A multi-resolution approach to soil erosion risk mapping. Int. J. Appl. Earth Obs. Geoinf. 2008, 10, 267–281. [Google Scholar] [CrossRef]
  116. Peres-Neto, P.R.; Jackson, D.A.; Somers, K.M. Giving Meaningful Interpretation to Ordination Axes: Assessing Loading Significance in Principal Component Analysis. Ecology 2003, 84, 2347–2363. [Google Scholar] [CrossRef] [Green Version]
  117. Fernandez-Palomino, C.A.; Hattermann, F.F.; Krysanova, V.; Lobanova, A.; Vega-Jácome, F.; Lavado, W.; Bronstert, A. A novel high-resolution gridded precipitation dataset for Peruvian and Ecuadorian watersheds – development and hydrological evaluation. J. Hydrometeorol. 2021, 23, 309–336. [Google Scholar] [CrossRef]
  118. Chimborazo, O.; Vuille, M. Present-day climate and projected future temperature and precipitation changes in Ecuador. Theor. Appl. Climatol. 2021, 143, 1581–1597. [Google Scholar] [CrossRef]
  119. da Paca, V.H.M.; Espinoza-Dávalos, G.; Moreira, D.; Comair, G. Variability of Trends in Precipitation across the Amazon River Basin Determined from the CHIRPS Precipitation Product and from Station Records. Water 2020, 12, 1244. [Google Scholar] [CrossRef]
  120. ECMWF ERA5. Available online: https://www.ecmwf.int/en/forecasts/datasets/reanalysis-datasets/era5 (accessed on 5 September 2021).
  121. Abdi, H.; Williams, L.J. Principal component analysis. Wiley Interdiscip. Rev. Comput. Stat. 2010, 2, 433–459. [Google Scholar] [CrossRef]
  122. MAE. MAE Ley Forestal y de Conservación de Áreas Naturales y Vida Silvestre, 2004.
  123. GAD Parroquial Rural San Pedro de La Carolina. Plan de Desarrollo y Ordenamiento Territorial de la Parroquia Rural La Carolina; GAD Parroquial Rural San Pedro de La Carolina: Ibarra, Ecuador, 2015. [Google Scholar]
  124. Foster, P. The potential negative impacts of global climate change on tropical montane cloud forests. Earth-Science Rev. 2001, 55, 73–106. [Google Scholar] [CrossRef]
  125. SNGRE Servicio Nacional de Gestión de Riesgos y Emergencias. Available online: https://gestionriesgosec.maps.arcgis.com/home/index.html (accessed on 25 January 2022).
  126. SNDGR Servicio Nacional de Gestión de Riesgos y Emergencias. Available online: https://www.gestionderiesgos.gob.ec/en-imbabura-147271-hectareas-consumidas-en-incendios-forestales/#:~:text=Ibarra (accessed on 14 January 2022).
  127. ECU 911 Servicio Integrado de Seguridad ECU 911. Available online: https://www.ecu911.gob.ec/ecu-911-ibarra-coordino-atencion-de-incendios-forestales-en-imbabura/ (accessed on 14 January 2022).
  128. Zhang, L.; Yan, H.; Qiu, L.; Cao, S.; He, Y.; Pang, G. Spatial and Temporal Analyses of Vegetation Changes at Multiple Time Scales in the Qilian Mountains. Remote Sens. 2021, 13, 5046. [Google Scholar] [CrossRef]
  129. Adu, B.; Qin, G.; Li, C.; Wu, J. Grassland Phenology’s Sensitivity to Extreme Climate Indices in the Sichuan Province, Western China. Atmosphere 2021, 12, 1650. [Google Scholar] [CrossRef]
  130. Wasko, C.; Parinussa, R.M.; Sharma, A. A quasi-global assessment of changes in remotely sensed rainfall extremes with temperature. Geophys. Res. Lett. 2016, 43, 10. [Google Scholar] [CrossRef]
  131. Trenberth, K.E.; Shea, D.J. Relationships between precipitation and surface temperature. Geophys. Res. Lett. 2005, 32, 1–4. [Google Scholar] [CrossRef]
  132. Choi, M.; Chi, S. Optimal route selection model for fire evacuations based on hazard prediction data. Simul. Model. Pract. Theory 2019, 94, 321–333. [Google Scholar] [CrossRef]
  133. Song, Y.; Niu, L.; Liu, P.; Li, Y. Fire hazard assessment with indoor spaces for evacuation route selection in building fire scenarios. Indoor Built Environ. 2022, 31, 452–465. [Google Scholar] [CrossRef]
Figure 1. Study area location: (a) La Carolina parish, (b) Ibarra canton and (c) macro-location in Ecuador.
Remotesensing 14 01783 g001
Figure 2. Methodological scheme.
Remotesensing 14 01783 g002
Figure 3. Meteorological stations location in the surroundings of the Ibarra canton.
Remotesensing 14 01783 g003
Figure 4. Base information of La Carolina parish. (a) climate type; (b) land use in the pre-fire scenario (2014); (c) land use in the post-fire scenario (2016), (d) isohyets, (e) isotherms, and (f) aspects or sun orientation. Source: adapted from [74,75,76,77].
Remotesensing 14 01783 g004
Figure 5. NDVI results: (a) NDVI pre-fire 2014, (b) NDVI post-fire 2015 and (c) NDVI post-fire 2020, calculated with Landsat-8.
Remotesensing 14 01783 g005
Figure 6. Photosynthetic activity according to the pre- and post-fire NDVI indices, calculated with Landsat-8 data.
Remotesensing 14 01783 g006
Figure 7. Monthly NDVI in Carolina parish, calculated with Landsat-8 satellite data. Source: adapted from [109].
Remotesensing 14 01783 g007
Figure 8. NBR results: (a) NBR pre-fire 2014, (b) NBR post-fire 2015, (c) NBR post-fire 2020, calculated with Landsat-8.
Remotesensing 14 01783 g008
Figure 9. Severity levels represented using the NBR index with Landsat-8.
Remotesensing 14 01783 g009
Figure 10. Degree of severity estimated with Landsat-8 images. (a) dNDVI between pre-fire 2014 and post-fire 2020 images and (b) dNBR between pre-fire 2014 and post-fire 2020 images.
Remotesensing 14 01783 g010
Figure 11. Hydrograph of the Carchi meteorological station (M0301) in 2000–2016.
Remotesensing 14 01783 g011
Figure 12. Maximum monthly temperature in the period 2000–2016. Source: adapted from [109,120].
Remotesensing 14 01783 g012
Figure 13. PCA results, used to classify precipitation by month. (a) PCA variables and (b) PCA biplot.
Remotesensing 14 01783 g013
Figure 14. Main aspects considered for the proposal of the fire action plan. (a) Mining activity in the region, (b) drainage (water bodies), (c) accessibility (roads and health facilities), (d) geological formations, (e) representative geoforms, (f) fire susceptibility model and fire-starting points, (g) contour lines (elevation), (h) slope classifications, (i) digital elevation model (DEM) or altitude map. Source: adapted from [74,75,76,77,125].
Remotesensing 14 01783 g014
Figure 15. Evacuation route map in response to fires in La Carolina parish.
Remotesensing 14 01783 g015
Table 1. Remote sensing data.
ScenarioAcquisition DateRemote Sensing TypeSensor
1Pre-fire26 June 2014Landsat 8OLI-TIRS
2Post-fire11 June 2015Landsat 8OLI-TIRS
3Post-fire25 June 2020Landsat 8OLI-TIRS
Note: Operational Land Imager (OLI), Thermal Infrared Sensor (TIRS).
Table 2. Pre-fire and post-fire land use areas in La Carolina parish. Source: adapted from [77].
Land Use Area (ha)
2014 (Pre-Fire)
Area (%)
2014 (Pre-Fire)
Area (ha)
2016 (Post-Fire)
Area (%)
2016 (Post-Fire)
Shrub and Herbaceous Vegetation13,117.7042.5414,129.0145.82
Agricultural Land12,690.4041.1512,110.8439.27
Native Forest4395.6414.254353.4314.12
Moor447.271.452.790.01
Water Bodies74.300.24164.600.53
Urban Zone8.110.0374.690.24
Other Lands103.770.341.820.01
La Carolina Parish30,837.1910030,837.19100
Table 3. NDVI classification. Source: adapted from [107].
ClassNDVI RangePhotosynthetic Activity
1<0.0Null
20.0–0.1Very low
30.1–0.2Low
40.2–0.3Moderate
50.3–0.4Moderate/High
60.4–0.6High
7>0.60Very high
Table 4. NBR classification. Source: adapted from [91,110,111,112].
ClassNBR ValueFire Severity Level
1<−0.25 High vegetation growth after fire
2−0.25–−0.10Low growth of post-fire vegetation
3−0.10–0.10Unburned
40.10–0.27Burned areas with low severity
50.27–0.44Burned areas with moderate/low severity
60.44–0.66Burned areas with moderate/high severity
Table 5. Fire severity model validation with field data.
CategorydNDVI(%)dNBR(%)
1Unburned12.9High enhanced regrowth16.13
2Very low severity12.9Low enhanced regrowth12.9
3Low severity16.13Unburned9.68
4Moderate severity12.9Low severity12.9
5High Severity16.13Moderate/low severity9.68
6Very high severity26.04Moderate/high severity12.9
7--High Severity25.81
Table 6. Accuracy between fire severity models.
dNDVIdNBR(%) Accuracy between Models
UnburnedUnburned75.04
Low severityLow severity75.02
Moderate severityModerate/low severity75.02
High SeverityModerate/high severity79.88
Very high severityHigh Severity99.1
Publisher’s Note: MDPI stays neutral with regard to jurisdictional claims in published maps and institutional affiliations.

