Article

An Overall Assessment of JPSS-3 VIIRS Radiometric Performance Based on Pre-Launch Testing

1
Science Systems and Applications, Inc., Lanham, MD 20706, USA
2
NASA Goddard Space Flight Center, Greenbelt, MD 20771, USA
3
The Aerospace Corporation, El Segundo, CA 90245, USA
4
Global Science and Technologies, Inc., Greenbelt, MD 20770, USA
*
Author to whom correspondence should be addressed.
Submission received: 17 March 2022 / Revised: 16 April 2022 / Accepted: 17 April 2022 / Published: 21 April 2022

Abstract

:
Satellite imagery and data are playing an increasingly important role in scientific studies of the Earth and its climate. The scientific community has been demanding ever-increasing capabilities and accuracy from the data provided by these satellites. One key instrument on board a series of satellite platforms is the Visible Infrared Imaging Radiometer Suite (VIIRS), which provides high-quality data of the Earth from low Earth orbit covering the visible to long-wave infrared parts of the spectrum. The fourth build in the series, set to be launched on the Joint Polar-orbiting Satellite System 3 (JPSS-3) platform, has recently completed its main ground calibration program and is set to be integrated into the satellite bus in the near future. This calibration program covered a comprehensive series of performance metrics designed to demonstrate the quality of the science data and ensure the instrument can maintain its calibration successfully once on-orbit. The subject of this work covers the radiometric calibration metrics including dynamic range, signal-to-noise ratio/noise equivalent differential temperature (SNR/NEdT), polarization sensitivity, scattered light response, relative spectral response, response versus scan angle, and uniformity, as well as uncertainties; all key metrics met or exceeded their design requirements with some minor exceptions. Comparisons to previous builds will also be provided.

1. Introduction

In order to generate high-quality satellite data used for Earth science and climate studies, NASA and NOAA have jointly developed the VIIRS (Visible Infrared Imaging Radiometer Suite) instrument. Currently, the first two VIIRS instruments are on-orbit on the SNPP (Suomi National Polar-orbiting Partnership) [1,2] and the JPSS-1 (Joint Polar-orbiting Satellite System) platforms [3]. The third VIIRS has been integrated onto the JPSS-2 spacecraft and is undergoing the final checks prior to an expected launch in 2022 [4]. The fourth VIIRS in the series has recently completed its main ground test program at the Raytheon facility in El Segundo, CA, and is scheduled to be shipped to the spacecraft vendor where it will be integrated into the JPSS-3 platform, with launch scheduled for 2026. A fifth build has begun its ground test campaign. The radiometric calibration of the fourth build (JPSS-3) based on ground testing is the subject of this work.
Science products from the VIIRS instrument are key to a number of scientific studies related to land/ocean use, climate studies, and weather prediction, among others [5,6]. These studies require good-quality data to meet their needs, which therefore requires the VIIRS instrument to be well calibrated while on-orbit. To accomplish this, the instrument must undergo a rigorous calibration program prior to launch. Some aspects of the calibration can be updated once on-orbit, such as the radiometric gain, but still rely on traceablility to NIST standards on ground measurements. Other calibration metrics can only be determined prior to launch (such as polarization sensitivity). Raytheon Technologies has developed a comprehensive test program to calibrate the relevant aspects of the VIIRS instrument pre-launch, which are traceable to NIST standards, and will ensure that the VIIRS instrument, once on-orbit, provides high-quality datasets for use by the scientific community in their various studies and applications.
This work will focus on the radiometric performance of the JPSS-3 VIIRS instrument based on ground testing. Section 2 will describe the instrument design as well as provide an overview of the main ground test program, including improvements made since the previous build JPSS-2. Section 3 will describe the sensor performance including radiometry, SNR/NEdT, polarization, response versus scan, scattered light, and relative spectral response. A comparison to previous builds is also provided.

2. JPSS-3 Sensor Design and Testing Program

2.1. Sensor Design and Improvements

The VIIRS instrument is a cross-track scanning filter radiometer that can image the Earth twice daily from low Earth orbit (using a polar orbit with an altitude of about 830 km, a 1:30 p.m. equatorial crossing time, and an orbital period of about 100 min) [1,2]. VIIRS is based on the heritage from earlier sensors, including MODIS and SeaWifs [7,8,9]. It contains 22 spectral channels covering the range from 0.412 μ m to 12 μ m separated on four focal plane assemblies (FPAs). The bands covering the visible and short-wave infrared (from 0.412 μ m to 2.25 μ m) are referred to as the reflective solar bands (RSB), as they record solar radiation reflected off the Earth, and are calibrated on-orbit using observations of the Sun reflected off a diffuse panel. The bands covering the mid-wave to long-wave infrared (from 3.74 μ m to 12 μ m) are known as the thermal emissive bands (TEB), which detect thermal radiation emitted by the Earth, and are calibrated on-orbit using a temperature-controlled onboard blackbody. The final band is a pan-chromatic day–night band (DNB), covering the spectral range from 0.5 μ m to 0.9 μ m, which has a large dynamic range enabling it to image both nighttime and daytime scenes. The VIIRS bands are listed in Table 1 along with band metrics, including center wavelength, bandwidth, resolution at nadir, dynamic range, and minimum allowed SNR/NEdT for a typical scene. Note that some bands have more than one gain stage (referred to as dual gain bands) and the DNB has three gain stages.
VIIRS has a rotating telescope assembly (known as the RTA), scanning in a plane perpendicular to the direction of the spacecraft motion, that spins once about every 1.7 s. On-orbit at an altitude of around 830 km (in a polar orbit with an equatorial crossing of 1:30 p.m.), this translates to the capacity to image a swath of the Earth about 3000 km long (equivalent to ±56 degrees off nadir). The telescope consists of a three-mirror anistigmat and a fold mirror. As the light beam passes out of the telescope, it is reflected off a two-sided half-angle mirror (HAM), rotating at half the speed of the RTA, which de-rotates the light beam as it enters the aft-optics.
Passing a fold mirror and a four-mirror anistigmat, the beam encounters the first dichoric beamsplitter, which separates the visible and near-infrared (VisNIR) from the longer wavelengths. The VisNIR wavelengths are reflected onto two FPAs. The first FPA contains nine bands covering 0.4 μ m to 0.9 μ m using SiPD detectors (I1–I2 and M1–M7 listed in Table 1). Each band is a linear array of 16 or 32 detectors aligned in the direction of the spacecraft motion. The imaging bands (names beginning with “I”) have resolutions of ∼375 m at nadir, while the moderate-resolution bands (names beginning with “M”) have resolutions of ∼750 m at nadir. Some bands have two gain states (high and low gain, or HG and LG). This design was driven by different science teams’ use of the same bands; in the case of M1–M5 and M7, the high gain is used by the ocean color community for low radiance scenes, and the low gain is used by atmospheric science for higher radiance scenes, particularly for aerosols. The second FPA contains the DNB charge coupled devices (CCDs) covering 0.5 μ m to 0.9 μ m. The first FPA is not temperature-controlled, while the second is tied to the warm stage of the cryo-radiator. The DNB consists of four CCDs used to create three gain stages (low gain, mid-gain, and high gain, listed as LGS, MGS, and HGS). The HGS is divided between two CCDs (referred to as HGA and HGB) to help reduce the effects of high-energy particle strikes. The three gain stages allow the DNB to take images over a large dynamic range, providing image clarity in daytime as well as nighttime. The DNB employs 32 different aggregation modes used to keep the ground footprint of the DNB relatively constant as VIIRS scans across the Earth (by reducing the number of sub-pixels aggregated as the footprint moves away from nadir). The longer wavelength light passes through the beamsplitter and encounters a second dichroic beamsplitter which separates the short- and mid-wave infrared from the long-wave infrared and directs each to a temperature-controlled FPA encased in a dewar (tied to the cold stage of the cryo-radiator). The short- and mid-wave FPA contains 8 bands (I3–I4 and M8–M13 listed in Table 1) which use staggered arrays of 16 or 32 HgCdTe detectors with the long axis of the array aligned in the direction of spacecraft motion. Band M13 is also a dual gain band: this design was driven by the science community to accommodate sea surface temperature (high gain for low signal) and fire detection (low gain for high scene temperatures). The long-wave FPA has a similar setup and contains five bands (I5 and M14–M16 listed in Table 1). M16 consists of two detector arrays combined in time-delayed integration once on-orbit. VIIRS detectors image the Earth multiple times during a single scan line as the telescope rotates past the Earth (3200 pixels per M band detector, 6400 pixels per I band detector, and 4064 pixels per DNB detector).
In addition to scanning the Earth, the telescope scans inside the instrument cavity where it views three calibration targets. The first target is deep space about 3 degrees off the limb of the Earth viewed through the nadir door every scan. The response from this view is used as a dark offset. The second calibration target is a temperature-controlled V-grove blackbody. This blackbody is normally held at 292 K, but its temperature can also transition from instrument ambient (about 267 K on-orbit) to 315 K. The thermal bands use the blackbody as a target to provide a scan-by-scan update to the radiometric gain. The temperature cycling, performed regularly on-orbit, can be used to check the response offset and nonlinearity. The final calibration target is the solar diffuser. This diffuser is a Spectralon panel which, on-orbit, is illuminated by the Sun through an attenuation screen. This allows the reflective bands to update their radiometric gains every orbit. However, the performance of the SpectralonTM has been shown to degrade with time on-orbit [1], so an additional instrument, the SDSM, was included to track and correct this degradation. The solar diffuser stability monitor (SDSM) is a ratioing radiometer that takes near simultaneous measurements of the SpectralonTM panel and the Sun through a dedicated attenuation screen.
Radiation that leaves the Earth and is imaged by VIIRS is generally the composite of solar illumination reflected off the Earth and thermal radiation. For the wavelength range 0.4 μ m to 2.3 μ m, the light observed is overwhelmingly from reflected solar illumination. The bands in this wavelength range (I1–I3 and M1–M11) are referred to as the reflective solar bands, or RSB. The DNB, because of its large dynamic range and different detector technology, is treated separately. For the wavelength range 3.7 μ m to 12 μ m, the incident radiation is due to emission from the Earth’s surface or clouds. The bands in this wavelength region (I4–I5 and M12–M16) are referred to as the thermal emissive bands, or TEB. The three groups of bands (RSB, TEB, and DNB) are generally treated separately in both the ground testing as well as on-orbit calibration. As a result, Section 3 will discuss the performance of each of the three groups separately.
On-orbit, the VIIRS instrument will downlink the uncalibrated data from the spectral band detectors as well as telemetry. Ground processing will convert the raw data into calibrated radiance/reflectance and brightness temperature in packets called science data records (SDR). The science teams then use these calibrated data to produce higher-level science products, such as sea surface temperature or ocean color, in packets known as environmental data records (EDR). The SDR and EDR products will be available through NASA and/or NOAA websites.

2.2. Sensor Design Changes

A number of improvements were made to the JPSS-3 VIIRS build in comparison to JPSS-2, based on lessons learned. The key improvements for JPSS-3 are listed in Table 2. The DNB CCDs were redesigned as no heritage CCDs were available; as a result, the bias voltages were also reset to achieve the desired performance. JPSS-2 experience showed that the RTA experienced larger than expected wavefront error and line-of-sight error after environmental testing; this led the JPSS-3 tolerancing of the RTA to be tighter in the event that performance degraded after testing had been completed, and still be within the expected performance. On JPSS-2, the scans swath in the track direction does not overlap as designed, leaving a small gap between scans (referred to as scan underlap). The JPSS-3 effective focal length (EFL) bounds were tightened so that the EFL was within the tolerance of possible scan rate changes needed to maintain scan overlap once on-orbit. The first dichroic for JPSS-3 was redesigned to move the short wavelength cutoff to slightly bluer wavelengths. The JPSS-2 dichroic cut off on the blue edge of the M1 bandpass; this caused increased polarization sensitivity as splitting occurred between the s and p polarization states on the edge of the dichroic acceptance. The SDSM detectors were shown on JPSS-2 to have out-of-band leaks coming from long wavelength light passing through the filters at high incidence angles; these leaks were reduced by hardware changes.

2.3. Sensor Testing and Improvements

The JPSS-3 VIIRS instrument underwent a rigorous ground test program at the Raytheon facility in El Segundo, CA, including component and instrument level testing from early 2019 to early 2021. For the instrument level testing, test phases included ambient, vibration, EMI, and thermal vacuum. The focus of this work will be results derived from the instrument test phases in ambient and thermal vacuum. Limited additional testing is slated to take place at the spacecraft vendor (Northrup Grumman in Gilbert, AZ) prior to launch.
For the ambient phase of testing, VIIRS was mounted on a rotary table with the scan plane oriented perpendicular to gravity. Various sources could then be viewed in the Earth view depending on the test performed. Tests performed included preliminary RSB, TEB, and DNB radiometry, response versus scan angle, polarization sensitivity, relative spectral response, crosstalk (static and dynamic), near-field response, and stray light rejection. Because the radiometry tests in ambient are to check whether the calibration is consistent with predictions, and are superseded by thermal vacuum testing, they will not be discussed in this work. The other major tests are described briefly below. The response versus scan angle (or RVS) test is designed to measure the scan-angle-dependent reflectance of the HAM. This is accomplished by placing a source (an integrating sphere for the RSB/DNB and a blackbody for the TEB) in the Earth view and rotating the instrument to view this source at a number of different scan angles. The RVS results will be discussed in Section 3.4.3. The polarization sensitivity test uses an integrating sphere viewed through a sheet polarizer (rotated to produce linear polarization at different angles) to measure the sensitivity of VIIRS VisNIR bands to polarized light. Polarization results are presented in Section 3.4.1. The relative spectral response (or RSR) test is performed using a laser-based source provided by NASA known as GLAMR [11] and is used only for the RSB. This test measures the spectral acceptance for each band at the system level. The results from the RSR analysis are described in Section 3.4.2. Crosstalk is measured using slit illumination of a single detector (for static) and various slit configurations (for dynamic). The response in all other bands is measured and any undesired signal is flagged as crosstalk. Static and dynamic measurements were made where the instrument stares at or scans the source, respectively. In general, the crosstalk performance was comparable to JPSS-1 and JPSS-2 (SNPP did show some optical crosstalk in the VisNIR bands, due to scattering beneath the filter assembly, which was corrected for later builds). The scattered light performance is captured in two tests: near-field response (or NFR) and stray light rejection. The NFR test is designed to measure the scattered light performance within about a 4-degree cone of the line of sight. A high-intensity source with a slit narrower than the detector is used to measure this performance. The results of the NFR analysis are described in Section 3.4.4. For scattered light outside the 4-degree cone, the stray light rejection test uses a studio lamp placed at various positions in front of the instrument to simulate light from the Earth disk entering the telescope. The stray light analysis results are presented in Section 3.4.5.
Thermal vacuum testing was performed to measure the final radiometry as well as the spectral response. VIIRS was placed inside a vacuum chamber with some thermal sources inside the chamber, but many sources outside, which were viewed through one of two windows in the chamber wall. The main tests of interest here were the RSB, DNB, and TEB radiometry and stability, as well as the RSR. The TEB uses a cavity blackbody as their main calibration target that covers the required dynamic range (as well as a high-temperature source for M13 low gain and a cold target for offset subtraction). The radiometric calibration (relating the digital counts to the input radiance) is performed by transitioning this blackbody through a series of discrete temperature levels covering the dynamic range of the TEB. The main calibration target for the RSB/DNB is a 100 cm integrating sphere located outside the chamber. It has a number of different lamps which can be turned on in various combinations; this provides illumination levels covering the dynamic range for most bands (a separate high-radiance integrating sphere is used to cover the remainder). This allows for the radiometric calibration of both the RSB and DNB. The integrating sphere and blackbody are also held at one level to test the stability of the instrument versus the following: time, instrument temperature changes, Bus voltage changes, and cold focal plane temperature changes (for the bands above 1 μ m). The RSB, DNB, and TEB radiometry results are discussed in Section 3.1Section 3.3. The relative spectral response (or RSR) test is performed using a double monochromator. This is the baseline test and it characterizes the spectral acceptance for all bands. The results from the RSR analysis are described in Section 3.4.2.

3. JPSS-3 Pre-Launch Performance

This section will review the pre-launch performance and characterization of the JPSS-3 VIIRS instrument. The analysis methodology was discussed in earlier works and will not be repeated here as the ground test programs were very similar [4,12]. The radiometric performance is divided into sections based on the band groupings described above (RSB, DNB, and TEB), and the other performance assessments listed in Section 3.4 may pertain to one or more of these groupings. Where appropriate, the performance metrics will be assessed against design requirements [10]. As this is an overview, the discussion focuses on the most important calibration metrics.

3.1. RSB Radiometric Performance

The performance of the reflective bands was measured under environmental conditions at the sensor level. This testing was used to determine the calibration coefficients necessary to retrieve the TOA (top of atmosphere) radiance on-orbit. A 100 cm spherical integrating source was used to illuminate VIIRS with 38 different light levels (achieved through various combinations of lamps) which covered the dynamic range of all RSB except M1–M3 low gain (a separate high radiance source was used to cover these). To minimize test artifacts due to source drift on the derived coefficients, measurements were performed with an attenuator in and out of the path; the ratio of the two measurements across the various light levels was then used to estimate the coefficients of the quadratic polynomial relating the radiance to the offset corrected detector response (see [4] for a derivation of the methodology). The derived coefficients (defined as c 0 , c 1 , and c 2 ) are discussed below [13].
The offset term, defined here in the ratio c 0 / c 1 , is small for most bands, on the order of 0.3 or less (M1 low gain), and is generally much less. The detector pattern does not show a great deal of variation, nor does the variation with instrument condition or electronic side. In practice, the offset may be set to zero for use in the on-orbit calibration, as was set for JPSS-1 VIIRS. The offset term is plotted in Figure 1 in the middle panel; black and blue denote the high- and low-gain offsets, respectively. Note that for M1 and M2 low gain, the offset is less well defined due to the use of the high radiance source.
The linear coefficient ( c 1 ) is graphed in Figure 1 in the upper panel. Again, black and blue denote the high- and low-gain offsets, respectively. The gains vary from band to band as the expected on-orbit ranges that need to be covered for science data are different. The low gain c 1 are much higher, as expected, relative to the high gain. There is some detector dependence, but retaining this dependence is necessary to ensure that striping is minimal on-orbit as each detector is slightly different. Variation across instrument conditions and electronics sides is small. On-orbit, the coefficient c 1 is updated using solar diffuser and SDSM measurements.
The nonlinear term (here defined as c 2 / c 1 ) is also small for most bands, on the order of 10 6 . There is some detector dependence in the low-gain bands M1–M3; this may result from the use of the high-radiance source instead of the standard integrating sphere. The nonlinear term is plotted in the lower panel of Figure 1. Again, black and blue denote the high- and low-gain offsets, respectively. Variation with instrument conditions (instrument temperature or electronic side) were small. The small size of the nonlinear terms for JPSS-3 indicates that there is no significant nonlinearity. On JPSS-1, nonlinearity was observed for the SWIR bands due to a hardware problem (see [14]); for JPSS-2, the hardware was corrected, and the nonlinearity was not observed. This coefficient ratio and c 0 / c 1 , together with the temperature sensitivity parameters, will be used to derive the parameter tables that will be employed in the on-orbit calibration.

3.1.1. Stability

Radiometric stability was assessed for the RSB by viewing an actively monitored source at a single illumination level while varying different instrument conditions separately (including instrument temperatures, time, and bus voltage). A design requirement limits the variability of the gain between two successive calibrations to less than 0.3%. Two successive calibrations are here taken to mean the time between two views of the Sun through the solar diffuser view on-orbit, or about 100 min. The temperature sensitivity is evaluated by varying the analog signal processor (ASP) and FPA/optics module temperatures. Among the VisNIR bands, bands M5, M7, I1, and I2 show the most sensitivity (0.5% to 0.6%) to temperature changes of about 5 K. In the case of SWIR bands, the largest dependence is observed for band M8 (0.4%). Although, at first glance, the variation appears to be higher than the 0.3% requirement, the variation that is expected to occur on-orbit (about 2 K) is a fraction of that measured on the ground; as a result, all RSB are projected to meet this requirement. Variations with temporal or bus voltage changes were similarly small, both within the 0.3% limit between calibrations. In particular, the gain variation with instrument temperature is necessary to adjust the parameter tables used to perform the calibration after launch. The variations observed for earlier builds were consistent with those observed for JPSS-3.

3.1.2. Dynamic Range

The dynamic range of the reflective bands was assessed by measuring the saturation radiance, L S A T , and comparing it to L M A X (listed in Table 1). The measured band average L S A T are listed in Table 3 both in radiance and in ratio to L M A X . JPSS-1 and JPSS-2 results are included for comparison. All bands for JPSS-3 saturate above L M A X , with margins ranging from 3% (M8) to 54% (M9). Bands I3 and M8 had saturated early on previous builds. Digital saturation was observed for bands M2–M7, M9–M11, and I1 (analog saturation was observed for bands M4–M7 and M9–M10 at a radiance above digital saturation); analog saturation was observed for bands M8, I2, and I3. As a result of some hardware improvements in JPSS-2 and JPSS-3 VIIRS, the roll-over behavior for most bands is observed at larger radiance values compared to SNPP and JPSS-1. This is expected to decrease the number of roll-over pixels observed in the Earth scenes for JPSS-3 VIIRS on-orbit, particularly for band M6.

3.1.3. SNR Performance

As the radiometric tests were performed to measure the calibration coefficients, the SNR was also measured as a function of radiance level. A model was used to fit the measured SNR as the ratio of the radiance to the NEdL (as described in [4]), where the the NEdL is assumed to be a combination of thermal and shot noise contributions. The resulting function is then used to determine the SNR at L T Y P , which are listed in Table 4. These estimates are then compared to a sensor design requirement, expressed as a ratio (SNR/Spec). The values listed are band averages; the detector dependence of the SNR is small with no significant outliers. All bands exceed the SNR specification generally by large margins (between 1.46 times for M5 high gain to 29.66 times for I3). JPSS-1 and JPSS-2 results are also shown for comparison, indicating similar levels of performance.

3.1.4. Uniformity

A detector-to-detector uniformity metric which provides an assessment of the potential for striping on-orbit was computed as the integrating sphere radiance per detector relative to the average, normalized to the noise equivalent radiance change (NEdL). This metric is calculated for every lamp level used during testing; a design requirement states that the detector-to-detector uniformity should be less than unity between L M I N and 0.9 L M A X . All the RSB detectors showed compliance with this specification across various instrument conditions, indicating that the potential for striping is low. The performance assessment for JPSS-1 and JPSS-2 was similar to JPSS-3 in that the potential for detector-to-detector striping was limited.

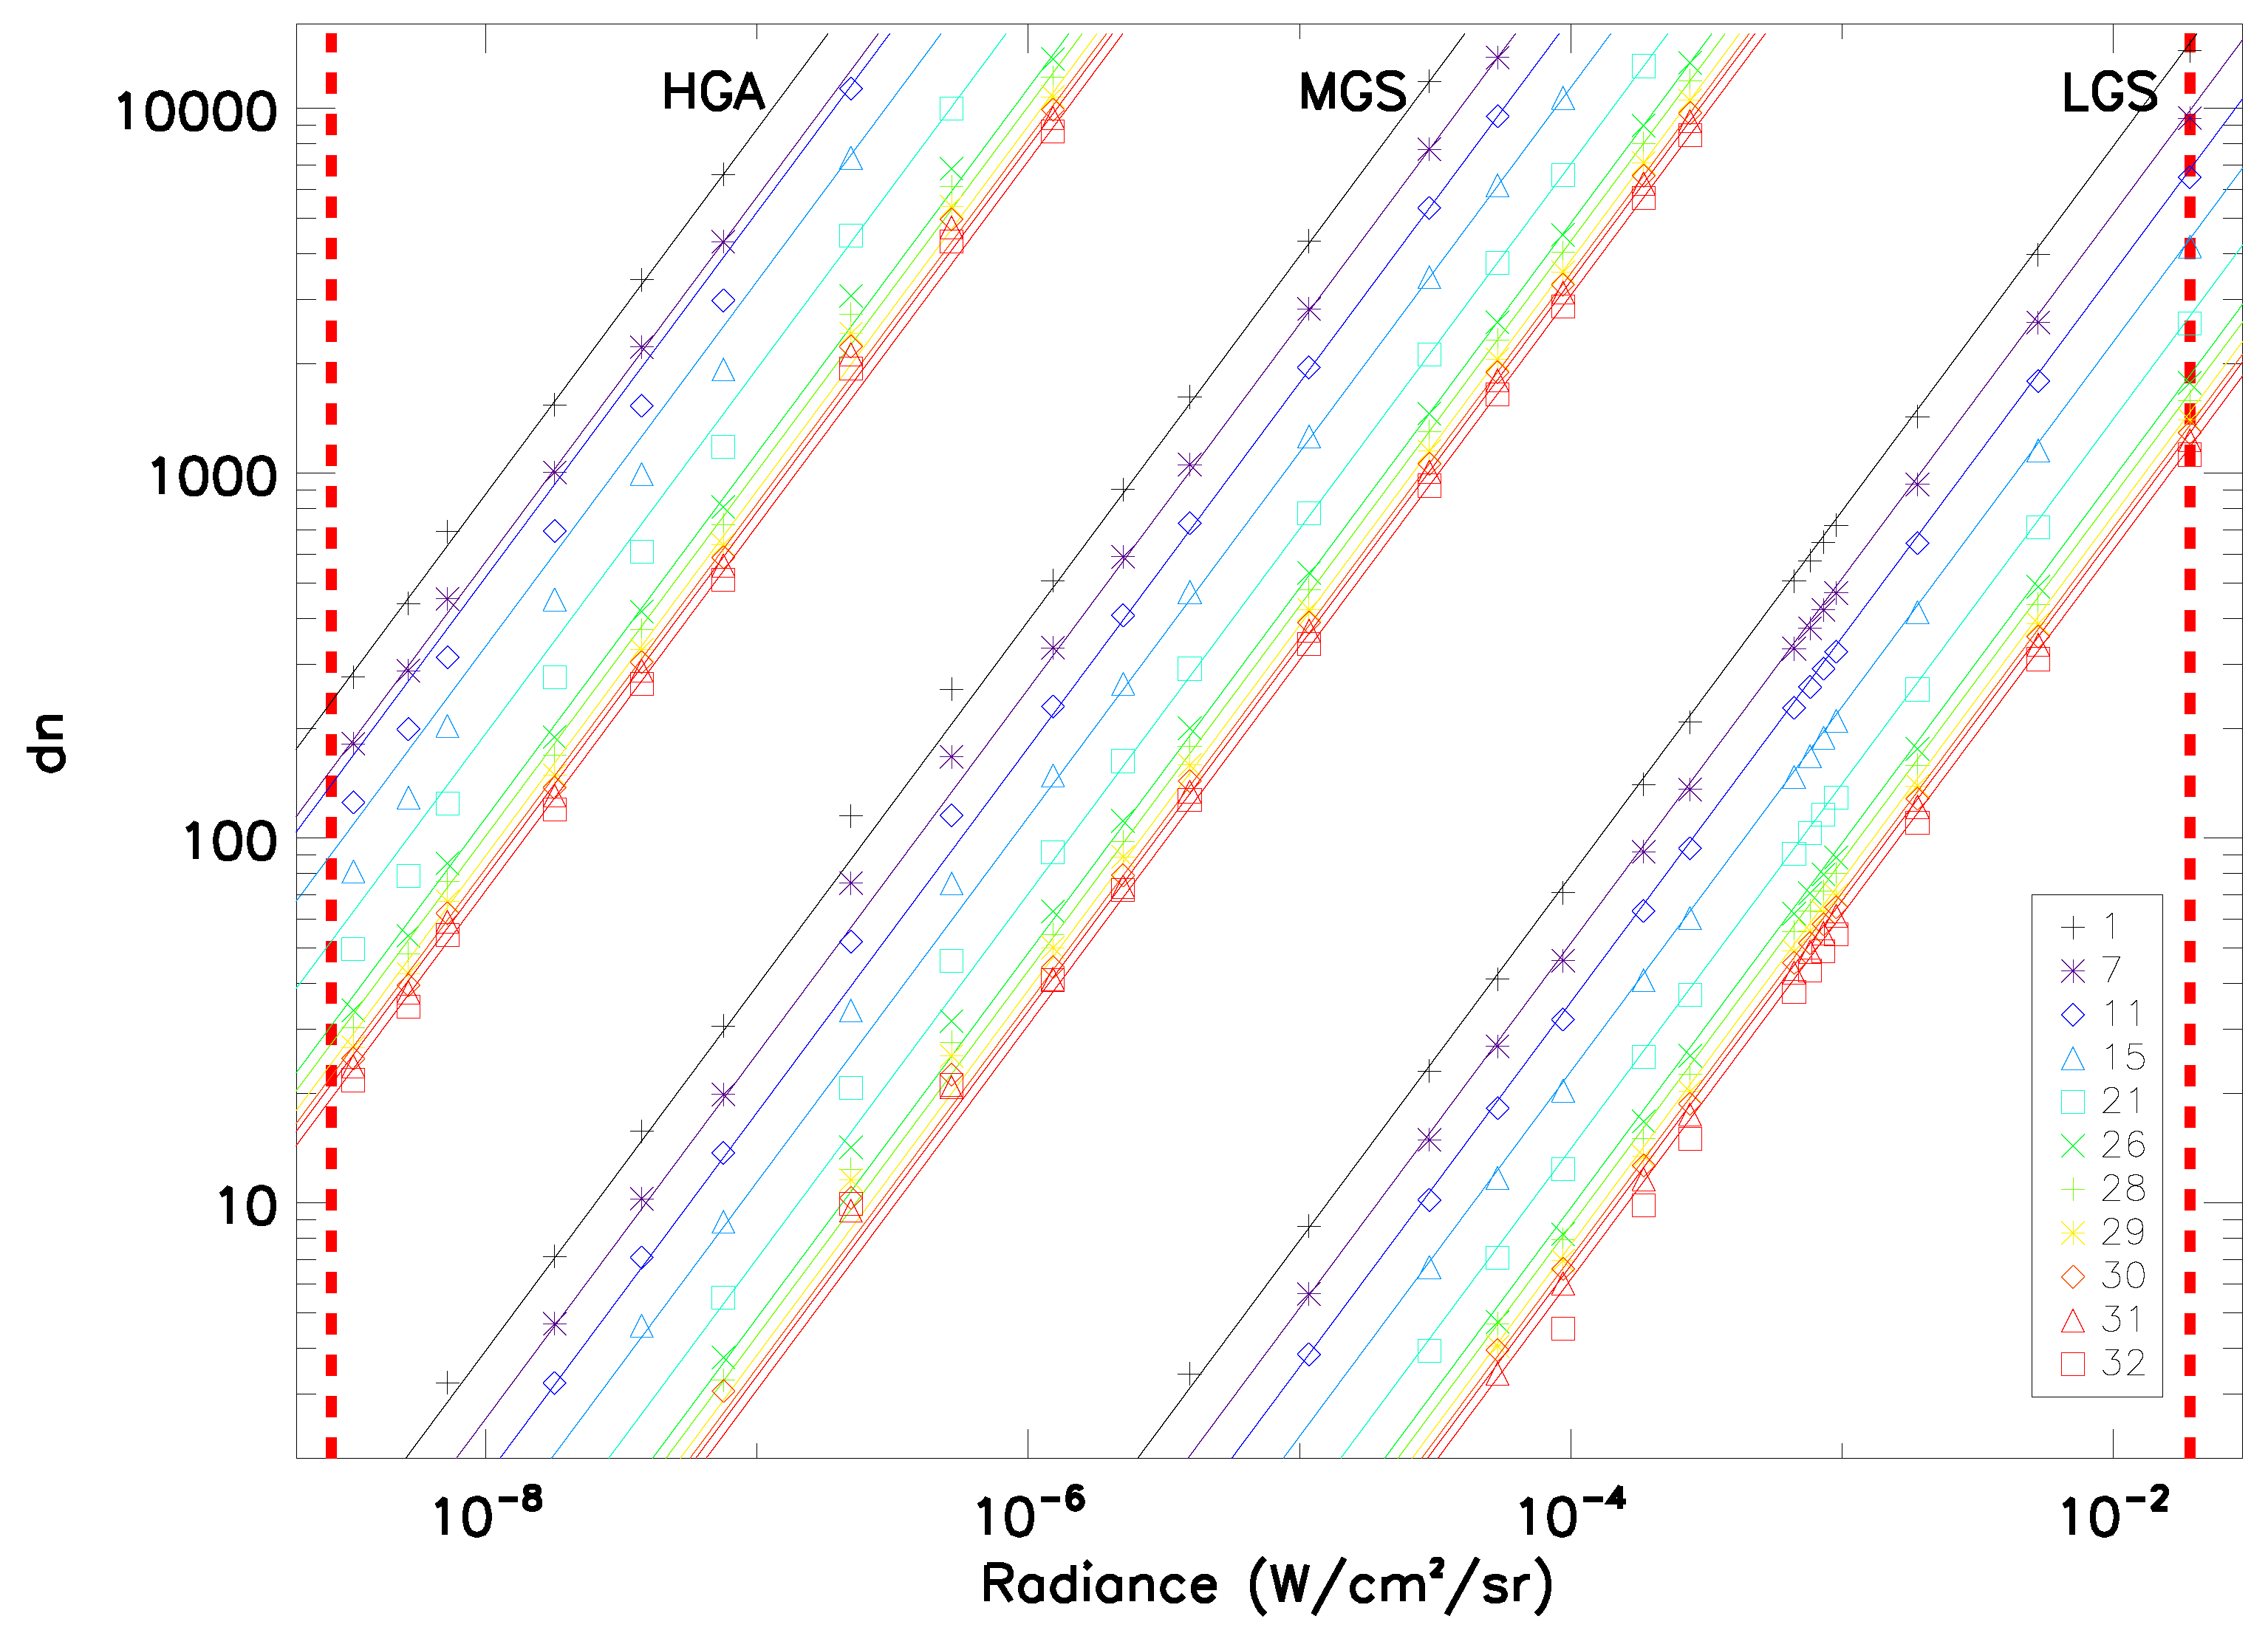
3.2. DNB Radiometric Performance

Because the DNB FPA is cooled, the final radiometric calibration of the DNB was made during environmental testing at the sensor level [15,16]. The DNB radiometric calibration requires two offset tables and a linear coefficient. One offset table is applied in the flight software and the second table is applied in the ground calibration. The onboard table is intended to flat-field the DNB to a set target value which allows the gain selection and radiation detection algorithms to operate whilst the ground table removes any remaining offset. The linear coefficient then relates the calibrated radiance to the digital counts.
The onboard offset table was measured by filling the table with zeros and then measuring the DNB response to a dark target. The tables are designed to flat-field the DNB to a set target value of 350 for HGA and HGB, 200 for the MGS, and 60 for the LGS in 14-bit DN. For JPSS-3, some detectors and pixels in the HGS were found to have high values for this table, which affected the gain selection logic. Corresponding changes were made to the saturation threshold to keep the offset target value of 350. The onboard table, however, does not fully account for the offset as it is not HAM-side-dependent nor does it account for any temporal drift. A second test was performed using the newly created onboard offset table, and the remaining variation from the flat field was incorporated into the ground offset table. The variation from the onboard table was observed to be less than 1.5 counts. Comparisons of the ground offsets from HGA and HGB showed less than three counts difference; if there was a large offset difference, the calibration would be poor when a radiation strike causes the selection logic to choose either HGA or HGB only.
A linear model is used to convert the digital counts to radiance for the DNB, and since the DNB is already flat-fielded through the two offset tables, only the gain is calculated. Due to the operation of the DNB, the gain must be determined for every aggregation mode and detector. An example of the radiance versus digital counts for select aggregation zones is plotted in Figure 2 for all three gain stages. The fits are performed between the specified dynamic ranges for each gain stage (as defined either by L M I N or the gain transition point on the low end and the gain transition or L M A X on the high end). Overall, the relationship between radiance and dn was well behaved, and the large nonlinearity in HGS near the end of scan that was present in JPSS-1 was not observed. Nonlinear behavior was observed in the LGS at low radiance for some aggregation modes. This behavior was the largest in mode 29 and resulted in linear fit residuals greater than the calibration uncertainty at the LGS–MGS transition. The nonlinearity is sample-dependent. Modifications to the on-orbit calibration are being developed to mitigate this and prevent the nonlinearity from propagating errors to the other gain stages. The fit residuals are within the specified calibration uncertainty of 5% at L M A X , 10% at the transition from LGS to MGS, 30% at the transition from MGS to HGS, and 100% at L M I N , with the exception of the aforementioned mode 29 in the LGS. These gains will be used to create initial parameter tables for use on-orbit (one for the LGS gains and one for the gain ratios of MGS/LGS and HGS/LGS).

3.2.1. Dynamic Range and Stability

During the radiometric calibration tests, the LGS was assessed for saturation before L M A X using the highest measured light levels; saturation was observed on JPSS-3 for a few detectors in aggregation mode 1, which also occurred on earlier builds. In addition, the gain selection logic was operating as expected, so that early saturation did not occur prior to transitioning to the next highest gain stage.
Concurrent with the RSB testing, the stability of the DNB versus changes in instrument conditions (instrument temperature, time, and bus voltage) was measured by viewing an actively monitored source of fixed intensity. The DNB variation did not exceed ∼1% for any measurement, which is comparable to earlier builds.

3.2.2. SNR Performance

The DNB evaluates its sensor design requirement for SNR at L M I N with a lower limit of 6 for scan angles less than 53 degrees off-nadir (or aggregation modes 1–27) and 5 for higher scan angles (aggregation mode 28–32). Because L M I N for the DNB is very low (see Table 1), the laboratory measurements did not reach this level; as a result, the two lowest radiance levels were used to linearly extrapolate to L M I N . The resulting SNR estimates show all aggregation modes met the specification with healthy margins. JPSS-1 had some difficultly with this requirement as the DNB exhibited some nonlinearity for the high numbered aggregation zones; for JPSS-2, the SNR was comparable to JPSS-3.

3.2.3. Uniformity

The uniformity of the DNB data is evaluated in two ways: inter-aggregation zone uniformity and intra-aggregation uniformity. These assess the uniformity between aggregation modes in a scan line and the uniformity between detectors for a given aggregation mode, respectively, when viewing a uniform scene. These metrics are designed to assess the potential for striping between aggregation modes or between detectors. While there are limited noncompliances in higher aggregation modes for the intra-aggregation mode uniformity (modes 14, 15, 20, 21, 24, 25, 28, 29, and 30 for LGS and 29 and 32 for MGS), the results are similar to previous builds. The inter-aggregation mode uniformity is more difficult to meet, and many mode transitions in the LGS and MGS had at least one detector out of compliance. There were more limited noncompliances in HGA and HGB. This is consistent with the previous VIIRS instruments’ performance. Given the performance of the DNB on-orbit onboard SNPP or JPSS-1, these noncompliances indicate that the potential for striping is limited.

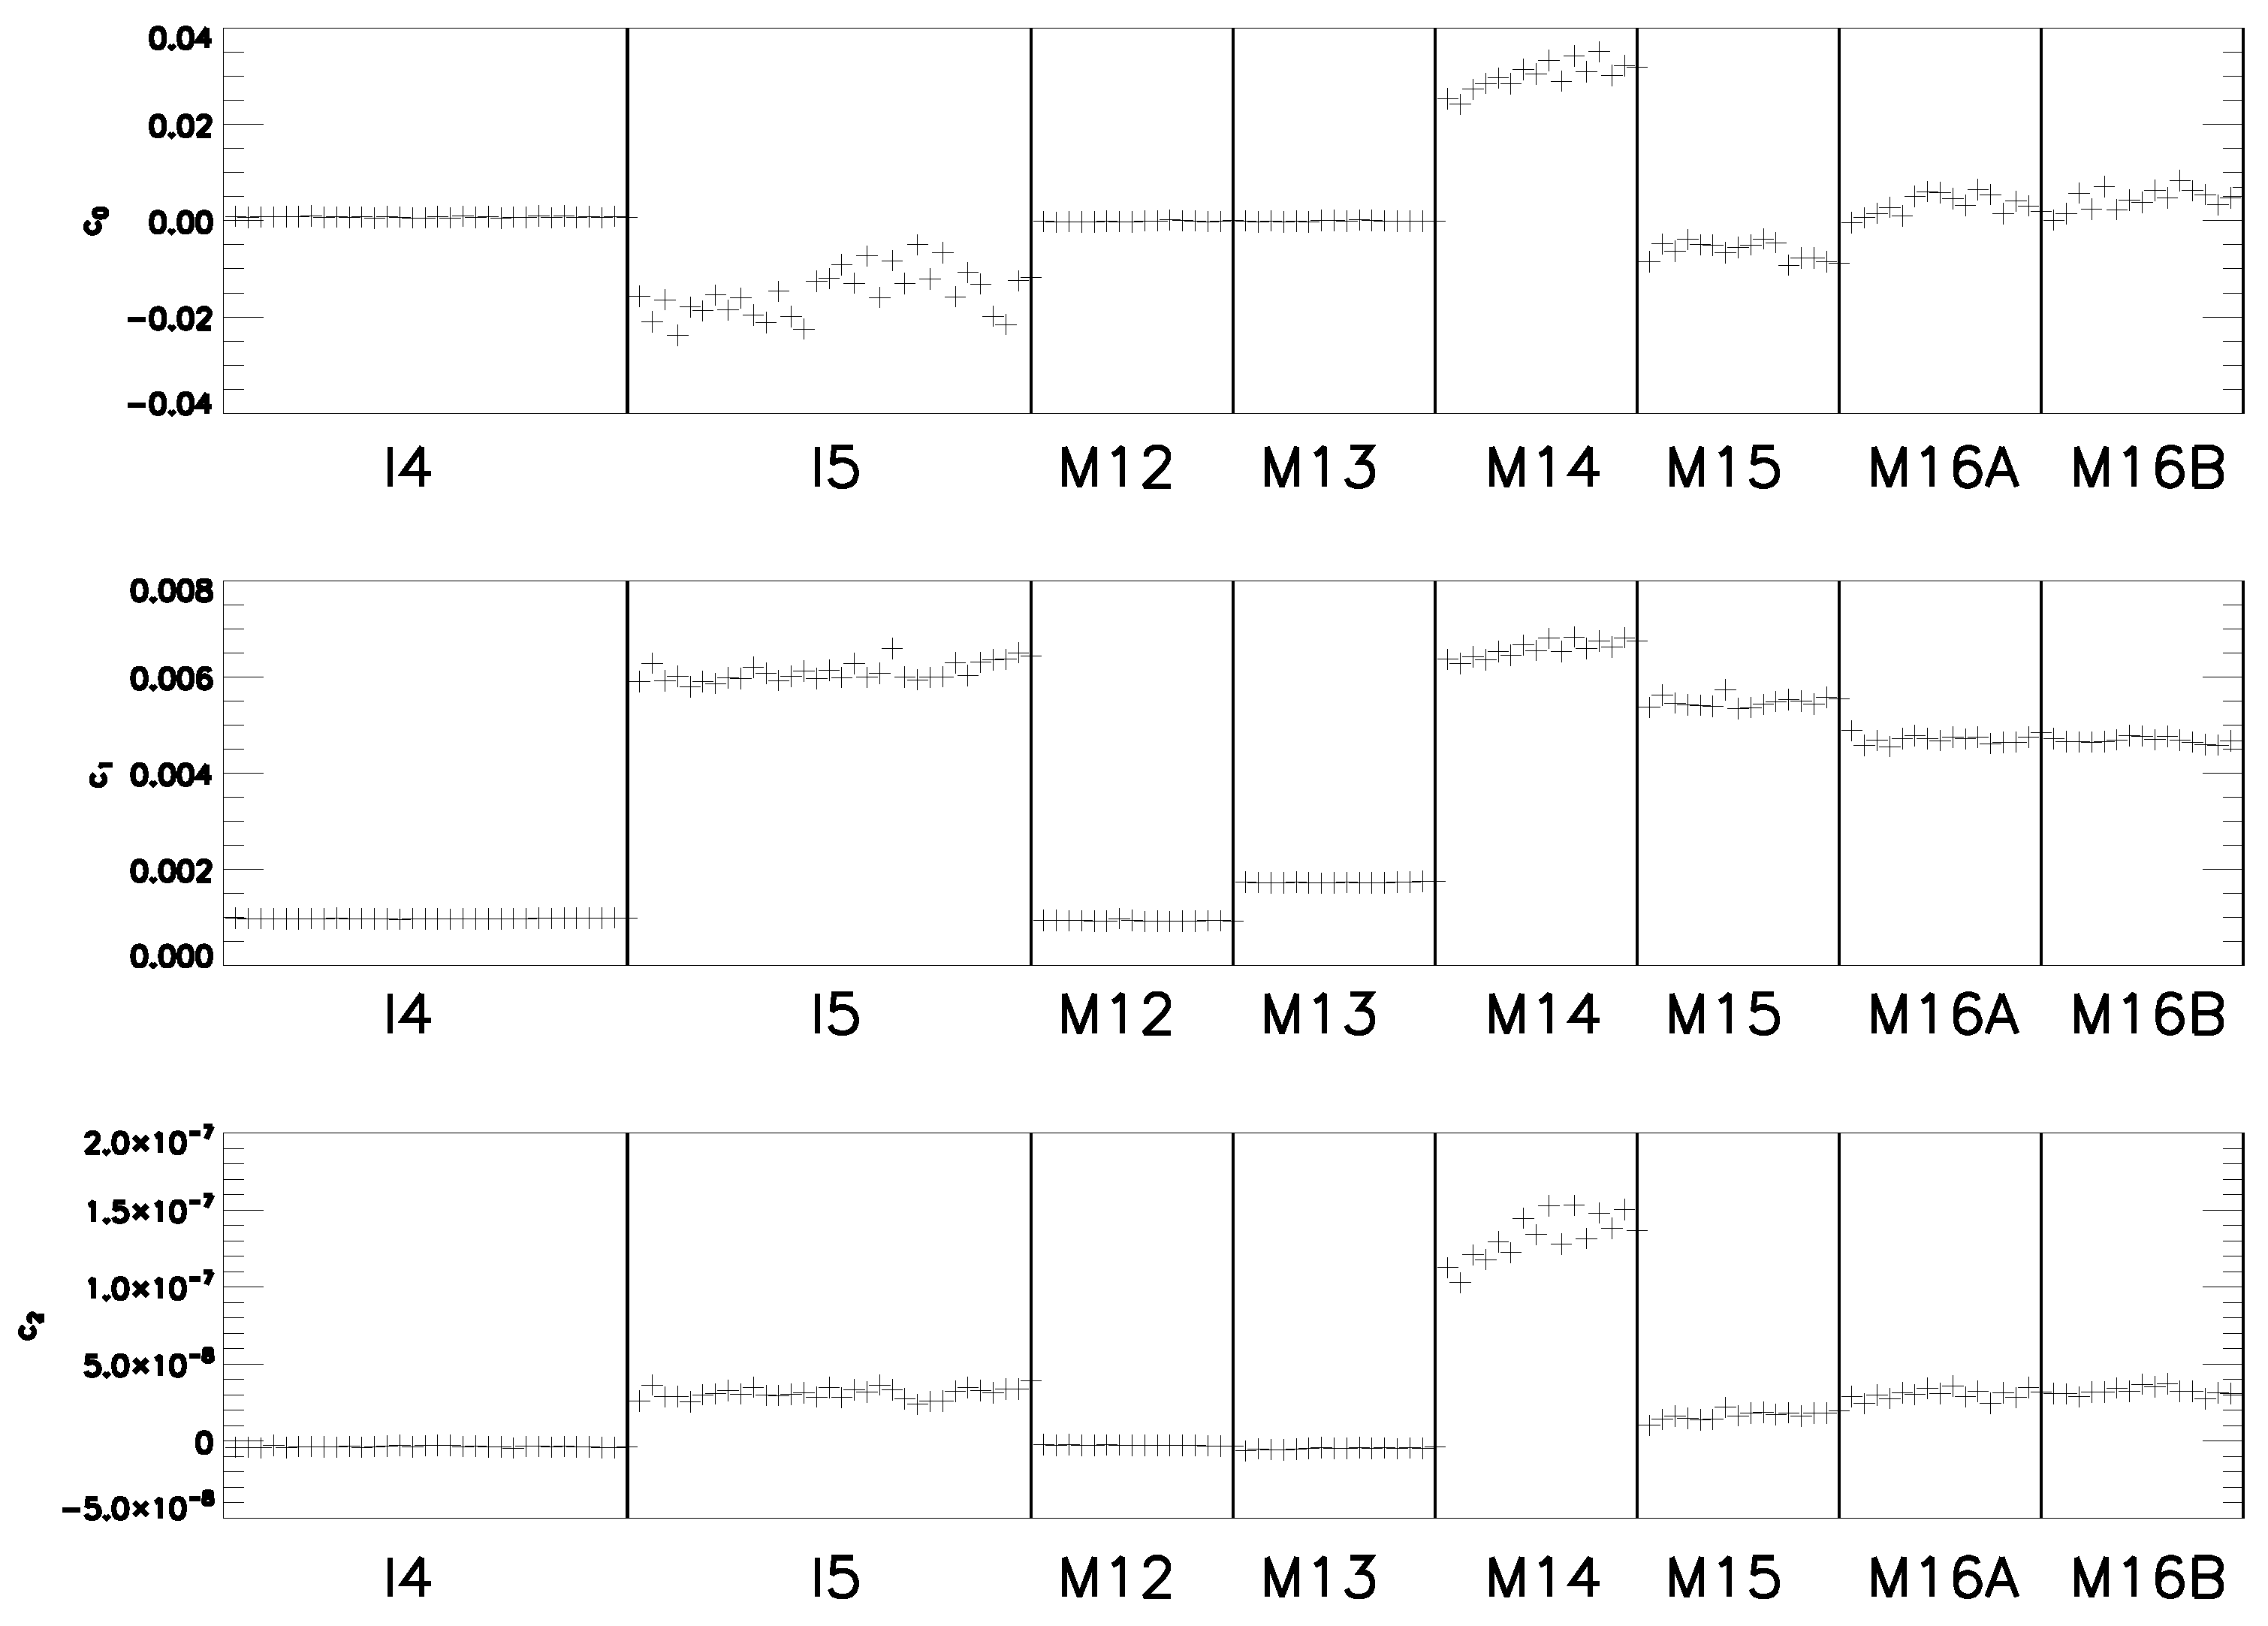
3.3. TEB Radiometric Performance

The thermal band radiometric performance was measured during environmental testing at the sensor level from which the calibration equation coefficients were determined, which are critical to retrieving the TOA radiance once on-orbit. The measured at-aperture scene radiance was fit to a quadratic function in the offset-corrected measured detector response using all available source levels not contaminated by saturation at high temperatures or by noise at low temperatures. The resulting three fit coefficients are discussed below. Examples of the coefficients at nominal instrument conditions and electronics side A are shown in Figure 3; low gain for band M13 was not included in the figure.
In general, the offset coefficient ( c 0 ) is on the order of 10 2 or less and is roughly consistent over instrument conditions and electronics sides. M14 had the largest offsets, with absolute values up to ∼0.04 W/m 2 /sr/ μ m. The detector dependence is fairly stable versus instrument condition for the LWIR; some variation is observed in the MWIR. While there is a good deal of detector variation in the c 0 trends versus instrument temperature, it should be noted that the variation of the offset with temperature is on the order of 10 2 or less and that the two sigma uncertainties overlap for nearly all bands and detectors (electronics side dependent). As a result, c 0 is consistent over instrument temperature conditions; there is similar consistency over the cold FPA (or CFPA) temperature changes measured.
The detector-to-detector gain (1/ c 1 ) patterns are very consistent across instrument conditions and electronics sides. There is some small odd–even difference in M14, and detector 7 in both M12 and M15 is slightly out-of-family. The gains trend fairly linearly over instrument temperature for both electronics sides. In addition, the gains for most bands tend to decrease with instrument temperature. In general, the LWIR bands change by less than 3% and the MWIR bands change by less than 1% over the ∼10 K instrument temperature range (note this range for JPSS-3 was half that measured on earlier builds, to more accurately reproduce on-orbit experience from SNPP and JPSS-1). Here, the temperature variation is outside the 2-sigma uncertainties for most bands. In addition, the electronics sides are generally not consistent for the LWIR bands. For the MWIR, the gains are consistent versus CFPA temperature; however, for the LWIR, the gain decreases with increasing CFPA temperature by between 4% and 8% for every 2 K.
For the LWIR bands, the detector pattern of the nonlinear term ( c 2 ) is roughly constant over instrument conditions and electronics; however, for the MWIR, the pattern is less well defined. In terms of magnitude, the nonlinear term is consistently below 2 × 10 7 . For most bands and electronic sides, the nonlinear term does not appear to vary significantly with instrument temperature. For the majority of cases, the 2-sigma uncertainties overlap. Variation with CFPA temperature was very small for the MWIR, while c 2 increases with increasing CFPA temperature for the LWIR.
The operational CFPA temperatures are uniquely set for each build from a set of three hardwired set points (which are build-specific). The setting selected for nominal operations for SNPP, JPSS-1, JPSS-2, and JPSS-3 was 80 K, 80.5 K, 82 K, and 82 K, respectively. Changes in the CFPA temperature have large effects on the gains for the LWIR bands (between 3% and 10% for 2 K), but limited effects for the MWIR bands. As a result, there will be some variation between builds due to the different FPA settings (which are selected based on the thermal margin of the cryo-radiator). The offset and nonlinear terms are less affected, but there is still some small effect.

3.3.1. Stability

The radiometric stability for the TEB was measured similarly to the RSB, by viewing an actively monitored source at a single illumination level while varying different instrument conditions (instrument temperature, time, bus voltage, and FPA temperature). A design requirement applies to the TEB stability, such that the variation in gain is limited to 0.1% between successive calibrations on-orbit (for the TEB this is every other scan, or about 3.6 s). For time and bus voltage, the variations were small, with maximums of ∼0.2% over more than 4 h and less than 0.05% over 6 V, respectively. For instrument temperature, the variation with ASP and optics module temperatures were measured to be up to about 1% for the LWIR bands and less than 0.2% for the MWIR bands. There was significant change with FPA temperature for the LWIR bands (between 3% and 10%), while the MWIR bands showed minor variation (below 0.2%). Since the LWIR bands gain varies significantly with FPA temperature, this has an effect on the dynamic range when testing at different FPA set points, or comparing across VIIRS builds with different operational FPA temperatures. As with the RSB, the variation with instrument temperatures is used to adjust the parameter tables used to calibrate the instrument once on-orbit (these values cannot be reproduced using on-orbit data). These results are largely in line with previous VIIRS instruments.

3.3.2. Dynamic Range

The dynamic range is defined on the high end by saturation and on the low end by an SNR limit of 3. All thermal bands saturate above the specified T M A X (see Table 5). Every thermal band digitally saturates first; two bands (I4 and M12) exhibit analog saturation at some higher radiance. For these two bands, the digital response decreases to, or close to, zero at the highest measured radiance levels. On-orbit, this results in two possible values for a given digital response; fortunately, scenes with temperatures above saturation for these bands are rare, and can be correlated to M13. The saturation temperatures are generally consistent between the different instrument temperatures measured to within ∼2 K and between electronics sides to within about 1 K. The detector dependence is largely the reflection of the detector gain dependence. Bands I4 and M12 saturate less than 10 K above the specified limit (see Table 5); bands M14, M15, and M16 saturate between 10 K and 15 K above their limits; bands I5 and M13 saturate more than 20 K above their limits. M13 low gain was observed to digitally saturate only in ambient testing; it is estimated to saturate at ∼675 K. JPSS-1 and JPSS-2 T S A T were also included in Table 5 for comparison; in general, they show similar behavior with changes due largely to changes in the gains (both from build to build variations and CFPA temperature differences). Note that bands I4 and M12 also exhibit analog saturation at temperatures above digital saturation, and as a result, the digital counts decrease at very high temperatures; similar behavior was observed on earlier builds. Additional measurements were made for JPSS-3 in an effort to characterize this roll-over region for use in fire detection.
For the low end of the dynamic range, an SNR threshold of 3 was used to assess the ability of VIIRS to measure low temperature scenes. The SNR at the low end of the dynamic range (as defined in Table 1) for bands M15, M16A, and M16B was over 100; for bands I5, M12, and M13, the SNR was between 10 and 30. However, the SNR fell below 3 inside the specified dynamic range for I4 and M14. In the M14 case, the large difference in RVS from space view to Earth view results in a negative offset corrected response at low scene temperatures; I4 has larger noise compared to band M12 (which is similar spectrally), and has a lower minimum scene temperature. These results were consistent with earlier VIIRS builds.

3.3.3. NEdT Performance

The NEdT as a function of scene temperature increases as the temperature decreases for all bands. For the LWIR, the NEdT is below 0.6 K, even at the lowest scene temperatures; for the MWIR, the NEdT increases to between 3 K and 6 K at 210 K (for M12 and M13) or at 230 K (for I4). The NEdT is consistent across instrument conditions, except for the slight increase with instrument temperature due to increasing dark noise. There is an instrument design requirement on the NEdT at a typical scene temperature (defined in Table 6); all bands were well within the required limits for all measured conditions (variations in instrument temperature, CFPA temperature, and electronics side). The NEdT at T T Y P is very consistent over the range of instrument conditions tested, both in terms of magnitude and detector dependence. The NEdT generally increases slightly with instrument temperature for all bands and both electronics sides. This is the result of the increasing dark noise in the detectors which occurs at higher instrument temperatures. The NEdT at T T Y P increases by up to 12% over the measured instrument temperature range of ∼10 K (with the MWIR increasing more than the LWIR). There is an slight increase in the NEdT at T T Y P with CFPA temperature for bands I5, M14, and M16, but for the remaining bands there is little to no change. Note that band M13 low gain was only measured at a CFPA temperature of 80 K due to test limitations; all other bands were measured at 82 K.

3.3.4. Uniformity

The potential for detector-to-detector striping was measured by comparing the difference of the retrieved radiance per detector from the average to the measured NEdL. A value greater than 1 will indicate the potential for striping. This uniformity metric generally increases with increasing scene temperature. For bands M12, M13, and M14, some striping is possible at the highest scene temperatures. At higher temperatures, the deviation of the retrieved radiance from the band average increases, but the measured NEdL levels off; the result is a steadily increasing uniformity metric. Instrument or CFPA temperature changes did not have a significant impact on the uniformity metric. There is a design requirement that applies between L M I N and 0.9 L M A X that was satisfied for all bands except for M12 at the highest scene temperatures (which is consistent with earlier VIIRS instruments).

3.3.5. Absolute Radiometric Difference

The absolute radiometric difference (ARD) is the percent difference between the calculated retrieved radiance and the theoretical scene radiance based on the source temperature measurements. The ARD for all LWIR bands is less than 0.2% above ∼210 K; this indicates that the fitting contribution to the radiance retrieval is very accurate for these bands. In contrast, the MWIR bands I4, M12, and M13 have an ARD of up to 0.8% above a scene temperature of 270 K; below 270 K, the MWIR ARD tend to increase dramatically. The MWIR bands are known to exhibit nonlinear behavior, especially below 270 K; the behavior observed in the ARD is the result of fitting residual error in the calibration coefficients. All bands are well within the stratified scene requirements (listed in Table 7 with comparisons to JPSS-1 and JPSS-2). The ARD are roughly consistent over all temperature conditions measured (instrument and CFPA) and electronics sides. In the MWIR, there is a slight constant bias of about 0.4–0.5% which results from the application of the scan-to-scan blackbody correction to the retrieved radiance.

3.4. Other Performance Assessments
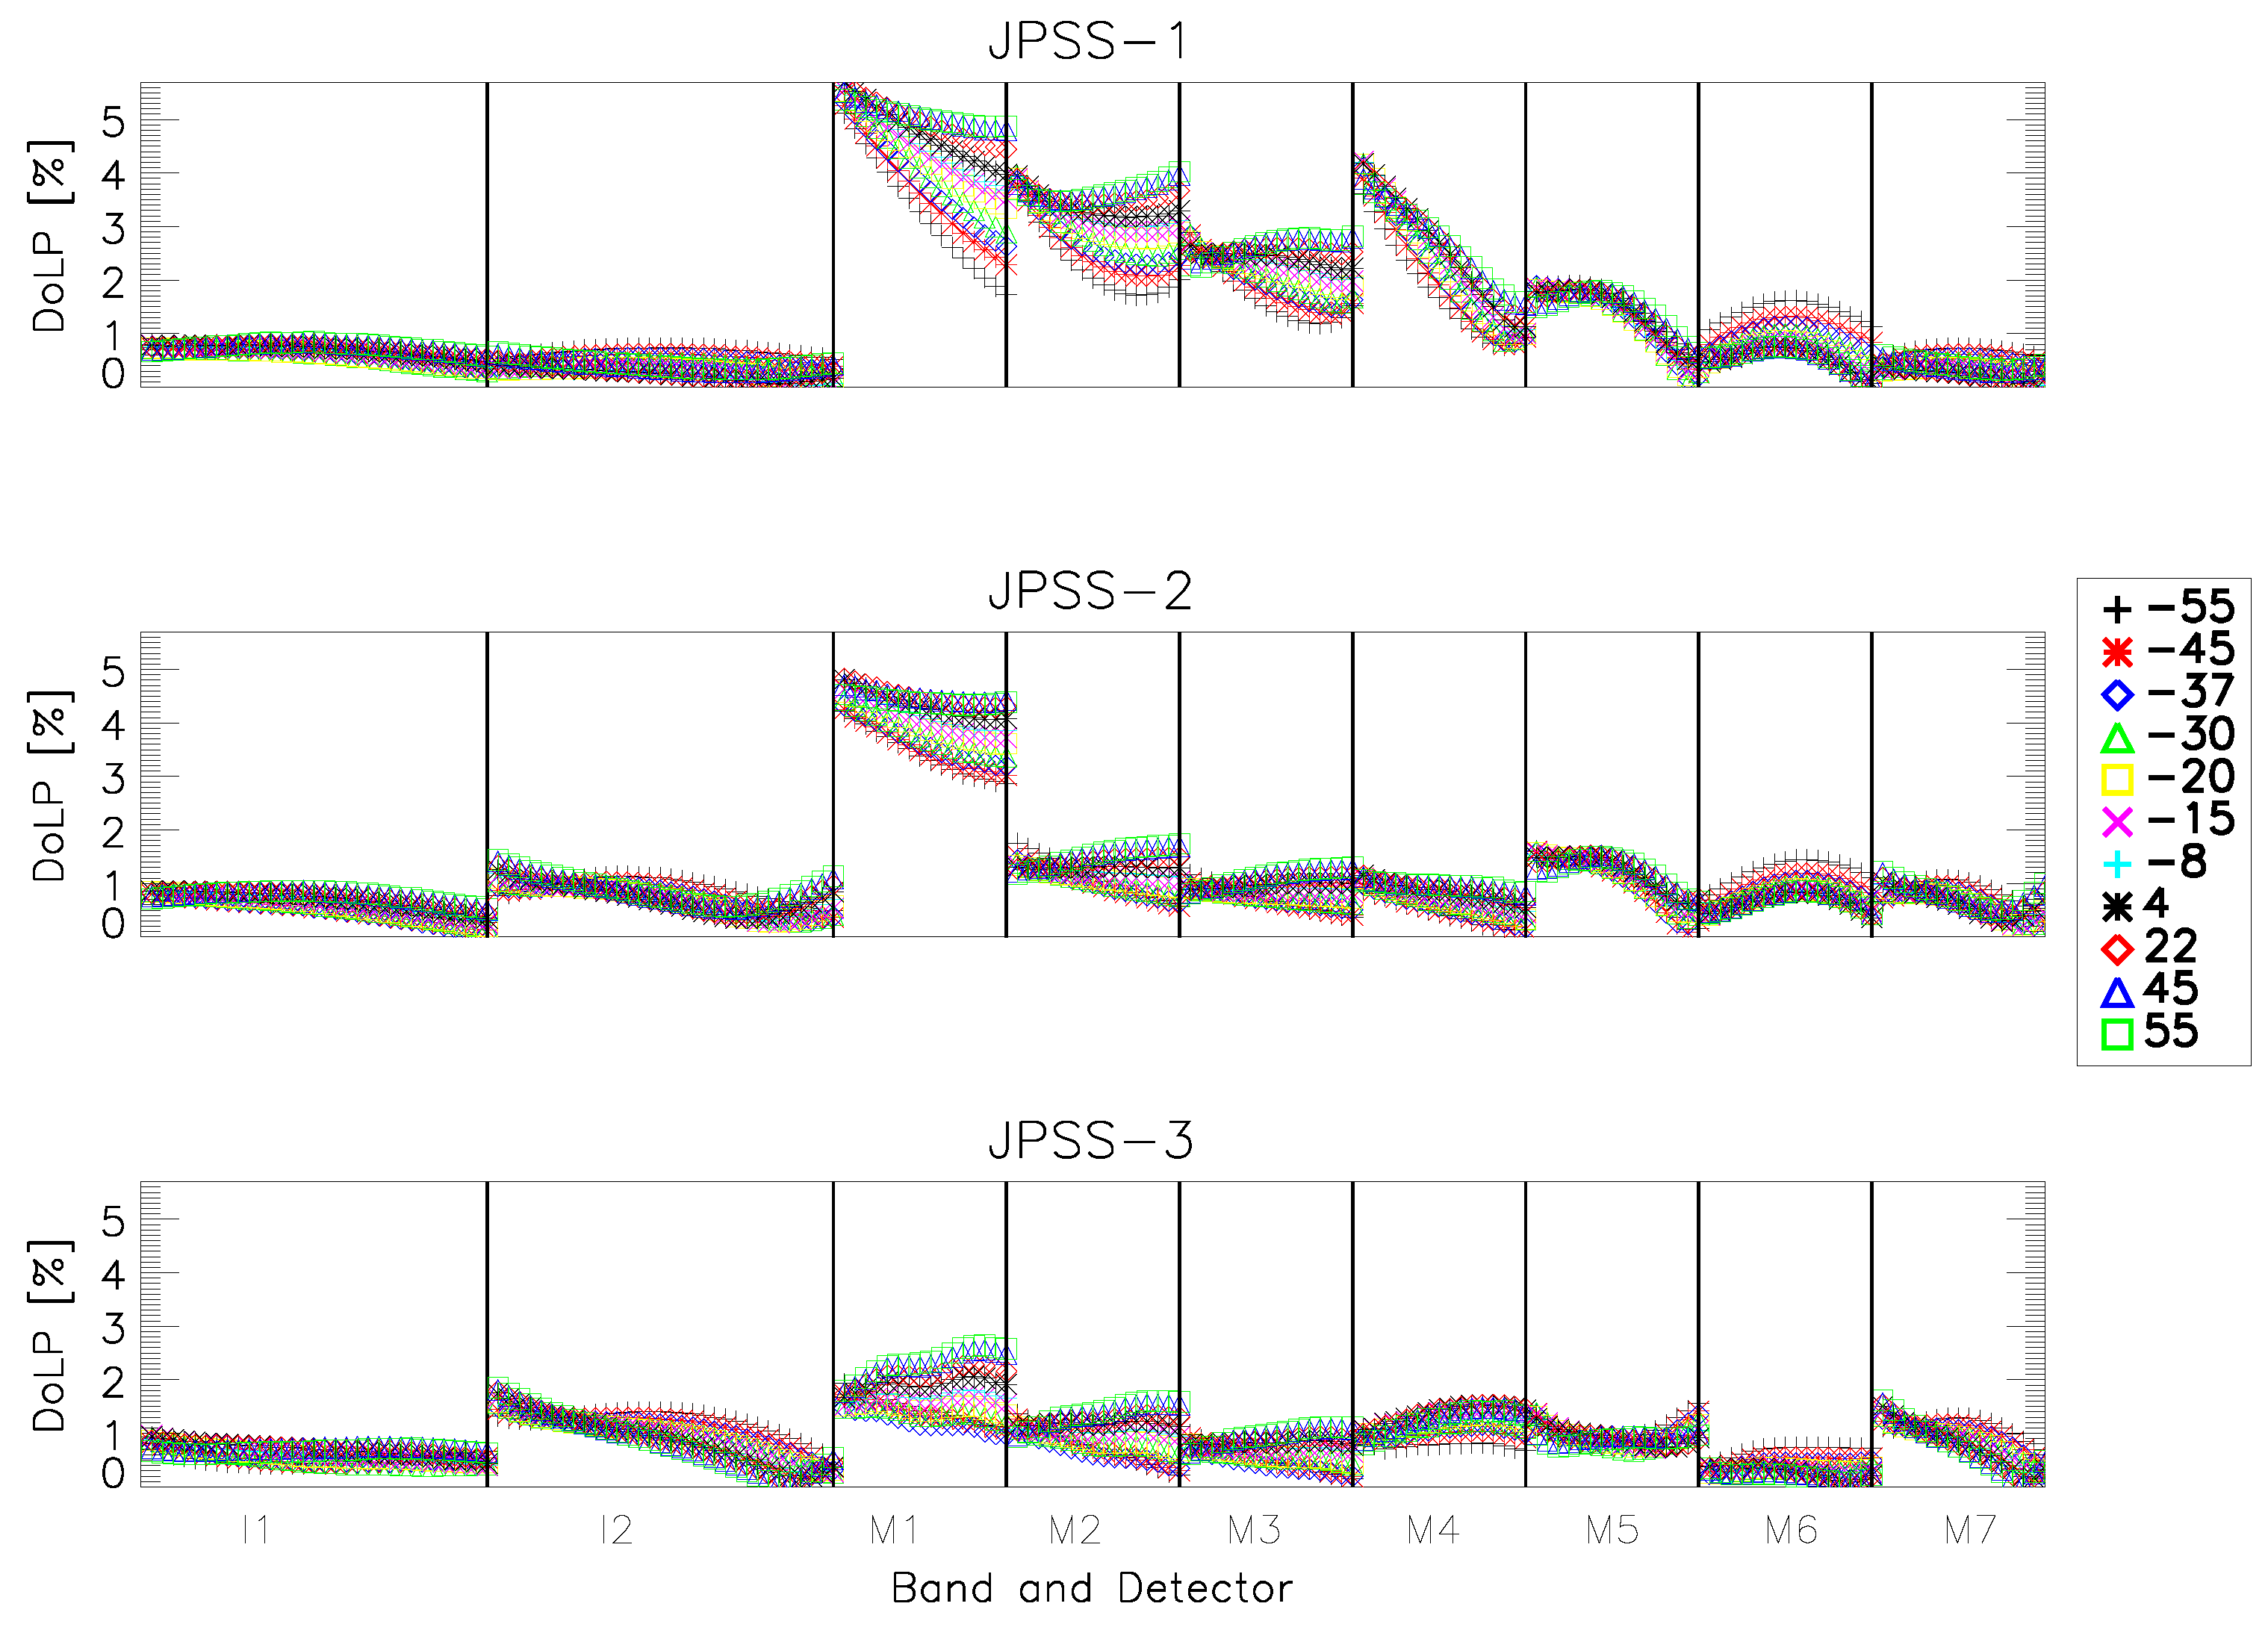
This sections reviews the most important calibration metrics not included in the above subsections on RSB, DNB, and TEB radiometry. Comparisons to earlier VIIRS builds are included where appropriate.

3.4.1. Polarization

The polarization sensitivity of the VisNIR bands was measured using an integrating sphere viewed through a sheet polarizer rotated 360 degrees in 15 degree increments. The test was performed at multiple scan angles (−55, −45, −37, −30, −20, −15, −8, 4, 22, 45, and 55 degrees). A Fourier analysis was performed where the two-cycle components representing the Mueller matrix components needed to make corrections on-orbit. The analysis methodology was described in detail for previous work for earlier builds [17] and is consistent with the present analysis.
The JPSS-3 amplitude of the polarization sensitivity (or DoLP, degree of linear polarization) is shown in Figure 4, in the bottom panel. The plot shows each band with the detectors plotted horizontally with increasing detector number. Results at different scan angles are shown by different colors indicated in the legend. All detectors, for all HAM sides and scan angles, met the sensor design specification (3% for bands M1, M7, and I2 and 2.5% for bands M2–M6 and I1) [10]. The largest polarization sensitivity was observed in band M1 at about 2.6%. The detector and scan angle dependence was relatively small (compared to previous builds). Large sensitivity was observed for JPSS-1 in bands M1–M4, with up to 6.3% in band M1; this larger-than-expected DoLP was traced to the filter design [17]. For JPSS-2, the sensitivities were reduced due to the filters being redesigned, but up to 4.7% DoLP was observed in band M1; the root cause was determined to be the design of the first dichroic. The redesign of this dichroic for JPSS-3 resulted in a greatly reduced sensitivity.

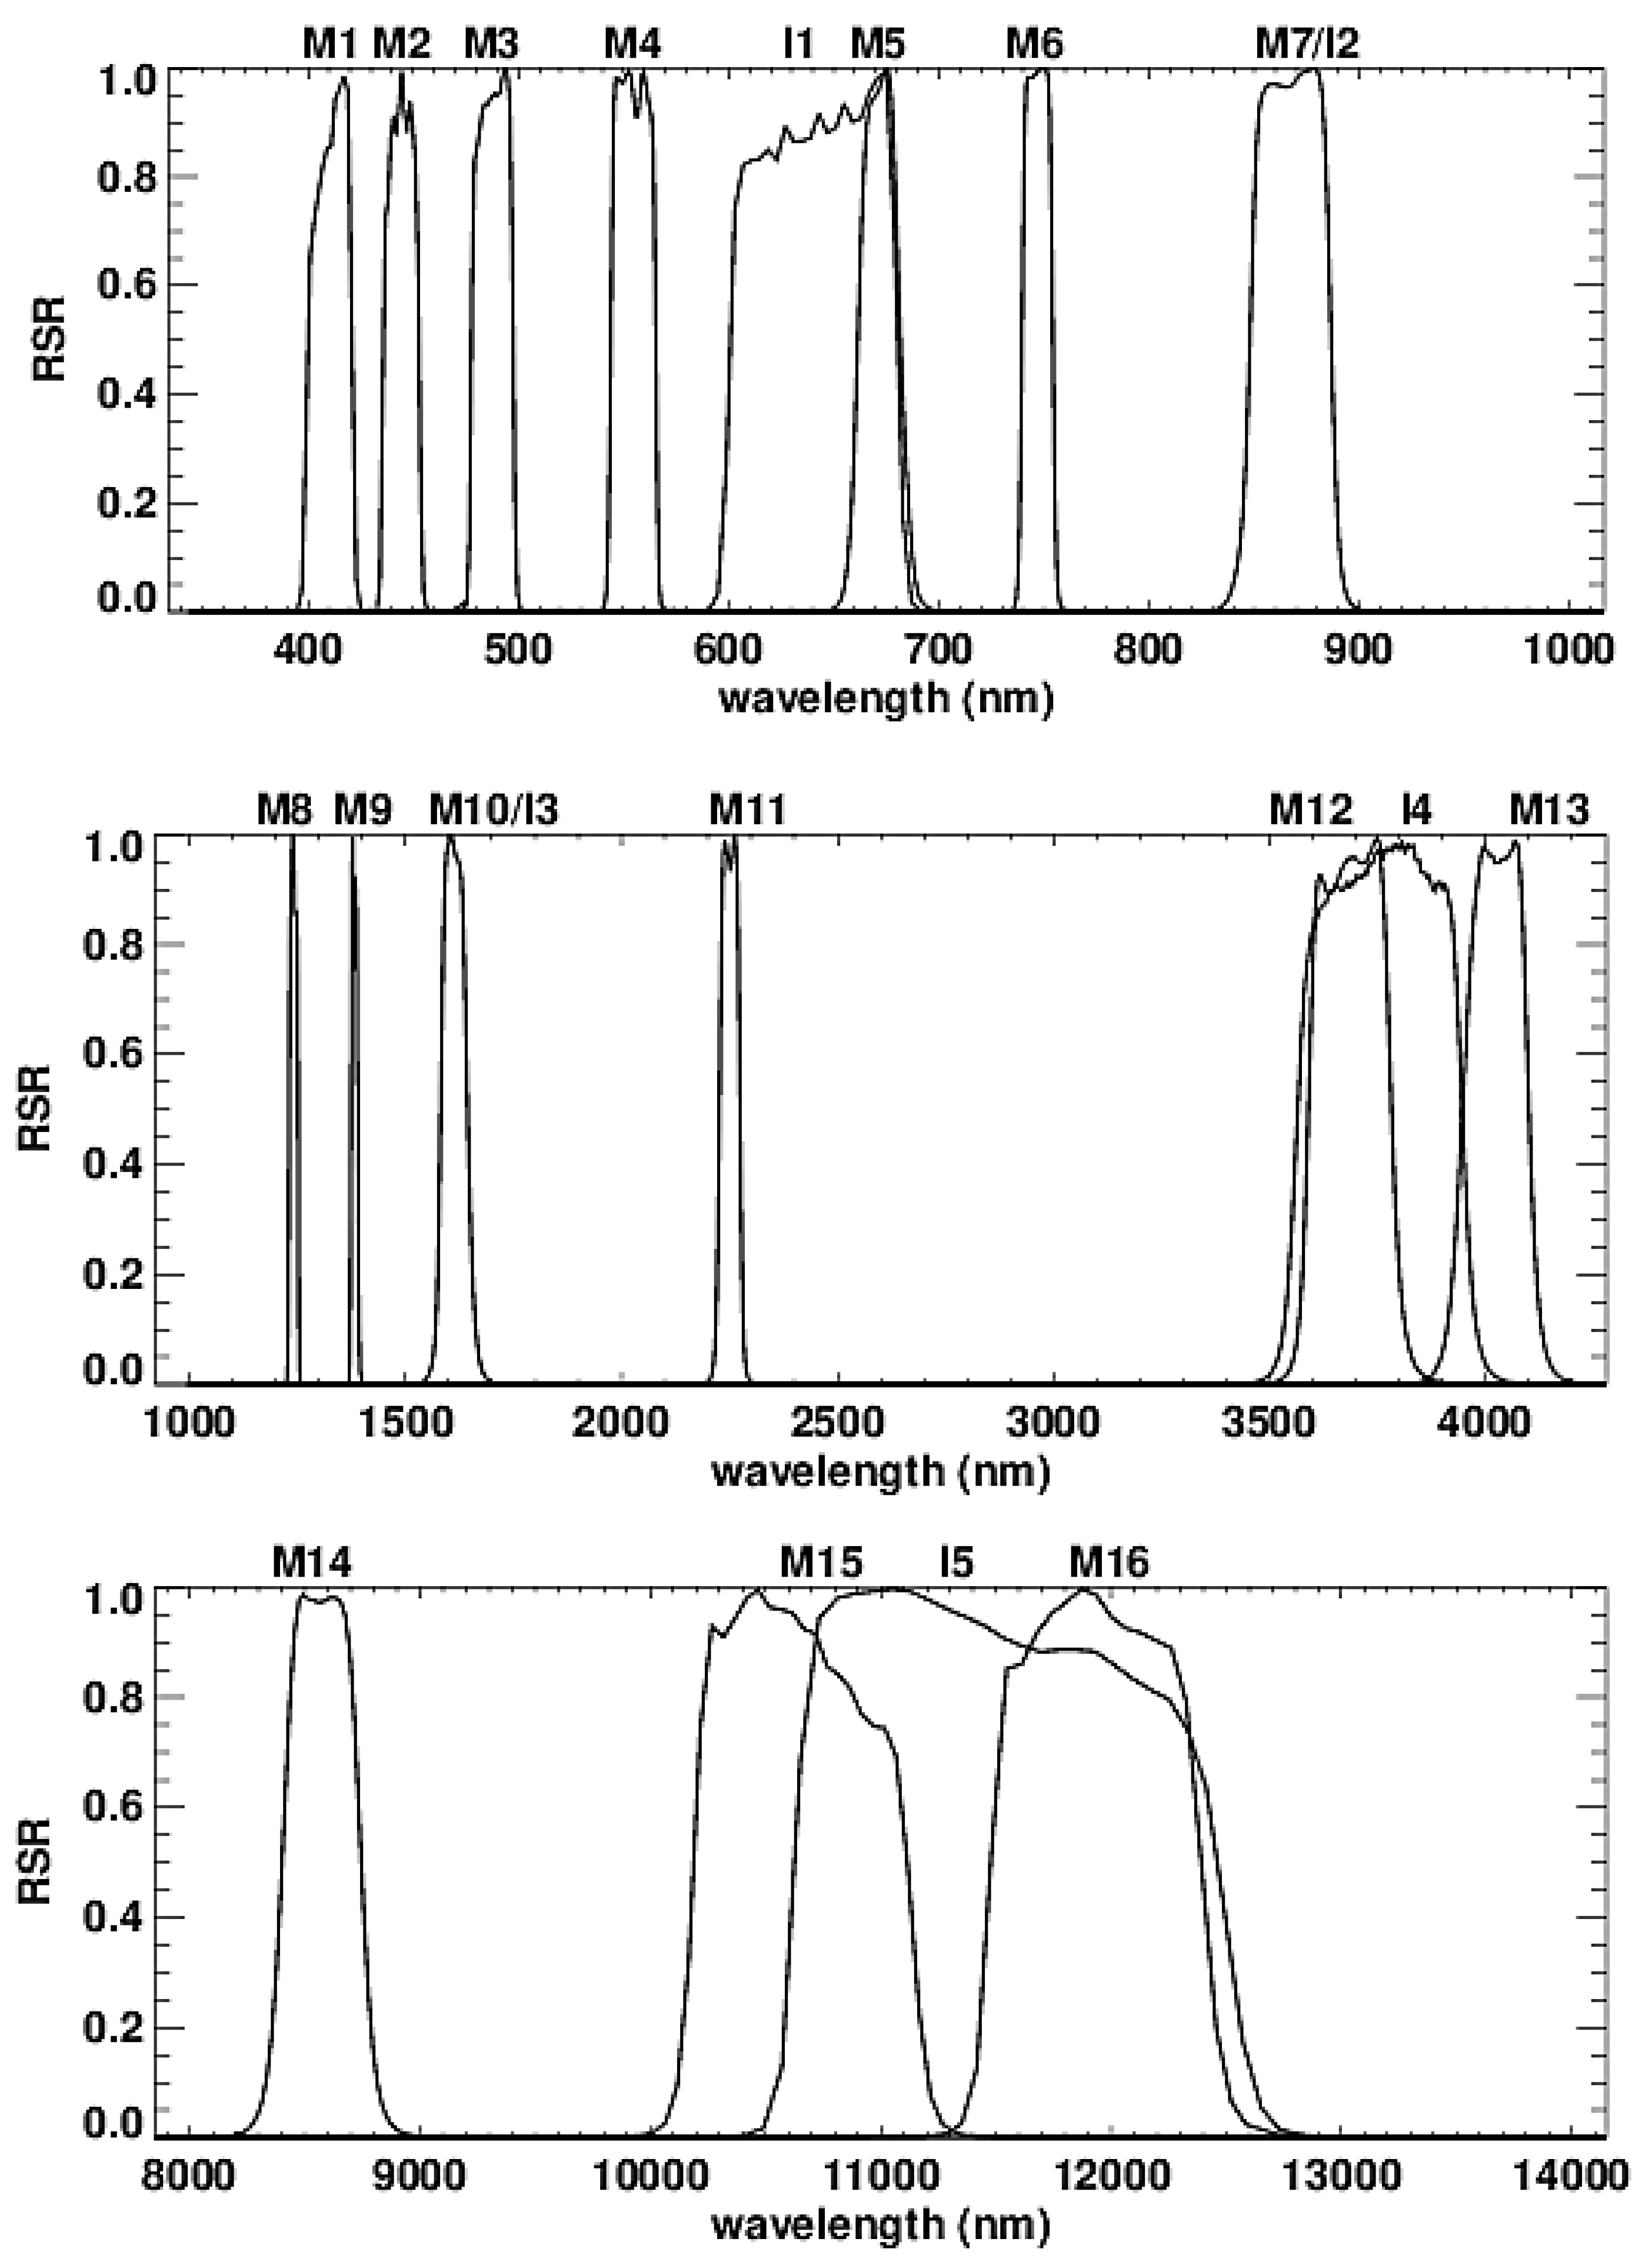
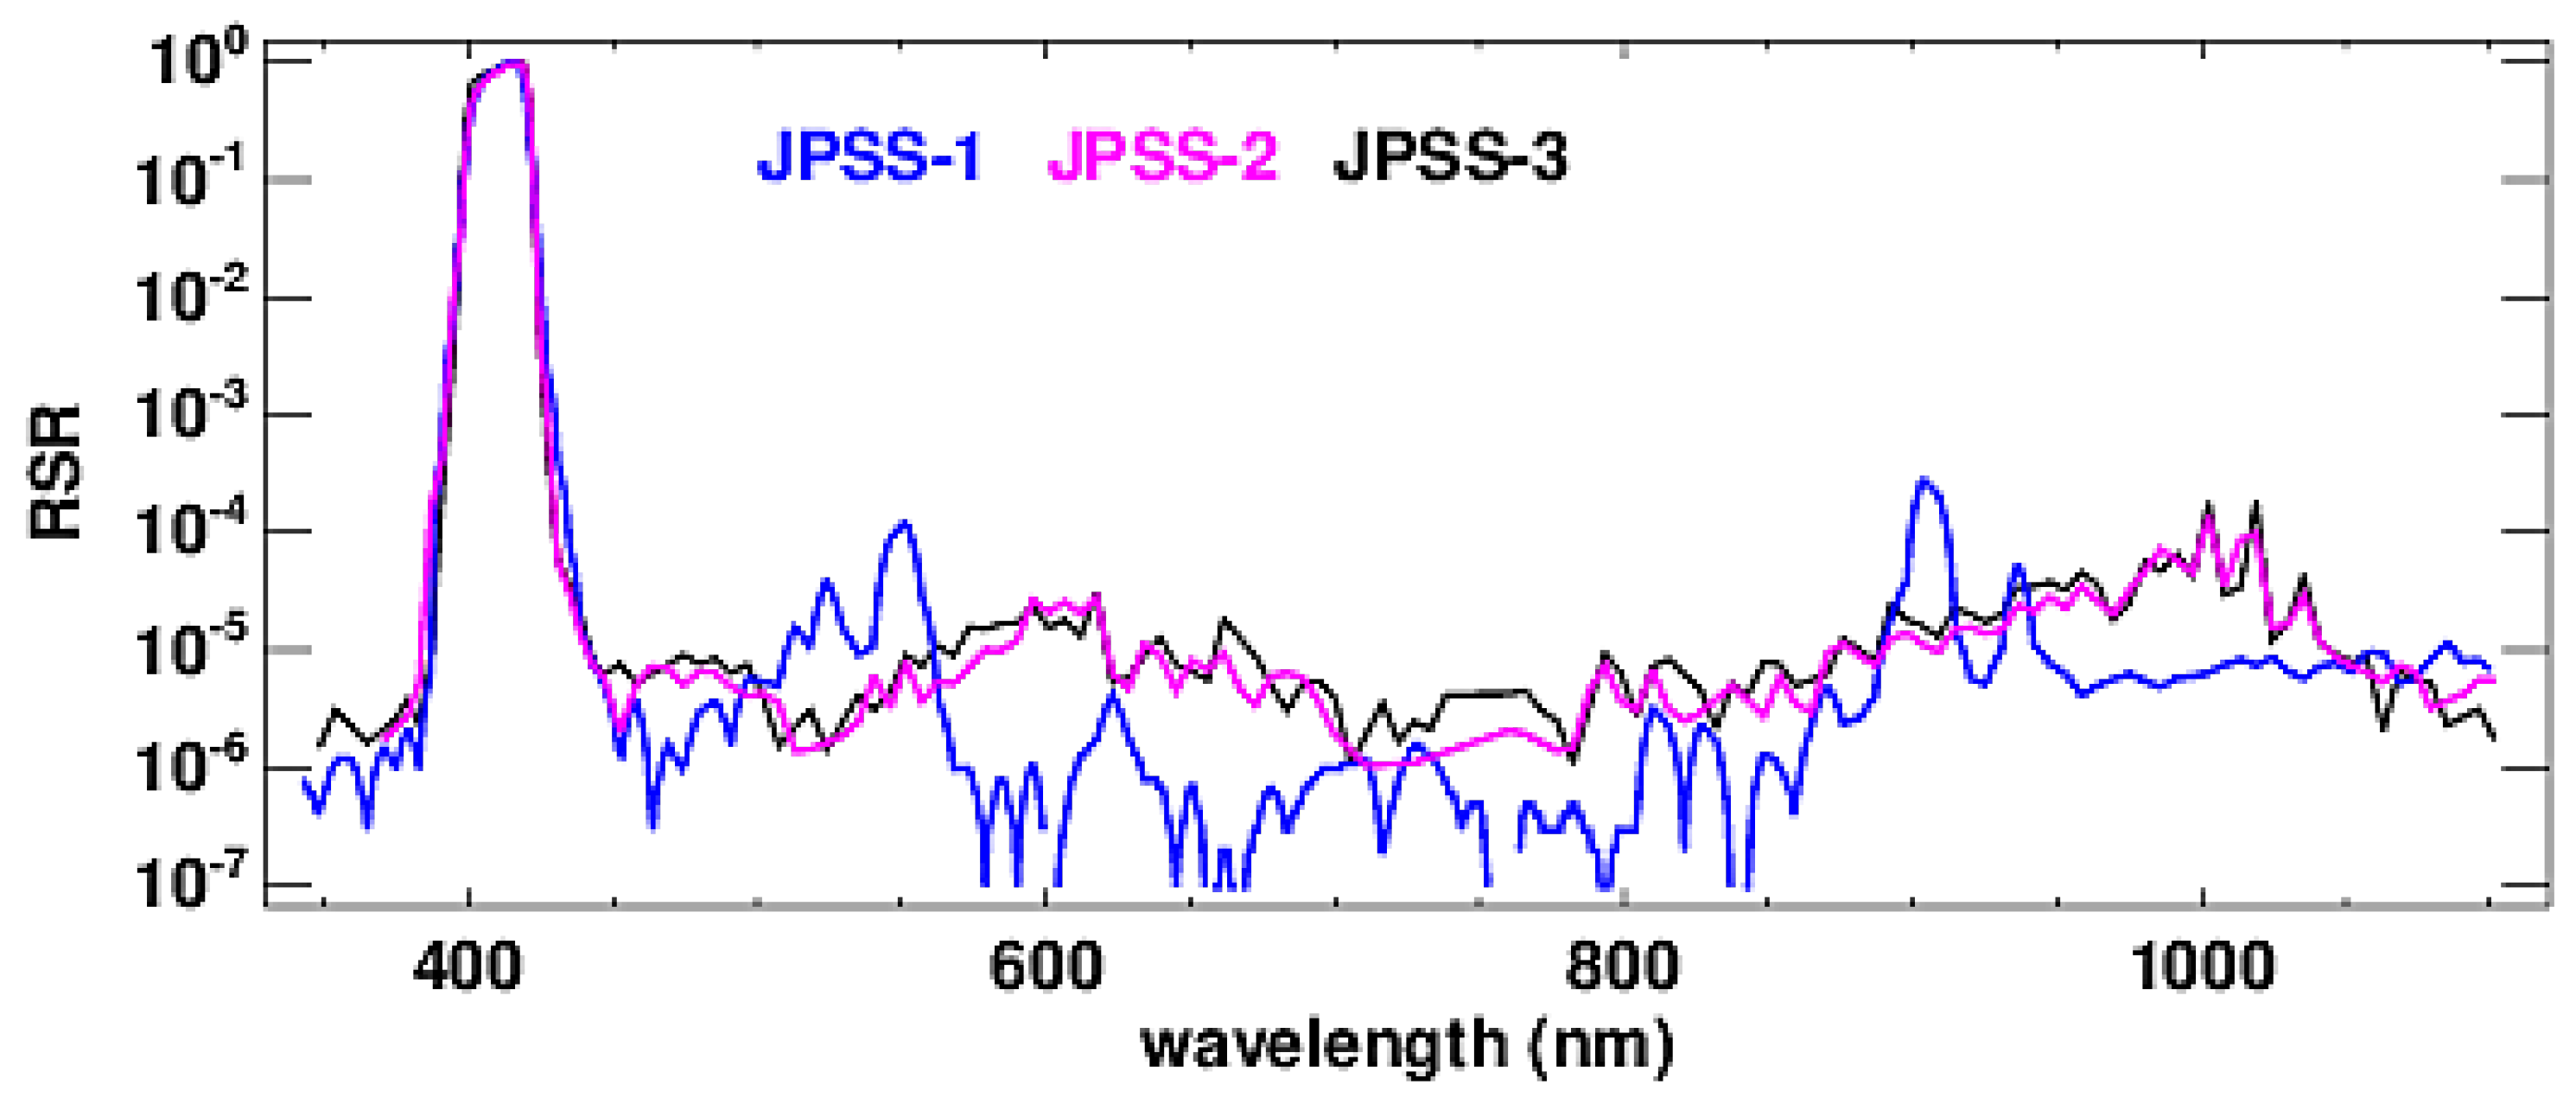
3.4.2. Relative Spectral Response

The relative spectral response is the combination of two separate but complimentary measurements (the laser-based GLAMR and grating-based monochromator) as described in Section 2.3 [18,19]. The spectral profiles for all bands are plotted in Figure 5, showing the shape as well as spectral locations of all VIIRS bands. The VisNIR, SWIR and MWIR, and LWIR bands are graphed in the upper, middle, and lower panels. The VIIRS sensor has a number of design requirements related to the RSR, including center wavelength, bandwidth, 1% limits, and integrated out-of-band (IOOB). These requirements are listed in Table 8 along with the final measurements. The measured values are within the prescribed tolerances for most bands with a few exceptions: the band center for M15 (some detectors); the bandwiths for M14 (all detectors) and M16A/M16B (some detectors); and the IOOB for I5 (a handful of detectors). This is comparable to previous JPSS builds [18,19]; SNPP did show a number of noncompliances in the VisNIR IOOB that were traced to the filter design [12], which was corrected for JPSS. An example of the full out-of-band profile for band M1 is shown in Figure 6. The JPSS-3 profile shows the out-of-band response to be on the order of 10 4 or less (comparable to earlier JPSS sensors), but SNPP has significant out-of-band features up to almost 10 2 , which drove its high IOOB values.

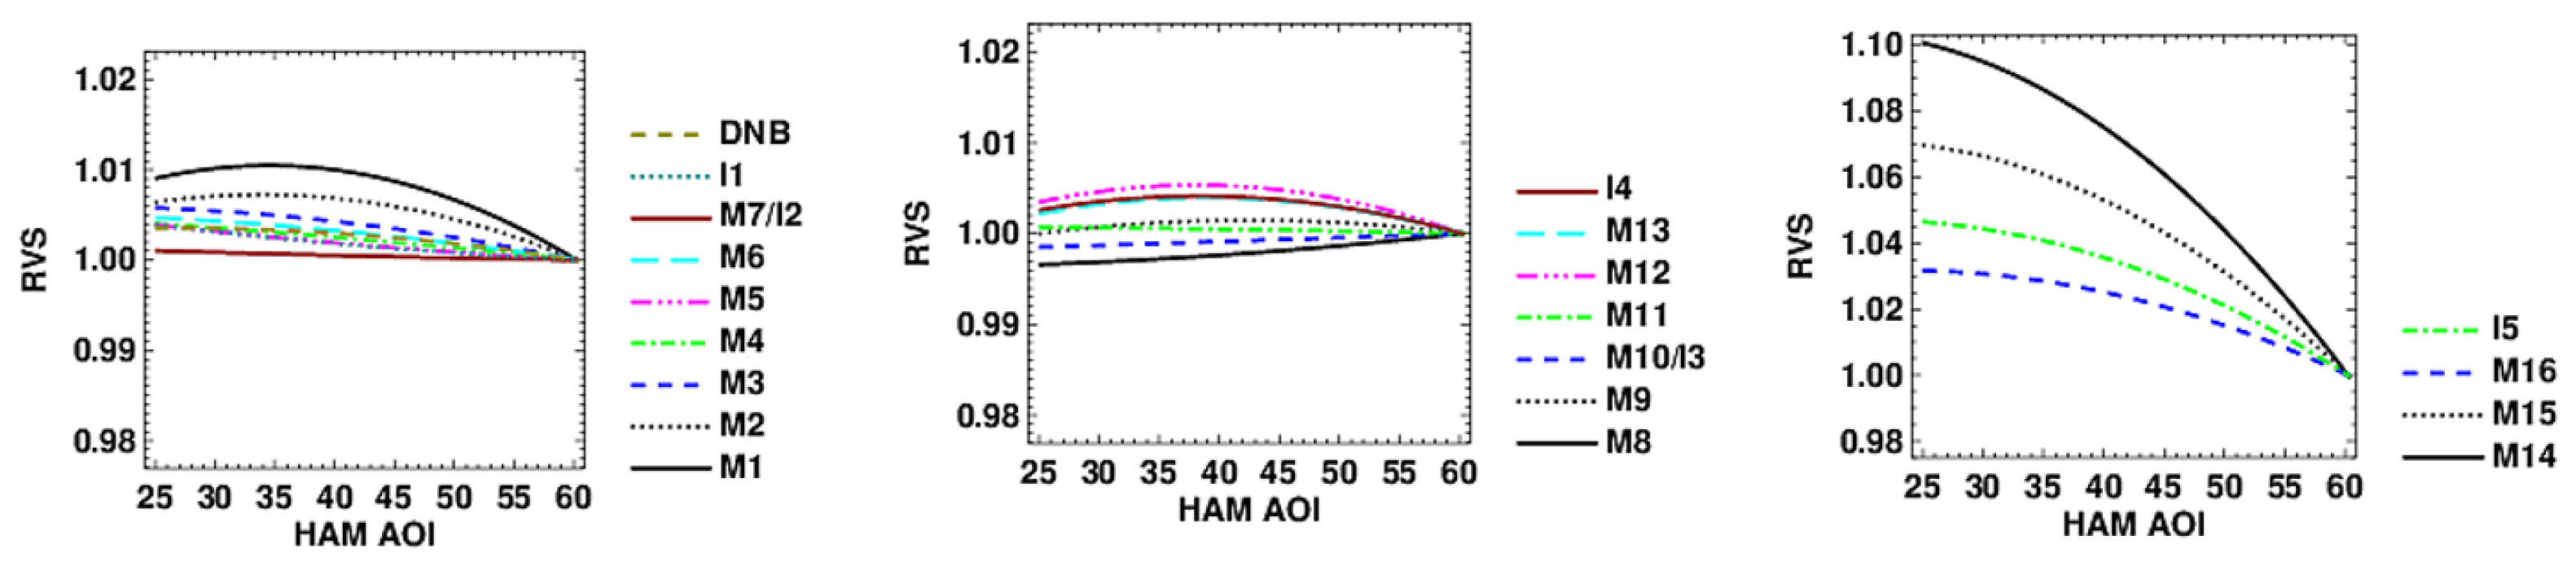
3.4.3. Response versus Scan Angle

The RVS is tested under ambient conditions using an integrating sphere for the RSB/DNB. The ambient instrument configuration (described in Section 2.3) is rotated to view the external source at a range of scan angles covering the HAM angle of incidence (AOI) range used on-orbit; this allows VIIRS to view the sphere at multiple scan angles using the same illumination level. After accounting for source drift, the data are then fit to a quadratic polynomial in HAM AOI, as described in earlier work on previous builds [20,21]. For the TEB, an external blackbody is used as a source in addition to the internal blackbody. Again, VIIRS is rotated to view the external source at various scan angles, using the internal blackbody as a warm reference. The thermal model is used to derive the measured RVS, which is then fit to a quadratic polynomial in AOI [20,21].
Figure 7 shows the RVS derived from the above analysis for all bands. The bands are divided into subplots based on FPA (VisNIR, SWIR and MWIR, and LWIR). The largest variation of the VisNIR bands is shown by band M1 (a little over 1%), with the remaining VisNIR showing lower variation with increasing wavelength. The SWIR and MWIR RVS are also small, less than 1% variation over the entire AOI range. In contrast, the LWIR RVS showed large variation, up to about 10% for band M14. In general, the magnitudes and RVS shapes are consistent across builds; SNPP and JPSS-1 showed slightly less variation and JPSS-2 was comparable. The results for HAM sides A and B are consistent; this was not the case on some previous builds (notably JPSS-1).

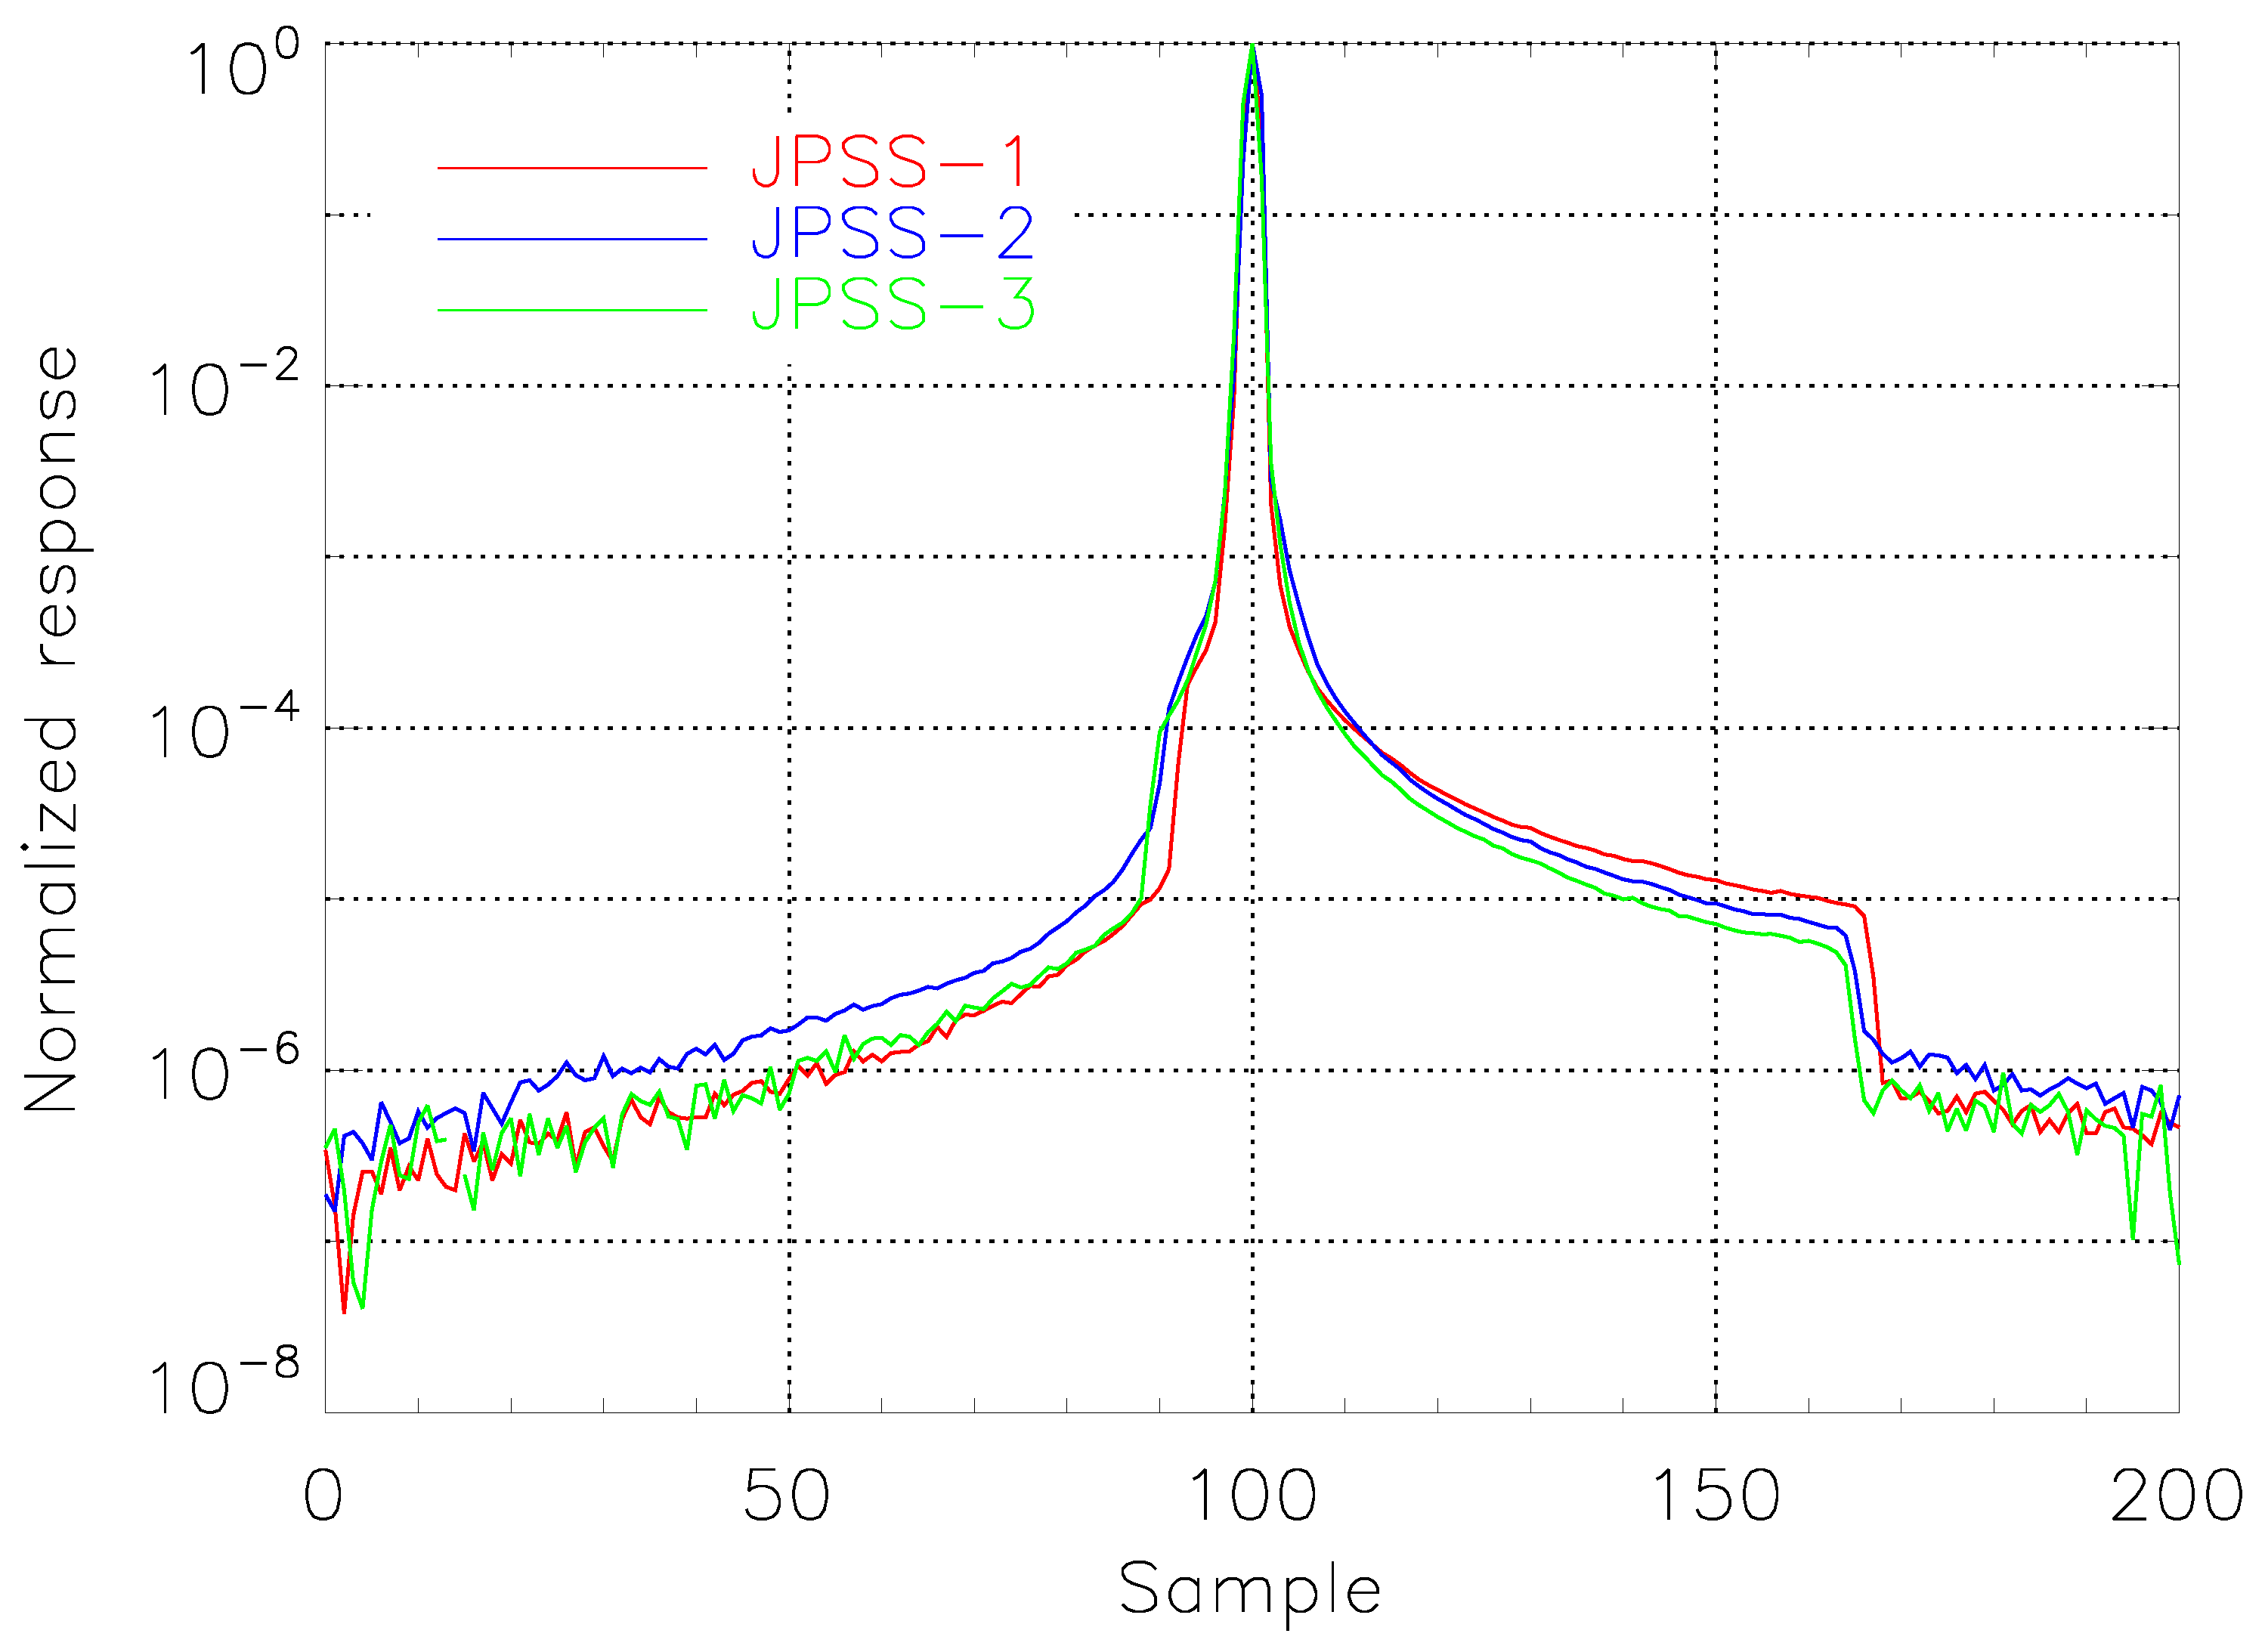
3.4.4. Near-Field Response

The NFR was measured during ambient testing using a collimated source to produce a sharp line image on the detector. The scatter was then measured as the telescope scanned past the source. An example is shown in Figure 8 for band M4, along with comparisons to earlier builds. Note that the response changes rapidly as the telescope approaches and then moves away from the source image. There are two abrupt drops in the response (one on the leading edge and one on the trailing edge of the scan profile) which correspond to the locations of the intermediate field baffle; outside of these locations the profile reaches the noise floor of the measurement. JPSS-3 NFR is generally comparable to earlier builds. A Harvey–Shack model was used to fit the profile in four parts: inside and outside the baffle and leading or trailing side of the image [22]. The resulting fits are then used to convolve the profile with a bright target of 12 mrad by 12 mrad with a radiance defined in Table 9. A sensor design specification limits the amount of scattered light that can enter the detector from some distance outside the bright target, also defined in Table 9. The measured values for the scattered light are listed in this table as well, with all bands meeting the requirement. Note that the values listed in Table 9 are for beginning of life, and may worsen over the coarse of the mission. The JPSS-1 and JPSS-2 assessments are also included for comparison, showing JPSS-3 as good, or better than earlier builds, for most bands.

3.4.5. Stray Light Response

The stray light test was designed to measure the scattered light entering the sensor from greater than 4 degrees off the line of sight. A studio lamp was placed at a number of positions to simulate light from the Earth disk as seen from VIIRS on-orbit, while the telescope was staring at a blackbody. The response for all lamp positions was summed, weighted by the section of the Earth disk each measurement represents, and scaled from the lamp irradiance to the expected Earth irradiance. The expected counts resulting from stray light are given by dn s t r a y , given in Table 10 for each band. This value is then compared to the sensor specification as the ratio dn s t r a y /dn s p e c , where dn s p e c is the allowed counts due to stray light; a value of less than 1 meets the requirement. All bands are shown to be compliant, as were JPSS-1 and JPSS-2. SNPP did show noncompliance for band M11, but subsequently L T Y P was increased for JPSS-1 as it was judged to be too low.

4. Conclusions

The JPSS-3 VIIRS instrument underwent a comprehensive pre-launch testing program at the Raytheon Technologies facility in El Segundo, CA from 2019–2021. The instrument performance was characterized in terms of comparisons to design specifications intended to assess the expected performance once on-orbit as well as in terms of measuring the parameters necessary for the sensor to produce the well-calibrated data products that the science community requires for their studies of the Earth and its climate. JPSS-3 performance, as summarized in this work, in general met or exceeded its design requirements, with a few exceptions, and was comparable in performance to its predecessors (SNPP, JPSS-1, and JPSS-2). Improvements have been made during the program (polarization sensitivity has decreased for JPSS-3, roll-over contamination for band M6 has been reduced, and stray light performance for the DNB is expected to improve). As SNPP and JPSS-1 VIIRS have been successfully operated on-orbit for 10 years and 4 years, respectively, it is expected that JPSS-3 VIIRS will produce high-quality science data products after its launch in 2026.

Author Contributions

J.M. wrote the manuscript. J.M., D.M., A.A., Q.J., T.S., D.L. and C.S. all performed parts of the analysis contained in this work. X.X. and J.J.B. contributed to the design of this study and to the development of the manuscript. All authors contributed equally to this work. All authors have read and agreed to the published version of the manuscript.

Funding

This research received no external funding.

Institutional Review Board Statement

Not applicable.

Informed Consent Statement

Not applicable.

Data Availability Statement

Not applicable.

Acknowledgments

The authors would like to thank the following: the Raytheon test team for conducting the performance tests and for developing much of the analysis methodology, and members of the government data analysis working group including James McCarthy and Jason Geis for valuable comments. The above-mentioned provided valuable information and support to the analysis presented in this work.

Conflicts of Interest

The authors declare no conflict of interest.

References

  1. Xiong, X.; Butler, J.; Chiang, K.; Efremova, B.; Fulbright, J.; Lei, N.; McIntire, J.; Oudrari, H.; Sun, J.; Wang, Z.; et al. VIIRS on-orbit calibration methodology and performance. J. Geophys. Res. Atmos. 2014, 119, 5065–5078. [Google Scholar] [CrossRef]
  2. Cao, C.; De Luccia, F.J.; Xiong, X.; Wolfe, R.; Weng, F. Early on-orbit performance of the visible infrared imaging radiometer suite onboard the Suomi National Polar-Orbiting Partnership (S-NPP) satellite. IEEE Trans. Geosci. Remote Sens. 2014, 52, 1142–1156. [Google Scholar] [CrossRef] [Green Version]
  3. Xiong, X.; Angal, A.; Butler, J.; Chen, H.; Chiang, K.; Lei, N.; Li, Y.; Twedt, K. Performance assessments and comparisons of S-NPP and NOAA-20 (JPSS-1) VIIRS on-orbit calibration. In Sensors, Systems, and Next-Generation Satellites XXII; International Society for Optics and Photonics: Bellingham, WA, USA, 2018; Volume 10785, p. 1078514. [Google Scholar]
  4. Oudrari, H.; McIntire, J.; Xiong, X.; Butler, J.; Ji, Q.; Schwarting, T.; Angal, A. An Overall Assessment of JPSS-2 VIIRS Radiometric Performance Based on Pre-launch Testing. Remote Sens. 2018, 10, 1921. [Google Scholar] [CrossRef] [Green Version]
  5. Justice, C.O.; Román, M.O.; Csiszar, I.; Vermote, E.F.; Wolfe, R.E.; Hook, S.J.; Friedl, M.; Wang, Z.; Schaaf, C.B.; Miura, T.; et al. Land and cryosphere products from Suomi NPP VIIRS: Overview and status. J. Geophys. Res. Atmos. 2013, 118, 9753–9765. [Google Scholar] [CrossRef] [PubMed] [Green Version]
  6. Elvidge, C.D.; Baugh, K.; Zhizhin, M.; Hsu, F.C.; Ghosh, T. VIIRS night-time lights. Int. J. Remote Sens. 2017, 38, 5860–5879. [Google Scholar] [CrossRef]
  7. Schueler, C.F.; Clement, J.E.; Ardanuy, P.E.; Welsch, C.; DeLuccia, F.; Swenson, H. NPOESS VIIRS sensor design overview. In Earth Observing Systems VI; International Society for Optics and Photonics: Bellingham, WA, USA, 2002; Volume 4483, pp. 11–23. [Google Scholar]
  8. Eplee, R.E.; Meister, G.; Patt, F.S.; Barnes, R.A.; Bailey, S.W.; Franz, B.A.; McClain, C.R. On-orbit calibration of SeaWiFS. Appl. Opt. 2012, 51, 8702–8730. [Google Scholar] [CrossRef] [PubMed]
  9. Xiong, X.; Angal, A.; Chang, T.; Chiang, K.; Lei, N.; Li, Y.; Sun, J.; Twedt, K.; Wu, A. MODIS and VIIRS calibration and characterization in support of producing long-term high-quality data products. Remote Sens. 2020, 12, 3167. [Google Scholar] [CrossRef]
  10. Joint Polar Satellite System (JPSS). VIIRS Product Requirement Document (PRD); Technical Report; Goddard Space Flight Center: Greenbelt, MD, USA, 2014; Revision D.
  11. McAndrew, B.; McCorkel, J.; Shuman, T.; Zukowski, B.; Traore, A.; Rodriguez, M.; Brown, S.; Woodward, J. Goddard laser for absolute measurement of radiance for instrument calibration in the ultraviolet to short wave infrared. In CLEO: Applications and Technology; Optical Society of America: Washington, DC, USA, 2018; p. AF3M-6. [Google Scholar]
  12. Oudrari, H.; McIntire, J.; Xiong, X.; Butler, J.; Lee, S.; Lei, N.; Schwarting, T.; Sun, J. Prelaunch radiometric characterization and calibration of the S-NPP VIIRS sensor. IEEE Trans. Geosci. Remote Sens. 2015, 53, 2195–2210. [Google Scholar] [CrossRef]
  13. Angal, A.; Moyer, D.; Ji, Q.; McIntire, J.; Xiong, X. Prelaunch characterization and performance of JPSS-3 VIIRS reflective solar bands. In Earth Observing Systems XXVI; International Society for Optics and Photonics: Bellingham, WA, USA, 2021; Volume 11829, p. 118290L. [Google Scholar]
  14. Oudrari, H.; McIntire, J.; Xiong, X.; Butler, J.; Ji, Q.; Schwarting, T.; Lee, S.; Efremova, B. JPSS-1 VIIRS radiometric characterization and calibration based on pre-launch testing. Remote Sens. 2016, 8, 41. [Google Scholar] [CrossRef] [Green Version]
  15. Schwarting, T.; McIntire, J.; Oudrari, H.; Xiong, X. JPSS-1/NOAA-20 VIIRS Day-Night Band prelaunch radiometric calibration and performance. IEEE Trans. Geosci. Remote Sens. 2019, 57, 7534–7546. [Google Scholar] [CrossRef]
  16. Schwarting, T.; Link, D.; Sun, C.; McIntire, J.; Xiong, X. JPSS-3 VIIRS day-night band pre-launch radiometric characterization. In Earth Observing Systems XXVI; International Society for Optics and Photonics: Bellingham, WA, USA, 2021; Volume 11829, p. 118290M. [Google Scholar]
  17. Moyer, D.; McIntire, J.; Young, J.; McCarthy, J.K.; Waluschka, E.; Xiong, X.; De Luccia, F.J. JPSS-1 VIIRS prelaunch polarization testing and performance. IEEE Trans. Geosci. Remote Sens. 2017, 55, 2463–2476. [Google Scholar] [CrossRef]
  18. Moeller, C.; Schwarting, T.; McIntire, J.; Moyer, D. JPSS-1 VIIRS prelaunch spectral characterization and performance. In Earth Observing Systems XX; International Society for Optics and Photonics: Bellingham, WA, USA, 2015; Volume 9607, p. 960711. [Google Scholar]
  19. Moeller, C.; Schwarting, T.; McCorkel, J.; Moyer, D.; McIntire, J. JPSS-2 VIIRS version 2 at-launch relative spectral response characterization. In Earth Observing Systems XXIV; International Society for Optics and Photonics: Bellingham, WA, USA, 2019; Volume 11127, p. 111270D. [Google Scholar]
  20. Moyer, D.; McIntire, J.; Oudrari, H.; McCarthy, J.; Xiong, X.; De Luccia, F. JPSS-1 VIIRS pre-launch response versus scan angle testing and performance. Remote Sens. 2016, 8, 141. [Google Scholar] [CrossRef] [Green Version]
  21. McIntire, J.; Moyer, D.; Chang, T.; Oudrari, H.; Xiong, X. Pre-Launch JPSS-2 VIIRS Response versus Scan Angle Characterization. Remote Sens. 2017, 9, 1300. [Google Scholar] [CrossRef] [Green Version]
  22. Schwarting, T.; McIntire, J.; Oudrari, H.; Xiong, X. VIIRS pre-launch near field response characterization. In Earth Observing Systems XXII; International Society for Optics and Photonics: Bellingham, WA, USA, 2017; Volume 10402, p. 104021L. [Google Scholar]
Figure 1. JPSS-3 VIIRS RSB coefficients for all detectors. Black and blue denote high and low gain, respectively.
Remotesensing 14 01999 g001
Figure 2. JPSS-3 VIIRS DNB response versus radiance for select aggregation modes.
Remotesensing 14 01999 g002
Figure 3. JPSS-3 VIIRS TEB coefficients for all detectors. Only high gain is shown.
Remotesensing 14 01999 g003
Figure 4. VIIRS DoLP per band and detector, across scan angles (symbols), for JPSS-1, JPSS-2, and JPSS-3 (top to bottom panels).
Remotesensing 14 01999 g004
Figure 5. JPSS-3 VIIRS spectral bands RSR plotted versus wavelength, where the upper plot shows the VisNIR bands, the middle plot graphs the SWIR and LWIR bands, and the lower plot shows the LWIR bands.
Remotesensing 14 01999 g005
Figure 6. VIIRS M1 out-of-band response comparison between JPSS-1, JPSS-2, and JPSS-3.
Remotesensing 14 01999 g006
Figure 7. VIIRS RVS plotted as a function of HAM AOI.
Remotesensing 14 01999 g007
Figure 8. VIIRS NFR for band M4 plotted versus pixel when viewing a line source. JPSS-1 and JPSS-2 NFR are shown for comparison.
Remotesensing 14 01999 g008
Table 1. JPSS-3 VIIRS bands characteristics from the sensor specification [10]. HG and LG refer to high and low gain for the dual gain bands.
BandGainCenter
(nm)
Bandwidth
(nm)
Resolution
(m)
L MIN
(W/m 2 /sr/ μ m)
L MAX
(W/m 2 /sr/ μ m)
SNR at L TYP
M1HG4102075030135352
M1LG41020750135615316
M2HG4451875026127380
M2LG44518750127687409
M3HG4882075022107416
M3LG48820750107702414
M4HG555207501278362
M4LG5552075078667315
I1HG640803755718119
M5HG672207508.659242
M5LG6722075059651360
M6HG746157505.341199
M7HG865397503.429215
M7LG8653975029249340
I2HG8653937510.3349150
M8HG1240207503.5164.974
M9HG1378157500.677.183
M10HG1610607501.271.2342
I3HG1610603751.271.26
M11HG2250507500.1231.810
BandGainCenter
(nm)
Bandwidth
(nm)
Resolution
(m)
L MIN
(W/cm 2 /sr)
L MAX
(W/cm 2 /sr)
SNR at L MIN
DNBLGS700400750NA0.01NA
DNBMGS700400750NANANA
DNBHGS7004007503 × 10 9 NA5/6
BandGainCenter
(nm)
Bandwidth
(nm)
Resolution
(m)
T MIN
(K)
T MAX
(K)
NEdT at T TYP
(K)
M12HG37001807502303530.396
I4HG37403803752103532.5
M13HG40501557502303430.107
M13LG40501557503436340.423
M14HG85503007501903360.091
M15HG10,76310007501903430.072
M16HG12,0139507501903400.070
I5HG11,45019003751903401.5
Table 2. Key JPSS-3 VIIRS design changes implemented based on lessons learned from JPSS-2.
Key VIIRS Sensor Improvements JPSS-2 –> JPSS-3
New DNB CCD with updated biases
Tighter RTA tolerancing for wavefront error and line-of-sight
Tighter EFL tolerancing bounds to achieve scan overlap
First dichroic redesigned to reduce polarization sensitivity
SDSM filters redesigned to reduce out-of-band leaks
Table 3. JPSS-3 VIIRS RSB L S A T relative to the sensor specification [10]. JPSS-1 and JPSS-2 results are included for comparison.
BandGainL MAX JPSS-1JPSS-2JPSS-3JPSS-1JPSS-2JPSS-3
L SAT L SAT L SAT L SAT /SpecL SAT /SpecL SAT /Spec
M1HG1351541841701.141.361.26
M1LG6157056746901.151.101.12
M2HG1271371561521.081.231.20
M2LG6878808608301.281.251.21
M3HG1071131141151.061.071.07
M3LG7028389088841.191.291.26
M4HG788787901.121.121.15
M4LG5578517717131.281.381.07
M5HG596168711.041.151.20
M5LG6517259108661.111.401.33
M6HG414850501.161.221.22
M7HG293133341.061.141.17
M7LG3494094003921.171.151.12
M8HG164.91181671700.721.011.03
M9HG77.180921191.041.191.54
M10HG71.27796891.091.351.25
M11HG31.83535391.101.101.23
I1HG7187779309101.081.301.27
I2HG3494104444681.171.271.34
I3HG72.566101890.911.391.23
Table 4. JPSS-3 VIIRS RSB SNR at L T Y P relative to the sensor specification [10]. JPSS-1 and JPSS-2 results are included for comparison.
BandGainL TYP SNRJPSS-1JPSS-2JPSS-3JPSS-1JPSS-2JPSS-3
SpecSNRSNRSNRSNR/SpecSNR/SpecSNR/Spec
M1HG44.93526366506801.811.851.85
M1LG1553161066104010383.373.293.29
M2HG403805736006171.511.581.58
M2LG146409986104010172.412.542.54
M3HG324167067537641.701.811.81
M3LG1234141063124011402.573.003.00
M4HG213625596116011.541.691.59
M4LG903158449939072.683.153.15
M5HG102423803663531.571.511.51
M5LG683607517307592.092.032.03
M6HG9.61994284293992.152.162.16
M7HG6.42155495645302.552.622.62
M7LG33.43407609508142.232.792.79
M8HG5.4743352403654.533.243.24
M9HG6833252322043.912.802.80
M10HG7.33427656856632.242.002.00
M11HG1.01021619822321.5719.8019.80
I1HG221192272122361.911.781.78
I2HG251502872852661.911.901.90
I3HG7.3619017218031.7228.6728.67
Table 5. JPSS-3 VIIRS TEB T S A T relative to the sensor specification [10]. JPSS-1 and JPSS-2 results are included for comparison.
BandGainT MAX JPSS-1JPSS-2JPSS-3JPSS-1JPSS-2JPSS-3
T SAT T SAT T SAT T SAT –T MAX T SAT –T MAX L SAT –T MAX
M12HG353359360361678
M13HG343363363366202023
M14HG336348352363121627
M15HG34335735036014717
M16AHG340366356363261623
M16BHG340367353364271324
I4HG353357355360427
I5HG340369380381294041
Table 6. JPSS-3 VIIRS TEB NEdT at T T Y P relative to the sensor specification [10]. JPSS-1 and JPSS-2 results are included for comparison.
BandGainT TYP NEdTJPSS-1JPSS-2JPSS-3JPSS-1JPSS-2JPSS-3
SpecNEdTNEdTNEdTNEdT/SpecNEdT/SpecNEdT/Spec
M12HG2700.3960.1190.1500.1290.3010.3790.326
M13HG3000.1070.0440.0470.0460.4110.4390.423
M13LG3800.4230.2360.2310.2190.5580.5460.518
M14HG2700.0910.0530.0550.0530.5820.6040.582
M15HG3000.070.0270.0360.0270.3860.5140.386
M16AHG3000.0720.0430.0380.0440.5970.5280.611
M16BHG3000.0720.0440.0370.0430.6110.5140.597
I4HG2702.50.3930.4000.3440.1570.1600.138
I5HG2101.50.4230.4030.5020.2820.2690.335
Table 7. JPSS-3 VIIRS TEB ARD in (%) relative to the sensor specification [10].
TSensorI4I5M12M13M14M15M16AM16B
190Spec12.302.101.601.60
JPSS-11.480.180.150.15
JPSS-20.680.290.170.25
JPSS-32.970.400.230.24
230Spec7.005.702.400.600.600.60
JPSS-10.341.500.150.050.000.01
JPSS-2-7.602.950.110.070.080.04
JPSS-3-2.630.800.340.040.060.09
267Spec5.002.50
JPSS-10.450.02
JPSS-20.480.10
JPSS-30.690.06
270Spec0.700.700.600.400.400.40
JPSS-10.210.310.100.080.020.03
JPSS-20.240.150.080.050.040.04
JPSS-30.420.480.180.080.060.08
310Spec0.700.700.400.400.400.40
JPSS-10.310.350.160.090.050.05
JPSS-20.250.170.110.060.030.04
JPSS-30.480.350.270.120.080.09
340Spec0.700.700.500.400.400.40
JPSS-10.300.390.170.080.020.04
JPSS-20.270.180.090.050.030.03
JPSS-30.400.310.260.110.100.10
Table 8. JPSS-3 VIIRS RSR relative to the sensor specification [10].
BandCenter Wavelength Bandwidth 1% Limits IOOB
SpecMeasSpecMeasSpecMeasSpecMeas
M1412 ± 2410.620 ± 220.9≥375; ≤444396; 4251.00.13
M2445 ± 3444.418 ± 216.9≥417; ≤473433; 4561.00.16
M3488 ± 4487.720 ± 319.9≥455; ≤521475; 5010.70.34
M4555 ± 4554.920 ± 321.3≥523; ≤589541; 5680.70.17
M5672 ± 5671.420 ± 320.3≥638; ≤706651; 6940.70.35
M6746 ± 2746.915 ± 214.7≥721; ≤771736; 7580.80.21
M7865 ± 8868.239 ± 538.6≥801; ≤929836; 8980.70.19
M81240 ± 51240.320 ± 420.5≥1205; ≤12751225; 12550.80.19
M91378 ± 41381.415 ± 315.0≥1351; ≤14051369; 13981.00.34
M101610 ± 141611.960 ± 962.2≥1509; ≤17091548; 16870.70.37
M112250 ± 132251.450 ± 647.7≥2167; ≤23332207; 22951.00.28
M123700 ± 323682.2180 ± 20192.4≥3410; ≤39903526; 38651.10.33
M134050 ± 344021.3155 ± 20154.3≥3790; ≤43103864; 41761.30.34
M148550 ± 708566.0300 ± 40342.8≥8050; ≤90508230; 89080.90.42
M1510,763 ± 11310,654.61000 ± 100928.1≥9700; ≤11,74010,021; 11,3190.40.24
M16A12,013 ± 8811,938.7950 ± 50912.6≥11,060; ≤13,05011,302; 12,6620.40.23
M16B12,013 ± 8811,941.7950 ± 50914.0≥11,060; ≤13,05011,304; 12,6530.40.30
I1640 ± 6640.780 ± 679.5≥ 565; ≤715592; 6890.50.05
I2865 ± 8868.039 ± 538.8≥ 802; ≤928836; 8980.70.20
I31610 ± 141611.660 ± 961.4≥1509; ≤17091548; 16860.70.38
I43740 ± 403753.2380 ± 30380.7≥3340; ≤41403486; 40300.50.18
I511,450 ± 12511,536.21900 ± 1001835.5≥9900; ≤12,90010,449; 12,7500.40.26
DNB LGS700 ± 14696.2400 ± 20382.5≥470; ≤960490; 9080.10.03
DNB MGS700 ± 14696.2400 ± 20383.4≥470; ≤960483; 9090.10.02
Table 9. JPSS-3 VIIRS NFR performance relative to the sensor specification [10].
BandCenter
Wavelength
(nm)
Angular
Separation
(mrad)
L BRIGHT L spec JPSS-1
L scat
/L spec
JPSS-2
L scat
/L spec
JPSS-3
L scat
/L spec
M141261623.83  × 10 3 0.370.340.12
M244561802.86  × 10 3 0.420.460.22
M348861603.33  × 10 3 0.360.430.16
M455561602.25  × 10 3 0.480.550.17
M567261159.52  × 10 4 0.670.670.19
M6746121471.40  × 10 3 0.130.200.04
M786561245.44  × 10 4 0.830.620.57
M812406571.05  × 10 3 0.650.370.27
M91378NANANANANANA
M101610686.19.26  × 10 4 0.380.940.41
M11225061.21.11  × 10 3 0.630.470.36
M12370030.32.09  × 10 3 0.870.620.23
M13405031.73.42  × 10 3 0.470.490.16
M148550NANANANANANA
M1510,763312.53.43  × 10 3 0.660.310.55
M1612,013311.33.85  × 10 3 0.560.480.60
Table 10. JPSS-3 VIIRS stray light performance relative to the sensor specification [10].
BandE EARTH L TYP JPSS-1
dn stray
JPSS-1
dn stray
/dn spec
JPSS-2
dn stray
JPSS-2
dn stray
/dn spec
JPSS-3
dn stray
JPSS-3
dn stray
/dn spec
M11444.144.92.420.312.230.284.150.454
M21526.1402.680.31.830.202.650.291
M31563.5322.890.361.840.192.20.218
M41510.7212.960.391.580.202.10.250
M51265.7102.570.551.430.311.380.273
M61088.99.62.950.412.250.322.610.341
M7833.26.43.290.523.190.504.090.604
M83535.40.440.240.490.370.5360.466
M9262.960.360.150.590.330.5690.239
M10165.77.30.220.060.280.100.3020.106
M1156.410.090.080.150.130.1340.112
I11341.3220.310.330.320.330.4850.514
I2833.2250.310.150.360.160.4760.228
I3165.77.30.240.060.270.090.2360.085
Publisher’s Note: MDPI stays neutral with regard to jurisdictional claims in published maps and institutional affiliations.

