Article

High Quality Object Detection for Multiresolution Remote Sensing Imagery Using Cascaded Multi-Stage Detectors

1
Center for Geo-Spatial Information, Shenzhen Institute of Advanced Technology, Chinese Academy of Sciences, Shenzhen 518055, China
2
School of Earth Science and Resources, Chang’an University, 126 Yanta Road, Xi’an 710054, China
3
Shenzhen Engineering Laboratory of Ocean Environmental Big Data Analysis and Application, Shenzhen 518055, China
*
Author to whom correspondence should be addressed.
These authors contributed equally to this work.
Submission received: 1 March 2022 / Revised: 15 April 2022 / Accepted: 25 April 2022 / Published: 27 April 2022
(This article belongs to the Special Issue Convolutional Neural Networks for Object Detection)

Abstract

:
Deep-learning-based object detectors have substantially improved state-of-the-art object detection in remote sensing images in terms of precision and degree of automation. Nevertheless, the large variation of the object scales makes it difficult to achieve high-quality detection across multiresolution remote sensing images, where the quality is defined by the Intersection over Union (IoU) threshold used in training. In addition, the imbalance between the positive and negative samples across multiresolution images worsens the detection precision. Recently, it was found that a Cascade region-based convolutional neural network (R-CNN) can potentially achieve a higher quality of detection by introducing a cascaded three-stage structure using progressively improved IoU thresholds. However, the performance of Cascade R-CNN degraded when the fourth stage was added. We investigated the cause and found that the mismatch between the ROI features and the classifier could be responsible for the degradation of performance. Herein, we propose a Cascade R-CNN++ structure to address this issue and extend the three-stage architecture to multiple stages for general use. Specifically, for cascaded classification, we propose a new ensemble strategy for the classifier and region of interest (RoI) features to improve classification accuracy at inference. In localization, we modified the loss function of the bounding box regressor to obtain higher sensitivity around zero. Experiments on the DOTA dataset demonstrated that Cascade R-CNN++ outperforms Cascade R-CNN in terms of precision and detection quality. We conducted further analysis on multiresolution remote sensing images to verify model transferability across different object scales.

1. Introduction

Object detection in remote sensing images plays an important role in several civilian and military applications, such as urban planning, geographic information system updating, and search-and-rescue operations. Compared with the traditional methods (template-matching-based methods [1,2], knowledge-based methods [3,4], etc.), the deep-learning-based methods automatically extract features from raw data by shifting the burden of manual feature design to the underlying learning system, enabling a more powerful feature representation to extract higher semantic levels of feature maps. With this advantage, deep-learning-based detection approaches have achieved great success in both the computer vision and remote sensing community [5,6].
Unlike the natural scene image, remotely sensed images have larger scale variations and more feature complexity under different observation conditions, requiring higher generalization of object detectors. DNN-based detection approaches have recently been introduced from the computer vision field to the remote sensing field and achieved top scores on multiclass object detection. Many fundamental issues of deep learning object detection for remote sensing images are addressed, such as the lack of sufficient training samples [7,8], the poor performance of the small object detection [9,10,11], and rotation characteristics of the object in satellite image [12,13]. The comprehensive review, written in 2020, can be found in article [5].
Nevertheless, the large variation of object scales in multiresolution remote sensing images still poses a great challenge for object detectors. Recently, a number of studies have explored the possibility of solving this problem from different aspects, which can be summarized into three categories. (1) Feature fusion with different levels: in this category, many fusion models are created to extract multi-scale feature hierarchy to improve the model performance on both small and large objects. The representative studies include the cross-scale feature fusion (CSFF) [14], the polarization attention mechanism module based on dual feature pyramid network (FPN) [15], feature-fusion architecture(FFA) [16], multi-patch feature pyramid network [17], and Quad-FPN [18]. (2) Improving the region proposal network to generate more suitable anchors: these models address the mismatch problem of the anchor size and object sizes in multi-scale images, such as the self-adaptive aspect ratio anchor (SARA) [19], the multi-scale spatial attention region proposal network [20], and the size folding operation (SF) [21]. (3) Establishing parallel networks to detect objects of different scales: one of the representative works is the multi-expert detection network (MEDNet) [22].
The above methods mainly focus on feature extraction and feature matching between objects of different scales. In addition to that, the imbalance of the positive and negative samples is another reason that the model fails to detect objects across different scales [23]. Compared to small objects, large objects are more likely to be identified as positive samples with higher precision. When applying the model pre-trained by high-resolution images to low-resolution images, most large objects become small objects, leading to too few positive samples to effectively train the model.
In anchor-based detectors, an intersection-over-union (IoU) threshold is usually used to distinguish positive/negative samples, which also defines the detection quality [24]. Choosing an appropriate threshold is a compromise between detection quality and precision, because the lower IoU threshold brings more potential region proposals of the object, but with more noisy samples, which leads to unreliable detection results. However, using a high IoU threshold in training results in too few positive samples, leading to model overfitting.
To achieve high precision, the IoU threshold must closely match the quality of detector hypotheses [25]. Cascade R-CNN [25], as an extension of two-stage anchor-based detectors, uses a three-stage cascaded structure to address the above issue, where the IoU of training samples (i.e., the quality of the hypotheses) can be progressively improved by cascaded bounding box regression. This cascaded structure sequentially improves the quantity and quality of positive training samples to reduce the overfitting problem. In experiments with natural scene images, the cascaded structure achieves better precision in the detection of objects of different scales. However, in the original structure of Cascade R-CNN, the maximum number of the cascade component is three. The overall detection performance declines when the fourth stage is added [25]. This limits the extension of cascaded detectors to achieve better detection performance.
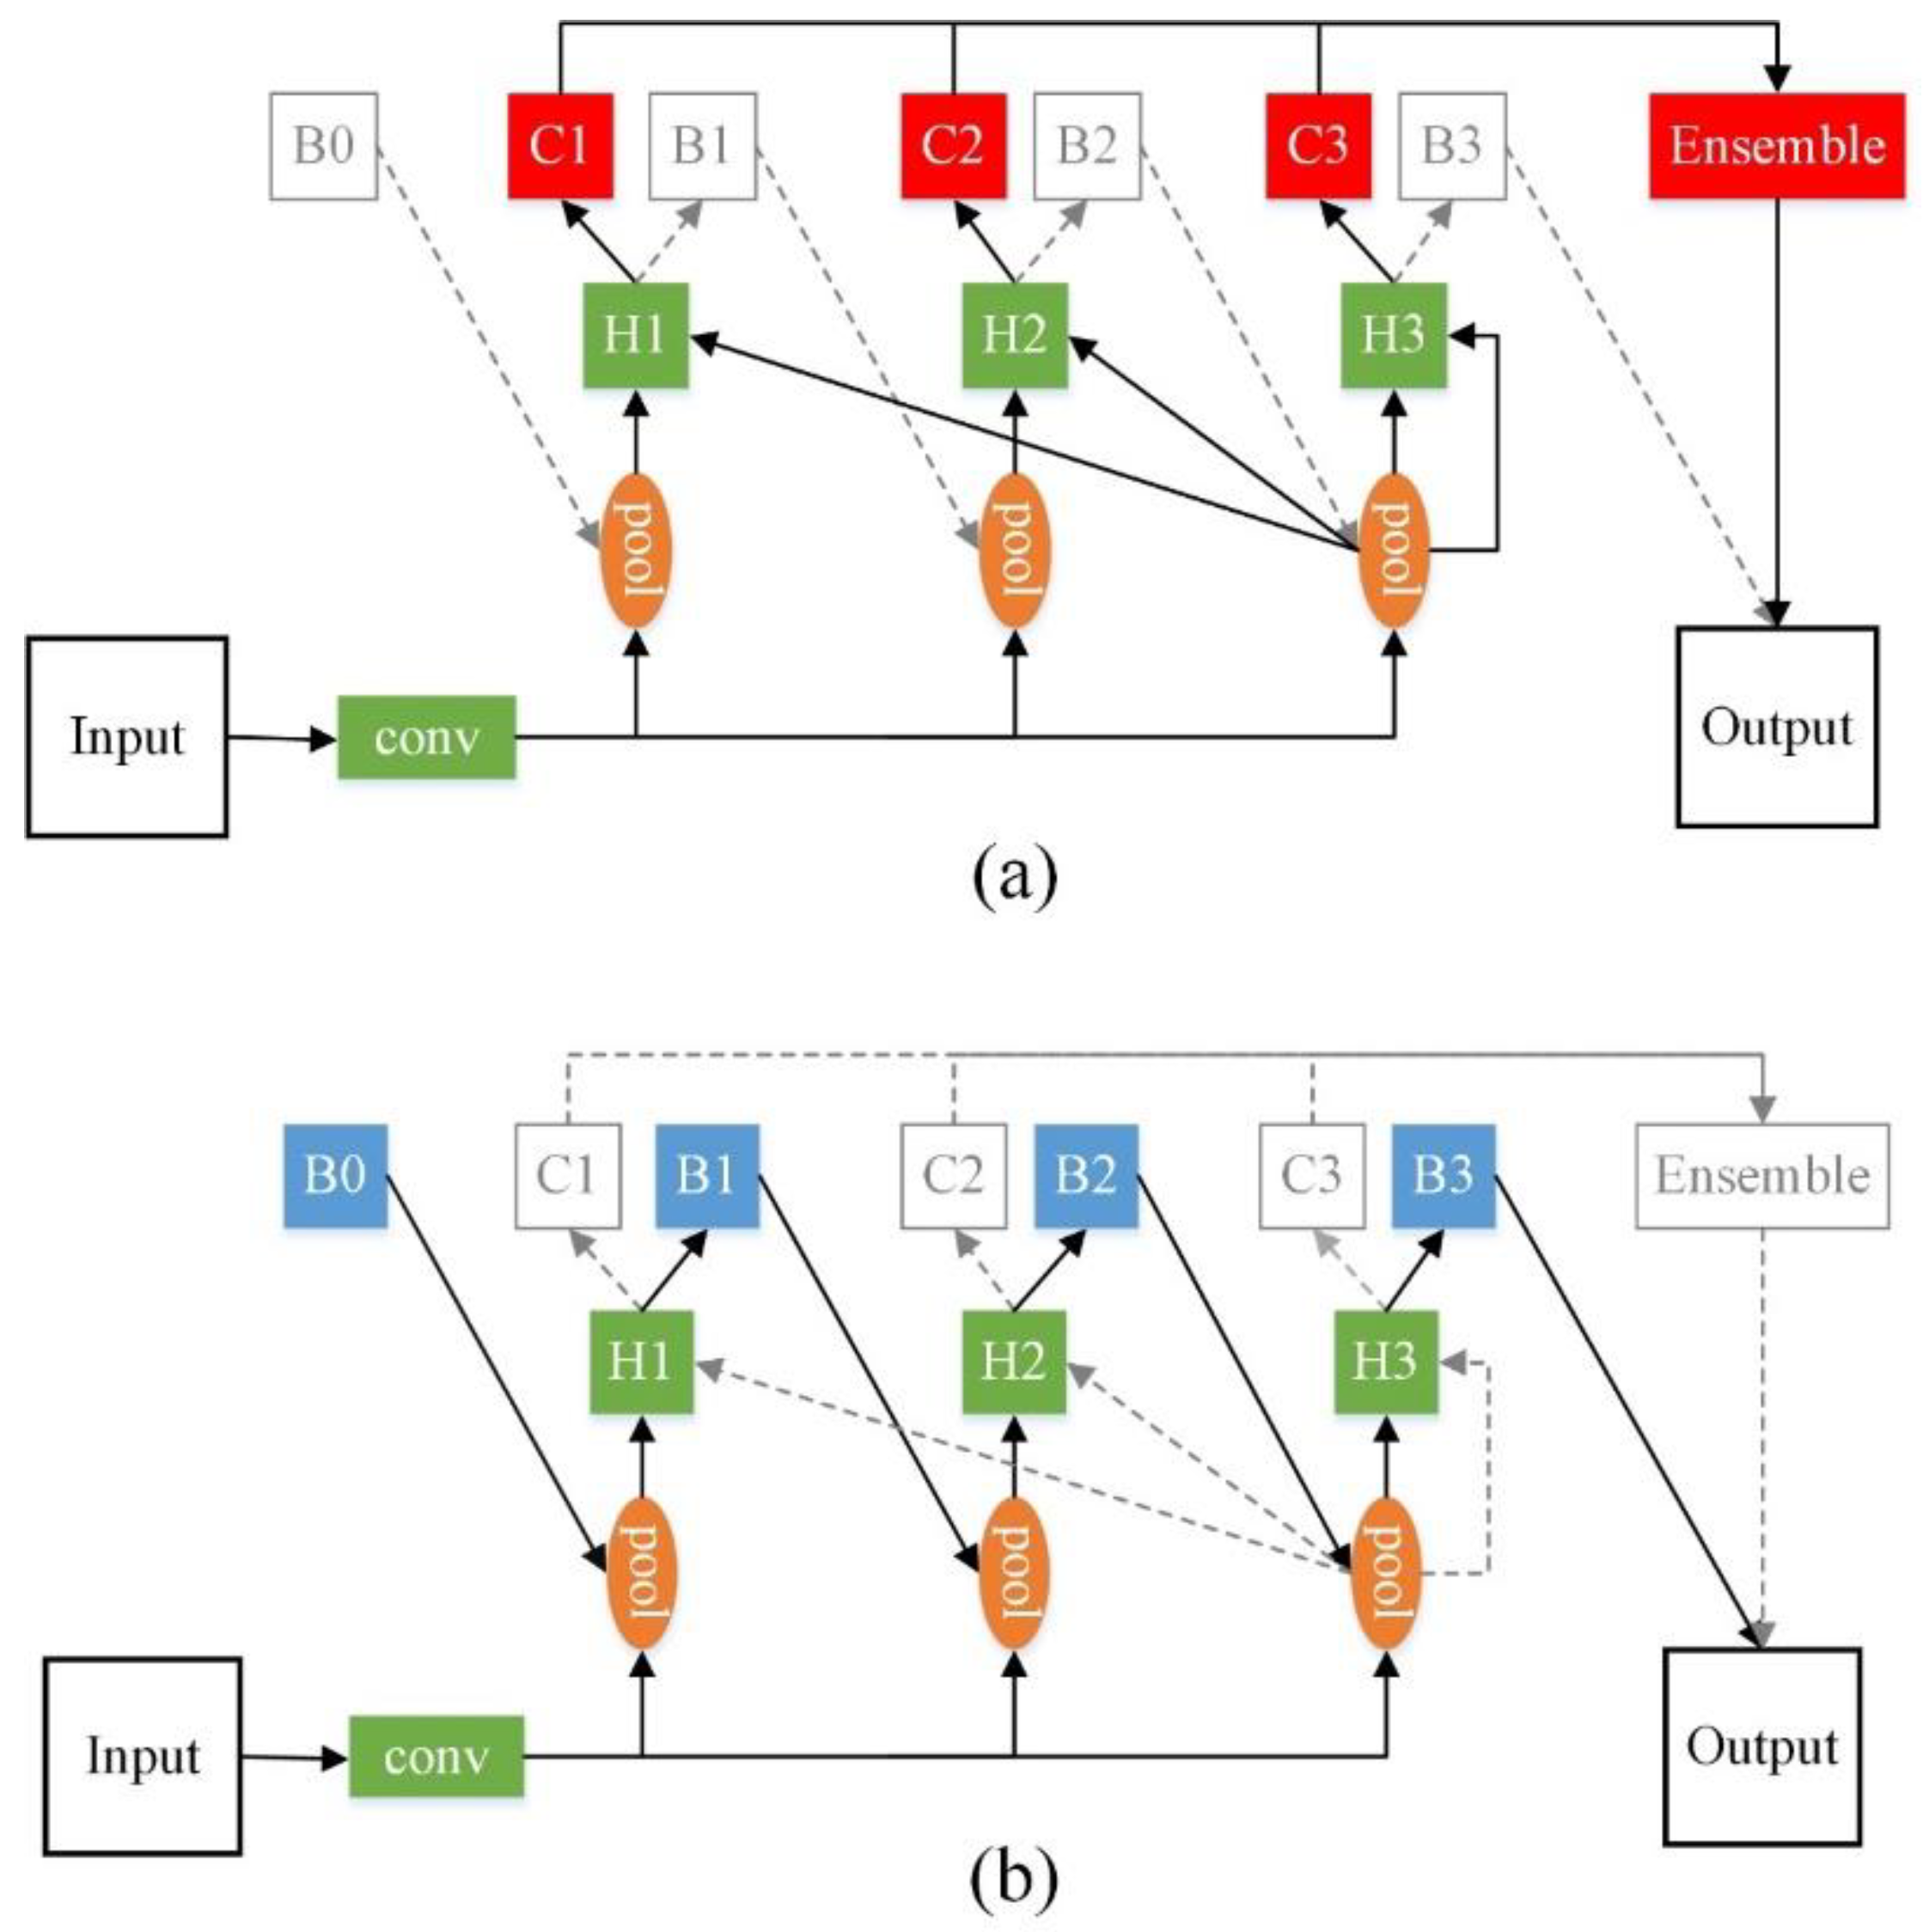
In this paper, we investigated the causes of performance degradation when adding more cascaded stages. We found that at inference, the original ensemble strategy in Cascade R-CNN introduces a mismatch between the classifier and region of interest (RoI) vectors, decreasing the classification accuracy.
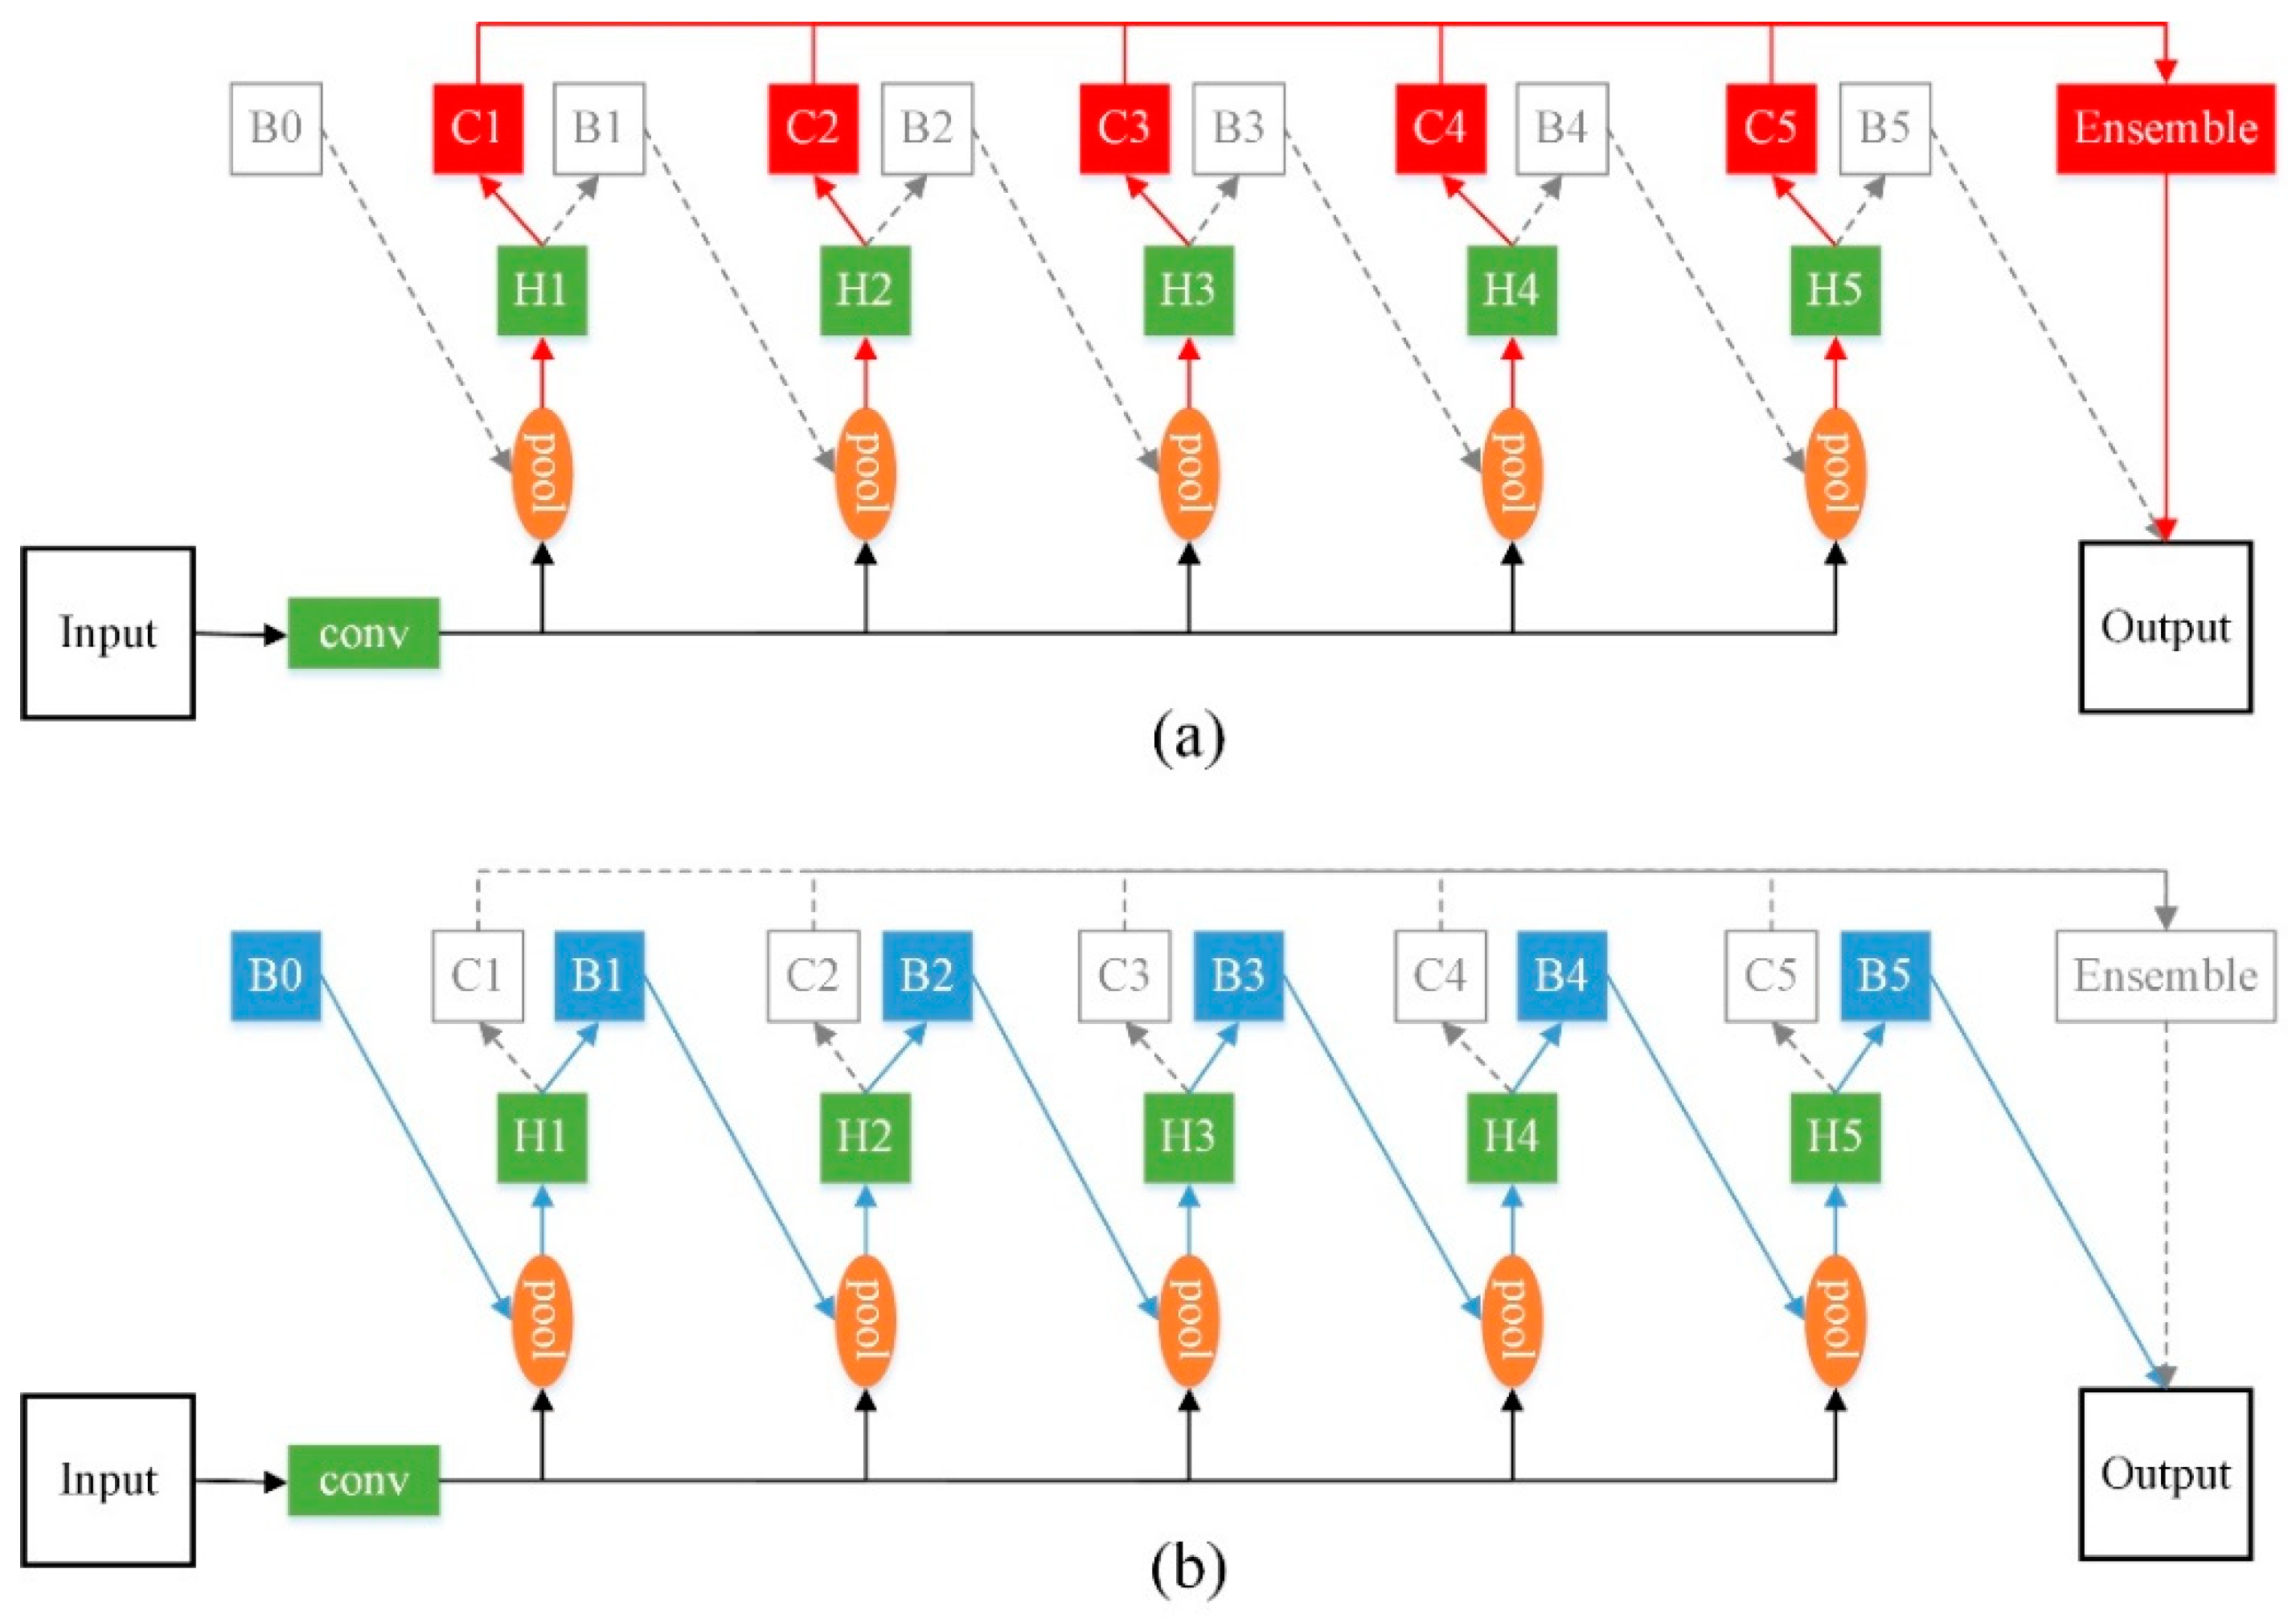
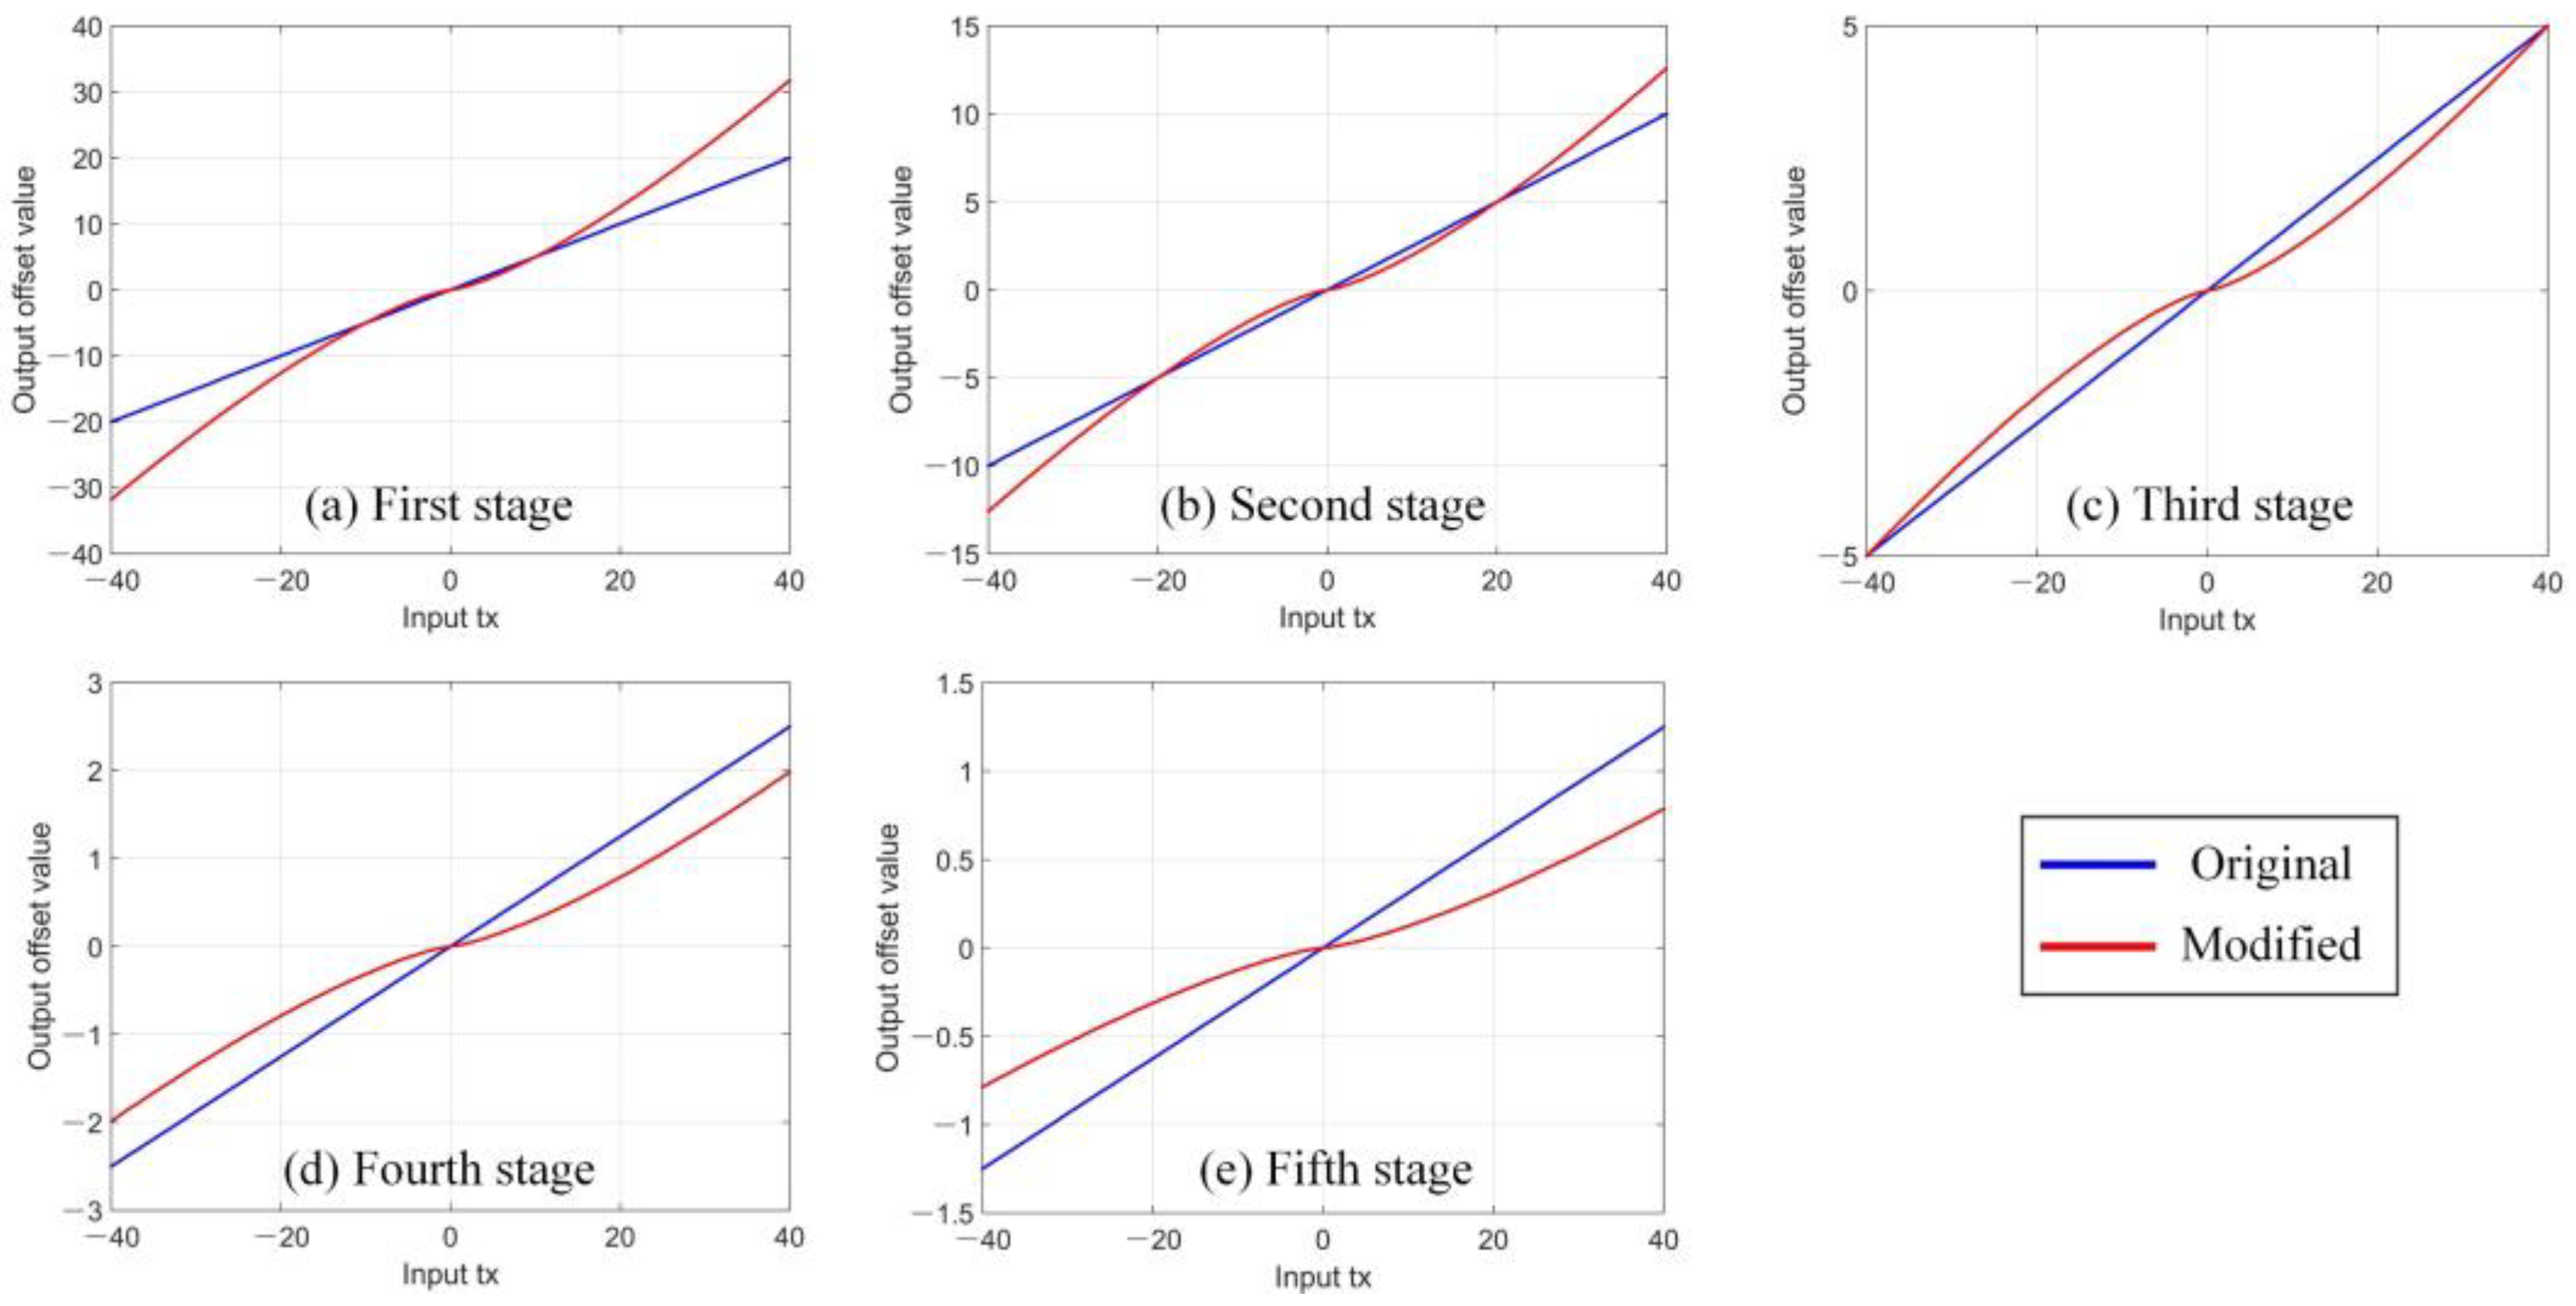
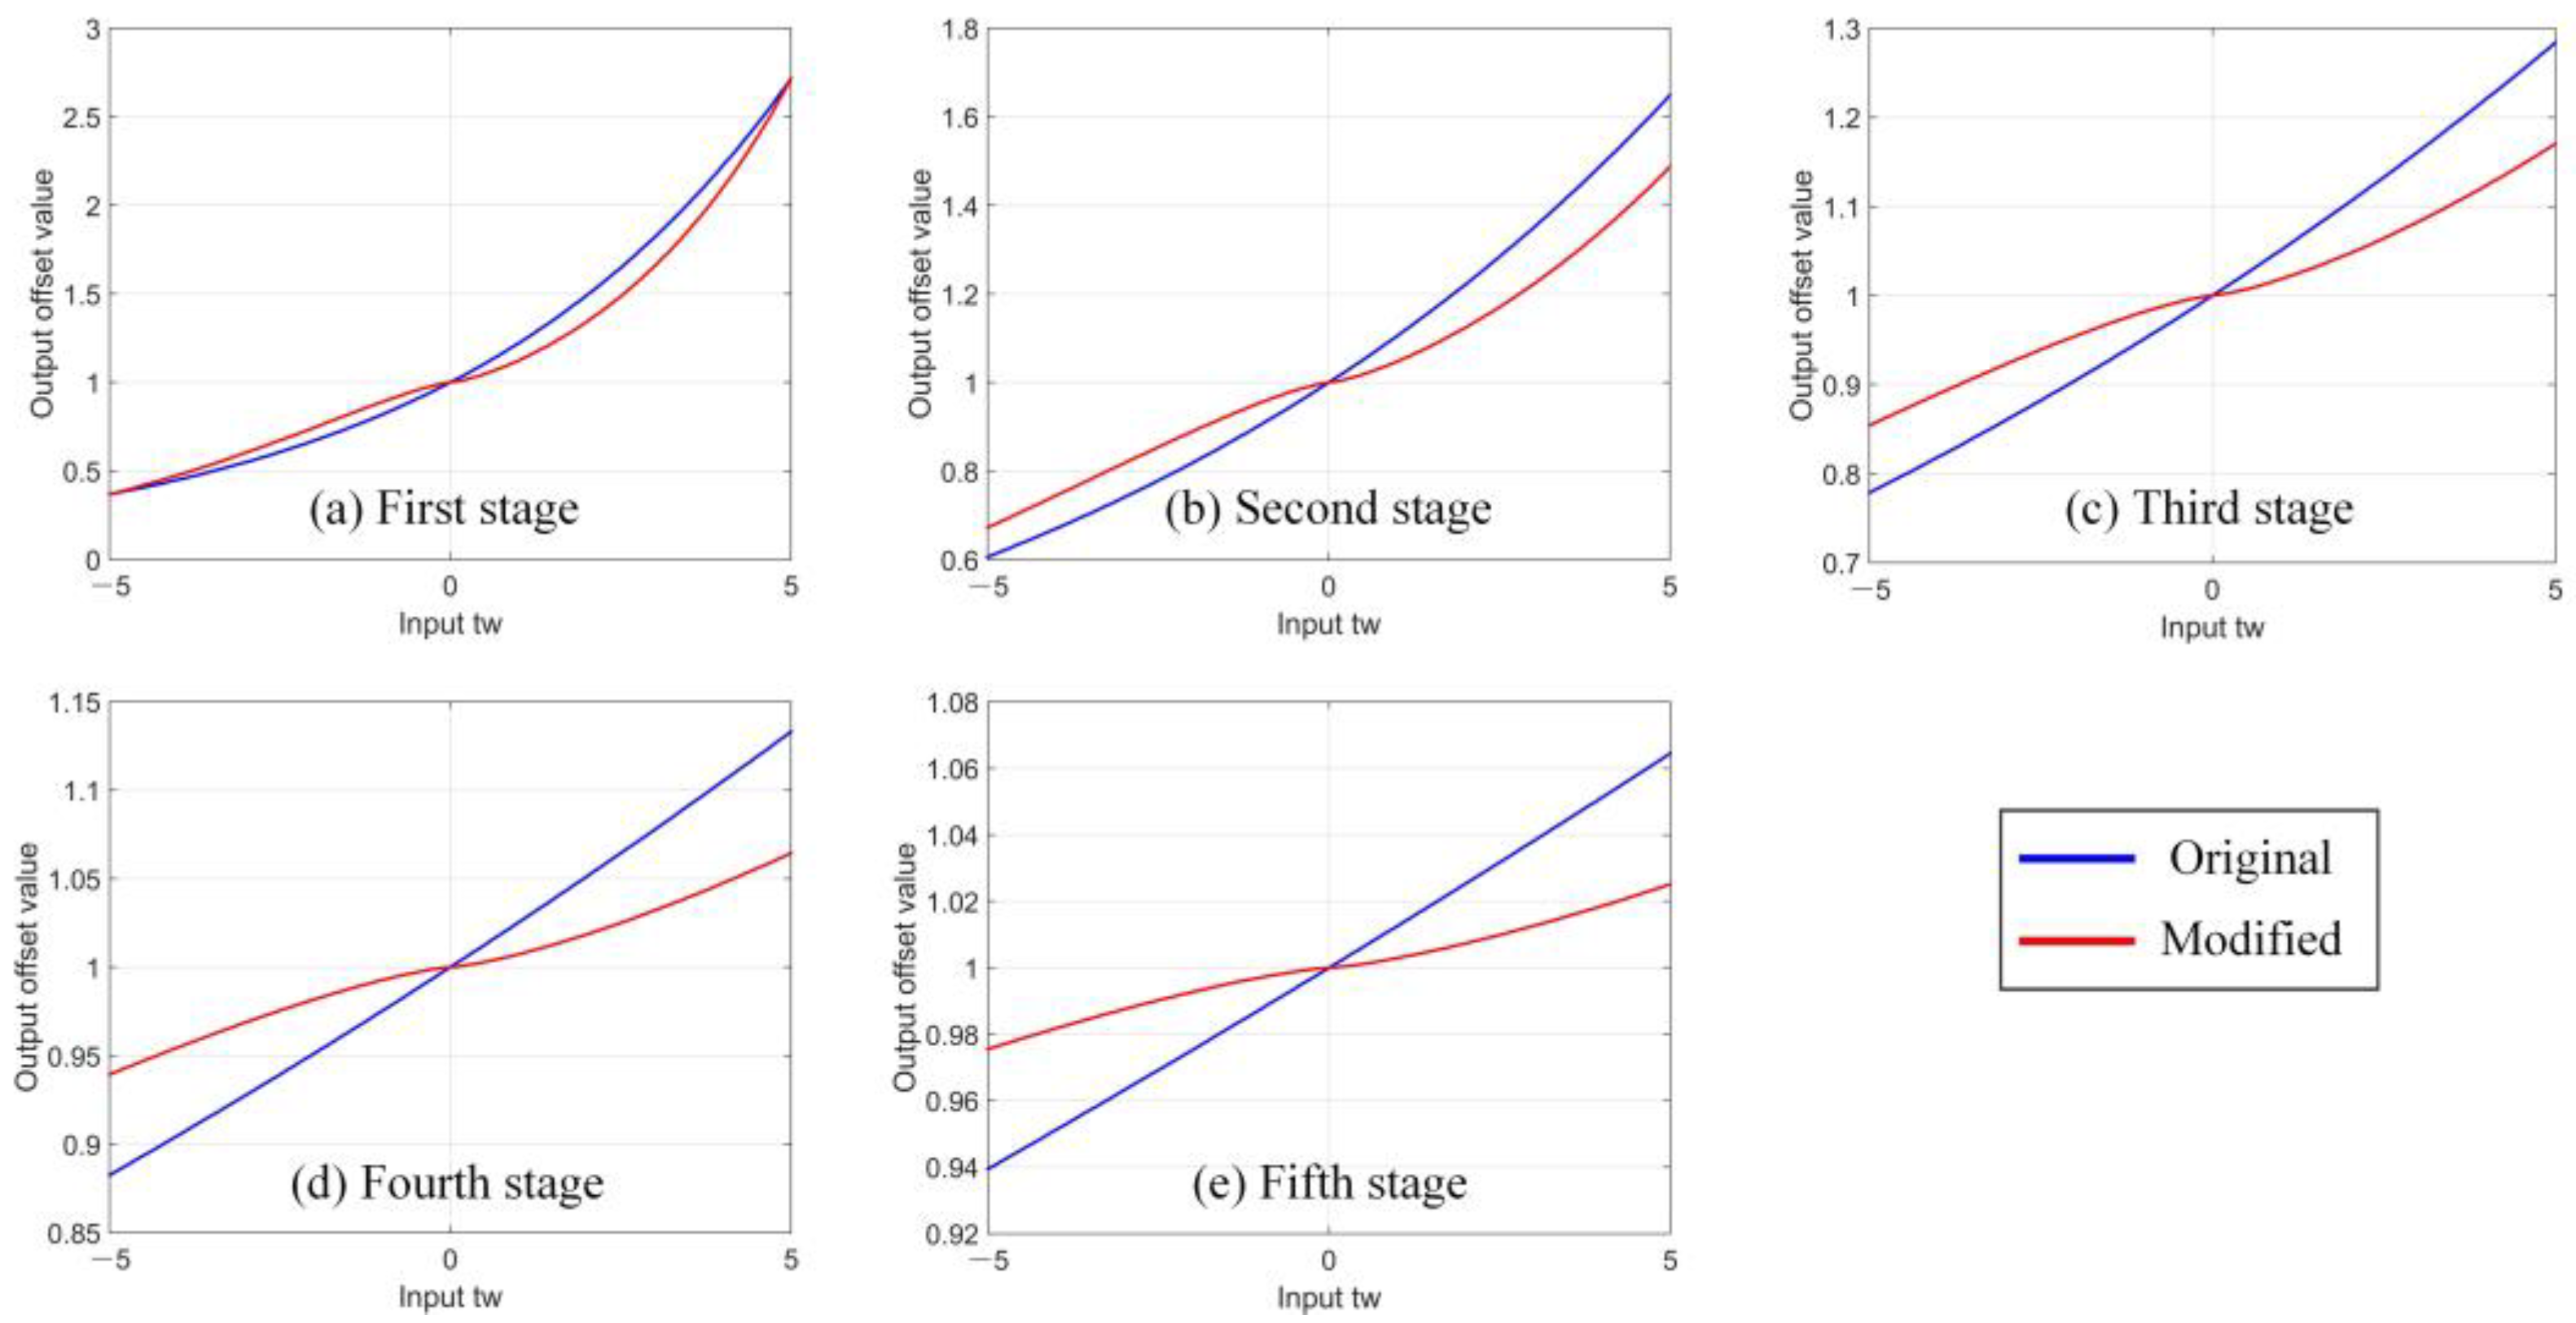
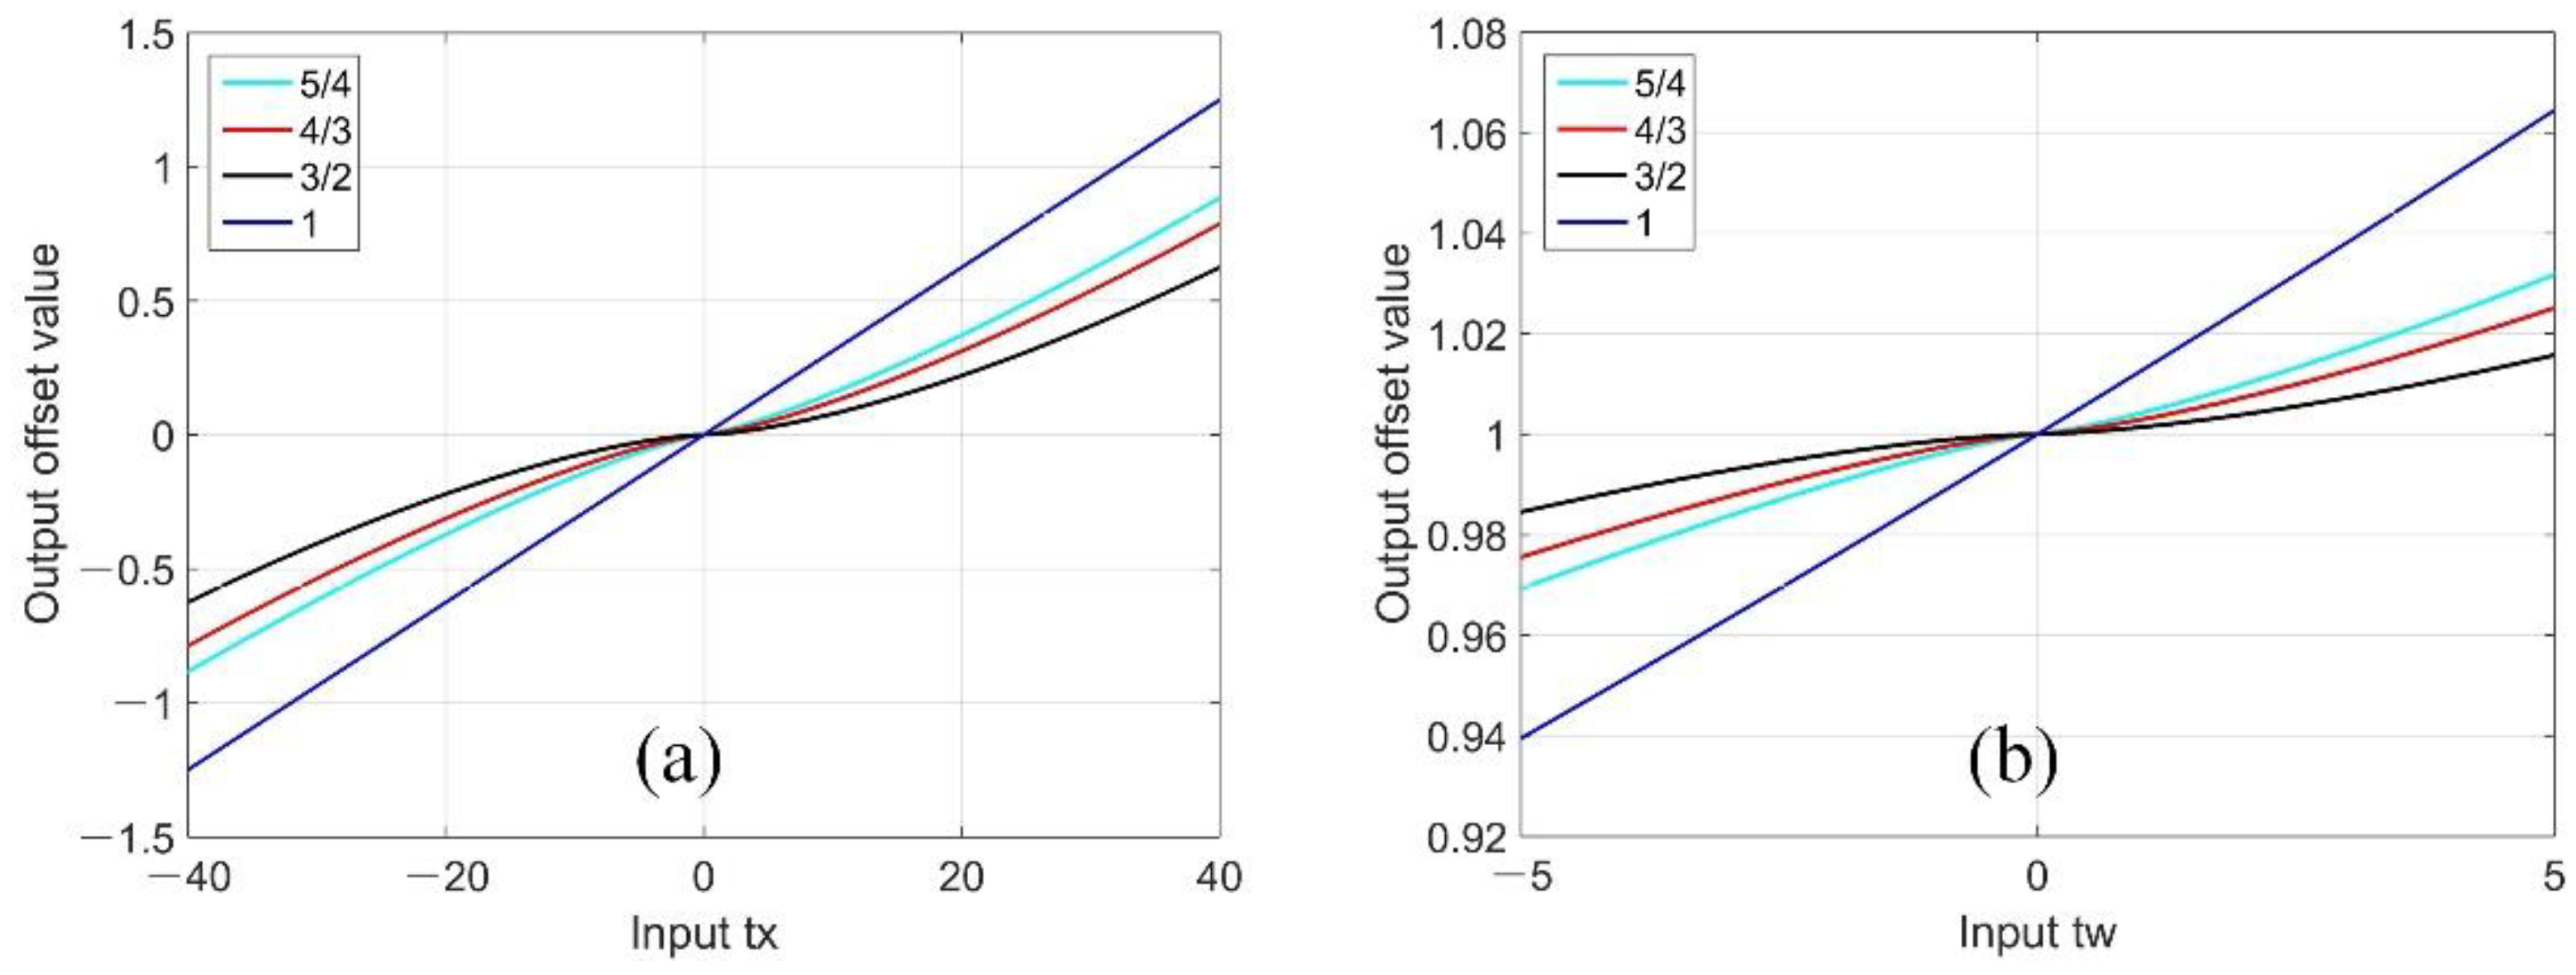
To overcome this limitation, we propose a new ensemble strategy for cascaded classification by taking the RoI features produced by the same stage for classification, rather than uniformly using those from the final stage. The final classification results are obtained by integrating the classifier outputs of all stages. In addition, the loss function of bounding box regression [26] is modified to improve sensitivity, allowing the cascaded regressor to further converge as the number of stages increases. The modified cascade structure is denoted as Cascade R-CNN++ throughout this paper.
The main contributions of this study are as follows: (1) we investigated the causes of performance degradation in cascaded detectors when more stages are added, (2) we propose a new ensemble strategy to minimize the mismatch between the classifiers and input RoIs at inference and to improve classification accuracy, and (3) we propose a modified loss function for bounding box regression to enable further convergence of bounding box regression with more stages built. The proposed Cascade R-CNN++ approach can achieve state-of-the-art detection performance on the remote sensing dataset DOTA [27,28]. It can be implemented in most cases where region-proposal-based methods are needed. In experiments with multiresolution remote sensing images, the proposed approach outperforms Cascade R-CNN both in detection quality and precision.
The rest of this paper is arranged as follows. Section 2 reviews previous studies most relevant to this research. Section 3 introduces the employed dataset and evaluation metrics. Section 4 analyzes the reasons for performance degradation when more stages are added in Cascade R-CNN. Section 5 describes the proposed method, Cascade R-CNN++. Section 6 presents experimental results with discussion, and Section 7 draws the conclusions.

2. Related Works

In the computer vision field, deep-learning-based detectors can be generally divided into two categories. The first is one-stage approaches that are more efficient with simpler structures, represented by YOLO [29,30,31], single-shot detection (SSD) [32], and RetinaNet [33]. The other category is two-stage approaches (i.e., region-proposal-based methods), represented by region-based convolutional neural networks (R-CNNs) [26], Fast R-CNN [34], Faster R-CNN [35], Feature Pyramid Network (FPN) [36] and Cascade R-CNN [24]. In the second category, the multi-scale region proposals are produced firstly, followed by the feature extraction and bounding box regression procedure. Although one-stage models have achieved high precision in object detection, two-stage methods can generally be more flexible and extensible across different computer vision tasks, such as objection detection, instance segmentation and key point detection. Thus, this research focuses on two-stage detectors and aims to alleviate the problem limiting the further extension of the cascaded structure.
R-CNN [26] was proposed in 2014. It employs a two-stage structure for object detection, combining region proposals with CNN extracted features. R-CNN employs selective search algorithms to generate approximately 2000 candidate region proposals from the input image and applies CNNs to create feature vectors for each object proposal. The performance of R-CNN was validated on natural scene images using the PASCAL VOC 2012 dataset, reaching a mean Average Precision (mAP) of 53.3%. Fast R-CNN [34] improves computational efficiency by integrating the three training stages in R-CNN, achieving a mAP of 68.4% on PASCAL VOC 2012 test. R-CNN and Fast R-CNN both employ the selective search approach to generate object proposals, which is more computationally expensive. Faster R-CNN [35] replaces the selective search algorithm with a region proposal network (RPN), introducing anchors to identify region proposals using a fully convolutional network and significantly reduces time consumption. It achieved detection accuracy of 70.4% mAP on PASCAL VOC 2012 dataset. RPN has a fixed receptive field size, where objects are of various scales.
Only using the topmost feature layer for proposal generation can lead to missed detection of small objects. FPN [36] can extract top-down multiscale feature layers for RPN to generate region proposals. As different layers have different receptive fields, a combination of FPN and Faster R-CNN can better adapt to the detection of objects of different scales. Faster R-CNN & FPN achieved AP of 35.8% on the COCO detection benchmark [36]. More recent studies also contributed to improve the feature pyramid for object detection in optical remote sensing images, such as aware feature pyramid network (AFPN) [37] and Feature Enhancement Network (FENet) [38], achieving 74.3% and 74.89% mAP (PASCAL VOC metric) on DOTA-v1.0 dataset, respectively.
Besides two-stage architectures, multistage detectors, including Cascade R-CNN [24,25], have recently been proposed. Cascade R-CNN uses a three-stage structure and can achieve better performance than two-stage detectors through cascaded bounding box regression and an ensemble of cascaded classification results. In the design of cascaded detectors, regressed bounding boxes from the previous stage act as region proposals for the current stage to progressively improve the quality of region proposals in the cascaded structure. Linearly increased IoU thresholds (0.5, 0.6, and 0.7) are used for training at each stage to better match the quality of input proposals to train high-quality detectors. Cascade R-CNN obtained 38.9% AP on MS-COCO 2017. However, degraded performance is observed when the fourth stage is added to Cascade R-CNN [25].

3. Datasets and Evaluation Metrics

The DOTA-v1.5 dataset [27], which contains 2806 images and 403,318 instances, was employed in this study, in Section 4, Section 6 and Section 7. It consists of 16 categories of objects, i.e., airplane, ship, storage tank, baseball diamond, tennis court, basketball court, ground track field, harbor, bridge, large vehicle, small vehicle, helicopter, roundabout, soccer ball field, swimming pool, and container crane. The proportions of the training, validation, and testing sets are 1/2, 1/6, and 1/3, respectively.
Another remote sensing dataset, NWPU VHR-10 [6,12,39], was also used in the comparison with state-of-the-art detectors in Section 6. NWPU VHR-10 dataset is a publicly available geospatial object detection dataset. It contains 800 very-high-resolution (VHR) remote sensing images cropped from Google Earth and Vaihingen dataset and annotated by experts. The dataset consists of 10 categories of objects, including airplane, ship, storage tank, baseball diamond, tennis court, basketball court, ground track field, harbor, bridge, and vehicle.
In this research, Intersection over Union (IoU) was used to measure the amount of overlap between the predicted and ground truth bounding box. It is a ratio from 0 to 1 that specifies the accuracy of object localization. The IoU threshold used in training defines the detection quality. The metrics of AP, AP50, AP75, AP90, APS, APM and APL, as defined in the metric standard of MS COCO object detection challenge [40], were taken to assess the detection precision. The abovementioned metrics have been widely used to evaluate object detection tasks.

4. Causes of Performance Degradation in a Four-Stage Cascade R-CNN

Cascade R-CNN [25] uses three-stage cascaded detectors to progressively improve the IoU distribution of training samples. Higher precision of object localization can be achieved through cascaded regression. However, when the fourth stage is added, the metrics of AP, AP50, AP60, AP70, and AP80 all decrease, and only AP90 slightly increases. Herein, we investigate the causes of the performance degradation.

4.1. Cascaded Bounding Box Regression

We compare the IoU distribution of training samples among different stages in Cascade R-CNN (Figure 1). The training samples were generated by original Cascade R-CNN with an extended five-stage structure on the training set of DOTA-v1.5. The IoU distribution of the first stage was analyzed on the region proposals, i.e., the output of Region Proposal Network (RPN). The IoU distributions of the second, third, fourth and fifth stages were plotted using the output of the bounding box regression of the previous stage. Thus, the IoU distribution of the fifth stage indicates the quality of bounding boxes obtained from the fourth stage, and so on. The IoU thresholds of 0.5, 0.6, 0.7, and 0.75 were used for the first~fourth stages, as empirically set up in literature [25]. For the fifth stage, an empirical threshold of 0.85 was chosen. Please note that the IoU threshold at the fifth stage does not affect the output of bounding box regression of the fourth stage, thus has no effects on the precision of bounding box regression from the first to fourth stages.
The above settings reproduced the training samples and bounding box regression output of the four-stage model of Cascade R-CNN in literature. Figure 1a–d plot the IoU distributions of the training samples for the first to fourth stages. Figure 1b–e reflect the IoU distribution of the output of bounding box regression of the first to fourth stages. The purpose was to analyze whether the cascaded bounding box regression under the original threshold settings lead to the degraded performance of the four-stage Cascade R-CNN.
As shown in Figure 1, from the first to fifth stage of the detector, the IoU distribution of training samples is improved, with the histogram peak gradually moving from low to high IoU values, and no performance decrease is observed. This suggests that the quality of the input proposals is still being improved even in the fifth stage. In other words, the output of bounding box regression from the first, second, third, and fourth stages were all improved over the corresponding training samples. Thus, cascaded bounding box regression, even under the empirical settings of IoU threshold, is not responsible for the degraded performance of the fourth-stage model of Cascade R-CNN.
In addition, it is found that the improvement of the IoU distribution is not linear and it slows down with the increase of stages. Thus, the IoU thresholds at each stage should not be increased linearly in the cascaded structure. Further tuning of the thresholds has the potential to further improve the precision of bounding box regression.

4.2. Mismatch between RoI Features and the Classifier

In Cascade R-CNN, each classifier is trained using RoI features produced by the same stage. At inference, the RoI features produced by the final stage are sent to all trained classifiers, the outputs of which are then averaged to obtain the final classification results (Figure 2). RoI features provided by the final stage are usually the closest match to the real object as they are produced using the most accurate bounding box after cascaded regression. However, the most accurate RoIs may not be the best match to the classifiers trained in previous stages.
To investigate the impacts of the mismatch, under the same conditions, we compared the detection precision measurements of different combinations of classifiers and RoI features. First, a five-stage example of Cascade R-CNN was built. Each classifier was trained using the RoI features produced by the same stage. Then, the detection precision measurements of different combinations were compared. For instance, the RoI features produced in the fifth stage were sent to the classifier of the first stage, and the precision was calculated using a single pair of 1# stage and 5# RoI only. The same procedure was applied to other combinations, as listed in Table 1. The experiment was carried out using original settings of Cascade R-CNN with ResNet50 backbone. The settings of IoU threshold are the same as Section 4.1, i.e., 0.5, 0.6, 0.7, 0.75, and 0.85 for the first to fifth stages in sequence.
From Table 1, we can see that the combination of 1# classifier and 1# RoI outperforms the pair of 1# classifier and 5# RoI, the pair of 2# classifier and 2# RoI outperforms the combination of 2# classifier and 5# RoI, and the pair of 3# classifier and 3# RoI outperforms that of 3# classifier and 5# RoI. However, the pair of 4# classifier and 4# RoI achieves similar performance to that of 4# classifier and 5# RoI. The reason could be that the improvement of IoU distribution is not significant after the fourth stage, which implies that 5# stage produces RoI features similar to that of 4# RoI. Thus, 4# classifier exhibits similar performance using either 4# or 5# RoI.
The above findings suggest that the mismatch between the classifier and RoI features is the main cause of performance degradation in Cascade R-CNN when more stages are added. The bounding box predicted by the primary stage detection head is coarse, resulting in a large difference between the RoI features and the target instance features, while the last stage’s RoI features are much closer to the target instance features. However, as the primary stage’s classifier was trained using the primary stage’s RoI features, it is difficult for the primary stage’s head to predict an ideal result with the last stage’s RoI features.

5. Proposed Method: Cascade R-CNN++

In this section, we propose the Cascade R-CNN++ approach by modifying Cascade R-CNN. First, we propose a new ensemble strategy for the classifier and RoI features at inference. Second, we propose an improved loss function for bounding box regression to achieve high sensitivity around zero, which allows further convergence with more stages added. A five-stage example of the proposed Cascade R-CNN++ is shown in Figure 3. RPN is adopted for region proposal generation.

5.1. New Ensemble Strategy for Classification

As defined in [25], a classifier is denoted as a function h ( x i ) that assigns a feature vector x i to one of the m + 1 classes, where 0 is the background, and each of the remaining values represents a class. The output of a classifier is an m + 1 dimensional vector, with the maximum value indicating the category in which the object in the bounding box belongs to. The classifier is trained by minimizing the cross-entropy loss R c l s as follows:
R c l s [ h ] = i = 1 N c l s L c l s ( h ( x i ) , y i )
where i is the index of the feature vector, N c l s is the number of feature vectors, ( x i , y i ) are the training samples, x i is the feature vector, y i is the class label, and L c l s is the classical cross-entropy loss function.
As shown in Figure 3a, in the proposed ensemble strategy, instead of using RoI features from the last stage for all classifiers, at inference, we use RoI features produced at the same stage as the input of the classifier. In other words, the same RoI features are used for the same classifier during both training and inference. The classification results of each stage are then integrated by averaging to generate the final classification result.

5.2. Modified Loss Function for Bounding Box Regression

At each stage, a bounding box regressor is used to gradually move the candidate proposals closer to the ground-truth position by minimizing the offsets between the real and candidate bounding boxes. An input proposal p can be transformed into a predicted ground-truth box g through the following transformation:
( t x / c x ) × p w + p x = g x ( t y / c y ) × p h + p y = g y exp ( t w / c w ) × p w = g w exp ( t h / c h ) × p h = g h
thus
( t x / c x ) = ( g x p x ) / p w ( t y / c y ) = ( g y p y ) / p h ( t w / c w ) = log ( g w / p w ) ( t h / c h ) = log ( g h / p h )
where p = ( p x , p y , p w , p h ) denotes the position of the input proposal and g = ( g x , g y , g w , g h ) is the predicted ground-truth box. Δ = ( t x / c x , t y / c y , t w / c w , t h / c h ) represents the distance vector, i.e., the minor adjustments performed by the bounding box regressor. c x , c y , c w , c h are the weights affecting the magnitude of the distance vector, the weights c x , c y , c w , c h are initially set as (10, 10, 5, 5) and progressively increase with the increase of stages. As the bounding box regressor implements fine-tuning over the offset vector Δ , these values are usually very small. Thus, normalization is performed to Δ [25,35,36,41].
For an image patch x j , the loss function of bounding box regression used in Cascade R-CNN [25] can be expressed as follows:
R l o c [ f ] = j = 1 N l o c L l o c ( f ( x j , p j ) , g j )
where R l o c is the cross-entropy loss of bounding box regression, j is the index of a candidate proposal, N l o c is the number of candidate proposals, and L l o c denotes the S1 smooth L1 function [24]:
L L O C ( a , b ) = i { x , y , w , h } s m o o t h L 1 ( a i b i )
s m o o t h L 1 ( x ) = { 0.5 x 2 , | x | < 1 | x | 0.5 , otherwise
where f ( x j , p j ) is the bounding box regression function, and p j = ( p x j , p y j , p w j , p h j ) is the j th candidate proposal with four coordinates, i.e., the center position ( p x j , p y j ) , and the box width and height ( p w j , p y j ) . g j represents the predicted ground-truth box and is specified in the same way ( g j = ( g x j , g y j , g w j , g h j ) ). Henceforth, unless needed, we ignore the superscript j for simplicity.
To enable further convergence in the cascaded regression with more stages, we improve the loss function for the bounding box regression to achieve higher sensitivity around zero. The modified regression loss function is defined as
sgn ( t x / c x ) × | t x / c x | 4 / 3 × p w + p x = g x sgn ( t y / c y ) × | t y / c y | 4 / 3 × p h + p y = g y exp ( sgn ( t w / c w ) × | t w / c w | 4 / 3 ) × p w = g w exp ( sgn ( t h / c h ) × | t h / c h | 4 / 3 ) × p h = g h
where sgn is the signum function and the exponent 4 / 3 of the terms ( t k / c k ) 4 / 3 , and k { x , y , w , h } is designed to increase the nonlinearity and maintain a tradeoff between sensitivity and the gradient of the loss.
The input ( t x , t y , t w , t h ) is plotted against the bounding box output offsets ( g x p x , g y p y , g w / p w , g h / p h ) for the original and modified loss functions with different weights c i , i { x , y , w , h } for different stages (Figure 4 and Figure 5). The modified loss function has smoother curves around zero, indicating that the regressor has a smaller step size (i.e., higher sensitivity) when the offsets between the candidate bounding box and the ground-truth approach zero. This modification enables the further convergence of the cascaded bounding box regressor as the stages increase. This is demonstrated in Section 6.
The effects of taking different exponent values in the loss function are illustrated in Figure 6. We can see that a larger exponent value corresponds to a higher sensitivity of the loss function around zero, but the convergence rate is slower. The exponent term of 4 / 3 is a tradeoff between the sensitivity and convergence rate. The value is an empirical value chosen after multiple experiments.

6. Experimental Results

6.1. Implementation Details

The experiments were carried out on DOTA-v1.5 dataset [27], using several popular baseline detectors, including Faster R-CNN [35], FPN [36], and RetinaNet [33] with ResNet50 backbone [42]. TITAN X Pascal with eight GPUs was used for training and testing. All experiments were implemented on the Detectron codebase [43], which is powered by the Caffe2 deep learning framework. As most of the state-of-the-art object detection methods provided by the Detectron codebase do not predict oriented bounding box (OBB), for ease of comparison with other detectors, the horizontal bounding box (HBB) annotation is used throughout this paper. With reference to the settings of Detectron [43], all images in the dataset were cropped to 600 pixels × 1000 pixels. Stochastic gradient descent with momentum (set as 0.9) was adopted as the training method. Training was started at a learning rate of 0.02, which was decreased to 0.002 and 0.0002 in 120 k and 160 k iterations, respectively, and completed in 180 k iterations. The penalty factor was 0.0001. Each synchronized GPU held one image per iteration. We also warmed up our training using a smaller learning rate of 0.005 × 0.3 for the first iteration [44]. We used up to 2000 RoIs for training and 1000 RoIs for testing. The RoI-Align technique [41] was also adopted.
In two-stage detectors, due to the low quality of input region proposals, an IoU threshold of 0.5 is widely used, as a standard compromise between the goals of effective training and less noisy detection. In Cascade R-CNN, due to the progressively improved IoU distribution of input proposals, to achieve higher quality of training, the IoU threshold was empirically set as 0.6 and 0.7 for the second and third stages, respectively. In a cascaded structure, with an increase in the number of stages, increasing the IoU threshold linearly will result in too few positive samples. In the case of Cascade R-CNN++, to ensure effective training at each stage, we propose a method to automatically determine the specific IoU threshold for all stages from the second stage onward, according to the IoU distribution of the training samples. The threshold for the first stage remains the same (i.e., 0.5) as two-stage detectors and Cascade R-CNN. To guarantee effective training, at least 20% of the training samples should be positive. Thus, starting from the second stage and so on, the IoU threshold can be automatically determined using the 20% quantile of IoU distributions. Following this method, the IoU thresholds for a five-stage implementation of Cascade R-CNN++ was determined as U = { 0.5 , 0.673 , 0.723 , 0.743 , 0.745 } . Using the determined new thresholds, the proposed Cascade R-CNN++ was re-trained.
In addition, we decide whether to add one more cascade stage by evaluating the IoU distribution of the training samples. A new stage detector will not be added if the IoU distribution is not improved compared with the previous stage. For example, in this study, the 20% quantile of IoU of the sixth stage is 0.745, indicating that there is no need to add the sixth stage.

6.2. Stage-Wise Comparison

On the DOTA dataset, we compared the detection performance of three-, four-, and five-stage Cascade R-CNN++, all with the ResNet-50 backbone. The results are shown in Table 2, where AP indicates the average precision and AP50, AP75, and AP90 indicate the detection precision using IoU thresholds of 0.5, 0.75, and 0.9, respectively. APS, APM, and APL indicate the detection precision for small, medium, and large objects, respectively.
As shown in Table 2, the overall detection precision is improved with an increase in the stage, and there was no significant reduction in the inference speed as measured by FPS (Frames Per Second).

6.3. Ablation Experiments of the Proposed Modifications

The detection performance of Cascade R-CNN++ was further analyzed by ablation experiments using the ResNet-50 backbone. The results are shown in Table 3. The cascade detectors with both the new ensemble strategy and the modified loss function for bounding box regression achieved the best precision, with significant improvement in AP90.

6.4. Comparison with State-of-the-Art Detectors

The performance of the proposed Cascade R-CNN++ was compared with that of state-of-the-art two-stage/multi-stage detectors on DOTA-v1.5 dataset, as detailed in Table 4. Entries denoted by * used enhancements including multi-scale training/inference and SoftNMS, as in [43,45].
As shown in Table 4, the proposed Cascade R-CNN++ achieved higher precision in all the metrics than Faster R-CNN, FPN, RetinaNet and the original Cascade R-CNN. The most significant improvement is found on AP90, followed by the detection precision on medium and small objects (i.e., APM and APS). These results prove that the proposed method is effective and outperforms state-of-the-art detectors, especially in high-quality detection. In the experiment, we also implemented the Cascade R-CNN++ with multi-scale training/inference and softNMS, denoted by Cascade R-CNN++ * in Table 4. With these enhancements, Cascade R-CNN++ surpassed Cascade R-CNN by 4.6 points. It is worth noting that other recent studies explored improvements from different perspectives (e.g., feature pyramids), suggesting that the cumulative effect of these enhancements can further improve the performance of multi-stage detectors in the fields of remote sensing object detection, instance segmentation, key point detection, etc.
Comparison was also conducted on another remote sensing dataset, NWPU VHR-10 (Table 5). Training was started at a learning rate of 0.01, which was decreased to 0.001 and 0.0001 in 30 k and 40 k iterations, respectively, and completed in 50 k iterations. Other implementation settings are the same as the experiments on DOTA-v1.5.
From Table 5, we can see that the proposed Cascade R-CNN++ yielded the best performance on NWPU VHR-10 dataset, especially on high-quality detection revealed by AP75 and AP90. The detection precision on small objects achieved a 4.8% improvement over the original Cascade R-CNN approach.

6.5. Model Transferability on Multiresolution Remote Sensing Images

Further analysis was conducted to compare the transferability of the proposed model and the original Cascade R-CNN across multiresolution remote sensing images. Images in the remote sensing dataset DOTA-v1.5 were upscaled by different factors (e.g., two, three, and four). The detection model trained by original resolution images was directly used for inference to simulate most cases that detectors trained with limited data variability are employed to detect objects in images of different resolutions. As previously described, the DOTA-v1.5 dataset contains 16 categories of objects, such as airplane, ship, storage tank, large vehicle, small vehicle, etc. Here we take the detection of airplanes and harbors as examples. The performance achieved on object detection across multiresolution images are shown in Figure 7 (single object) and Figure 8 (multi objects).
As we can see from Figure 7, in single and large object detection, The IoUs obtained by Cascade R-CNN++ are slighted better than those of Cascade R-CNN. In multi-object detection (Figure 8), the performance of Cascade R-CNN decreases rapidly with an increase in upscale factors, whereas Cascade R-CNN++ exhibits much better transferability across different resolution images. In particular, for small object detection, as indicated by the white ellipse in Figure 8c,g, when images were upscaled by a factor of three, Cascade R-CNN++ could detect most of the small objects, whereas Cascade R-CNN missed most of the small objects. When images were upscaled by a factor of four, as in Figure 8d,h, both detection models miss-detected a number of small objects. In the detection of airplanes (Figure 8d), it is noticed that Cascade R-CNN miss-detected almost all small airplanes, whereas Cascade R-CNN++ could still detect several small airplanes.
We conducted the above experiments on all of the 16 categories of objects on all test images in DOTA-v1.5, using upscale ratios of 1, 3/2, 2, 5/2, 3, 24/7, and 4. The boxplots of the obtained IoU after bounding box regression are shown in Figure 9. The upscale ratio of 3/2 refers to the scenario that images were upscaled by a factor of two and downscaled by a factor of three. It is the same with other ratios.
From Figure 9, we can see that for remote sensing images upscaled by different ratios, Cascade R-CNN++ yielded higher IoU than Cascade R-CNN. The improvement in the IoU distribution obtained by Cascade R-CNN++ became more significant with an increase in the upscale ratio. These results indicate that Cascade R-CNN++ achieves higher detection quality than Cascade R-CNN in multiresolution remote sensing images.

7. Discussion

In this section, we discuss the impacts of IoU thresholds on the detection performance of cascaded detectors.
The majority of the region proposals produced by RPN or selective search have low quality, showing distribution concentrated around low IoU values. A high threshold will lead to too few positive samples, resulting in model overfitting. A low threshold will produce noisy detections. The IoU threshold of 0.5 is a standard compromise widely used in object detection models. This value is used as the initial threshold for the first stage, both in Cascade R-CNN and the proposed Cascade R-CNN++ model.
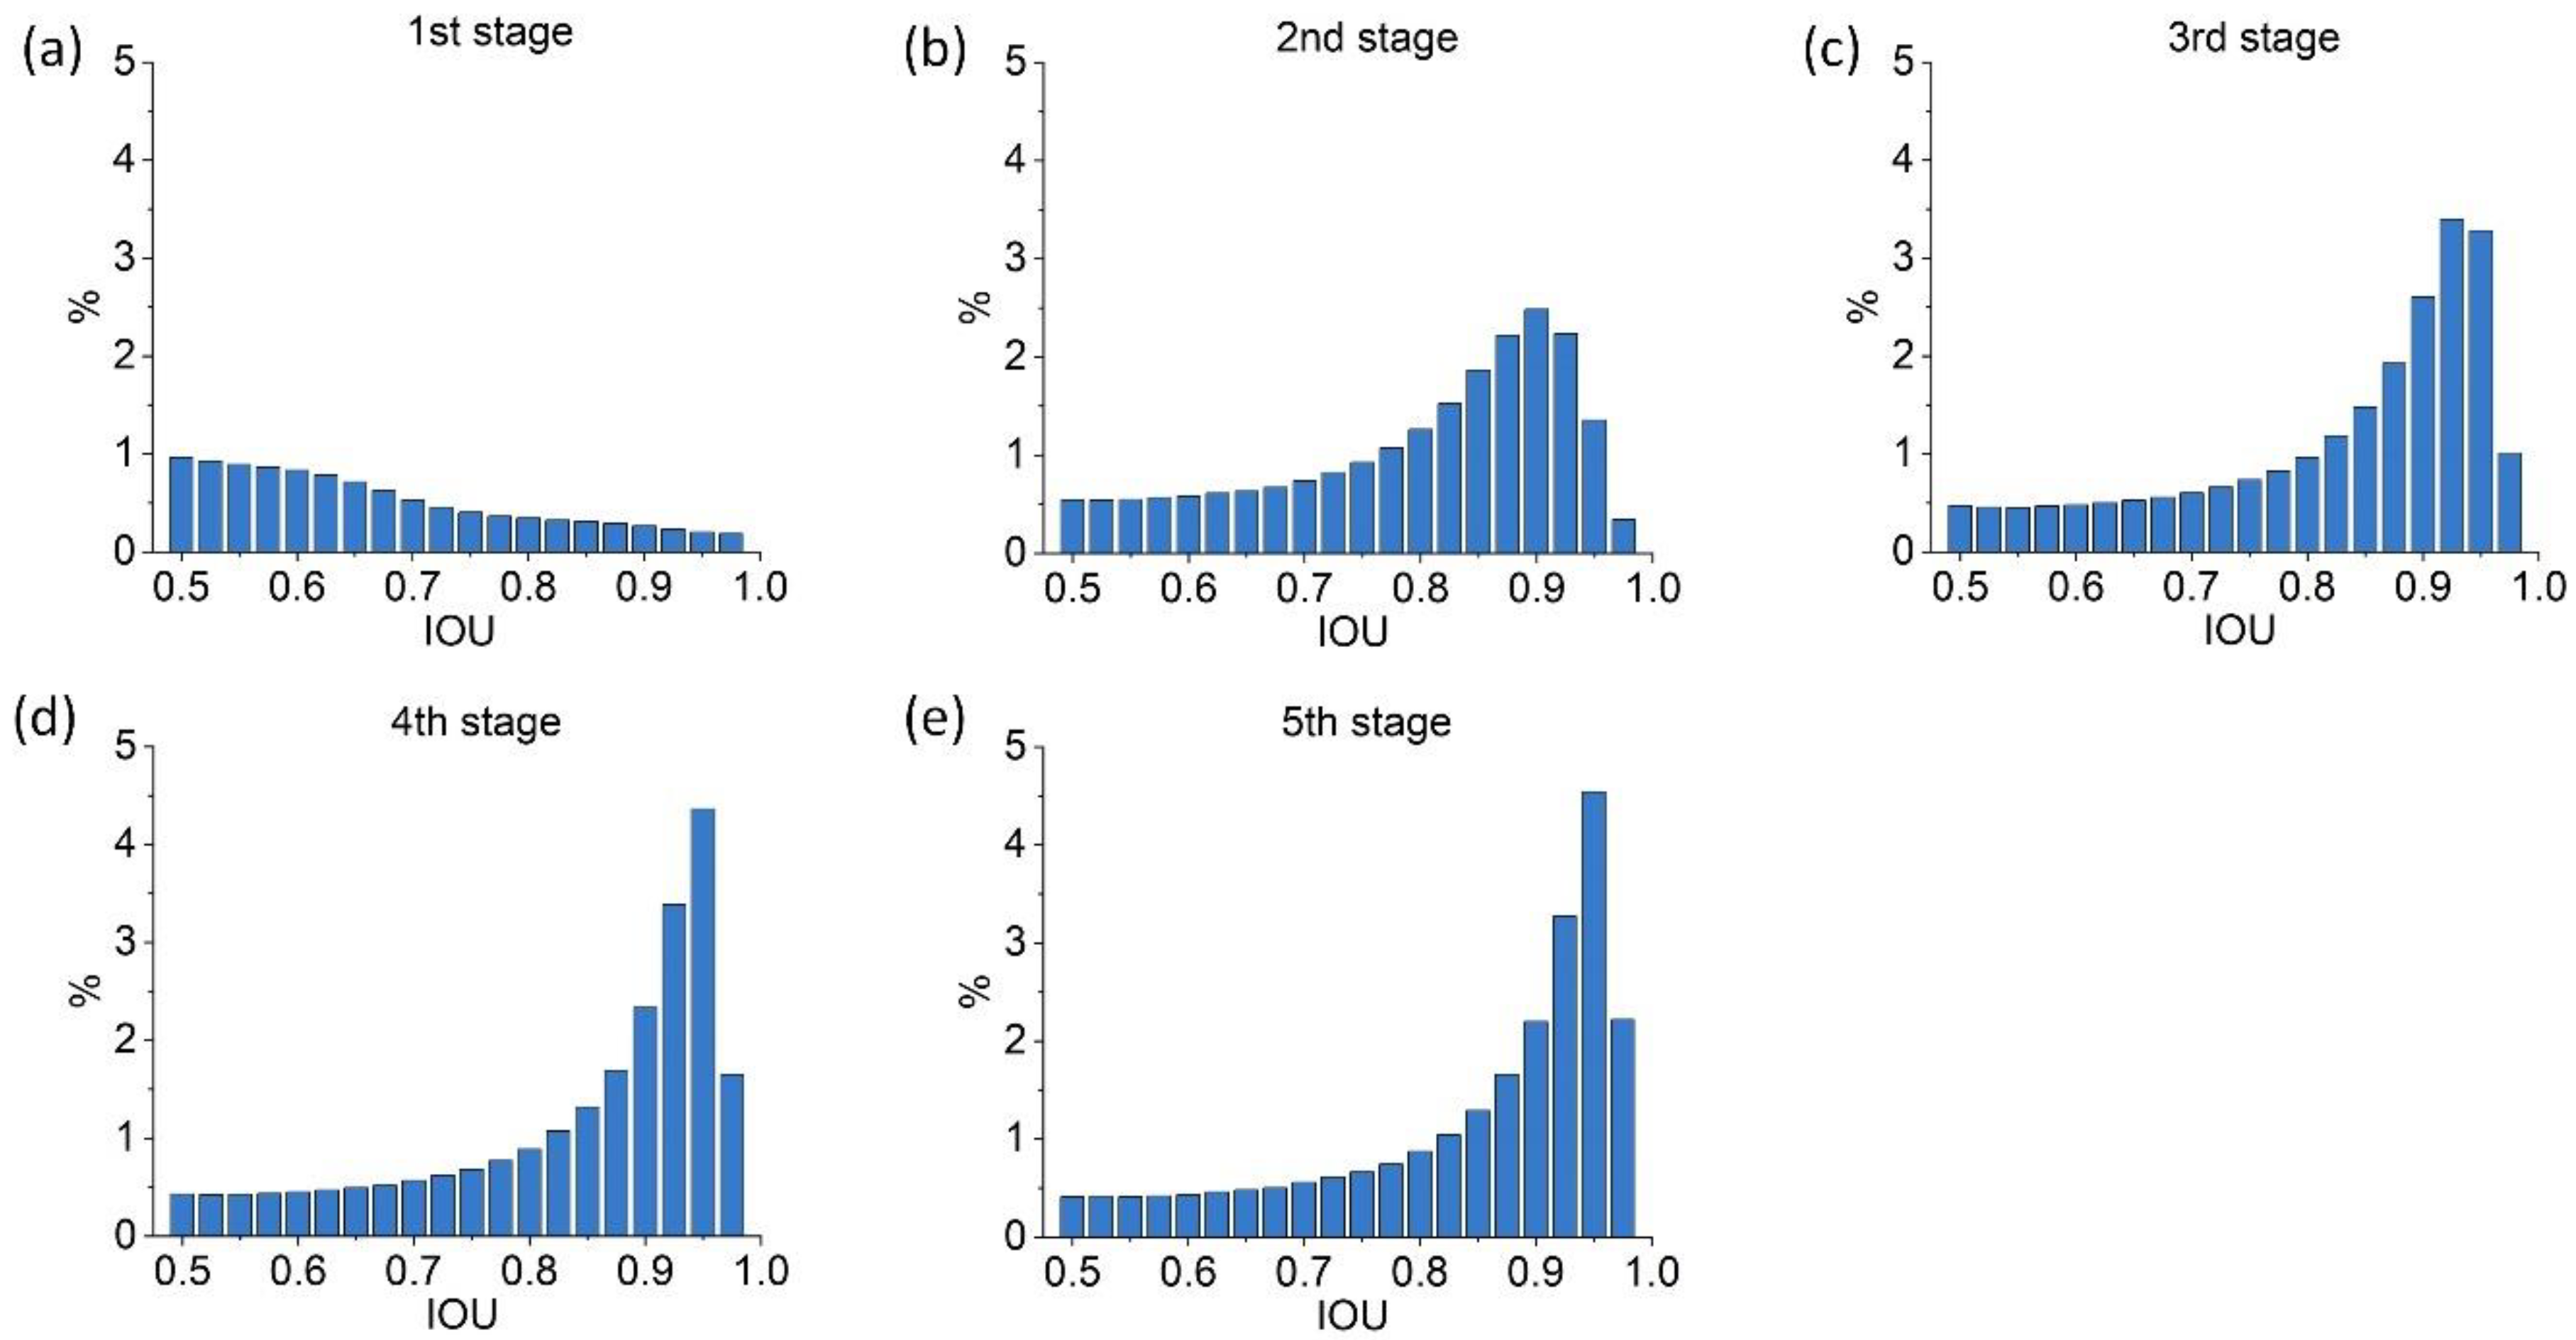
In the original Cascade R-CNN, the IoU thresholds for the second and third stages were empirically set as 0.6 and 0.7, increasing linearly by a step size of 0.1. In Section 4.1, it was found that with the number of cascades increases, the improvement in the IoU distribution of training samples becomes smaller. Thus, for the five-stage model in Section 4, the IoU thresholds for the fourth and fifth stages were empirically set as 0.75 and 0.85. We conducted a comparison on the detection performance under different IoU threshold settings on the proposed Cascade R-CNN++ structure, with results shown in Table 6, where the “empirical thresholds” are represented by U = { 0.5 , 0.6 , 0.7 , 0.75 , 0.85 } , and the “auto determined thresholds” are denoted by U = { 0.5 , 0.673 , 0.723 , 0.743 , 0.745 } , which are the thresholds automatically determined by the 20% quantile of IoU distribution at each stage except the first stage, as described in Section 6.1.
In Table 6, it is shown that under the same conditions, auto determined thresholds achieved better overall performance. It is likely that the thresholds estimated using the IoU distribution better matches the quality of training samples, and thus achieved a better balance between effective training and high-quality detection.

8. Conclusions

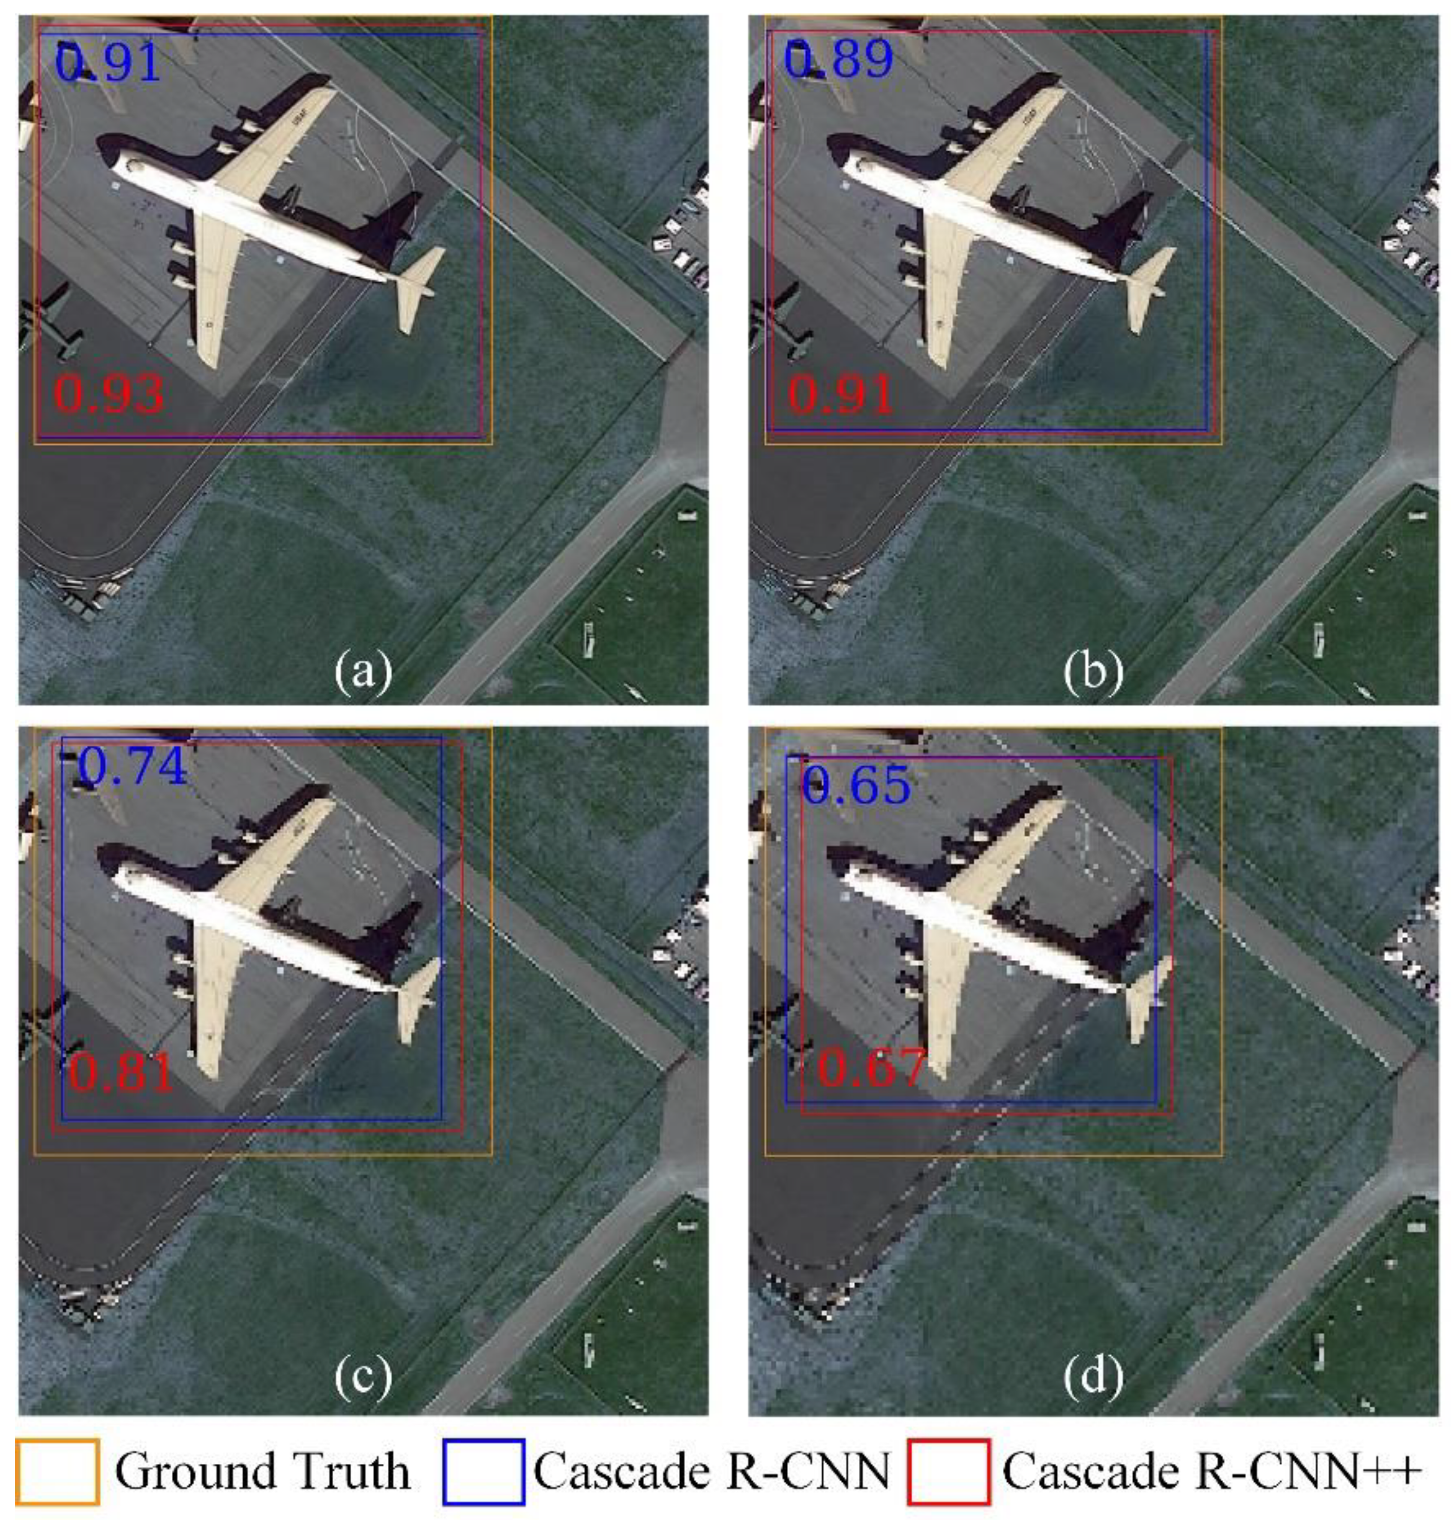
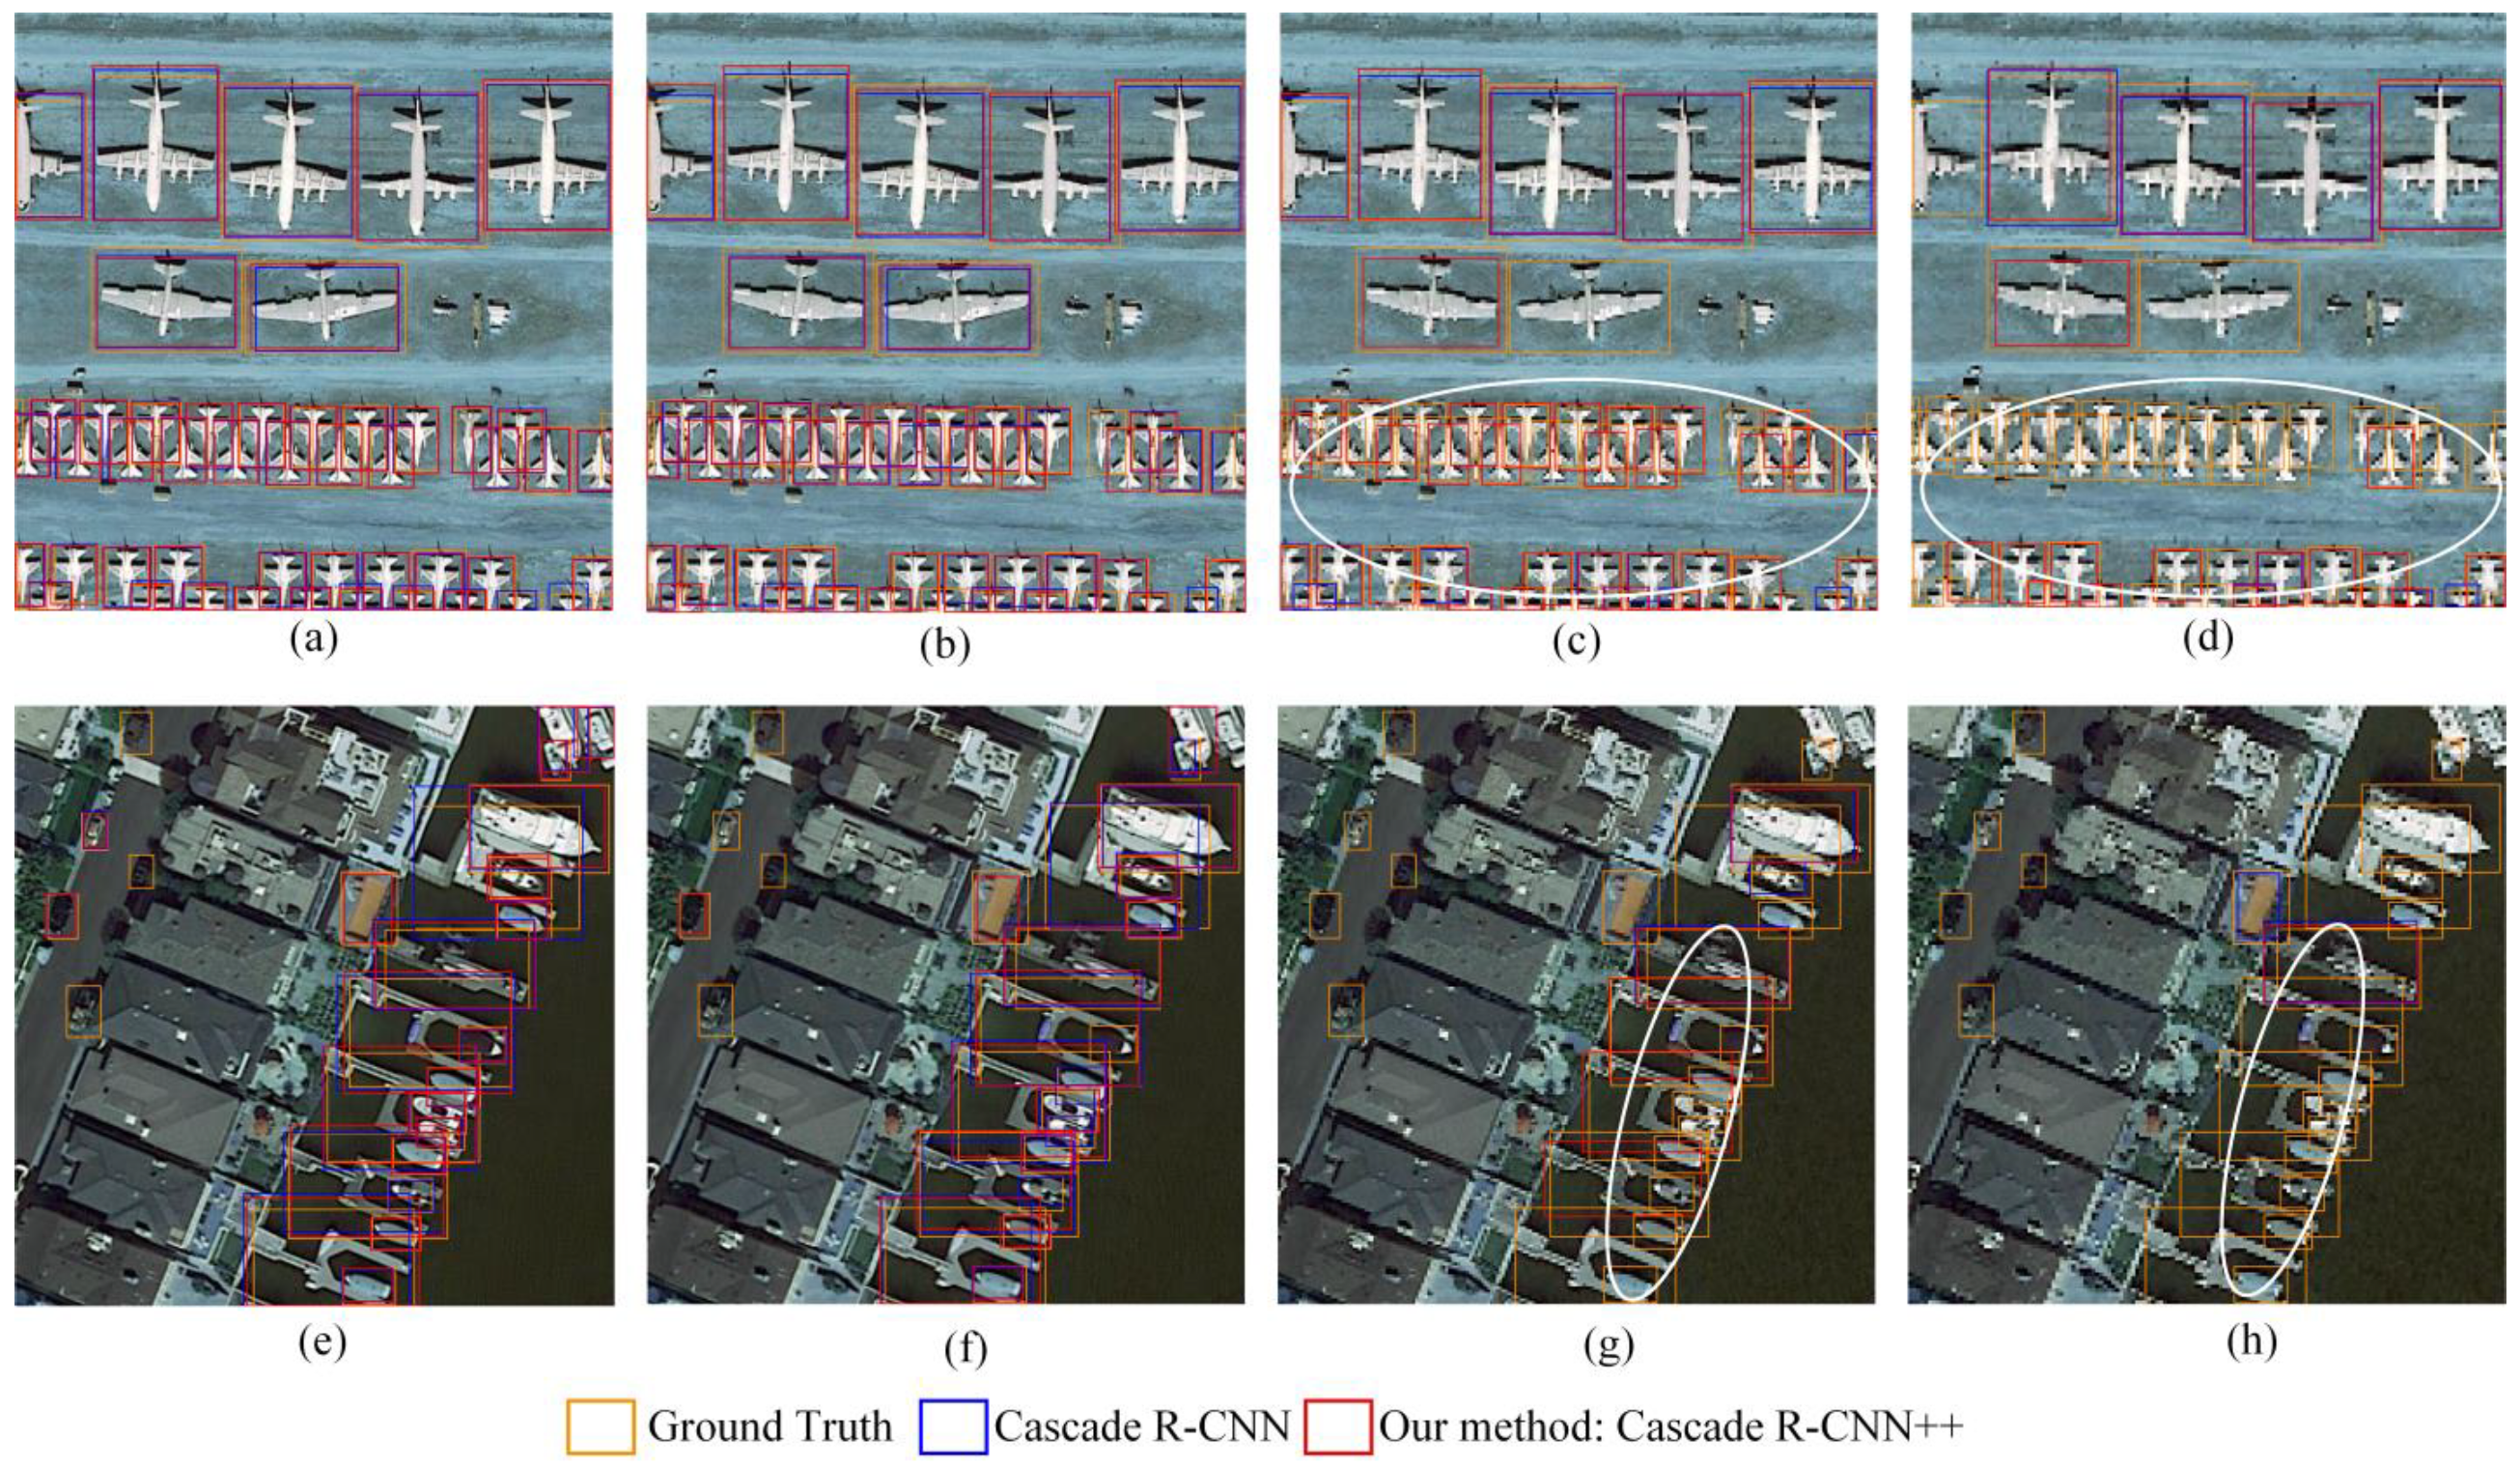
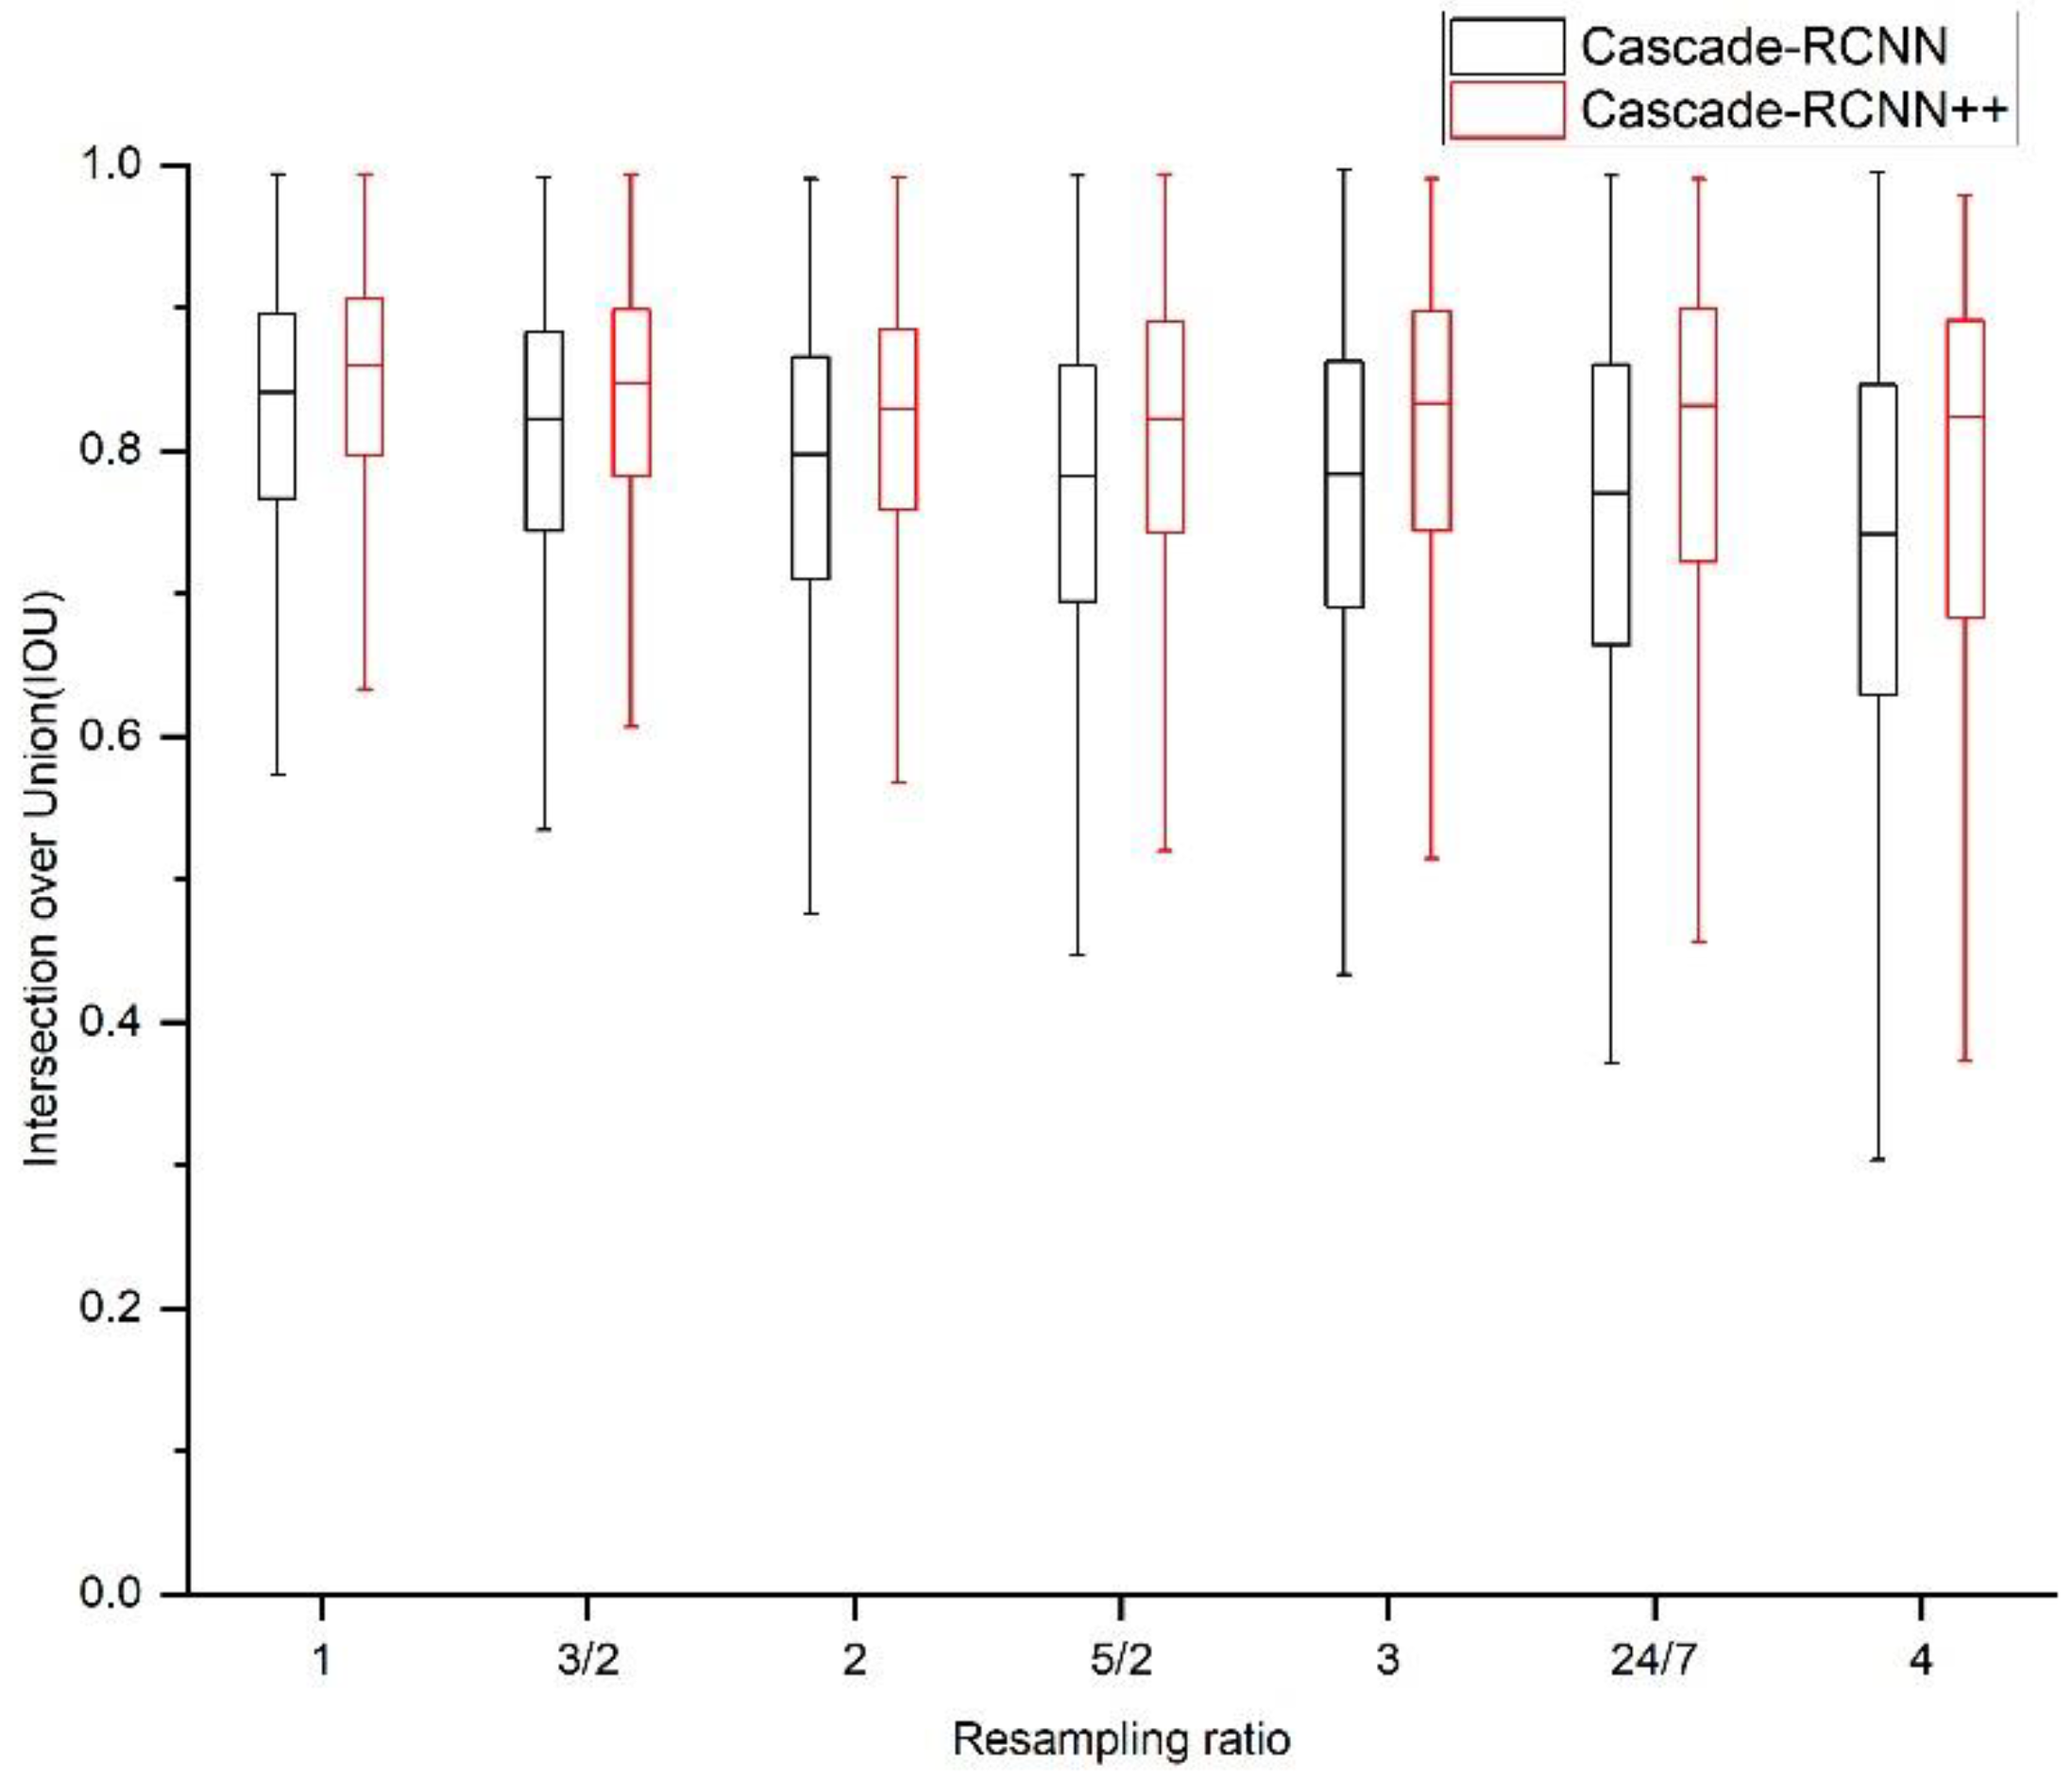
In this study, we proposed Cascade R-CNN++ as an improved cascade structure, to achieve high-quality object detection across multiresolution remote sensing image. The new model overcomes the extension problem of the original Cascade R-CNN by employing a new ensemble strategy for classification at inference, which eliminated the mismatch between the classifier and RoI features. Further, we modified the loss function of bounding box regression to achieve higher sensitivity around zero, which allowed further convergence with an increase in the cascaded stage. The effectiveness of the proposed method was verified using DOTA-v1.5 and NWPU VHR-10 datasets. Cascade R-CNN++ could achieve higher precision with an increase of stages, and significant improvements were achieved in high-quality detection (e.g., AP90). We conducted further analysis on detection quality to verify model transferability across multiresolution remote sensing images. Comparing to Cascade R-CNN, the proposed Cascade R-CNN++ achieved higher IoU values on the detection of different categories of objects across multiresolution images. This trend becomes more significant as the image resolution decreases.
Owing to limited variability of remote sensing training dataset, the transferability of the deep learning model between multiresolution imagery is essential for remote sensing object detection. “Training once, apply to multiscale” is the ultimate goal. The cascade structure and loss function presented in this paper can help the model to improve transferability across multiresolution images. They are independent components that can further be applied to another multistage model. In the future, we will explore the use of cascaded structure in other tasks, such as instance segmentation and key point detection.

Author Contributions

Conceptualization, S.G. and L.S.; methodology, B.W. and Y.S.; formal analysis, B.W. and Y.S.; writing—original draft preparation, L.S.; writing—review and editing, L.S. and S.G.; visualization, B.W.; supervision, J.C., H.L. and Y.A.; project administration, J.C. and H.L. All authors have read and agreed to the published version of the manuscript.

Funding

This research was funded by the Strategic Priority Research Program of the Chinese Academy of Sciences (Grant No. XDA19030301), the National Natural Science Foundation of China (Grant No. 41801360, 41601212, 41771403, 42001286), the Fundamental Research Foundation of Shenzhen Science and Technology Program (Project No. KCXFZ202002011006298), and the Guangdong Basic and Applied Basic Research Foundation (Grant No. 2019A1515011501).

Informed Consent Statement

Not applicable.

Data Availability Statement

The DOTA dataset is publicly available at https://captain-whu.github.io/DOTA/dataset.html. The NWPU VHR-10 dataset is publicly available at https://gcheng-nwpu.github.io/#Datasets.

Conflicts of Interest

The authors declare no conflict of interest.

References

  1. Weber, J.; Lefèvre, S. Spatial and Spectral Morphological Template Matching. Image Vis. Comput. 2012, 30, 934–945. [Google Scholar] [CrossRef]
  2. Hung, C.; Bryson, M.; Sukkarieh, S. Multi-Class Predictive Template for Tree Crown Detection. ISPRS J. Photogramm. Remote Sens. 2012, 68, 170–183. [Google Scholar] [CrossRef]
  3. Chaudhuri, D.; Samal, A. An Automatic Bridge Detection Technique for Multispectral Images. IEEE Trans. Geosci. Remote Sens. 2008, 46, 2720–2727. [Google Scholar] [CrossRef] [Green Version]
  4. Martha, T.R.; Kerle, N.; van Westen, C.J.; Jetten, V.; Kumar, K.V. Segment Optimization and Data-Driven Thresholding for Knowledge-Based Landslide Detection by Object-Based Image Analysis. IEEE Trans. Geosci. Remote Sens. 2011, 49, 4928–4943. [Google Scholar] [CrossRef]
  5. Li, K.; Wan, G.; Cheng, G.; Meng, L.; Han, J. Object Detection in Optical Remote Sensing Images: A Survey and a New Benchmark. ISPRS J. Photogramm. Remote Sens. 2020, 159, 296–307. [Google Scholar] [CrossRef]
  6. Cheng, G.; Han, J. A Survey on Object Detection in Optical Remote Sensing Images. ISPRS J. Photogramm. Remote Sens. 2016, 117, 11–28. [Google Scholar] [CrossRef] [Green Version]
  7. Han, J.; Zhang, D.; Cheng, G.; Guo, L.; Ren, J. Object Detection in Optical Remote Sensing Images Based on Weakly Supervised Learning and High-Level Feature Learning. IEEE Trans. Geosci. Remote Sens. 2014, 53, 3325–3337. [Google Scholar] [CrossRef] [Green Version]
  8. Zhang, F.; Du, B.; Zhang, L.; Xu, M. Weakly Supervised Learning Based on Coupled Convolutional Neural Networks for Aircraft Detection. IEEE Trans. Geosci. Remote Sens. 2016, 54, 5553–5563. [Google Scholar] [CrossRef]
  9. Tang, T.; Zhou, S.; Deng, Z.; Zou, H.; Lei, L. Vehicle Detection in Aerial Images Based on Region Convolutional Neural Networks and Hard Negative Example Mining. Sensors 2017, 17, 336. [Google Scholar] [CrossRef] [Green Version]
  10. Liu, W.; Ma, L.; Chen, H. Arbitrary-Oriented Ship Detection Framework in Optical Remote-Sensing Images. IEEE Geosci. Remote Sens. Lett. 2018, 15, 937–941. [Google Scholar] [CrossRef]
  11. Dong, Z.; Wang, M.; Wang, Y.; Zhu, Y.; Zhang, Z. Object Detection in High Resolution Remote Sensing Imagery Based on Convolutional Neural Networks with Suitable Object Scale Features. IEEE Trans. Geosci. Remote Sens. 2019, 58, 2104–2114. [Google Scholar] [CrossRef]
  12. Cheng, G.; Zhou, P.; Han, J. Learning Rotation-Invariant Convolutional Neural Networks for Object Detection in VHR Optical Remote Sensing Images. IEEE Trans. Geosci. Remote Sens. 2016, 54, 7405–7415. [Google Scholar] [CrossRef]
  13. Li, K.; Cheng, G.; Bu, S.; You, X. Rotation-Insensitive and Context-Augmented Object Detection in Remote Sensing Images. IEEE Trans. Geosci. Remote Sens. 2017, 56, 2337–2348. [Google Scholar] [CrossRef]
  14. Cheng, G.; Si, Y.; Hong, H.; Yao, X.; Guo, L. Cross-Scale Feature Fusion for Object Detection in Optical Remote Sensing Images. IEEE Geosci. Remote Sens. Lett. 2021, 18, 431–435. [Google Scholar] [CrossRef]
  15. Ming, Q.; Miao, L.; Zhou, Z.; Dong, Y. CFC-Net: A Critical Feature Capturing Network for Arbitrary-Oriented Object Detection in Remote-Sensing Images. IEEE Trans. Geosci. Remote Sens. 2022, 60, 1–14. [Google Scholar] [CrossRef]
  16. Fu, K.; Chang, Z.; Zhang, Y.; Xu, G.; Zhang, K.; Sun, X. Rotation-Aware and Multi-Scale Convolutional Neural Network for Object Detection in Remote Sensing Images. ISPRS J. Photogramm. Remote Sens. 2020, 161, 294–308. [Google Scholar] [CrossRef]
  17. Shamsolmoali, P.; Chanussot, J.; Zareapoor, M.; Zhou, H.; Yang, J. Multipatch Feature Pyramid Network for Weakly Supervised Object Detection in Optical Remote Sensing Images. IEEE Trans. Geosci. Remote Sens. 2021, 18, 1–13. [Google Scholar] [CrossRef]
  18. Zhang, T.; Zhang, X.; Ke, X. Quad-FPN: A Novel Quad Feature Pyramid Network for SAR Ship Detection. Remote Sens. 2021, 13, 2771. [Google Scholar] [CrossRef]
  19. Hou, J.-B.; Zhu, X.; Yin, X.-C. Self-Adaptive Aspect Ratio Anchor for Oriented Object Detection in Remote Sensing Images. Remote Sens. 2021, 13, 1318. [Google Scholar] [CrossRef]
  20. Dong, R.; Jiao, L.; Zhang, Y.; Zhao, J.; Shen, W. A Multi-Scale Spatial Attention Region Proposal Network for High-Resolution Optical Remote Sensing Imagery. Remote Sens. 2021, 13, 3362. [Google Scholar] [CrossRef]
  21. Lin, Q.; Zhao, J.; Fu, G.; Yuan, Z. CRPN-SFNet: A High-Performance Object Detector on Large-Scale Remote Sensing Images. IEEE Trans. Neural Netw. Learn. Syst. 2022, 33, 416–429. [Google Scholar] [CrossRef] [PubMed]
  22. Lin, Q.; Zhao, J.; Du, B.; Fu, G.; Yuan, Z. MEDNet: Multiexpert Detection Network with Unsupervised Clustering of Training Samples. IEEE Trans. Geosci. Remote Sens. 2022, 60, 1–14. [Google Scholar] [CrossRef]
  23. Han, W.; Fan, R.; Wang, L.; Feng, R.; Li, F.; Deng, Z.; Chen, X. Improving Training Instance Quality in Aerial Image Object Detection with a Sampling-Balance-Based Multistage Network. IEEE Trans. Geosci. Remote Sens. 2021, 59, 10575–10589. [Google Scholar] [CrossRef]
  24. Cai, Z.; Vasconcelos, N. Cascade R-CNN: High Quality Object Detection and Instance Segmentation. IEEE Trans. Pattern Anal. Mach. Intell. 2021, 43, 1483–1498. [Google Scholar] [CrossRef] [Green Version]
  25. Cai, Z.; Vasconcelos, N. Cascade R-CNN: Delving into High Quality Object Detection. In Proceedings of the IEEE Conference on 2018 Computer Vision and Pattern Recognition, Salt Lake City, UT, USA, 18–23 June 2018; pp. 6154–6162. [Google Scholar]
  26. Girshick, R.; Donahue, J.; Darrell, T.; Malik, J. Rich Feature Hierarchies for Accurate Object Detection and Semantic Segmentation. In Proceedings of the 2014 IEEE Conference on Computer Vision and Pattern Recognition, Columbus, OH, USA, 23–28 June 2014; pp. 580–587. [Google Scholar]
  27. Xia, G.-S.; Bai, X.; Ding, J.; Zhu, Z.; Belongie, S.; Luo, J.; Datcu, M.; Pelillo, M.; Zhang, L. DOTA: A Large-Scale Dataset for Object Detection in Aerial Images. In Proceedings of the 2018 IEEE Conference on Computer Vision and Pattern Recognition (CVPR), Salt Lake City, UT, USA, 18–23 June 2018. [Google Scholar]
  28. Ding, J.; Xue, N.; Long, Y.; Xia, G.; Lu, Q. Learning RoI Transformer for Detecting Oriented Objects in Aerial Images. In Proceedings of the 2019 IEEE Conference on Computer Vision and Pattern Recognition (CVPR), Long Beach, CA, USA, 15–20 June 2019. [Google Scholar]
  29. Redmon, J.; Divvala, S.; Girshick, R.; Farhadi, A. You Only Look Once: Unified, Real-Time Object Detection. In Proceedings of the 2016 IEEE Conference on Computer Vision and Pattern Recognition, Las Vegas, NV, USA, 27–30 June 2016; pp. 779–788. [Google Scholar]
  30. Redmon, J.; Farhadi, A. YOLO9000: Better, Faster, Stronger. In Proceedings of the 2017 IEEE Conference on Computer Vision and Pattern Recognition, Honolulu, HI, USA, 21–26 July 2017; pp. 7263–7271. [Google Scholar]
  31. Bochkovskiy, A.; Wang, C.-Y.; Liao, H.-Y.M. Yolov4: Optimal Speed and Accuracy of Object Detection. arXiv 2020, arXiv:2004.10934. [Google Scholar]
  32. Liu, W.; Anguelov, D.; Erhan, D.; Szegedy, C.; Reed, S.; Fu, C.-Y.; Berg, A.C. SSD: Single Shot Multibox Detector. In European Conference on Computer Vision; Springer: Cham, Switzerland, 2016; pp. 21–37. [Google Scholar]
  33. Lin, T.-Y.; Goyal, P.; Girshick, R.; He, K.; Dollár, P. Focal Loss for Dense Object Detection. In Proceedings of the 2017 IEEE International Conference on Computer Vision, Venice, Italy, 22–29 October 2017; pp. 2980–2988. [Google Scholar]
  34. Girshick, R. Fast R-CNN. In Proceedings of the 2015 IEEE International Conference on Computer Vision, Santiago, Chile, 7–13 December 2015; pp. 1440–1448. [Google Scholar]
  35. Ren, S.; He, K.; Girshick, R.; Sun, J. Faster R-CNN: Towards Real-Time Object Detection with Region Proposal Networks. IEEE Trans. Pattern Anal. Mach. Intell. 2017, 39, 1137–1149. [Google Scholar] [CrossRef] [Green Version]
  36. Lin, T.-Y.; Dollár, P.; Girshick, R.; He, K.; Hariharan, B.; Belongie, S. Feature Pyramid Networks for Object Detection. In Proceedings of the 2017 IEEE Conference on Computer Vision and Pattern Recognition, Honolulu, HI, USA, 21–26 July 2017; pp. 2117–2125. [Google Scholar]
  37. Cheng, G.; He, M.; Hong, H.; Yao, X.; Qian, X.; Guo, L. Guiding Clean Features for Object Detection in Remote Sensing Images. IEEE Geosci. Remote Sens. Lett. 2022, 19, 8019205. [Google Scholar] [CrossRef]
  38. Cheng, G.; Lang, C.; Wu, M.; Xie, X.; Yao, X.; Han, J. Feature Enhancement Network for Object Detection in Optical Remote Sensing Images. J. Remote Sens. 2021, 2021, 9805389. [Google Scholar] [CrossRef]
  39. Cheng, G.; Han, J.; Zhou, P.; Guo, L. Multi-Class Geospatial Object Detection and Geographic Image Classification Based on Collection of Part Detectors. ISPRS J. Photogramm. Remote Sens. 2014, 98, 119–132. [Google Scholar] [CrossRef]
  40. Lin, T.-Y.; Maire, M.; Belongie, S.; Hays, J.; Perona, P.; Ramanan, D.; Dollár, P.; Zitnick, C.L. Microsoft COCO: Common Objects in Context. In Proceedings of the Computer Vision—ECCV 2014, Zurich, Switzerland, 6–12 September 2014; Fleet, D., Pajdla, T., Schiele, B., Tuytelaars, T., Eds.; Springer International Publishing: Cham, Switzerland, 2014; pp. 740–755. [Google Scholar]
  41. He, K.; Gkioxari, G.; Dollár, P.; Girshick, R. Mask R-Cnn. In Proceedings of the 2017 IEEE International Conference on Computer Vision, Venice, Italy, 22–29 October 2017; pp. 2961–2969. [Google Scholar]
  42. He, K.; Zhang, X.; Ren, S.; Sun, J. Deep Residual Learning for Image Recognition. In Proceedings of the 2016 IEEE Conference on Computer Vision and Pattern Recognition, Las Vegas, NV, USA, 27–30 June 2016; pp. 770–778. [Google Scholar]
  43. Girshick, R.; Radosavovic, I.; Gkioxari, G.; Dollár, P.; He, K. Detectron. 2018. Available online: https://github.com/facebookresearch/detectron (accessed on 9 October 2019).
  44. Goyal, P.; Dollár, P.; Girshick, R.; Noordhuis, P.; Wesolowski, L.; Kyrola, A.; Tulloch, A.; Jia, Y.; He, K. Accurate, Large Minibatch Sgd: Training Imagenet in 1 Hour. arXiv 2017, arXiv:1706.02677. [Google Scholar]
  45. Bodla, N.; Singh, B.; Chellappa, R.; Davis, L.S. Soft-NMS—Improving Object Detection with One Line of Code. In Proceedings of the 2017 IEEE International Conference on Computer Vision (ICCV), Venice, Italy, 22–29 October 2017. [Google Scholar]
Figure 1. Intersection-over-union (IoU) histograms of training samples of the (a) first, (b) second, (c) third, (d) fourth, and (e) fifth stages in Cascade R-CNN. The histogram of the first stage represents the IoU distribution of region proposals produced by RPN.
Remotesensing 14 02091 g001
Figure 2. Structure of Cascade R-CNN at inference. (a) Workflow of cascaded classification, with the bounding box components grayed out. (b) Workflow of cascaded bounding box regression, with the classification components grayed out. “Conv” denotes the convolution layer; “pool” denotes the pooling layer; “H1”, “H2”, and “H3” represent the network heads; “B0” denotes region proposals generated by RPN; “B1”, “B2”, and “B3” represent the bounding boxes in each stage; and “C1”, “C2”, and “C3” are the classifiers in each stage.
Remotesensing 14 02091 g002
Figure 3. Structure of the proposed Cascade R-CNN++ with five stages. (a) Workflow of cascaded classification using a new ensemble strategy (red lines). (b) Workflow of cascaded bounding box regression (blue lines) embedded with a modified regression loss function. “Conv” denotes the backbone convolution layer; “pool” is the RoI pooling layer; “H1”, “H2”, “H3”, “H4”, and “H5” are the network heads; “B0” denotes region proposals; “B1”, “B2”, “B3”, “B4”, and “B5” represent the bounding boxes in each stage; and “C1”, “C2”, “C3”, “C4”, and “C5” denote the classifiers in each stage.
Remotesensing 14 02091 g003
Figure 4. Input offsets t x vs. bounding box output offset g x p x plotted for the original and modified loss functions. Following the settings in Cascade R-CNN, the weight c x is set as 10, 20, 40, 80, and 160 for the first to the fifth stage, respectively.
Remotesensing 14 02091 g004
Figure 5. Input offsets t w vs. bounding box output offset ( g w / p w ) plotted for the original and modified loss functions. Following the settings in Cascade R-CNN, the weight c w is set as 5, 10, 20, 40, and 80 for the first to the fifth stage, respectively.
Remotesensing 14 02091 g005
Figure 6. Effects of taking different exponent values in the loss function of bounding box regression, using the fifth stage as an example. (a) Input offsets t x vs. bounding box output offset g x p x at the fifth stage with different exponent values; (b) Input offsets t w vs. bounding box output offset ( g w / p w ) at the fifth stage with different exponent values.
Remotesensing 14 02091 g006
Figure 7. Examples of single object detection across different resolution remote sensing images with (a) no upscale and upscaled by factors (b) two, (c) three, and (d) four, with marked up IoU values of regressed bounding boxes by Cascade R-CNN and Cascade R-CNN++.
Remotesensing 14 02091 g007
Figure 8. Examples of multi-object detection across multi-resolution remote sensing images. (a) Detection of airplanes on the original resolution image (no upscale); (b) detection of airplanes on the image upscaled by a factor of two; (c) detection of airplanes on the image upscaled by a factor of three; (d) detection of airplanes on the image upscaled by a factor of four; (e) detection of harbors on the original resolution image (no upscale); (f) detection of harbors on the image upscaled by a factor of two; (g) detection of harbors on the image upscaled by a factor of three; (h) detection of harbors on the image upscaled by a factor of four.
Remotesensing 14 02091 g008
Figure 9. Boxplots of obtained IoU using Cascade R-CNN and Cascade R-CNN++ for remote sensing images upscaled by different factors.
Remotesensing 14 02091 g009
Table 1. Detection precision measured for different combinations of classifier and RoI vectors. 1#~5# denote the first~fifth stages, respectively.
ClassifierRoIAP (%)AP50 (%)AP75 (%)APS (%)APM (%)APL (%)
1#5#43.263.847.924.640.149.0
1#1#44.764.349.726.141.753.6
2#5#44.663.649.625.840.852.6
2#2#45.063.550.525.641.453.7
3#5#44.463.450.026.340.650.1
3#3#44.963.450.226.741.151.2
4#5#44.062.649.325.340.950.8
4#4#43.962.549.225.440.651.1
Table 2. Performance comparison between three-, four-, and five-stage implementations of Cascade R-CNN++ on DOTA-v1.5 dataset, all with Resnet-50 backbone.
FPSAPAP50AP75AP90APSAPMAPL
Three stage Cascade R-CNN++2.5445.064.250.517.728.141.051.9
Four stage Cascade R-CNN++2.4645.464.451.217.827.541.551.1
Five stage Cascade R-CNN++2.3445.764.651.019.427.041.853.6
Table 3. Ablation experiments for a five-stage Cascade R-CNN++ on the DOTA-v1.5 dataset. “Ens” indicates using the new ensemble strategy for classification at inference. “Reg” indicates using the modified loss function for bounding box regression at both training and inference, all with Resnet-50 backbone.
EnsRegAPAP50AP75AP90APSAPMAPL
44.163.049.517.325.939.850.3
44.363.350.017.926.340.150.9
45.364.550.617.627.041.352.8
45.764.651.019.427.041.853.6
Table 4. Comparison with popular baseline detectors on DOTA-v1.5 dataset, all with Resnet-50 backbone. Entries denoted by * used enhancements of multi-scale training/inference and SoftNMS, as in [43,45].
APAP50AP75AP90APSAPMAPL
Faster R-CNN40.159.345.011.724.136.148.9
FPN40.362.050.415.424.437.547.2
RetinaNet38.960.142.610.022.336.846.2
Cascade R-CNN42.560.449.115.723.638.449.6
Cascade R-CNN++45.764.651.019.427.041.853.6
Cascade R-CNN++ *47.166.253.219.530.842.755.9
Table 5. Comparison with popular baseline detectors on NWPU VHR-10 dataset, all with Resnet-50 backbone.
APAP50AP75AP90APSAPMAPL
Faster R-CNN53.388.359.66.021.548.559.7
FPN55.689.661.47.137.050.063.3
RetinaNet49.188.250.84.518.744.155.2
Cascade R-CNN59.191.569.18.538.353.366.2
Cascade R-CNN++ 60.091.270.89.243.154.167.8
Table 6. Comparison of the detection performance on DOTA-v1.5 dataset, under different IoU threshold settings on the proposed five-stage Cascade R-CNN++, with Resnet-50 backbone.
APAP50AP75AP90APSAPMAPL
Empirical thresholds45.564.051.019.226.742.952.8
Auto determined thresholds 45.764.651.019.427.041.853.6
Publisher’s Note: MDPI stays neutral with regard to jurisdictional claims in published maps and institutional affiliations.

