Article

Revise-Net: Exploiting Reverse Attention Mechanism for Salient Object Detection

1
Department of Electrical Engineering, Jadavpur University, Kolkata 700032, India
2
Department of Information Technology, Pune Vidyarthi Griha’s College of Engineering and Technology, Pune 411009, India
3
Department of Intelligent Mechatronics Engineering, Sejong University, Seoul 05006, Korea
4
Faculty of Applied Mathematics, Silesian University of Technology, 44-100 Gliwice, Poland
5
Department of Information Technology, Jadavpur University, Kolkata 700106, India
6
Department of Computer Science and Engineering, Jadavpur University, Kolkata 700032, India
*
Author to whom correspondence should be addressed.
Remote Sens. 2021, 13(23), 4941; https://0-doi-org.brum.beds.ac.uk/10.3390/rs13234941
Submission received: 1 November 2021 / Revised: 24 November 2021 / Accepted: 1 December 2021 / Published: 5 December 2021
(This article belongs to the Special Issue Convolutional Neural Networks for Object Detection)

Abstract

:
Recently, deep learning-based methods, especially utilizing fully convolutional neural networks, have shown extraordinary performance in salient object detection. Despite its success, the clean boundary detection of the saliency objects is still a challenging task. Most of the contemporary methods focus on exclusive edge detection modules in order to avoid noisy boundaries. In this work, we propose leveraging on the extraction of finer semantic features from multiple encoding layers and attentively re-utilize it in the generation of the final segmentation result. The proposed Revise-Net model is divided into three parts: (a) the prediction module, (b) a residual enhancement module, and (c) reverse attention modules. Firstly, we generate the coarse saliency map through the prediction modules, which are fine-tuned in the enhancement module. Finally, multiple reverse attention modules at varying scales are cascaded between the two networks to guide the prediction module by employing the intermediate segmentation maps generated at each downsampling level of the REM. Our method efficiently classifies the boundary pixels using a combination of binary cross-entropy, similarity index, and intersection over union losses at the pixel, patch, and map levels, thereby effectively segmenting the saliency objects in an image. In comparison with several state-of-the-art frameworks, our proposed Revise-Net model outperforms them with a significant margin on three publicly available datasets, DUTS-TE, ECSSD, and HKU-IS, both on regional and boundary estimation measures.

1. Introduction

The word “salient” describes a property of an object or a region that attracts the human observer’s attention, for example, the object in a scene that humans would naturally focus on. Humans quickly allocate attention to important regions in visual scenes. The visual system in humans comprises an optimal attentive mechanism capable of identifying the most relevant information from images. Understanding and modeling this visual attention or visual saliency is a fundamental research problem in psychology, neurobiology, cognitive science, and computer vision. There are generally two computational models used for identifying the visual saliency, namely fixation prediction (FP) and salient object detection (SOD). FP originated from cognitive and psychology communities [1,2,3] and targets predicting where people look in images.
The history of SOD is relatively short and can be traced back to [4,5]. The rise of SOD has been driven by a wide range of object-level computer vision applications. Instead of FP models only predicting sparse eye fixation locations, SOD models aim to detect the whole entities of the visually attractive objects with precise boundaries. The past decade has seen a lot of improvements in object detection, especially in SOD [6]. Hence, it is an important computer vision task aimed at precise detection and segmentation of visually distinctive image regions, widely used in many fields, such as image understanding [7], visual tracking [8], and semantic segmentation [9,10]. Our work concentrates on the SOD aiming to efficiently segment pixels of salient objects in the provided input images. The proposed method finds its immediate applications in image segmentation [11,12] and manipulation [13]. The usage can be further extended to user interface optimization [14] as well as visual tracking [8]. Earlier SOD models used multi-layer perceptron (MLP) to predict saliency score; however, in the recent days, fully convolution neural networks [15,16,17] have been leveraged for the SOD task. Several models are designed to use deep feature extractors by using the existing networks such as ResNet, DenseNet, and AlexNet. These networks mainly extract features that are representative of semantic meaning and ignore the global contrast information.
Even though these methods produce significantly higher results when compared to traditional approaches, they fail to capture the finer structures present in representations, resulting in noisy boundaries in saliency maps. Further, these frameworks do not address the irregularity in the predicted regional probabilities affecting the overall performance of the network. In order to produce finer segmentation maps, it is necessary to utilize both global contextual features over which the saliency is defined, as well as the finer structural information present in the image data [18]. Furthermore, most of these pipelines employ cross-entropy loss for the network training, which usually provides low confidence in distinguishing the boundary pixels, resulting in fuzzy edges.
To overcome the above-stated problems, we propose a new model called Revise-Net, which produces precise segmentation maps with superior object boundaries for SOD. In order to extract low-level finer information, we utilize a prediction module resembling a U-Net [19]-like encoder–decoder architecture. In order to avoid an exploding gradient, we employ residual blocks with skip connections in various phases throughout the network. In addition, a residual enhancement module (REM) is cascaded to the primary network for refining the output of the prediction module (PM), thereby producing an accurate saliency map with clear edges. Finally, we leverage the reverse attention module (RAM) as a bridging link within the two modules in order to attentively guide the prediction module using the intermediate segmentation maps of the REM, thus boosting the overall segmentation performance. In order to obtain sharper boundaries, we use a combination of binary cross-entropy (BCE) loss with structural similarity index measure (SSIM) and intersection over union (IoU) loss. Rather than simply utilizing several boundary detection losses such as NLDF+ [20], C2S [21], etc., we incorporate the precise prediction of boundary in the combination of losses itself in an attempt to reduce any errors occurring due to cross propagation of information learned in the edge with other regions in the image. The major contributions of the proposed work include:
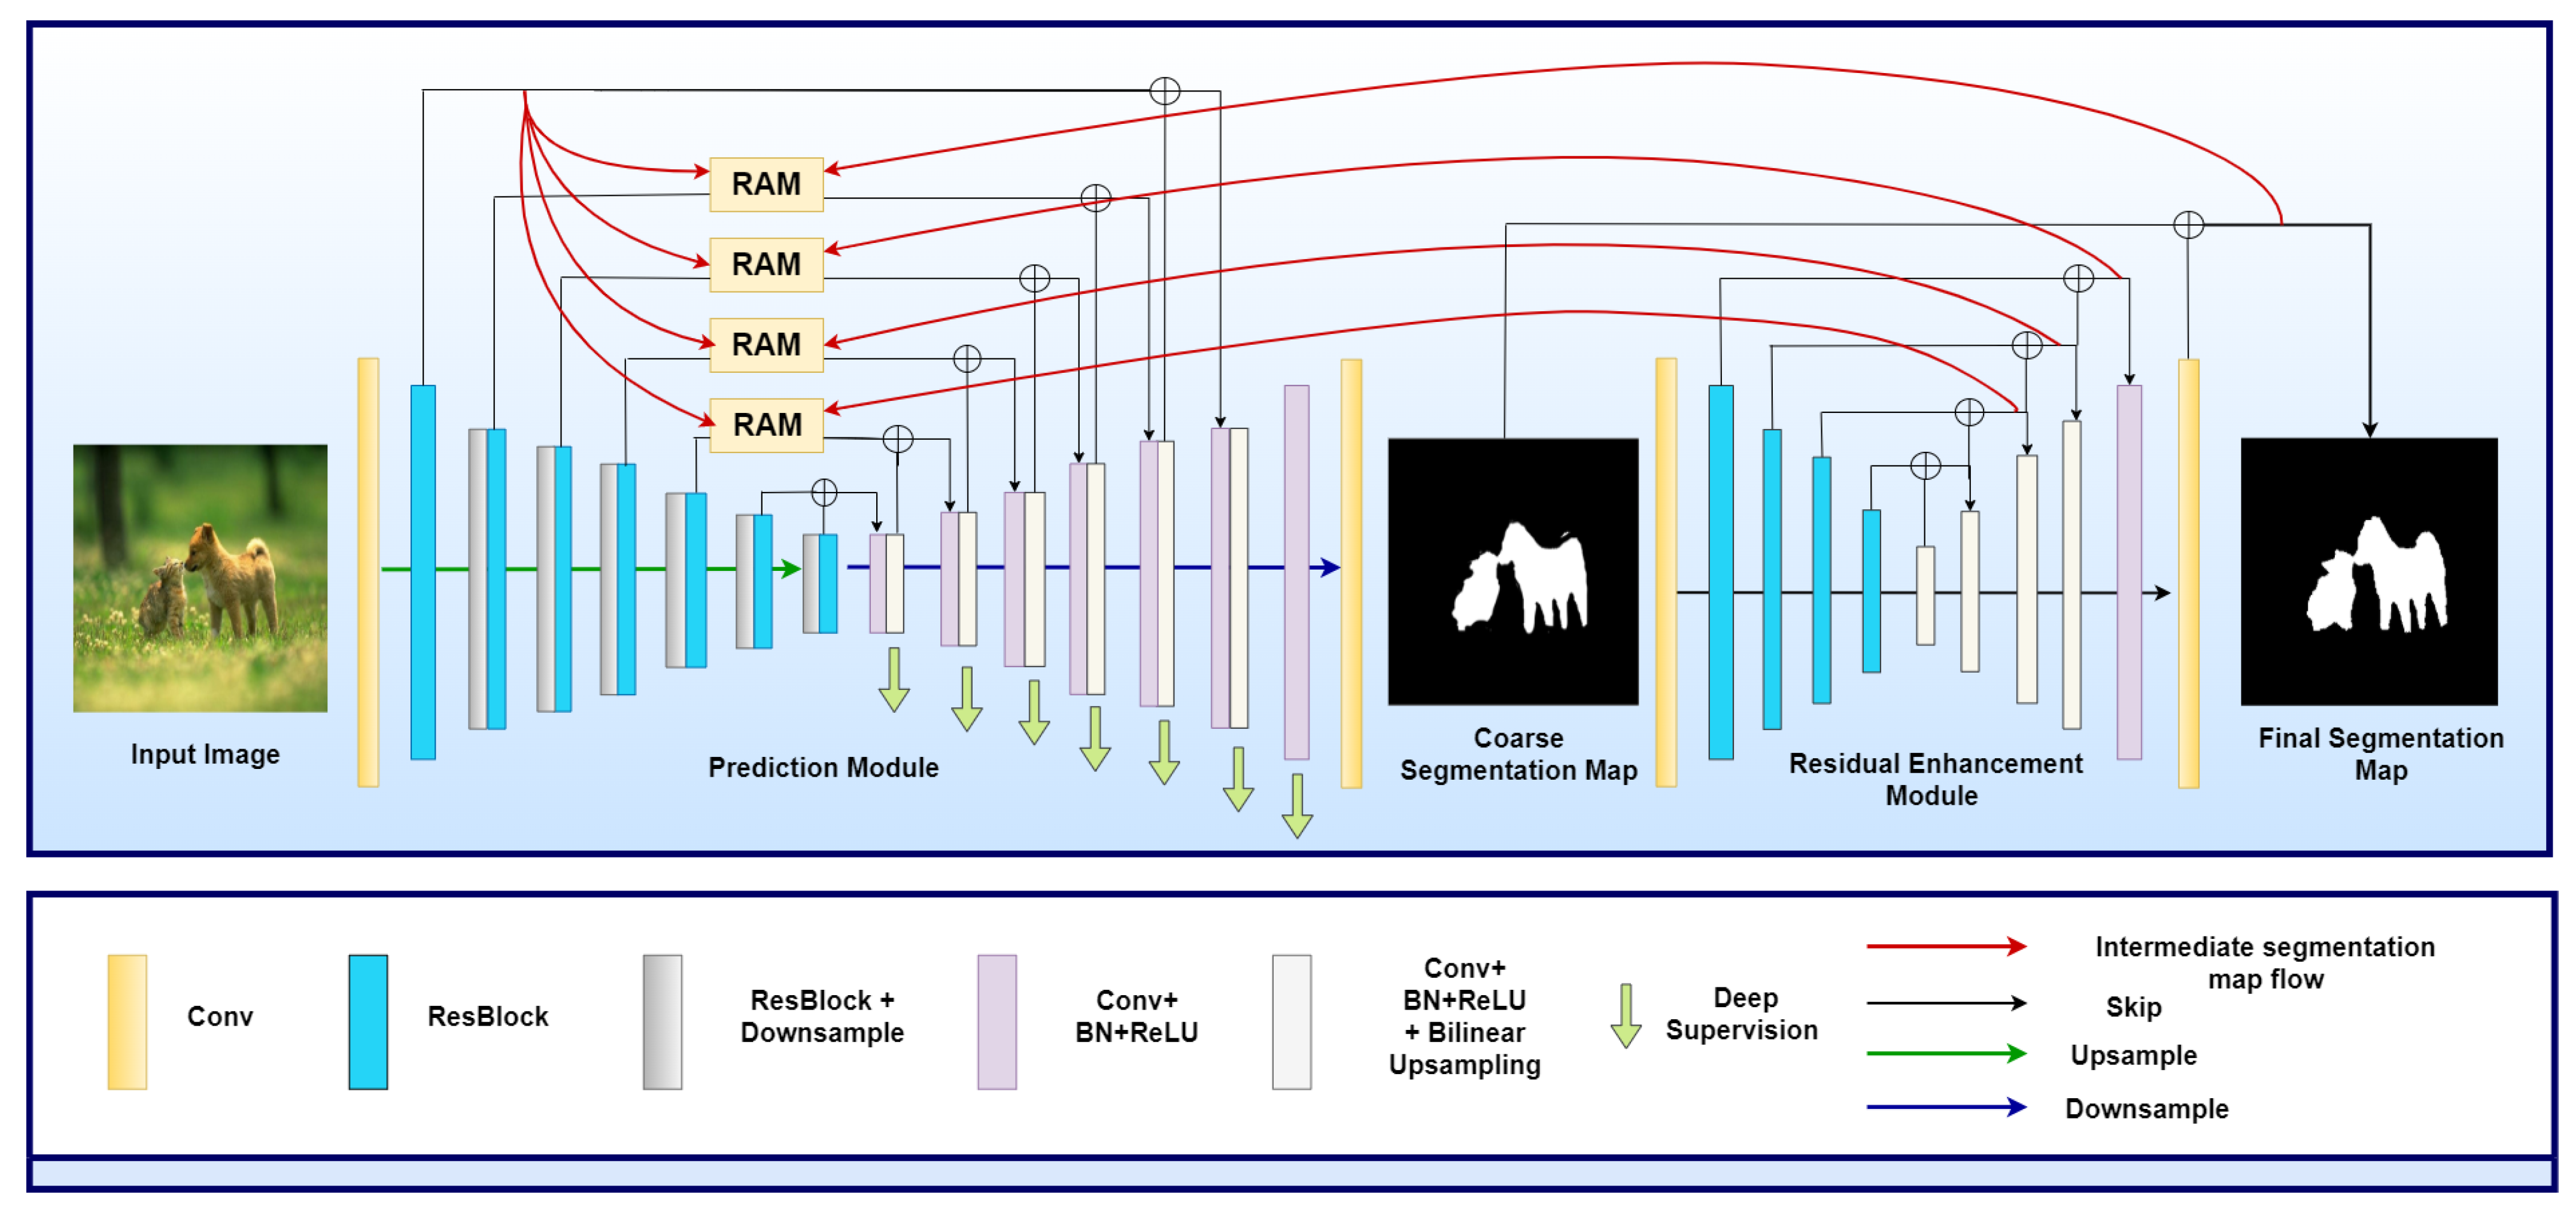
  • We propose a novel encoder-decoder based architecture, called Revise-Net, that contains a principal PM for generating the initial coarse segmentation maps. These maps are then passed through the REM for utilisation of the high-level finer features, which increase the overall quality of the final segmentation output.
  • The intermediate segmented maps generated in each decoding layer of the REM are utilized to attentively guide the PM via RAMs on multiple scales cascaded between the two networks.
  • The proposed method further employs a combination of losses by fusing BCE, SSIM, and IoU for the supervision of the training process as well as for accurately predicting the segmentation map at patch, pixel, and map levels.
  • The proposed Revise-Net model is thoroughly evaluated on three publicly available natural scene datasets: DUTS (DUTS-TR for train and DUTS-TE for test) [22], HKU-IS [23], and Extended Complex Scene Saliency Dataset (ECSSD) [24] for boundary-aware segmentation. The proposed framework, when compared with 10 state-of-the-art methods, outperforms those methods by a significant margin.
The source code is also made available at: https://github.com/yashkarbhari/Revise-Net, accessed on 30 November 2021.

2. Related Work

The task of SOD is driven by and applied to a wide range of object detection applications in various areas. From traditional methods [25,26,27] to deep recurrent and attention methods [28,29,30], different deep learning approaches have been proposed to date. Recently, deep learning-based SOD algorithms have readily shown superior performances over traditional solutions and have continued to improve the state-of-the-art results. Encoder–decoder-based approaches have been used recently to predict the saliency map of the image. In particular, UNet [19] and its variants, such as in [31], have shown impressive results in semantic segmentation tasks as well as in producing saliency maps. The method [32] proposed by Qin et al. is a two-level nested U-structure built using novel residual U-blocks (RSU) that is designed for SOD without using any pre-trained backbones from image classification. A lot of other approaches have developed stacking nested U-Nets on top of each other, but they are very computationally expensive to handle, and the complexity grows significantly. In [32], each stage is filled by a well-configured RSU, which extracts intra-stage multi-scale features without degrading the feature maps, which makes the U2Net approach less computationally expensive. The authors of the U2Net approach have observed marked improvements in mean absolute error (MAE), weighted F-measure, and computational cost. The work by Han et al. [33] proposed a constraint-based U-Net structure that can fuse the features of different layers to reduce the loss of information. An edge convolutional constraint has been added to a modified U-Net to predict the saliency map of the image. The model is effective in SOD tasks and is also competitive when compared with other state-of-the-art models. Yu et al. [34] proposed an encoder–decoder-based aggregation module to learn different features from salient regions with each upsampling layer receiving the features of the corresponding downsampling layer with the final encoder to capture the detrimental global context in predicting salient regions. This further highlights the need for complementary global with the local CNN features to improve the performance of the architectures. Zhang et al. [35] produced a noise-aware architecture for a clear saliency predictor generating noisy labels by unsupervised handcrafted method.
A significant number of methods in the recent literature employ some variety of feature fusion in their methods. These features may be produced due to the maps of different resolutions, which leads to multi-scale and multi-level feature fusion. The Deepside architecture proposed by Fu et al. [36] uses a VGG 16 architecture as a primary backbone of their proposed model. Deepsides have been drawn from the intermediate hidden layers of the VGG architecture at different resolutions, and the proposed loss function has been applied by processing the outputs of each side non-linearly through a set of convolutional layers. The output has been fused by using a concatenation layer, since the rich hierarchical side features improve the saliency homogeneity of the model. The authors claim that the backbone plays a significant role in the performance of the model, and the model may perform better with a ResNet- or an InceptionNet-based backbone. Feature fusion is also achieved by combining features from RGB images and depth images. This has been demonstrated in the method proposed by Wang et al. [37]. This method makes use of RGB images along with the aligned depth images in order to train two U-Net based architectures, each of whose outputs have been fused into a unimodal saliency prediction stream in order to obtain the final saliency map. The use of feature fusion modules shows that it is often necessary to fuse maps different features activated in order to obtain high-quality saliency maps. Wang et al. [37] also propose the use of three losses in order to train each sub-network and the saliency prediction stream, namely the saliency loss, the switch loss, and the edge-preserving loss. The edge-preserving loss, in particular, helps to correct the blurry images and improves the spatial coherence of the final saliency maps generated. Depth maps and feature fusion has also been utilized by Liu et al. [38] in a recurrent convolutional neural network (RCNN) framework. This method achieves multi-scale maps of the shallow layers that preserve the image features more, and the deeper layers produce maps with more global semantic information. Authors in [39] proposed a network that effectively integrates low-level and high-level semantic features with global contextual features that undergo head attention to avoid feature redundancy. The final features undergo self-refinement utilizing simple convolutional layers. However, the squeeze operation involved might result in loss of feature information and hence affect the final reconstruction of features. Wei et al. [40] propose a fusion scheme of high land low features, which preserves rich details and background noise that have essential boundary information, thus producing accurate saliency maps. Kousik et al. [41] designed a method by combining the idea of convolutional neural networks and recurrent neural networks (RNN) for video saliency detection. They created a convolutional recurrent neural network (CRNN), and the experiments reveal that the CRNN model achieves improved performance compared to other state-of-the-art saliency models. The authors of [42] proposed a deeply-supervised nonlinear aggregation (DNA) for better leveraging the complementary information of various side outputs. Results show that a modified U-Net architecture with DNA performs favorably against state-of-the-art methods on various datasets.
Several modifications have been made in architectures to improve feature flow and extraction, achieving accurate saliency maps. Mohammadi et al. [43] propose a feature guide network that can suppress the non-salient regions that are difficult to differentiate and thus creates more distinct background and foreground. Dilated convolutions of atrous spatial pyramidal pooling layers achieve a multi-scale feature extraction that aids the generation of more detailed saliency maps. In the work performed by Zhang et al. [44], the authors have tried to leverage image captioning, and it is utilized in SOD problems. Their proposed architecture uses local and global visual contexts along with an image captioning module in order to achieve accurate salient objects. These methods, in most of the cases, despite their efficiency, tend to be incredibly complex and difficult to implement practically and therefore lose their utility in practical fields. Kong et al. [45] propose a novel spatial context-aware network (SCA-Net) for SOD in images, as SCA-Net more effectively aggregates multi-level deep features. Additionally, a long-path context module (LPCM) is employed to grant better discrimination ability to feature maps that incorporate coarse global information. Results show that SCA-Net achieves favorable performances against very recent state-of-the-art algorithms. The authors of [46] propose a simple gated network (GateNet); the authors designed a novel gated dual branch structure to build the cooperation among different levels of features and improve the discriminability of the whole network. The results of five challenging datasets demonstrate that the proposed model performs favorably against most state-of-the-art methods under different evaluation metrics.

3. Proposed Work

This section demonstrates the overall architecture of the proposed model, which is shown in Figure 1. A common conceptualisation of the image-based SOD problem is as follows: given an input image I R W × H × 3 of size W × H , an SOD model f maps the input image I to a continuous saliency map S = f ( I ) [ 0 , 1 ] W × H . For learning-based SOD, the model f is taught through a set of training samples. Given a set of static images I = { I n R W × H × 3 } n and corresponding binary SOD ground-truth masks G = { G n { 0 , 1 } W × H } n , the goal of learning is to find f F that minimizes the prediction error, i.e., Σ n l ( S n , G n ) , where l is a certain distance measure, S n = f ( I n ) , and F is the set of potential mapping functions.
The proposed SOD framework consists mainly of three modules. The prediction module (PM) takes the RGB (red-blue-green channels) image as an input to generate the coarse segmentation map. This is, in turn, fed to the residual enhancement module (REM), which fine-tunes the generated coarse representations to refine saliency maps by learning the residual semantic features between the coarse map and the ground-truth. Furthermore, reverse attention modules (RAMs) are finally introduced in the skip connections between the two cascaded encoder–decoder networks in order to attentively learn the high-level semantic features from the parallel branches.

3.1. Prediction Module

Following the works of [19,47], we form the PM of our architecture, which captures both global contextual information and lower-level semantics effectively to improve the overall feature representation at each stage of the network. To address the problem of over-fitting in the network, each decoding layer is supervised with the corresponding ground truth of the input scene image [48]. The encoding half of the network consists of an input layer and 6 phases. The input layer is a convolutional layer with a filter size of 3 × 3 and a stride size of 1 × 1 . Each phase comprises a basic residual block, the first four of which are adopted from the ResNet-34 [49]. Unlike in ResNet34, the input layer is not followed by a max-pooling operation, implying that the image maintains its spatial resolution for the second phase, enabling the network to obtain feature maps of higher resolution in the initial phases for feature extraction. However, such an arrangement results in decreasing the overall receptive region. Thus, to widen the overall receptive fields in the proposed framework, two additional phases are included after the first four phases, consisting of three basic residual blocks with 512 channels, followed by a non-overlapping 2 × 2 max-pooling operation.
In order to capture the global information, a bridge stage is added while transitioning from the encoding path to the decoding path. It comprises three convolutional layers with a kernel size of 3 × 3 and a dilation rate of 2, which is followed by batch normalization and rectified linear unit (ReLU) activation. The decoding layers are symmetrical to the encoding layers, where each stage receives an input of the concatenated feature maps of the previously upsampled output and the output from its corresponding encoding layer. In order to obtain a saliency map from each decoding layer, the output of the bridge and downsampling layers are passed through 3 × 3 convolutional layers, followed by bi-linear upsampling and sigmoid activation.

3.2. Residual Enhancement Module

Often, the predicted segmentation maps either have noisy and blurry boundaries or include irregularly predicted regional probabilities. Therefore, it is essential to fine-tune these coarsely obtained segmented maps in order to obtain an enhanced output feature map. Several context extraction modules such as the refinement module in [50] often leverage only local contextual information, which fails to capture the global dependencies owing to smaller receptive fields. To capture the multi-scale context, the work reported in [51] proposes a three-scaled pyramidal pooling module. However, the module, being shallow, fails to capture the essential high-level semantic information. In order to utilize the high-level context information, we introduce the REM being cascaded to the prediction network. We also employ the residual encoding–decoding architecture, which is similar to but much simpler than the employed PM. The REM module consists of an input layer and the encoding and decoding layers with an intermediate bridge with a total of four phases. Each phase consists of a single convolutional layer of kernel size 3 × 3 having 64 channels followed by batch normalization and ReLU. The bridge stage has a similar structure to that of the PM. The downsampling operations consist of non-overlapping max pooling, and the upsampling operations employ bi-linear interpolation. The final segmentation map thus obtained through the REM module is the saliency output of the network.

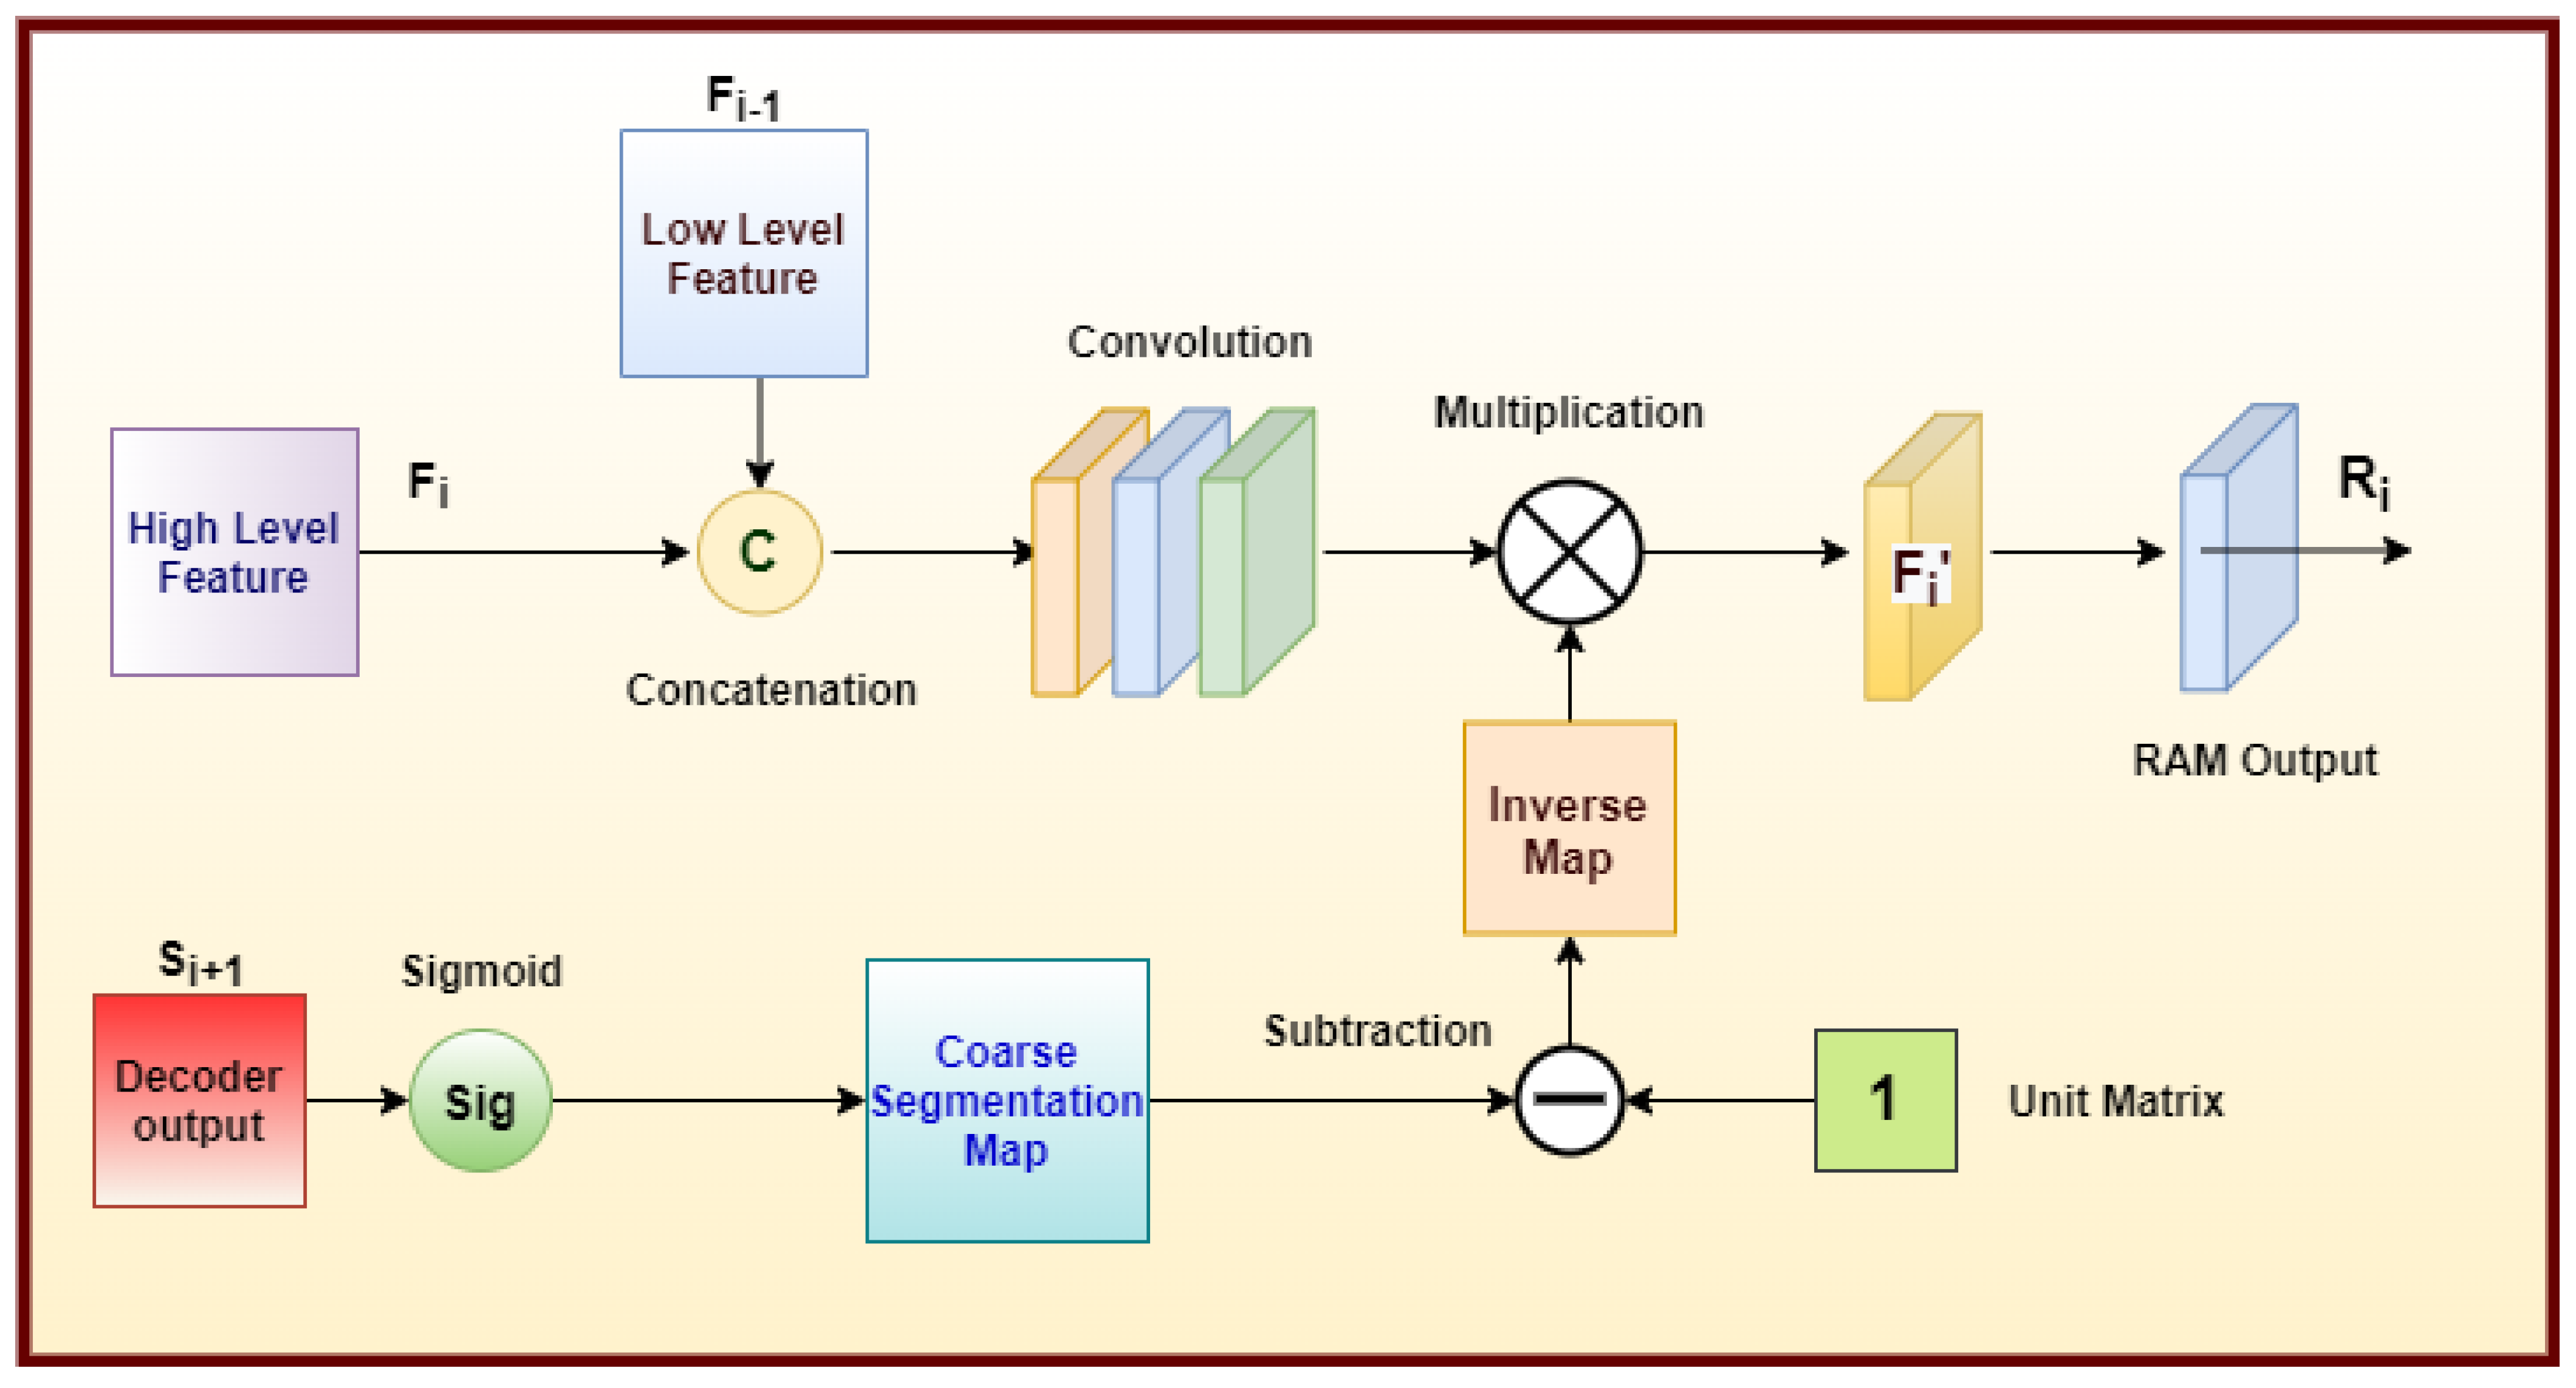
3.3. Reverse Attention

The proposed architecture finally employs four RAMs attached in a cascaded fashion in order to produce finer and more precise segmentation outcomes. The overall workflow of RAM is shown in Figure 2. This arrangement replicates the way human experts produce segmentation maps from natural scene images by producing a rough segmentation map and, subsequently, a finer segmentation map. The lower modules produce a coarser saliency map with higher semantic confidence but low resolution, whereas the higher RA module adaptively localizes the aberration areas from two parallel high-level feature maps and thus helps in producing finer segmentation maps. A sequential capitalization of the complementary regions is achieved by the removal of the existing aberration locations.
The network as explained is, in general, composed of two parts: the PM, which generates a coarse saliency map by supervision at every layer of the decoder, followed by a REM that has an architecture similar to that of the PM but with fewer layers. In theory, the REM generates a finer saliency map from the coarse maps generated by the PM, the intermediate maps. These fine maps are produced by the decoder of the REM following a residual feature extraction in the encoder section of the REM. We aim to capitalize this property of the final decoding structure and feed the finer saliency maps back to the skip-connections in the PM structure. This helps the model to produce finer and more nuanced saliency maps, closer to the ground-truth. In order to achieve this, we propose the use of RAM in the skip connection of the PM architecture that efficiently handles the proposed back-feeding operation and attentively guides the model into producing finer saliency maps.
Essentially, the RA modules take three input maps—the primary skip connection map, the back-fed map from the REM decoder after upsampling, and another map from a higher level in the PM encoder, downsampled to feed to the RA module. The high-level map fed from the PM encoder is supervised in order to produce guidance for the RAM that allows it to help generate finer saliency maps. In principle, the back-fed map is very finely formed, whereas the map fed from the higher layer in the PM is coarsely composed. Therefore, the RA module combines the high semantic confidence of the coarse saliency maps, and the finer intermediate saliency maps help the model to learn the locations of the aberrations that produce coarseness and inaccuracies in the saliency maps. In the RA module, the high-level saliency map of the skip connection S i and the primary saliency map F i 1 are concatenated as shown in Equation (1). The output feature map R i is then obtained by taking the element-wise product (⊙) of the fused saliency map with the RA parameter A i , as shown in Equation (1):
R i = c o n c a t ( F i 1 , S i ) A i ,
where c o n c a t ( F i 1 , S i ) represents the concatenation operation followed by three 2D convolution operations. The parameter A i forms the key aspect of the RA module and is mathematically computed as follows as in Equation (2):
A i = E ( ( σ ( P ( S i + 1 ) ) ) ,
where P represents an upsampling operation, σ represents the Sigmoid activation function, and ⊖ is an inversion operation that inverts the input map. Here, E is used to denote the expansion of a single feature channel to a number of repeated matrices, which involves reversing each channel of the input matrix in Equation (1). The S i + 1 is a binary coarse segmentation map generated from each upsampling layer using the sigmoid activation. The choice of activation can be attributed to the fact that the pixels’ values of S i + 1 need to be scaled down to a range of 0 to 1. Unlike the sigmoid activation, several widely used activation functions such as tanh and ReLU output values ranging from 1 to 1 and 0 to infinity, respectively. Furthermore, the sigmoid activation is widely used for obtaining the segmentation maps, which is a pixel-wise classification statement with two classes (hence binary), i.e., the background and foreground.

3.4. Loss Function

To improve the confidence score in differentiating the boundary pixels and enforce structural similarity in the final segmentation output and the ground-truth, we utilise a combination of the BCE loss and SSIM loss. Additionally, we incorporate the IoU loss in order to improve the extent of overlap between the segmentation map and ground truth. The BCE loss is a widely used classification loss for two classes, namely the background and the foreground. It can be mathematically expressed as Equation (3).
L B C E ( G T , S M ) = ( x , y ) [ G T ( x , y ) · log ( S M ( x , y ) ) + ( 1 G T ( x , y ) ) · log ( 1 S M ( x , y ) ) ]
where G T ( x , y ) ( 0 , 1 ) represents the ground-truth label of the pixel ( x , y ) , and S M ( x , y ) is the corresponding prediction for that pixel.
The IoU adapted as a training loss [52,53] can be represented as in Equation (4).
L I o U = 1 r = 1 H c = 1 W S M ( x , y ) G T ( x , y ) r = 1 H c = 1 W [ S M ( x , y ) + G T ( x , y ) S M ( x , y ) G T ( x , y ) ]
For x and y, which are the two pixel values corresponding to patches of size N × N that cropped from S M and G T , the SSIM loss [54] can be formulated as in Equation (5).
L S S I M = 1 ( 2 μ x μ y + λ 1 ) ( 2 σ x y λ 2 ) ( μ x 2 + μ y 2 + λ 1 ) ( σ x 2 + σ y 2 + λ 1 )
Here, μ x and μ y represent the mean, σ x and σ y denote the standard deviation of the respective pixels under consideration, x and y, and σ x y is their co-variance. λ 1 and λ 2 are two non-zero values to avoid division by zero.
The local neighbourhood of each pixel is taken into account when the SSIM loss is applied on a patch-level. This loss has been specifically designed to focus the optimisation on the boundary regions, because the loss assigns higher weight towards the boundaries. This effectively increases the probabilities on the boundary, even if the activation around the boundary and the foreground is nearly the same. Therefore, as a result, the loss along the boundary is the greatest during the beginning phase of the training and as the training progresses, the background loss dominates over the foreground loss. This is generally towards the end of the training process when the background pixels drop very close to the ground truths.
When SSIM loss is combined with BCE loss, the dominant background loss ensures that the gradients do not become too diminished to drive the training of the model, when the BCE loss is too low to generate strong gradients. A cleaner set of background maps is generated, since the background loss pushes the total loss towards a more optimal minimum. IoU loss is also combined as a map-level loss in order to ensure high confidence of the pixel classification, and this further pushes the model to make better predictions. IoU loss, in theory, gives a measure of the overlap between the prediction and the ground-truth foregrounds, and the better the prediction, the greater the overlap and the lower the loss. Therefore, by a combination of the three losses, we utilise the respective advantages of all the three losses, and the shortcomings of each loss have been effectively nullified by the merits of the others. As such, the BCE loss maintains a smooth gradient flow for all pixels for a pixel-level classification, the IoU loss puts more emphasis on the foreground and hence leads to the foreground being predicted better and with higher confidence, and the SSIM loss ensures that the structural integrity of the original image is maintained by enhancing the loss around the boundary regions of the saliency maps.

4. Experimental Results

In this section, we report our experimental results on RGB SOD datasets. The proposed architecture is trained and evaluated on three standard benchmark natural scene datasets namely, DUTS [55,56], HKU-IS [23], and ECSSD [24]. The network is trained on DUTS for 200k iterations and 150k iterations on HKU-IS and ECSSD setting the batch size to 8. The architecture requires around 48 h to complete the training process being implemented on the PyTorch 1.9.0 framework using a Tesla-P100 GPU. The general description of the datasets used is given below.
  • DUTS dataset [22]: This is a collection of 15,572 images intended for saliency detection. The dataset is split into the training set, DUTS-TR having 10,553 images taken from the ImageNet DET training/val sets and the test set, and DUTS-TE having 5019 images taken from the ImageNet DET test set as well as the SUN dataset. The ground-truths have been accurately generated by 50 human subjects. The dataset is the largest of the three datasets used in the study and has very challenging scenarios, which explain why the performance of the proposed model is the lowest when compared to the other datasets used to evaluate the model.
  • HKU-IS dataset [23]: The HKU-IS dataset consists of 4447 images for saliency detection. The training dataset consists of 3557 images, while the test set consists of 890 images. This dataset consists of images with low contrast or multiple objects, which makes the saliency detection task on the dataset somewhat challenging.
  • ECSSD dataset [24]: The extended complex scene saliency dataset (ECSSD) consists of 1000 images with their respective ground-truths, split into 900 train images and 100 test images. The images of the dataset consist of mostly complex scenes, whose textures and structures resemble those of real-world images. The ground-truth saliency maps of the dataset were prepared by five human experts.

4.1. Evaluation Metrics

Four widely used evaluation metrics have been considered to evaluate the overall performance of the proposed Revise-Net that have been listed as follows:
  • MAE: The MAE estimates the approximation degree between the saliency map S and the binary ground-truth G , both normalized in the range [0, 1]. As mentioned in [6], other measures do not take into consideration the true negative saliency assignments. However, the evaluation on non-salient regions can be unfair, especially for the methods that successfully detect non-salient regions but do not detect salient regions due to overlap-based evaluation. The MAE score is defined as:
    M A E = 1 W × H x = 1 W y = 1 H | S ( x , y ) G ( x , y ) |
  • F-measure w F β : w F β is an overall evaluation standard computed by a weighted combination of precision and recall. The w F β measure offers a unified solution for the evaluation of binary and non-binary maps. We use a weighted harmonic mean beta, and β 2 is set to 0.3, as suggested by [25,57]. w F β is defined as:
    w F β = ( 1 + β 2 ) P r e c i s i o n w · R e c a l l w β 2 · P r e c i s i o n w + R e c a l l w
  • S-measure S α : The authors in [58] proposed a novel and easy-to-calculate measure known as structural similarity measure S α or S to evaluate the non-binary foreground maps. The S-measure combines the region-aware ( S r ) and object-aware ( S o ) structural similarity as their final structure metric:
    S = α S o + ( 1 α ) S r ,
    where α [ 0 , 1 ] . We have experimentally set α = 0.5 in our implementation.

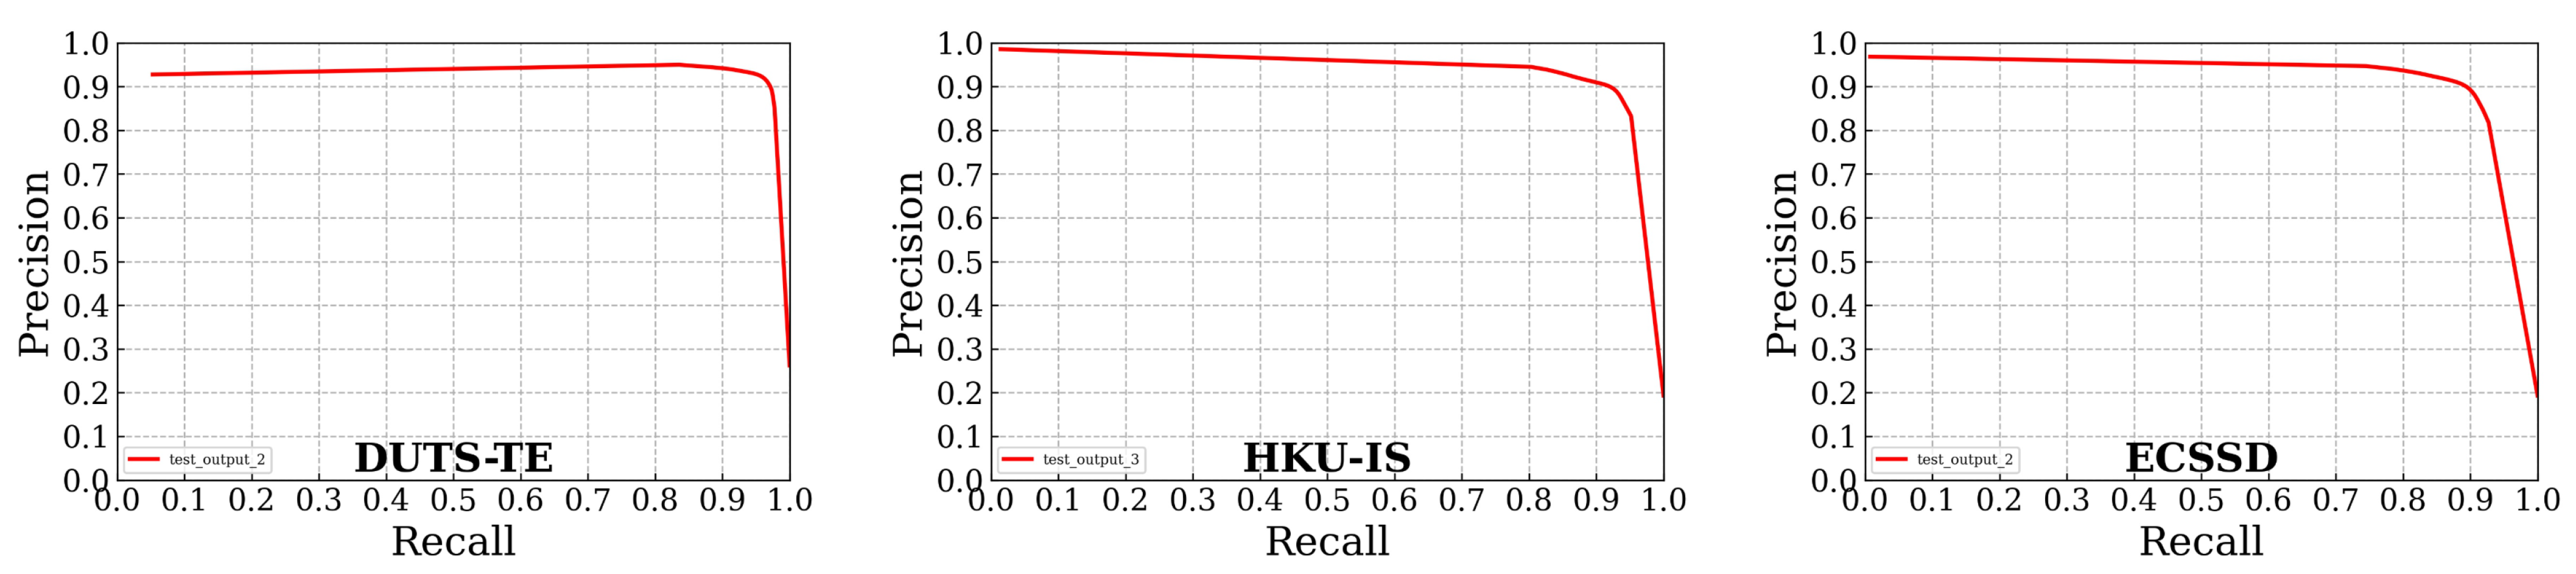
4.2. Quantitative Results

The model performs efficiently, producing MAE scores of 0.033, 0.029, and 0.036 and mean F-measures of 0.900, 0.937, and 0.947 on the DUTS-TE [22], HKU-IS [23], and ECSSD [24] datasets, respectively. This shows that our proposed model produces very high-quality saliency maps, and that the performance is extendable over multiple datasets, which proves of the robustness of the model as well as its capacity to generalize the data provided. An evaluation of the S-scores also shows that the model achieves high metrics of 0.907, 0.889, and 0.874 on the said datasets, respectively, which further confirms the merits of the proposed model. A comparison of the proposed model with state-of-the-art models in the contemporary literature has been provided in Table 1. Figure 3 displays the plots of the precision-recall curves of our model on three SOD datasets. As observed from Figure 3, the proposed framework provides a very high precision to recall ratio, suggesting a high trade-off rate between the true positives and predicted positives. Here, the positives refer to the salient class that is the foreground. Furthermore, we plot the F-measure for varying thresholds. It is noted that the values of the F-measure remain fairly constant for varying confidence thresholds highlighting the accuracy of the model to correctly classify pixels to their respective classes. Moreover, our model produces significantly higher improvements in case of DUTS-TE [22] dataset, which includes fairly complex images with hard-to-find objects and optical illusions.

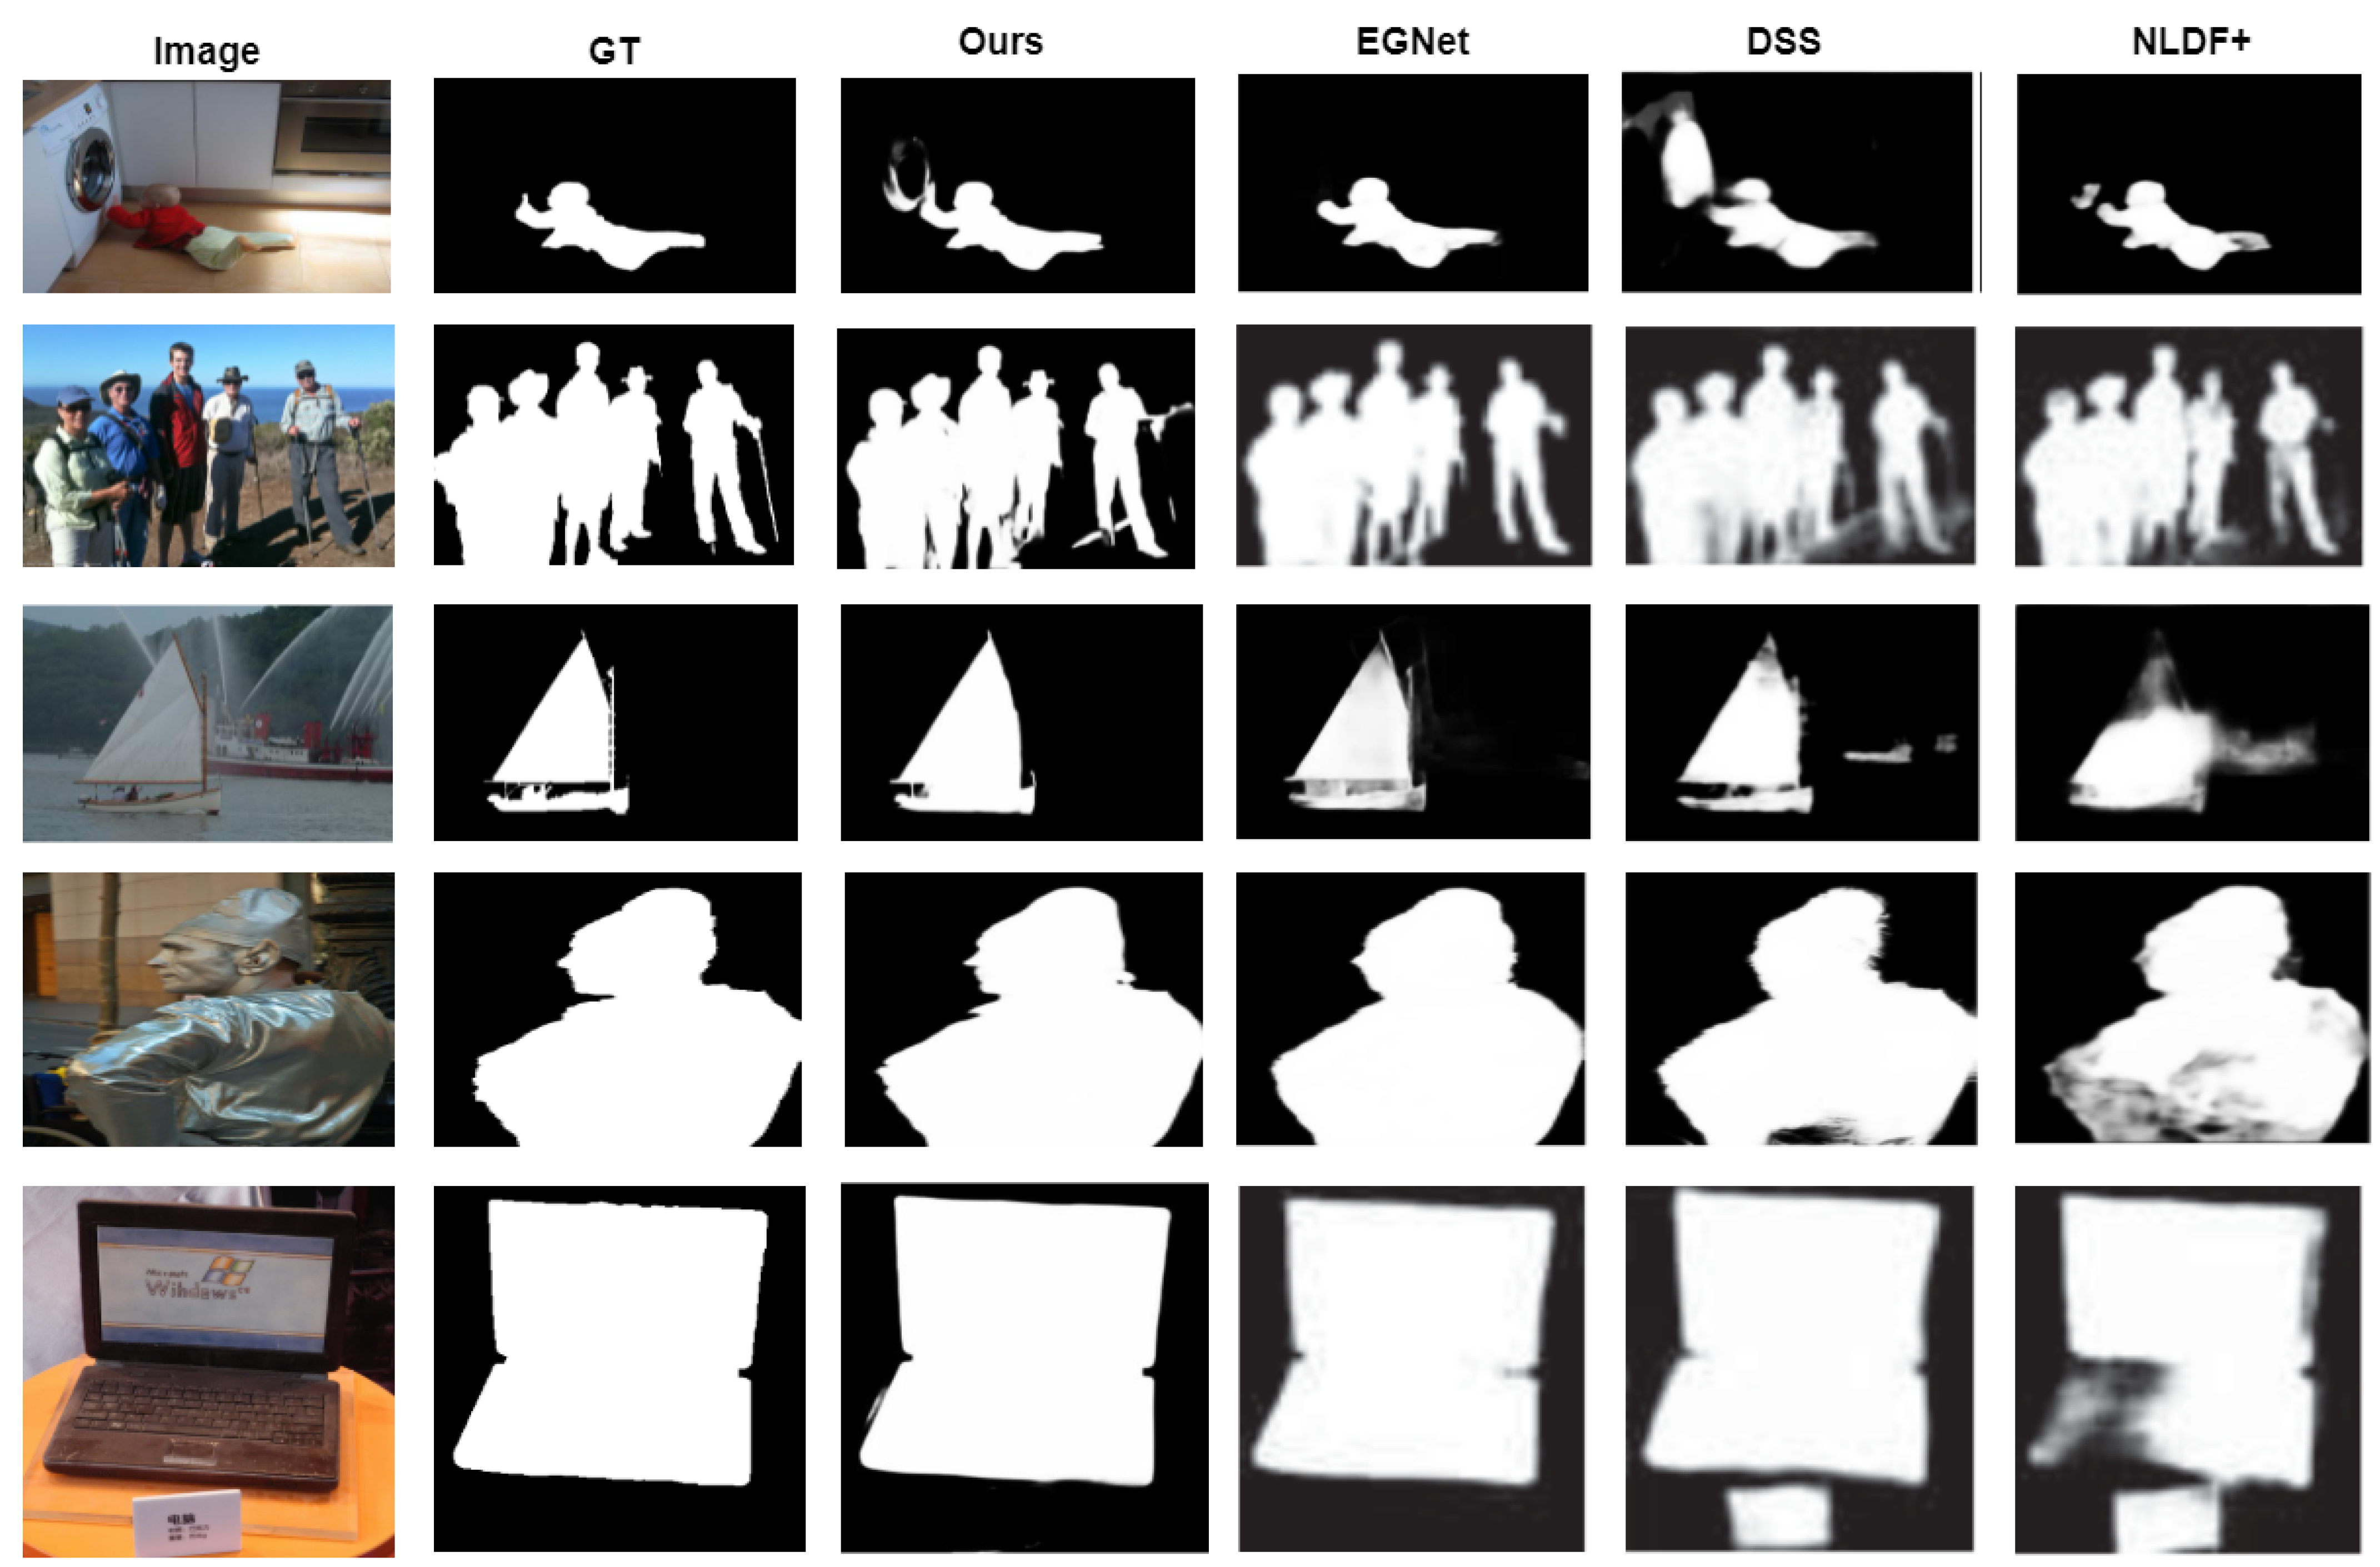
4.3. Comparison with State-of-the-Art

We have compared our model’s performance with 10 state-of-the-art networks previously used for SOD on three benchmark datasets: DUTS-TE [22], HKU-IS [59], and ECSSD [60], which are as follows: AFNet [61], CapSal [44], CPD-R [62], DSS [63], MLMS [64], MSWS [65], PoolNet [66], U2-Net [32], and EG-Net [17]. In order to preserve the integrity of the evaluation and to obtain a fair comparison with existing SOD approaches, we have utilized the saliency maps of different methods, which are either published by the authors or achieved by running the publicly available codes on the datasets being evaluated maintaining the method-specific training environment.

4.3.1. Comparison over DUTS-TE Dataset

The proposed model, upon evaluation of the DUTS-TE dataset [22], performs quite well, providing superior results to several state-of-the-art methods, as observed in Table 1. Our model produces a mean F score of 0.900, a mean average error of 0.033, and an S-measure of 0.880. An inspection of the Table 1 also makes it apparent that the proposed model generates better results than the state-of-the-art methods. Our model has a significantly higher F score than both CapSal [44] and MLMS [64] models and produces better results than the PoolNet model [66] by 0.8% on the F-measure metric. We have calculated both the w F β score and m a x F β score on DUTS-TE dataset, which are found to be 0.906 and 0.934, respectively. We have also provided the S α score of 0.907. The comparison of the results of this dataset shows the efficacy of the REM, which is introduced in our model, over standard feature fusion or aggregation modules, as proposed in PoolNet model [66].
Table 1. Comparison of the proposed Revise-Net with state-of-the-art baselines on DUTS-TE, HKU-IS and ECSSD datasets.
ModelDUTS-TEHKU-ISECSSD
FMAESFMAESFMAES
AFNet [61]0.8620.0460.8660.9230.0360.9050.9350.0420.914
CapSal [44]0.7890.044-0.8780.039----
CPD-R [62]0.8650.043-0.9250.034-0.9390.037-
DSS [63]---0.9200.035-0.9280.048-
MLMS [64]0.8020.0450.8560.8930.0340.9010.9140.0380.911
MSWS [65]------0.8780.096-
PoolNet [66]0.8920.036-0.9350.030-0.9450.038-
U2-Net [32]------0.9430.041-
EGNet [17]0.8930.0390.8750.9290.0340.9100.9430.0410.918
PAGE Net [67]0.8170.047-0.9200.030-0.9260.035-
Revise-Net0.9000.0330.8800.9370.0290.8980.9470.0360.919

4.3.2. Comparison over HKU-IS Dataset

Upon evaluation on the HKU-IS dataset, our proposed Revise-Net model produces a high mean F score of 0.937, a mean average error of 0.029, and an S-measure of 0.898. The w F β and E ξ scores are calculated as 0.871, 0.942, respectively. These values are very high as compared to state-of-the-art methods, which is confirmed by Table 1. Here, it is to be noted that the architecture proposed in PAGE Net [67] consists of an arrangement for edge detection that improves the results for the SOD task. On the other hand, the EGNet model [17] proposes an additional supervision for detection of the edge features. Although we have made no arrangement to make the model learn the edge features, the use of SSIM loss incorporated in our overall objective function suffices for this task. Therefore, our choice of the loss function can be considered an optimal one. As a result, the proposed architecture produces better results than state-of-the-art methods such as DSS [63], AFNet [61], and PoolNet [66], among others.

4.3.3. Comparison over ECSSD Dataset

A similar evaluation procedure on the ECSSD dataset generates a mean F score of 0.947, a mean average error of 0.036, and S-measure of 0.919. The w F β and E ξ scores are computed as 0.855, 0.929, respectively, as shown in Table 1, which clearly confirms the effectiveness in SOD of the proposed model. These values show that the model performs better than methods such as PoolNet [66], MLMS [64], and CPD-R [62]. This signifies that the proposed method qualifies as a state-of-the-art system for the generation of saliency maps. In spite of the fact that the proposed method produced better results than most of the state-of-the-art methods in the literature, it outperforms the standard baselines by a narrow margin when compared to DUTS or HKU-IS datasets.This can be attributed to the dataset being small as well as the number of outlier data points in the train and test sets is much lesser as compared to the HKU-IS and the DUTS datasets, and hence the observation. The ECSSD consists of 1000 images only, so we have separated the dataset into a train–test set, with a training set consisting of 900 images and a test set consisting of 100 images. The MAE, w F β , m a x F β , E ξ , and S α on the ECSSD are 0.042, 0.855, 0.904, 0.929, and 0.874, respectively. Both the MAE score as well as the precision–recall curves show that our model is more robust with different and broader salient objects and has better generalizability.

4.4. Empirical Studies

To observe and provide a justification of the module adopted in our proposed framework, the ablation study is performed on the ECSSD dataset that is discussed here. The investigation centres on justifying the effectiveness of the REM and the RAM taken singularly with the base PM. We further ablate the loss function incorporated in our proposed network. The experimental results are tabulated in Table 2.

4.4.1. Effectiveness of the REM

U-Net is one of the most preferred choices in an encoder–decoder system for solving image segmentation problems. In our studies, it is observed that the U-Net, as a standalone network, along with the BCE loss, significantly underperforms, especially considering that the MAE metric has a value of 0.066 . This is shown in Table 2. This can be explained by the fact that, despite having extraordinary representational power, U-Net fails to re-utilise the high-level semantic information captured by simple upsampling. The encoder–decoder system with residual blocks considerably improves the F-measure to a value of 0.929 . Furthermore, supervising each coarse segmentation map at the decoding levels produces an F-measure of 0.934 . Finally, the addition of the REM improves the F-measure to a value of 0.937 and gives a MAE metric of 0.042 . The REM utilises the finely extracted features and refines the irregularly predicted probabilities of the final segmentation output, thereby increasing the overall quality as well as clarity of boundaries.

4.4.2. Effectiveness of the Reverse Attention Module

Maintaining a similar experimental environment to the training procedure, we explore the utility of the RA in our proposed architecture. It is observed that the RAM incorporated with our prediction backbone achieves an F-measure of 0.938 and an MAE of 0.039 . Additionally, a combination of the PM, RAM, and REM, along with BCE loss for supervision, attains an F-measure and MAE of 0.940 and 0.041 , respectively. The intermediate saliency maps of the REM decoding layers are fed to the RA modules present in the skip connections of the prediction network. This is undertaken to attentively use the finer outlines and saliency regions, as well as to guide the feature extraction via the encoder on multiple scales, hence refining the overall feature representation.

4.4.3. Effectiveness of the Combination of Losses

The bottom half of Table 2 shows the performance of the proposed model when the components of the proposed objective function are used separately and partially. The SSIM, when utilized as a standalone supervision loss, produces an MAE of 0.042 , whereas the IoU loss achieves an MAE score of 0.039 . Individually, the IOU loss performs better than the SSIM loss, as seen from the comparison. This is to be expected, as SSIM loss is only a patch-level loss, whereas the IOU loss is a map-level loss, thus helping to discriminate the foreground better than SSIM loss. When combined with the BCE loss, the IOU loss produces a better MAE (of 0.038 ) than a MAE score (of 0.040 ) in case of SSIM loss. However, the SSIM loss shows its efficacy when used in combination with the BCE loss and the IOU loss, thus achieving an MAE of 0.036 . Furthermore, the proposed objective function produces significantly better results than the ablated versions of the objective function.

5. Discussion

The proposed SOD model, Revise-Net, consists of a prediction module, a residual enhancement module, and four reverse attention modules. The PM generates a coarse segmentation map, which is then passed through REM for further fine-tuning. The intermediate upsampling maps of the REM are passed to the RA module to guide the PM, thus improving the final saliency output map. The performance of the architecture is recorded on publicly available SOD datasets consisting of several complex features. The key idea in capturing complex and fine details from the image involves extracting both local and global contextual information, realizing a pixel’s relation with its surroundings.
Revise-Net consistently produces superior results when compared with several state-of-the-art baselines, as explained in Section 4.3. The network outperforms [44,61] by a significant margin of 0.013 and 0.011 over the MAE metric on DUTS-TE, consisting of comparatively complex features in the images. Similar trends can be observed for HKU-IS and ECSSD datasets. This can be attributed to the fact that the Revise-Net utilizes two networks sequentially. The REM is much shallower than the PM in order to maintain the computational trade-off. The deep features extracted by the PM are learned by REM for the precise reconstruction of features. Furthermore, the layer-wise supervision of the PM decoder functions as a strong regularization for accurately classifying the learned features. However, several redundant features present in the representation affect the overall performance of the framework. In order to mitigate this problem, the RA modules are cascaded between two sub-networks to attentively increase the weights of more discriminative features by the effective guidance of the final saliency map, thus preventing the redundant features from being assigned equal weights.
It can be seen in row 2 and row 3 of Figure 4 that the EGNet model [17], performing closest to our results, fails to capture the sharp boundary lines, thus producing a noisy segmentation output. This can be explained by the fact that the authors in [17] incorporate a one-to-one edge guidance model to capture that boundary details by utilizing a standard objective function to supervise the network as a whole. In our method, we employ a combination of loss functions for boundary detection, which penalizes the network for discrepancies after every epoch. The results obtained in row 4 of Figure 4 further demonstrate the ability of the network to distinguish many finer semantic details of the salient object. From column 3 and column 4, the efficacy of RA can also be explained. The RAM uses final as well as intermediate saliency maps supervised by the ground-truth to detect the salient class object in the input image avoiding misclassification. Despite the positive outcomes, our framework also misclassifies certain object classes, as seen in Figure 5. It is evident from Figure 5 that the images producing irregular segmentation maps are relatively more complex, having similar non-saliency classes in them. Row 1 and 2 suggest that increasing the number of iterations for these kinds of images may improve the final output. Similarly, in row 3 of Figure 5, our proposed SOD network confuses the dominant class and the class of interest in the image.

6. Conclusions and Future Works

In this paper, we propose a simple but effective architecture called Revise-Net for solving the SOD problem. The proposed segmentation pipeline is a predict–enhance–revise framework that consists of three primary components: a prediction module to generate the coarse saliency maps, an enhancement module to fine-tune the coarse map, and multi-scaled reverse attention modules to revise the prediction network attentively via the intermediate saliency maps of enhancement modules. We further propose utilizing a combination of three losses, namely BCE, SSIM, and IoU, to improve the classification of boundary pixels. The Revise-Net model is capable of capturing large-scale information as well as finer structures present in the salient regions, generating high-quality segmentation maps with cleaner boundaries. Comprehensive experimental analysis and ablation studies demonstrate the superiority of our architecture over several state-of-the-art frameworks. The proposed network when evaluating DUTS, HKU-IS, and ECSSD achieves MAE scores of 0.033, 0.029, and 0.036 and mean F-measures of 0.900, 0.937, and 0.947, respectively, further asserting its efficiency, outperforming the contemporary baselines in the existing literature.
To mitigate the problem of misclassification, in the proposed Revise-Net, for images with similar non-saliency classes, we plan on incorporating the self-attention mechanism in the overall scheme to further capture the global contextual information effectively for our future works. Additionally, the comparatively narrow performance margin in case of smaller datasets (e.g., ECSSD) demands scope of improvement in the network leveraging on transfer learning. Moreover, taking the success of our current architecture into account, we also intend to extend the proposed model to incorporate the concept of domain adaptation for further increasing its generalizability and robustness over varied datasets.

Author Contributions

Conceptualization, Y.K. and R.S.; methodology, R.H.; software, P.K.S.; validation, R.H., P.K.S. and R.S.; formal analysis, Y.K.; investigation, R.S.; resources, P.K.S.; data curation, R.H.; writing—original draft preparation, Y.K.; writing—review and editing, R.S.; visualization, P.K.S., M.F.I. and M.W.; supervision, M.F.I. and M.W.; project administration, M.F.I. and M.W.; funding acquisition, M.F.I. and M.W. All authors have read and agreed to the published version of the manuscript.

Funding

The authors acknowledge contribution to this project from the Rector of the Silesian University of Technology under a proquality grant no. 09/020/RGJ21/0007.

Institutional Review Board Statement

Not applicable.

Informed Consent Statement

Not applicable.

Data Availability Statement

The current research has been done on publicly available datasets.

Acknowledgments

The authors would like to thank the Centre for Microprocessor Applications for Training, Education and Research (CMATER) research laboratory of the Computer Science and Engineering Department, Jadavpur University, Kolkata, India for providing the infrastructural support.

Conflicts of Interest

The authors declare no conflict of interest.

References

  1. Treisman, A.M.; Gelade, G. A feature-integration theory of attention. Cogn. Psychol. 1980, 12, 97–136. [Google Scholar] [CrossRef]
  2. Koch, C.; Ullman, S. Shifts in selective visual attention: Towards the underlying neural circuitry. In Matters of Intelligence; Springer: Berlin/Heidelberg, Germany, 1987; pp. 115–141. [Google Scholar]
  3. Itti, L.; Koch, C.; Niebur, E. A model of saliency-based visual attention for rapid scene analysis. IEEE Trans. Pattern Anal. Mach. Intell. 1998, 20, 1254–1259. [Google Scholar] [CrossRef] [Green Version]
  4. Liu, T.; Yuan, Z.; Sun, J.; Wang, J.; Zheng, N.; Tang, X.; Shum, H.Y. Learning to detect a salient object. IEEE Trans. Pattern Anal. Mach. Intell. 2010, 33, 353–367. [Google Scholar]
  5. Achanta, R.; Hemami, S.; Estrada, F.; Susstrunk, S. Frequency-tuned salient region detection. In Proceedings of the 2009 IEEE Conference on Computer Vision and Pattern Recognition, Miami, FL, USA, 20–25 June 2009; pp. 1597–1604. [Google Scholar]
  6. Borji, A.; Cheng, M.M.; Jiang, H.; Li, J. Salient object detection: A benchmark. IEEE Trans. Image Process. 2015, 24, 5706–5722. [Google Scholar] [CrossRef] [PubMed] [Green Version]
  7. Medioni, G.; Nevatia, R. Segment-based stereo matching. Comput. Vision Graph. Image Process. 1985, 31, 2–18. [Google Scholar] [CrossRef]
  8. Ma, C.; Miao, Z.; Zhang, X.P.; Li, M. A Saliency Prior Context Model for Real-Time Object Tracking. IEEE Trans. Multimed. 2017, 19, 2415–2424. [Google Scholar] [CrossRef]
  9. Wang, X.; You, S.; Li, X.; Ma, H. Weakly-Supervised Semantic Segmentation by Iteratively Mining Common Object Features. In Proceedings of the IEEE Conference on Computer Vision and Pattern Recognition, Salt Lake City, UT, USA, 18–22 June 2018. [Google Scholar]
  10. Sun, G.; Wang, W.; Dai, J.; Gool, L.V. Mining Cross-Image Semantics for Weakly Supervised Semantic Segmentation. In European Conference on Computer Vision; Springer: Cham, Switzerland, 2020. [Google Scholar]
  11. Qin, X.; He, S.; Yang, X.; Dehghan, M.; Qin, Q.; Martin, J. Accurate outline extraction of individual building from very high-resolution optical images. IEEE Geosci. Remote Sens. Lett. 2018, 15, 1775–1779. [Google Scholar] [CrossRef]
  12. Qin, X.; He, S.; Zhang, Z.; Dehghan, M.; Jagersand, M. Bylabel: A boundary based semi-automatic image annotation tool. In Proceedings of the 2018 IEEE Winter Conference on Applications of Computer Vision (WACV), Lake Tahoe, NV, USA, 12–15 March 2018; pp. 1804–1813. [Google Scholar]
  13. Mechrez, R.; Shechtman, E.; Zelnik-Manor, L. Saliency driven image manipulation. Mach. Vis. Appl. 2019, 30, 189–202. [Google Scholar] [CrossRef] [Green Version]
  14. Gupta, P.; Gupta, S.; Jayagopal, A.; Pal, S.; Sinha, R. Saliency prediction for mobile user interfaces. In Proceedings of the 2018 IEEE Winter Conference on Applications of Computer Vision (WACV), Lake Tahoe, NV, USA, 12–15 March 2018; pp. 1529–1538. [Google Scholar]
  15. Zhang, P.; Wang, D.; Lu, H.; Wang, H.; Yin, B. Learning Uncertain Convolutional Features for Accurate Saliency Detection. In Proceedings of the IEEE International Conference on Computer Vision, Venice, Italy, 22–29 October 2017. [Google Scholar]
  16. Zhuge, Y.; Zeng, Y.; Lu, H. Deep Embedding Features for Salient Object Detection. In Proceedings of the AAAI Conference on Artificial Intelligence, Honolulu, HI, USA, 27 January 27–1 February 2019; Volume 33, pp. 9340–9347. [Google Scholar] [CrossRef]
  17. Zhao, J.X.; Liu, J.; Fan, D.P.; Cao, Y.; Yang, J.; Cheng, M.M. EGNet:Edge Guidance Network for Salient Object Detection. In Proceedings of the IEEE/CVF International Conference on Computer Vision, Seoul, Korea, 27–28 October 2019. [Google Scholar]
  18. Deng, Z.; Hu, X.; Zhu, L.; Xu, X.; Qin, J.; Han, G.; Heng, P.A. R3net: Recurrent residual refinement network for saliency detection. In Proceedings of the 27th International Joint Conference on Artificial Intelligence, Stockholm, Sweden, 13–19 July 2018; AAAI Press: Palo Alto, CA, USA, 2018; pp. 684–690. [Google Scholar]
  19. Ronneberger, O.; Fischer, P.; Brox, T. U-net: Convolutional networks for biomedical image segmentation. In Proceedings of the International Conference on Medical Image Computing and Computer-Assisted Intervention, Munich, Germany, 5–9 October 2015; Springer: Berlin/Heidelberg, Germany, 2015; pp. 234–241. [Google Scholar] [CrossRef] [Green Version]
  20. Zheng, T.; Li, B.; Zeng, D.; Zhou, Z. Delving into the Impact of Saliency Detector: A GeminiNet for Accurate Saliency Detection. In Proceedings of the International Conference on Artificial Neural Networks, Munich, Germany, 17–19 September 2019; Springer: Berlin/Heidelberg, Germany, 2019; pp. 347–359. [Google Scholar] [CrossRef]
  21. Li, X.; Yang, F.; Cheng, H.; Liu, W.; Shen, D. Contour knowledge transfer for salient object detection. In Proceedings of the European Conference on Computer Vision (ECCV), Munich, Germany, 8–14 September 2018; pp. 355–370. [Google Scholar] [CrossRef]
  22. Wang, L.; Lu, H.; Wang, Y.; Feng, M.; Wang, D.; Yin, B.; Ruan, X. Learning to Detect Salient Objects with Image-Level Supervision. In Proceedings of the 2017 IEEE Conference on Computer Vision and Pattern Recognition (CVPR), Honolulu, HI, USA, 21–26 July 2017; pp. 3796–3805. [Google Scholar] [CrossRef]
  23. Li, G.; Yu, Y. Deep contrast learning for salient object detection. In Proceedings of the IEEE Conference on Computer Vision and Pattern Recognition, Las Vegas, NV, USA, 27–30 June 2016; pp. 478–487. [Google Scholar] [CrossRef] [Green Version]
  24. Tran, R.; Patrick, D.; Geyer, M.; Fernandez, A. SAD: Saliency-based Defenses Against Adversarial Examples. arXiv 2020, arXiv:2003.04820. [Google Scholar]
  25. Yang, C.; Zhang, L.; Lu, H.; Ruan, X.; Yang, M.H. Saliency Detection via Graph-Based Manifold Ranking. In Proceedings of the 2013 IEEE Conference on Computer Vision and Pattern Recognition, Portland, OR, USA, 23–28 June 2013; pp. 3166–3173. [Google Scholar] [CrossRef]
  26. Srivatsa, R.S.; Babu, R.V. Salient Object Detection via Objectness Measure. In Proceedings of the 2015 IEEE International Conference on Image Processing, Quebec City, QC, Canada, 27–30 September 2015. [Google Scholar]
  27. Zhu, W.; Liang, S.; Wei, Y.; Sun, J. Saliency Optimization from Robust Background Detection. In Proceedings of the 2014 IEEE Conference on Computer Vision and Pattern Recognition, Columbus, OH, USA, 23–28 June 2014; pp. 2814–2821. [Google Scholar] [CrossRef] [Green Version]
  28. Hu, X.; Zhu, L.; Qin, J.; Fu, C.W.; Heng, P.A. Recurrently Aggregating Deep Features for Salient Object Detection. In Proceedings of the AAAI Conference on Artificial Intelligence, New Orleans, LA, USA, 2–7 February 2018; AAAI: Palo Alto, CA, USA, 2018. [Google Scholar]
  29. Liu, N.; Han, J.; Yang, M.H. PiCANet: Learning Pixel-Wise Contextual Attention for Saliency Detection. In Proceedings of the 2018 IEEE/CVF Conference on Computer Vision and Pattern Recognition, Salt Lake City, UT, USA, 18–23 June 2018; pp. 3089–3098. [Google Scholar] [CrossRef] [Green Version]
  30. Wang, L.; Wang, L.; Lu, H.; Zhang, P.; Ruan, X. Salient Object Detection with Recurrent Fully Convolutional Networks. IEEE Trans. Pattern Anal. Mach. Intell. 2019, 41, 1734–1746. [Google Scholar] [CrossRef]
  31. Zhou, Z.; Siddiquee, M.M.R.; Tajbakhsh, N.; Liang, J. Unet++: A nested u-net architecture for medical image segmentation. In Deep Learning in Medical Image Analysis and Multimodal Learning for Clinical Decision Support; Springer: Berlin/Heidelberg, Germany, 2018; pp. 3–11. [Google Scholar]
  32. Qin, X.; Zhang, Z.; Huang, C.; Dehghan, M.; Zaiane, O.R.; Jagersand, M. U2-Net: Going deeper with nested U-structure for salient object detection. Pattern Recognit. 2020, 106, 107404. [Google Scholar] [CrossRef]
  33. Han, L.; Li, X.; Dong, Y. Convolutional edge constraint-based U-net for salient object detection. IEEE Access 2019, 7, 48890–48900. [Google Scholar] [CrossRef]
  34. Yu, S.; Zhang, B.; Xiao, J.; Lim, E.G. Structure-consistent weakly supervised salient object detection with local saliency coherence. In Proceedings of the AAAI Conference on Artificial Intelligence (AAAI), Online, 2–9 February 2021; AAAI: Palo Alto, CA, USA, 2021. [Google Scholar]
  35. Zhang, J.; Xie, J.; Barnes, N. Learning noise-aware encoder-decoder from noisy labels by alternating back-propagation for saliency detection. In Computer Vision–ECCV 2020, Proceedings of the 16th European Conference, Glasgow, UK, 23–28 August 2020; Springer: Berlin/Heidelberg, Germany, 2020; pp. 349–366. [Google Scholar]
  36. Fu, K.; Zhao, Q.; Gu, I.Y.H.; Yang, J. Deepside: A general deep framework for salient object detection. Neurocomputing 2019, 356, 69–82. [Google Scholar] [CrossRef]
  37. Wang, N.; Gong, X. Adaptive fusion for RGB-D salient object detection. IEEE Access 2019, 7, 55277–55284. [Google Scholar] [CrossRef]
  38. Liu, Z.; Shi, S.; Duan, Q.; Zhang, W.; Zhao, P. Salient object detection for RGB-D image by single stream recurrent convolution neural network. Neurocomputing 2019, 363, 46–57. [Google Scholar] [CrossRef]
  39. Chen, Z.; Xu, Q.; Cong, R.; Huang, Q. Global context-aware progressive aggregation network for salient object detection. In Proceedings of the AAAI Conference on Artificial Intelligence, New York, NY, USA, 7–12 February 2020; AAAI: Palo Alto, CA, USA, 2020; Volume 34, pp. 10599–10606. [Google Scholar]
  40. Wei, J.; Wang, S.; Huang, Q. F3Net: Fusion, Feedback and Focus for Salient Object Detection. In Proceedings of the AAAI Conference on Artificial Intelligence, New York, NY, USA, 7–12 February 2020; AAAI: Palo Alto, CA, USA, 2020; Volume 34, pp. 12321–12328. [Google Scholar]
  41. Kousik, N.; Natarajan, Y.; Arshath Raja, R.; Kallam, S.; Patan, R.; Gandomi, A.H. Improved salient object detection using hybrid Convolution Recurrent Neural Network. Expert Syst. Appl. 2021, 166, 114064. [Google Scholar] [CrossRef]
  42. Liu, Y.; Cheng, M.M.; Zhang, X.Y.; Nie, G.Y.; Wang, M. DNA: Deeply Supervised Nonlinear Aggregation for Salient Object Detection. IEEE Trans. Cybern. 2021, 1–12. [Google Scholar] [CrossRef]
  43. Mohammadi, S.; Noori, M.; Bahri, A.; Majelan, S.G.; Havaei, M. CAGNet: Content-aware guidance for salient object detection. Pattern Recognit. 2020, 103, 107303. [Google Scholar] [CrossRef] [Green Version]
  44. Zhang, L.; Zhang, J.; Lin, Z.; Lu, H.; He, Y. CapSal: Leveraging Captioning to Boost Semantics for Salient Object Detection. In Proceedings of the IEEE Conference on Computer Vision and Pattern Recognition, Long Beach, CA, USA, 15–20 June 2019. [Google Scholar]
  45. Kong, Y.; Feng, M.; Li, X.; Lu, H.; Liu, X.; Yin, B. Spatial context-aware network for salient object detection. Pattern Recognit. 2021, 114, 107867. [Google Scholar] [CrossRef]
  46. Zhao, X.; Pang, Y.; Zhang, L.; Lu, H.; Zhang, L. Suppress and Balance: A Simple Gated Network for Salient Object Detection. In Proceedings of the European Conference on Computer Vision, Glasgow, UK, 23–28 August 2020; Springer: Cham, Switzerland, 2020. [Google Scholar]
  47. Badrinarayanan, V.; Kendall, A.; Cipolla, R. Segnet: A deep convolutional encoder-decoder architecture for image segmentation. IEEE Trans. Pattern Anal. Mach. Intell. 2017, 39, 2481–2495. [Google Scholar] [CrossRef] [PubMed]
  48. Xie, S.; Tu, Z. Holistically-nested edge detection. In Proceedings of the Proceedings of the IEEE International Conference on Computer Vision, Santiago, Chile, 7–13 December 2015; pp. 1395–1403. [Google Scholar]
  49. He, K.; Zhang, X.; Ren, S.; Sun, J. Deep residual learning for image recognition. In Proceedings of the IEEE Conference on Computer Vision and Pattern Recognition, Las Vegas, NV, USA, 27–30 June 2016; pp. 770–778. [Google Scholar]
  50. Islam, M.A.; Kalash, M.; Rochan, M.; Bruce, N.D.; Wang, Y. Salient Object Detection using a Context-Aware Refinement Network. In Proceedings of the British Machine Vision Conference, London, UK, 4–7 September 2017. [Google Scholar] [CrossRef] [Green Version]
  51. He, K.; Zhang, X.; Ren, S.; Sun, J. Spatial pyramid pooling in deep convolutional networks for visual recognition. IEEE Trans. Pattern Anal. Mach. Intell. 2015, 37, 1904–1916. [Google Scholar] [CrossRef] [PubMed] [Green Version]
  52. Rahman, M.A.; Wang, Y. Optimizing intersection-over-union in deep neural networks for image segmentation. In Proceedings of the International Symposium on Visual Computing, Las Vegas, NV, USA, 12–14 December 2016; Springer: Berlin/Heidelberg, Germany, 2016; pp. 234–244. [Google Scholar]
  53. Máttyus, G.; Luo, W.; Urtasun, R. Deeproadmapper: Extracting road topology from aerial images. In Proceedings of the IEEE International Conference on Computer Vision, Venice, Italy, 22–29 October 2017; pp. 3438–3446. [Google Scholar]
  54. Wang, Z.; Simoncelli, E.P.; Bovik, A.C. Multiscale structural similarity for image quality assessment. In Proceedings of the The Thrity-Seventh Asilomar Conference on Signals, Systems & Computers, Pacific Grove, CA, USA, 9–12 November 2003; Volume 2, pp. 1398–1402. [Google Scholar]
  55. Deng, J.; Dong, W.; Socher, R.; Li, L.J.; Li, K.; Li, F. ImageNet: A large-scale hierarchical image database. In Proceedings of the 2009 IEEE Conference on Computer Vision and Pattern Recognition, Miami, FL, USA, 20–25 June 2009; pp. 248–255. [Google Scholar]
  56. Xiao, J.; Hays, J.; Ehinger, K.A.; Oliva, A.; Torralba, A. Sun database: Large-scale scene recognition from abbey to zoo. In Proceedings of the 2010 IEEE Computer Society Conference on Computer Vision and Pattern Recognition, San Francisco, CA, USA, 13–18 June 2010; pp. 3485–3492. [Google Scholar]
  57. Yan, Q.; Xu, L.; Shi, J.; Jia, J. Hierarchical Saliency Detection. In Proceedings of the 2013 IEEE Conference on Computer Vision and Pattern Recognition, Portland, OR, USA, 23–28 June 2013; pp. 1155–1162. [Google Scholar] [CrossRef] [Green Version]
  58. Fan, D.P.; Cheng, M.M.; Liu, Y.; Li, T.; Borji, A. Structure-measure: A New Way to Evaluate Foreground Maps. In Proceedings of the IEEE International Conference on Computer Vision, Venice, Italy, 22–29 October 2017. [Google Scholar]
  59. Li, G.; Yu, Y. Visual Saliency Based on Multiscale Deep Features. In Proceedings of the IEEE Conference on Computer Vision and Pattern Recognition (CVPR), Boston, MA, USA, 7–12 June 2015; pp. 5455–5463. [Google Scholar]
  60. Shi, J.; Yan, Q.; Xu, L.; Jia, J. Hierarchical Saliency Detection on Extended CSSD. arXiv 2015, arXiv:1408.5418. [Google Scholar] [CrossRef] [PubMed]
  61. Feng, M.; Lu, H.; Ding, E. Attentive Feedback Network for Boundary-aware Salient Object Detection. In Proceedings of the IEEE/CVF Conference on Computer Vision and Pattern Recognition, Long Beach, CA, USA, 15–20 June 2019. [Google Scholar] [CrossRef]
  62. Wu, Z.; Su, L.; Huang, Q. Cascaded Partial Decoder for Fast and Accurate Salient Object Detection. In Proceedings of the IEEE Conference on Computer Vision and Pattern Recognition (CVPR), Long Beach, CA, USA, 15–20 June 2019. [Google Scholar] [CrossRef] [Green Version]
  63. Hou, Q.; Cheng, M.M.; Hu, X.; Borji, A.; Tu, Z.; Torr, P.H.S. Deeply Supervised Salient Object Detection with Short Connections. IEEE Trans. Pattern Anal. Mach. Intell. 2019, 41, 815–828. [Google Scholar] [CrossRef] [PubMed] [Green Version]
  64. Wu, R.; Feng, M.; Guan, W.; Wang, D.; Lu, H.; Ding, E. A Mutual Learning Method for Salient Object Detection With Intertwined Multi-Supervision. In Proceedings of the 2019 IEEE/CVF Conference on Computer Vision and Pattern Recognition (CVPR), Long Beach, CA, USA, 15–20 June 2019; pp. 8142–8151. [Google Scholar] [CrossRef]
  65. Zeng, Y.; Zhuge, Y.; Lu, H.; Zhang, L.; Qian, M.; Yu, Y. Multi-source weak supervision for saliency detection. In Proceedings of the IEEE/CVF Conference on Computer Vision and Pattern Recognition, Long Beach, CA, USA, 15–20 June 2019. [Google Scholar]
  66. Liu, J.J.; Hou, Q.; Cheng, M.M.; Feng, J.; Jiang, J. A Simple Pooling-Based Design for Real-Time Salient Object Detection. In Proceedings of the IEEE/CVF Conference on Computer Vision and Pattern Recognition, Long Beach, CA, USA, 15–20 June 2019. [Google Scholar] [CrossRef] [Green Version]
  67. Wang, W.; Zhao, S.; Shen, J.; Hoi, S.C.; Borji, A. Salient object detection with pyramid attention and salient edges. In Proceedings of the IEEE/CVF Conference on Computer Vision and Pattern Recognition, Long Beach, CA, USA, 15–20 June 2019; pp. 1448–1457. [Google Scholar] [CrossRef]
Figure 1. Overall framework for the proposed Revise-Net model consisting of two cascaded encoder–decoder modules. The first module is a U-Net-like architecture with residual blocks in the encoding and decoding layers. The second module is the REM to fine-tune the output predicted map. Finally, the RAM modules are cascaded between the two networks for revising the final saliency map.
Remotesensing 13 04941 g001
Figure 2. Workflow of the REM taking three inputs: (i) the intermediate enhanced map form the decoding layers of the REM S i + 1 , (ii) encoded feature map of the first convolution F i , and (iii) input feature map from the from skip connections F i 1 . The feature maps, F i and F i 1 from the skip connections of PM are concatenated together to undergo a series of convolutions. The output thus obtained is multiplied with the additive inverse of S i + 1 . The final reverse attention map R i is generated on balancing the number of channels by 1 × 1 convolution.
Remotesensing 13 04941 g002
Figure 3. Precision-recall curves generated by the proposed Revise-Net model on DUTS-TE, HKU-IS, and ECSSD datasets.
Remotesensing 13 04941 g003
Figure 4. Visual comparison of segmentation results obtained by the proposed Revise-Net model with several state-of-the-art baselines.
Remotesensing 13 04941 g004
Figure 5. Illustration of misclassification of the salient class in an image by the proposed Revise-Net.
Remotesensing 13 04941 g005
Table 2. Ablation studies conducted by taking various combination of modules and losses to investigate the utility of each component of the proposed Revise-Net model.
AblationArrangementF-MeasureMAE
Architecture
(Using BCE Loss)
U-Net0.8960.066
En-De0.9290.047
En-De + Sup0.9340.040
En-RA-De + Sup0.9380.039
En-De + Sup + REM0.9370.042
En-RA-De + Sup + REM (Proposed)0.9400.041
Objective functionSSIM Loss0.9240.042
IOU Loss0.9330.039
BCE + SSIM Loss0.9400.040
BCE + IOU Loss0.9400.038
BCE + SSIM + IOU Loss (Proposed)0.9470.036
Publisher’s Note: MDPI stays neutral with regard to jurisdictional claims in published maps and institutional affiliations.

