

SIVED: A SAR Image Dataset for Vehicle Detection Based on Rotatable Bounding Box

1
Key Laboratory of Digital Earth Science, Aerospace Information Research Institute, Chinese Academy of Sciences, Beijing 100094, China
2
International Research Center of Big Data for Sustainable Development Goals, Beijing 100094, China
3
College of Resources and Environment, University of Chinese Academy of Sciences, Beijing 100049, China
4
School of Computer and Information Engineering, Heilongjiang University of Science and Technology, Harbin 150022, China
*
Author to whom correspondence should be addressed.
Remote Sens. 2023, 15(11), 2825; https://0-doi-org.brum.beds.ac.uk/10.3390/rs15112825
Submission received: 6 March 2023
/
Revised: 19 May 2023
/
Accepted: 26 May 2023
/
Published: 29 May 2023
(This article belongs to the Special Issue Artificial Intelligence-Driven Methods for Remote Sensing Target and Object Detection)
Abstract
:The research and development of deep learning methods are heavily reliant on large datasets, and there is currently a lack of scene-rich datasets for synthetic aperture radar (SAR) image vehicle detection. To address this issue and promote the development of SAR vehicle detection algorithms, we constructed the SAR Image dataset for VEhicle Detection (SIVED) using Ka, Ku, and X bands of data. Rotatable bounding box annotations were employed to improve positioning accuracy, and an algorithm for automatic annotation was proposed to improve efficiency. The dataset exhibits three crucial properties: richness, stability, and challenge. It comprises 1044 chips and 12,013 vehicle instances, most of which are situated in complex backgrounds. To construct a baseline, eight detection algorithms are evaluated on SIVED. The experimental results show that all detectors achieved high mean average precision (mAP) on the test set, highlighting the dataset’s stability. However, there is still room for improvement in the accuracy with respect to the complexity of the background. In summary, SIVED fills the gap in SAR image vehicle detection datasets and demonstrates good adaptability for the development of deep learning algorithms.
1. Introduction
The synthetic aperture radar (SAR), as an active sensor, has the capability of all-day, all-weather imaging. Due to the long wavelength of emitted electromagnetic waves, SAR can effectively identify camouflage and penetrate masked objects. Hence, with increasing resolution, SAR can acquire high-quality images and is being widely used in target surveillance and reconnaissance. The appearance features of a target are varied and influenced by its near environments. How to detect, i.e., find and locate, the target in a complex background has been an important research direction for SAR image applications. Vehicles, as a common type of land transportation, have gradually become increasingly a point of focus for researchers.
The most commonly used traditional SAR target detection method is the Constant False Alarm Rate (CFAR) algorithm, a typical detection operator based on statistical characteristics. Nevertheless, this method has a drawback in that it necessitates the manual definition of the background clutter distribution and guarding area, which ultimately leads to detection outcomes being influenced by complex scenarios and human factors.
However, deep networks have a remarkable feature abstraction ability and can automatically perform target detection in complex backgrounds. Due to their powerful performance, deep networks are at present widely used for SAR object detection, and many researchers have designed different networks or improved on existing detection networks. For SAR ship detection, Jiao et al. [1] proposed a multi-scale neural network based on Faster R-CNN for densely connected convolutional network layers to solve the multi-scale and multi-scene SAR ship detection problem. Cui et al. [2] proposed a ship detection method based on Dense Attention Pyramid Network, which also adds attention modules to the convolutional network layer and connects them for multi-scale ship detection. Zhang et al. [3] proposed a novel balance learning network (BL-Net) to solve four imbalance problems in SAR ship detection. They also carried out work on high-speed SAR ship detection [4,5,6]. In addition, researchers have used a rotatable bounding box-based detection network [7,8,9,10] to cope with dense scenes, thus further improving localization accuracy. For SAR airplane detection, He et al. [11] proposed a component-based multi-layer parallel network to solve the sparsity and diversity problems that arise from the SAR scattering mechanism. Wang et al. [12] proposed a new fast detection framework, named the Efficient Weighted Feature Fusion and Attention Network (EWFAN), which conducts the automatic and rapid detection of aircrafts with high accuracy. Moreover, many researchers [13,14,15] have carried out work related to SAR aircraft detection. Other types of SAR object detection include oil-tank detection [16,17] and video SAR shadow detection [18], to name but a few.
Since the deep network is a data-driven approach, a considerable amount of input samples are required as training data to achieve a better performance. Therefore, corresponding datasets must be created for network training purposes. Over the past few years, the reason for the more rapid development of SAR ship detection is the richness of the SAR ship dataset [19,20,21,22,23]. However, the only public dataset containing vehicle targets is Moving and Stationary Target Acquisition and Recognition (MSTAR) [24], which comprises a series of military vehicle chips and clutter images and was originally intended for classification studies. In recent years, some researchers have carried out detection work using MSTAR. For example, Long et al. [25] proposed a simple rotated detection model on the dataset, where the vehicles were embedded into the clutter images for detection experiments. Zhang et al. [26] selected eight types of vehicle chips and integrated them into the background images to construct the SAR_OD dataset first and then utilized data enhancement to improve detection accuracy. Sun et al. [27] constructed a small dataset called LGSVOD by manually labeling three target classes, and proposed an improved YOLOv5 network for detection. As mentioned above, the studies all embedded vehicle targets into the clutter images for detection. In this case, although there are many vehicle categories in the MSTAR dataset, the background is homogeneous, and the distribution of vehicles is ideal and not sufficiently dense. Therefore, for civilian vehicle detection in urban-area scenes, some researchers have used MiniSAR images [28] or FARAD images [28], which are publicly available at Sandia National Laboratories (USA). Wang et al. [29] took MiniSAR images as the basis, added MSTAR data as an expansion to form a detection dataset, and used transfer learning based on the Single Shot MultiBox Detector (SSD). Zou et al. [30] proposed a SCEDet network on a band of FARAD images, and the produced dataset contained 1661 vehicles for experimental validation. Tang et al. [31] employed a CFAR-guided SSD algorithm using five MiniSAR images for experimental validation. As mentioned, in the above studies, only a portion of those images were selected for experiments, and the corresponding data were not fully explored and required a unified evaluation metric.
In this paper, we construct a SAR Image dataset for VEhicle Detection based on a rotatable bounding box named SIVED, which collects data in the X, Ku, and Ka bands from MSTAR, MiniSAR, and FARAD. The imaging areas of MiniSAR and FARAD are mainly concentrated in urban areas with complex backgrounds composed of trees, buildings, roads, and clutter. SIVED contains more than 270 dense scene chips. The rotatable bounding boxes are adopted to avoid information redundancy and reduce interference from the background and adjacent targets in dense scenes. This is also convenient for orientation estimations and aspect ratio calculations. The creation of SIVED consists of three main steps. The first step involves data preprocessing, including the removal of scenes without targets. Then, an automatic annotation algorithm based on CFAR and YOLOv5 is proposed to establish semi-automatic annotation. Finally, chips and annotation files are automatically organized to build the dataset. After construction, a complete analysis is performed for the dataset characteristics, eight rotated detection algorithms are selected to verify the stability of and challenge the dataset, and the corresponding baseline is built for the reference of relevant researchers.
The main contributions of this paper are as follows.
- Using publicly available high-resolution SAR data that includes vehicle targets, we construct the first SAR image dataset in three bands for vehicle detection. The rotatable bounding box annotation is adapted to reduce redundant background clutter and accurately position targets in dense scenes. This dataset can advance vehicle detection development and facilitate vehicle monitoring in complex terrestrial environments.
- An algorithm, combined with a detection network, is proposed for the annotation of MSTAR data to increase annotation efficiency. The annotated files contain enriched information, expanding the potential for various applications.
- Experiments are conducted using eight state-of-the-art rotated detection algorithms, which establish a relevant baseline to evaluate this dataset. The experimental results confirm the dataset’s stability and the adaptability of the current algorithms to vehicle targets.
The rest of this paper is organized as follows. Section 2 presents the basic information about SIVED. Section 3 describes the construction of SIVED. In Section 4 is an analysis of the characteristics of SIVED. Section 5 introduces the architectures of the selected eight rotated detection algorithms. Presented in Section 6 are experiments conducted based on SIVED toward establishing a baseline to analyze the dataset characteristics. Section 7 provides a detailed discussion of the dataset based on the experimental results from the eight algorithms. Finally, the conclusions and outlook are given in Section 8.
2. Basic Information about SIVED
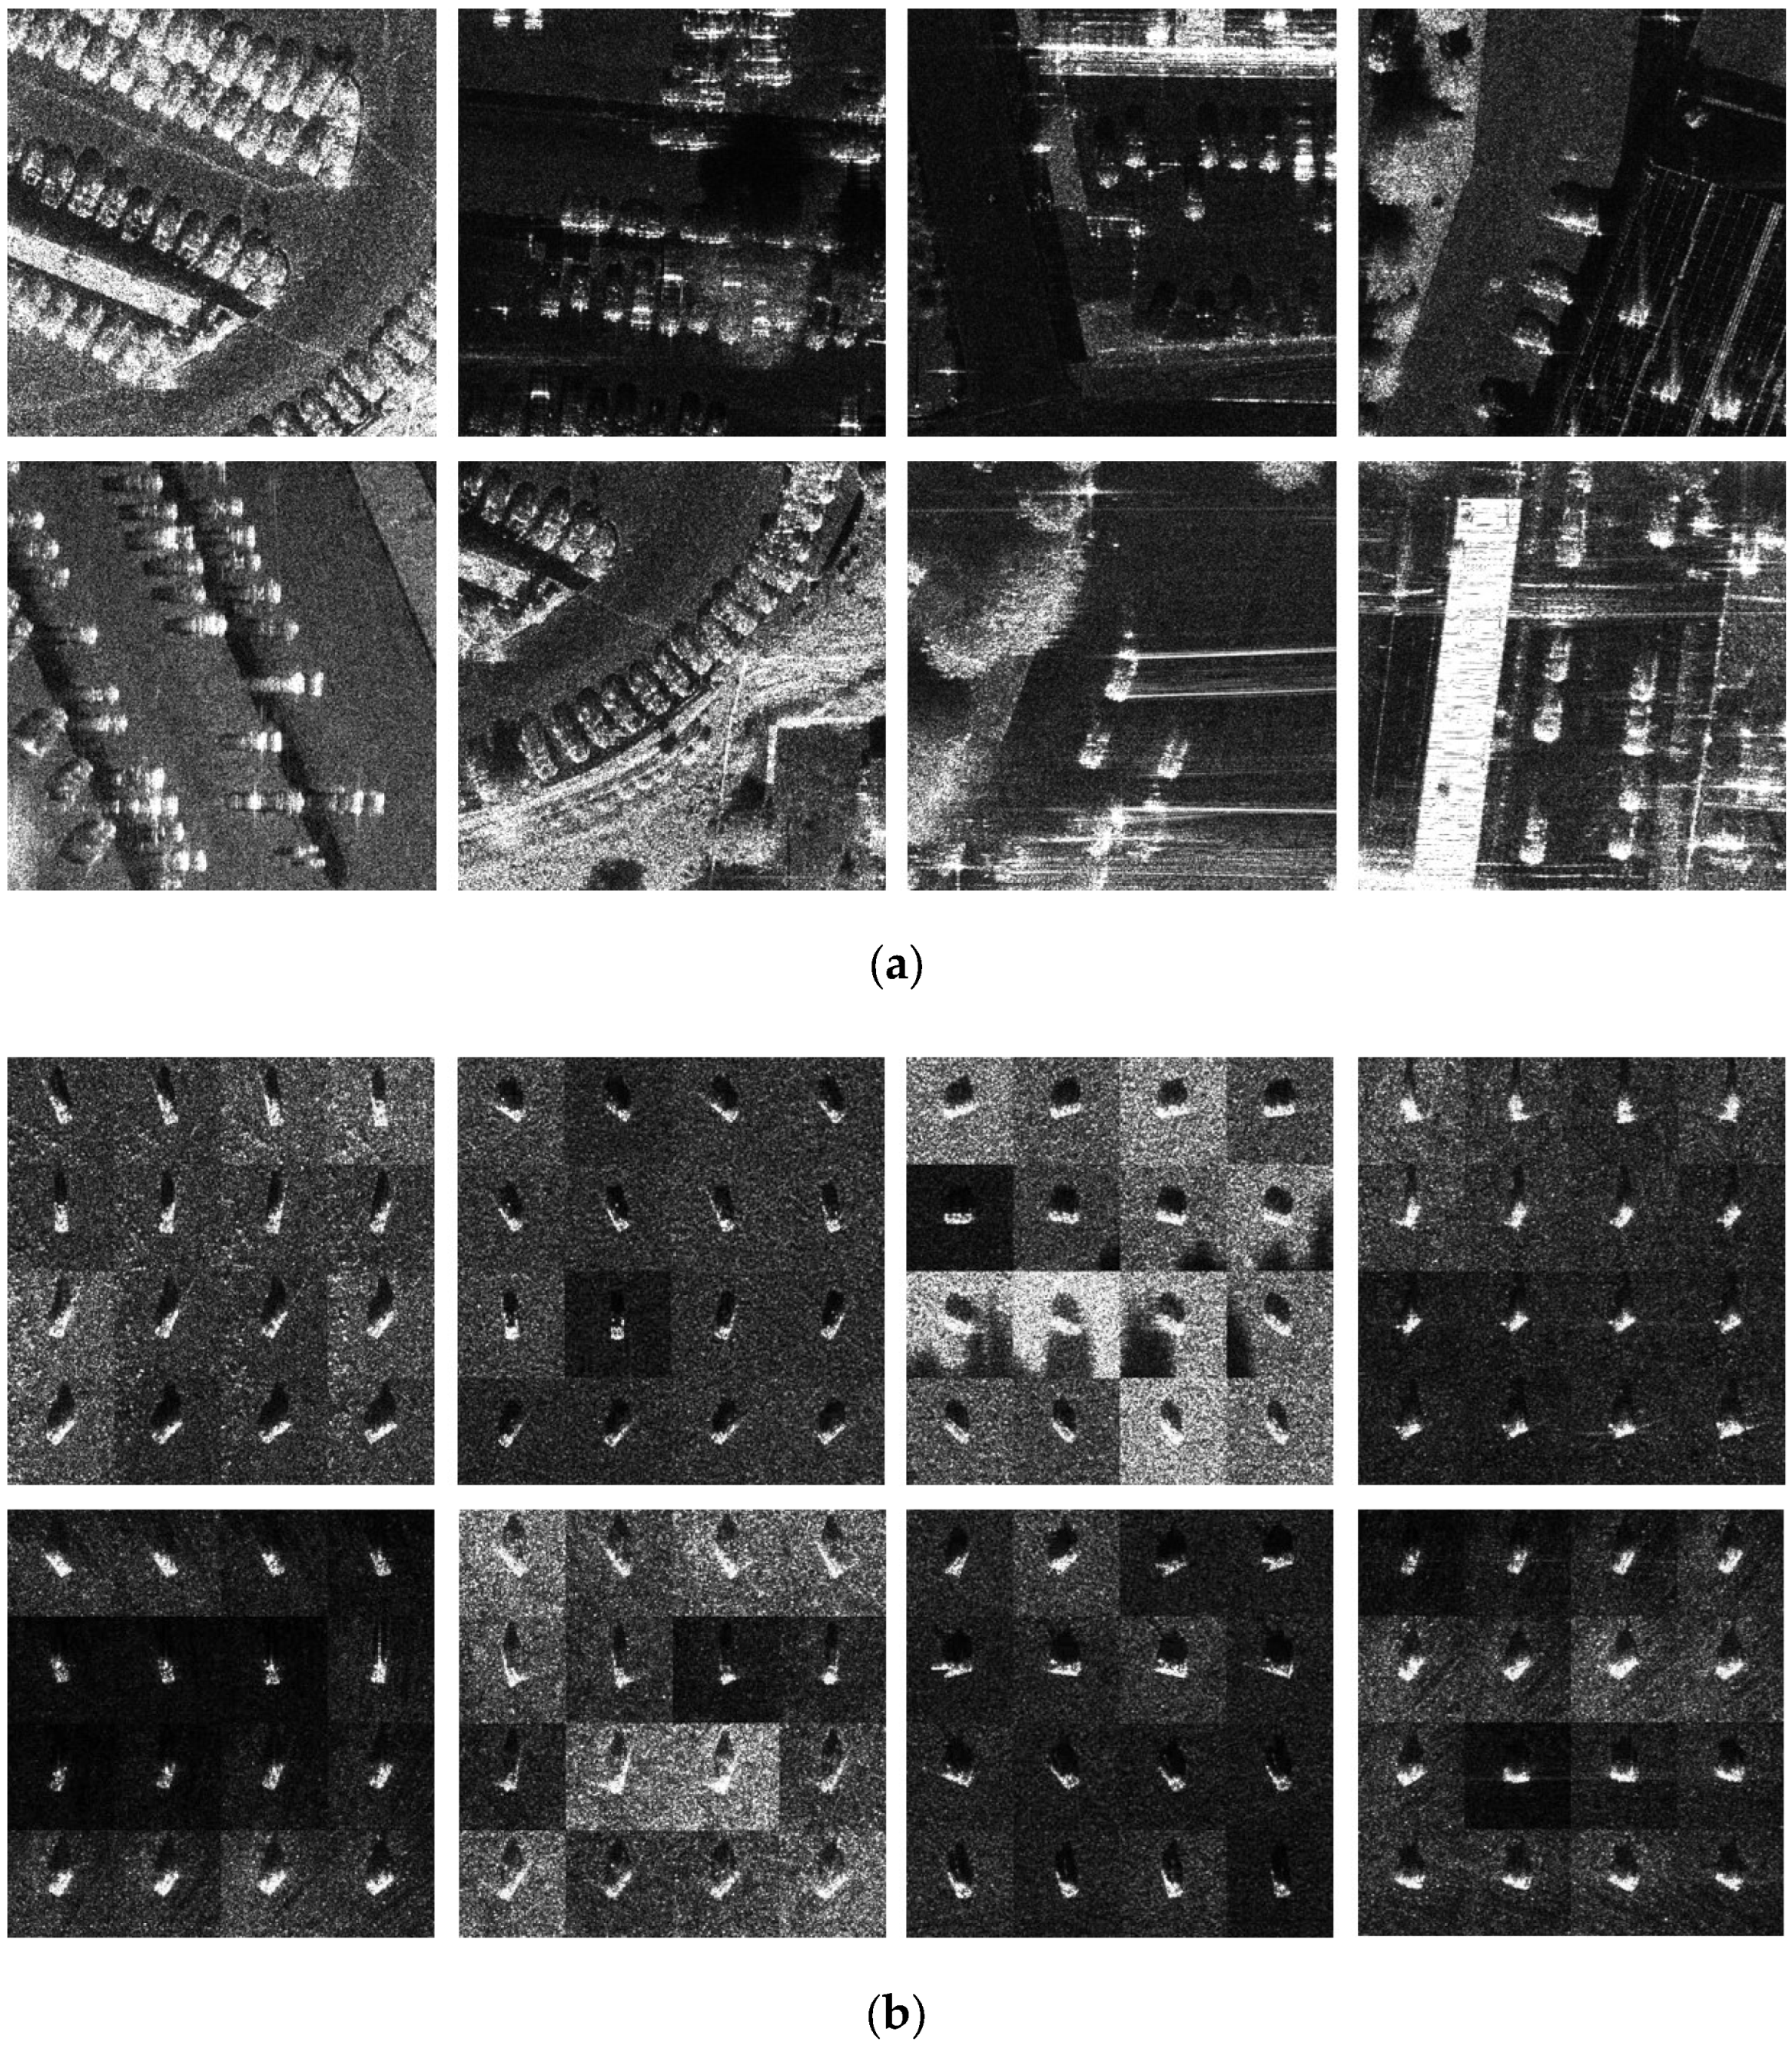
The previously mentioned open data MSTAR (X-band), MiniSAR (Ku-band) [28], and FARAD (Ka and X-bands) [28] are used to construct the dataset; the basic information of the above open data is shown in Table 1. For MSTAR, 5168 vehicle chips at 17° and 15° depression angles are selected. SIVED consists of a training, test, and validation set, and the chip size is set to 512 × 512. The statistics for the number of chips and the number of targets are shown in Table 2. Chips for vehicles located in urban areas are selected for display in Figure 1a, and the scenes contain parking lots, buildings, tree coverings, both sides of roads, etc. Since the original MSTAR chip size is 128 × 128, the chips are stitched in groups of 16 (4 × 4) to form slices of corresponding settings, as shown in Figure 1b.
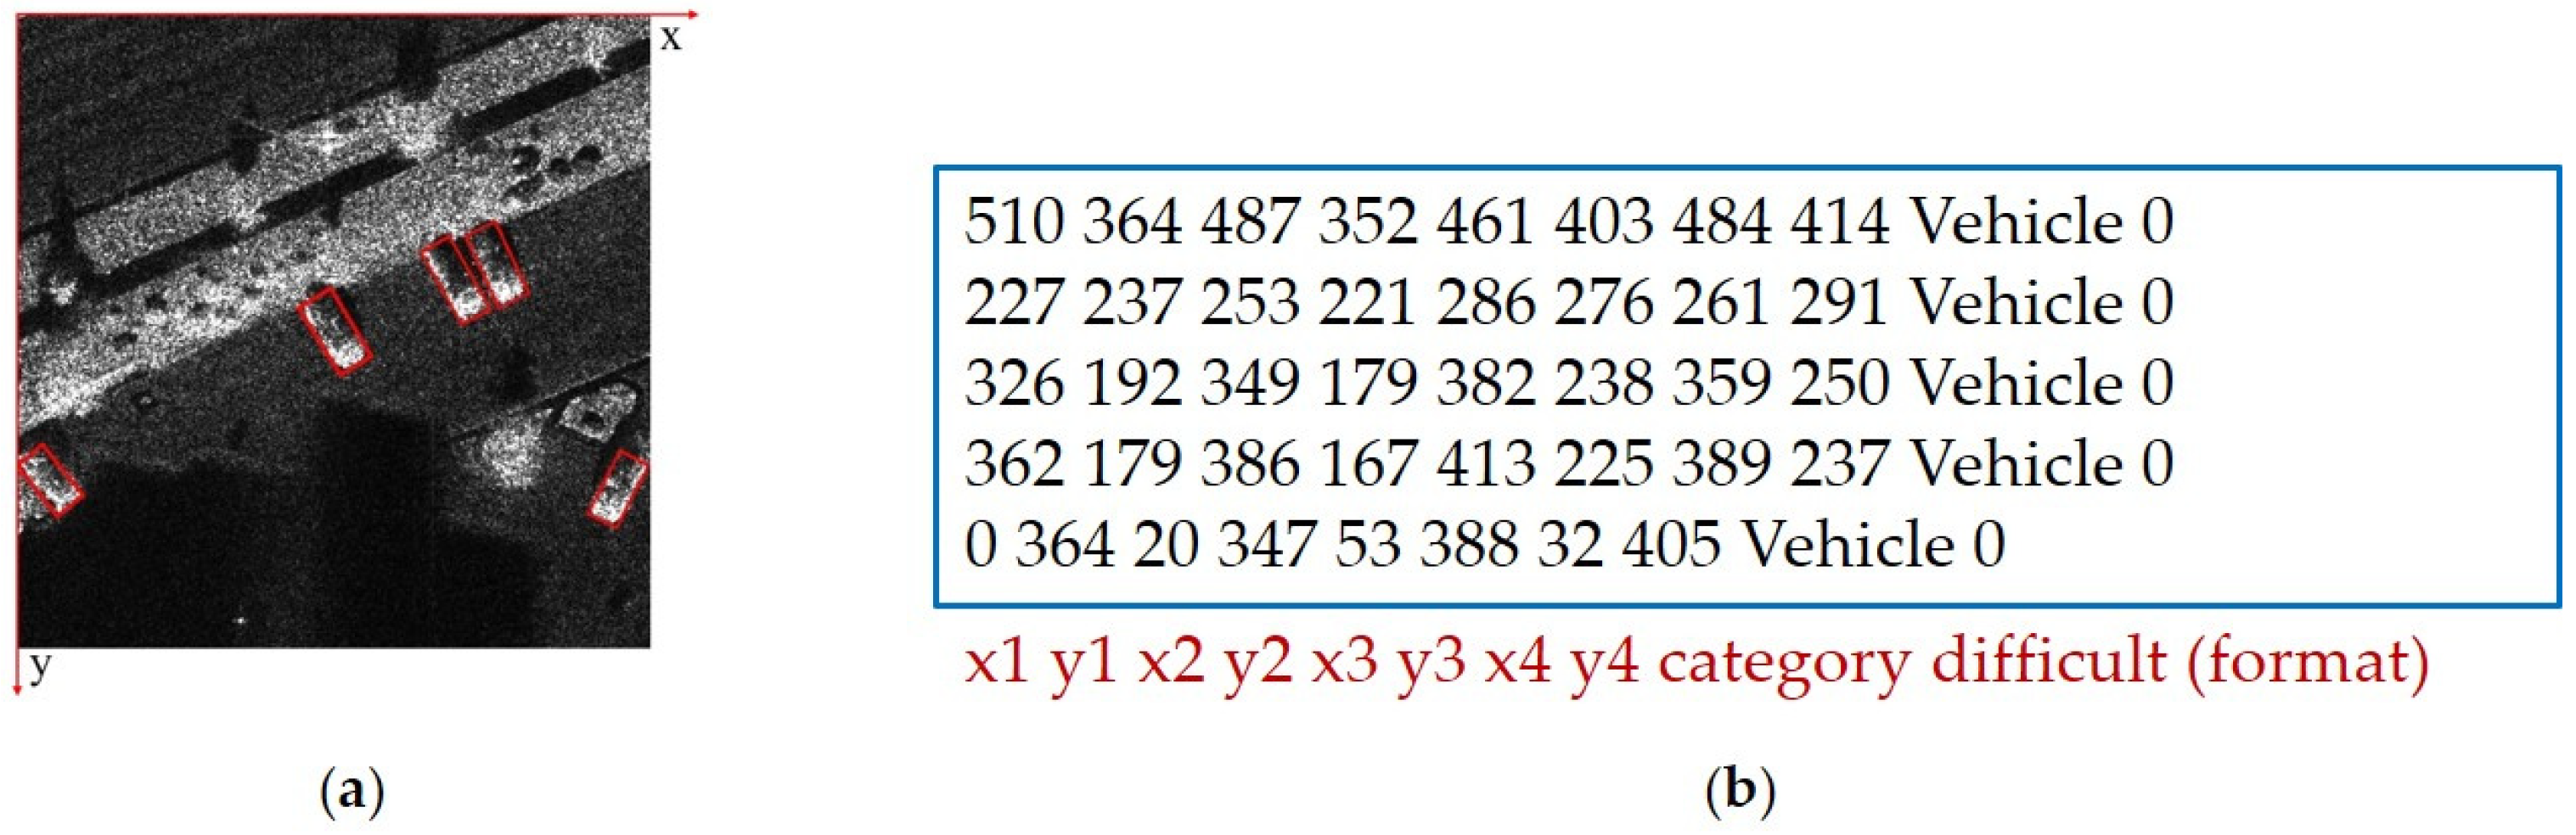
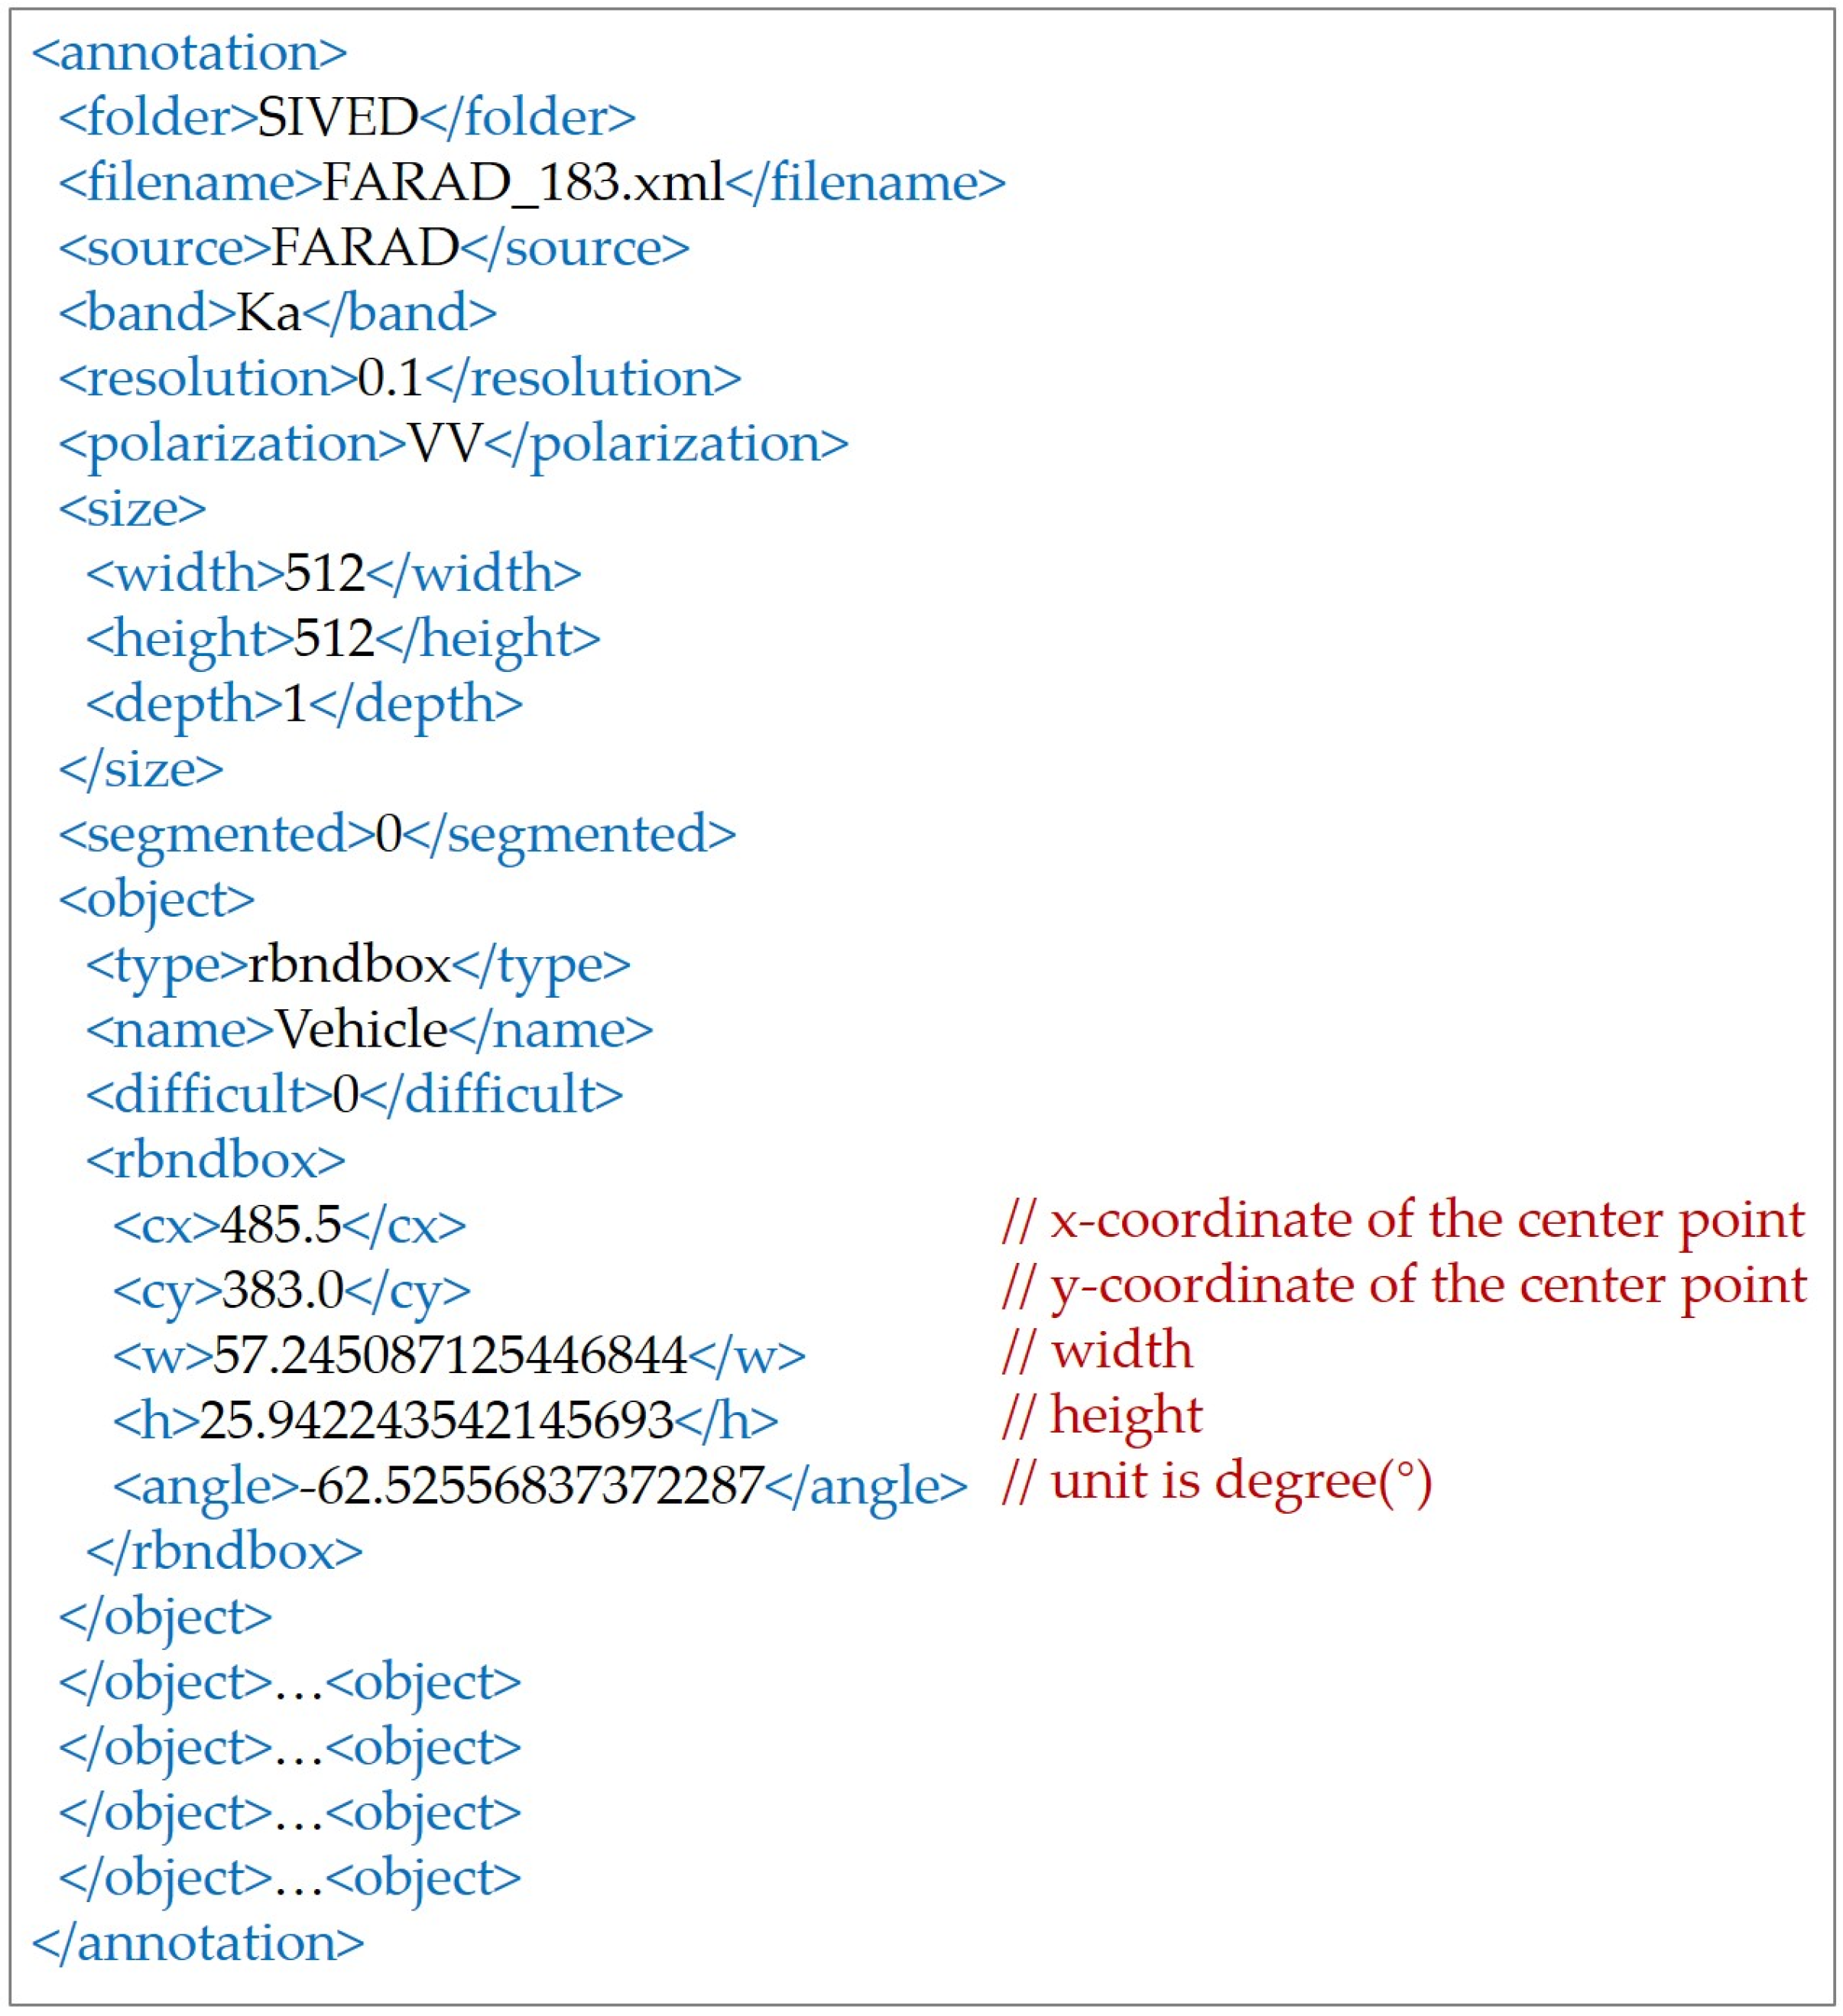
SIVED is annotated with rotatable bounding boxes; one of the chips is annotated with bounding boxes as shown in Figure 2a. The row direction of the image matrix is defined as the y-axis, the column direction is defined as the x-axis, and the coordinates follow the form of (x, y) as recorded. Meanwhile, two formats of annotation files are provided. One format is derived from the DOTA [32] annotation format, using TXT files to record the annotation information of each chip, which is characterized by conciseness and clarity as well as the possibility of being directly applied to most rotated detection networks. The corresponding file format is shown in Figure 2b, where the corner coordinates are arranged clockwise. It should be mentioned that the difficulty indicates whether the labeled target is a detection difficulty instance (0 means no difficulty, and 1 means difficulty). Another from the PASCAL VOC [33] annotation format, using XML files, is employed to record the detailed information of each chip, including source data, band, resolution, polarization mode, target azimuth, etc., which is convenient for researchers to exploit these for further research; the annotation file is shown in Figure 3.
3. Dataset Construction
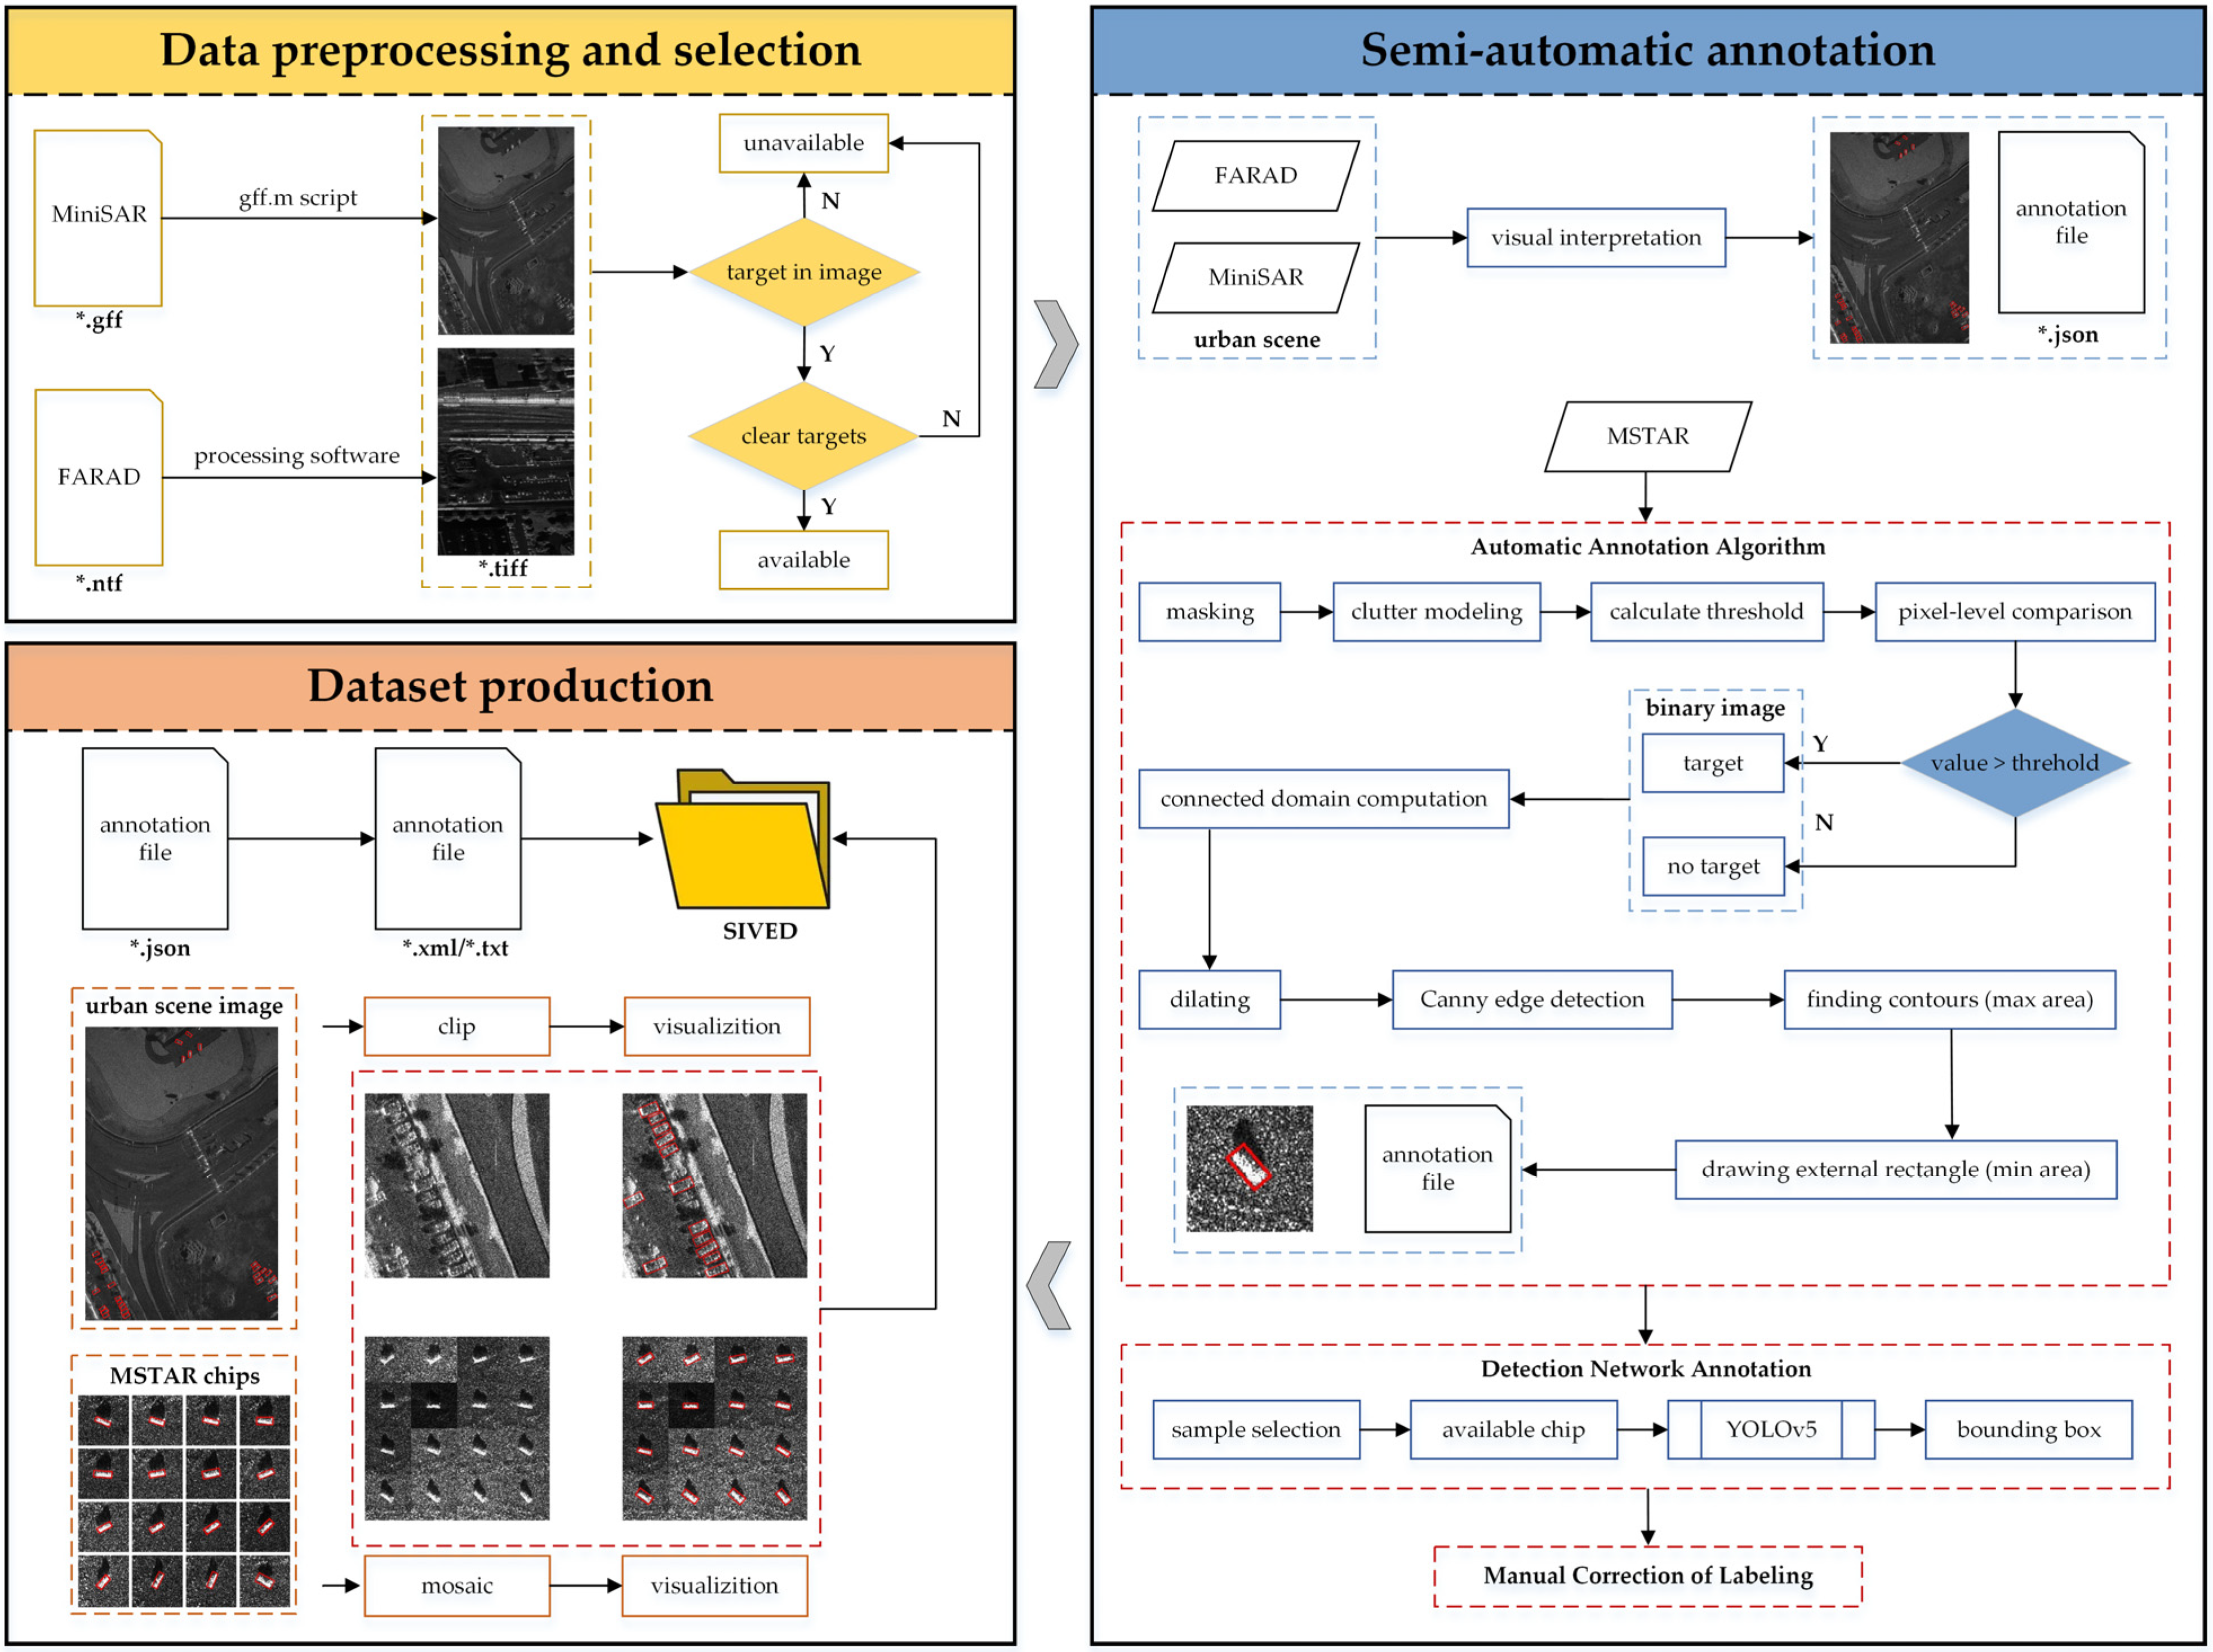
This section explains the details of the dataset construction process, as shown in Figure 4. It consists of three main steps: data preprocessing and selection, semi-automatic annotation, and dataset production. The critical step is semi-automatic annotation, designed with a CFAR operator and neural network.
3.1. Data Preprocessing and Selection
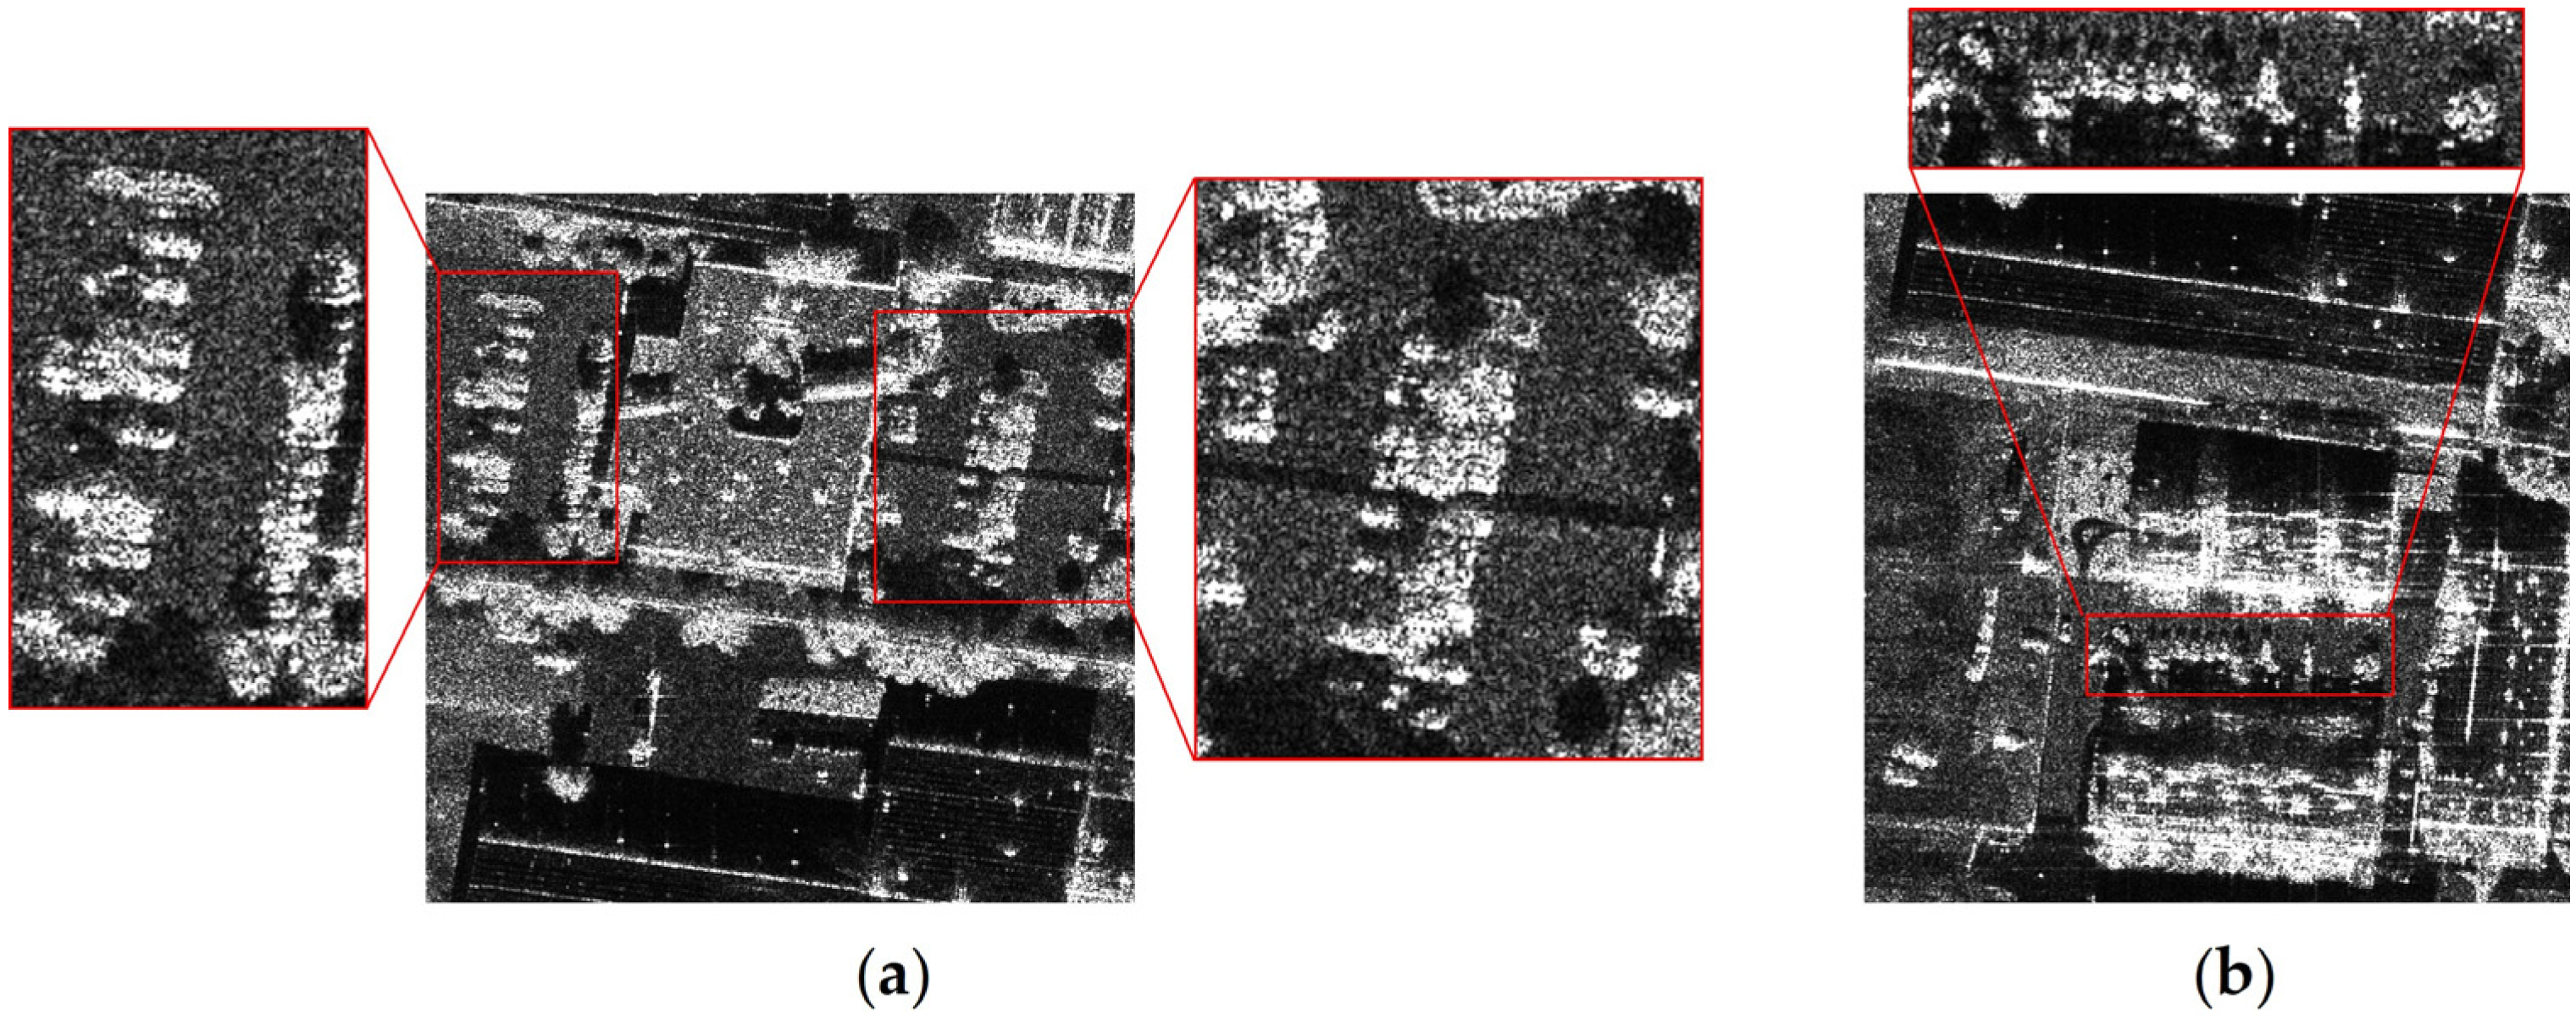
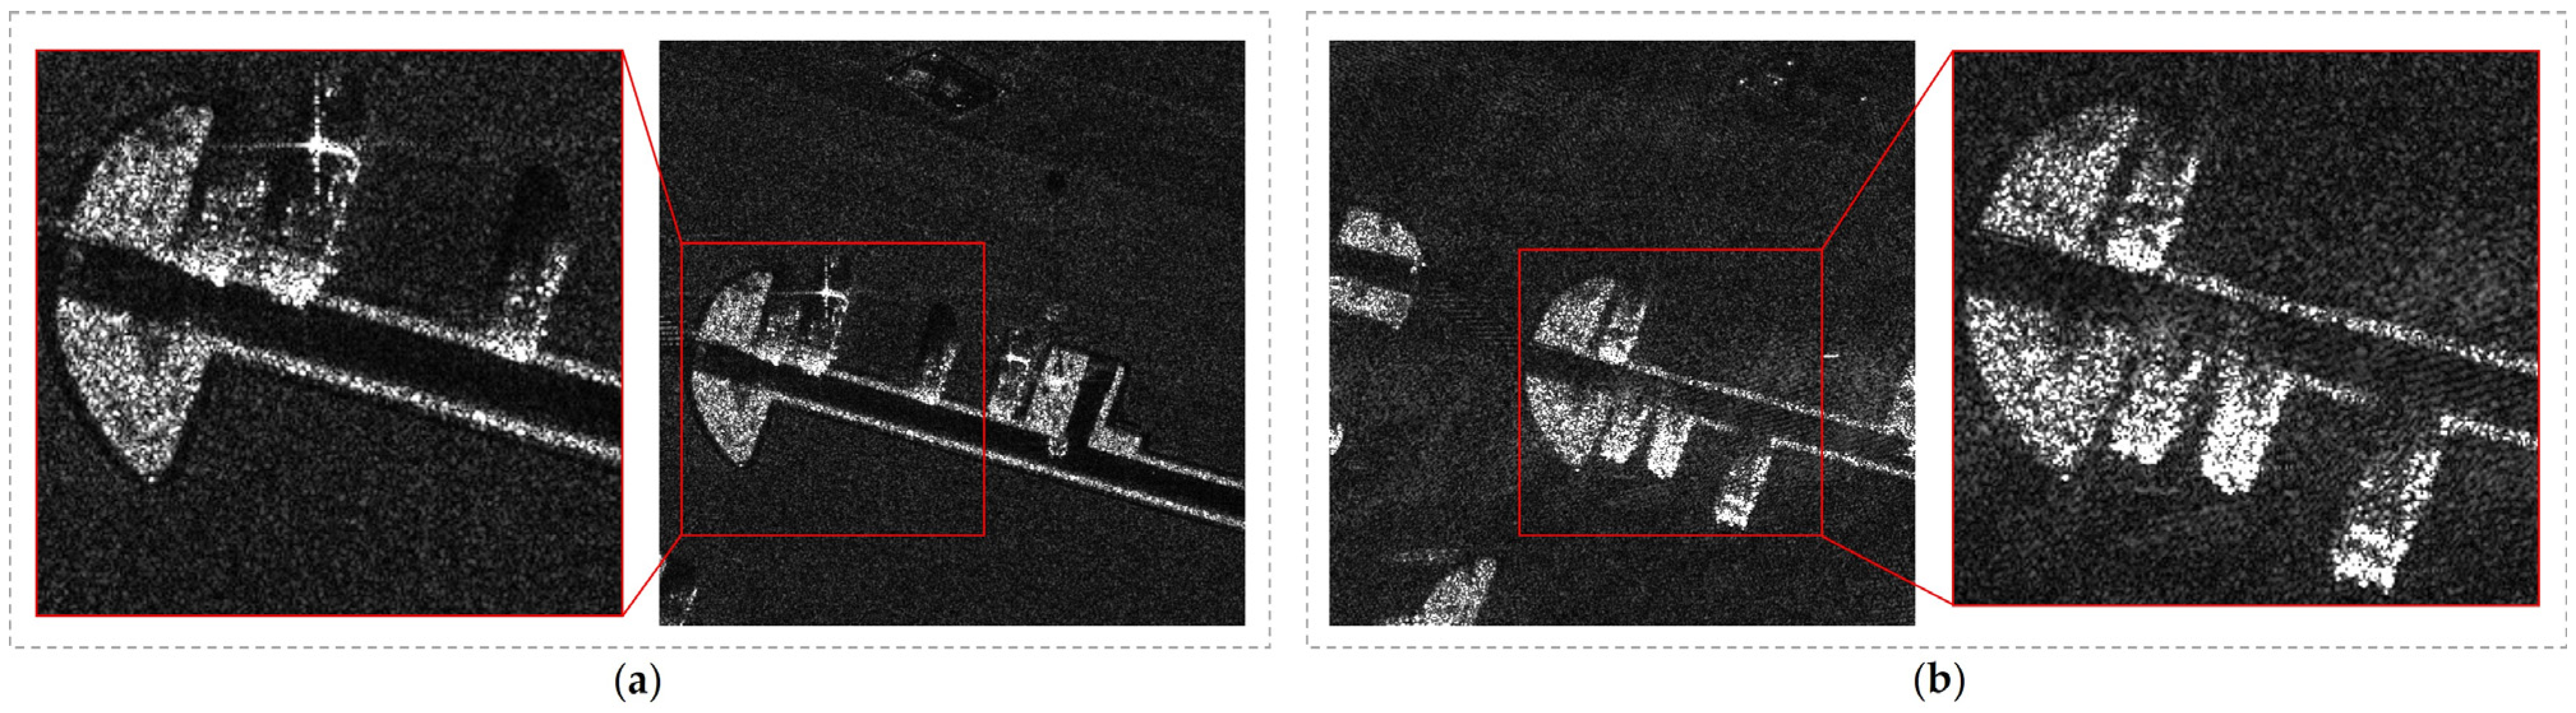
The public dataset comprises 351 FARAD-Ka images, 61 FARAD-X images, and 20 MiniSAR images, all of which were converted into TIFF files using the officially provided script files. Upon visual interpretation, it was discovered that specific images did not contain vehicles, while others had reduced resolution due to sampling issues, rendering vehicle extraction ineffective. This situation is demonstrated in Figure 5. Ultimately, a total of 17 MiniSAR images, 53 FARAD-Ka images, and 13 FARAD-X images were selected as annotated images.
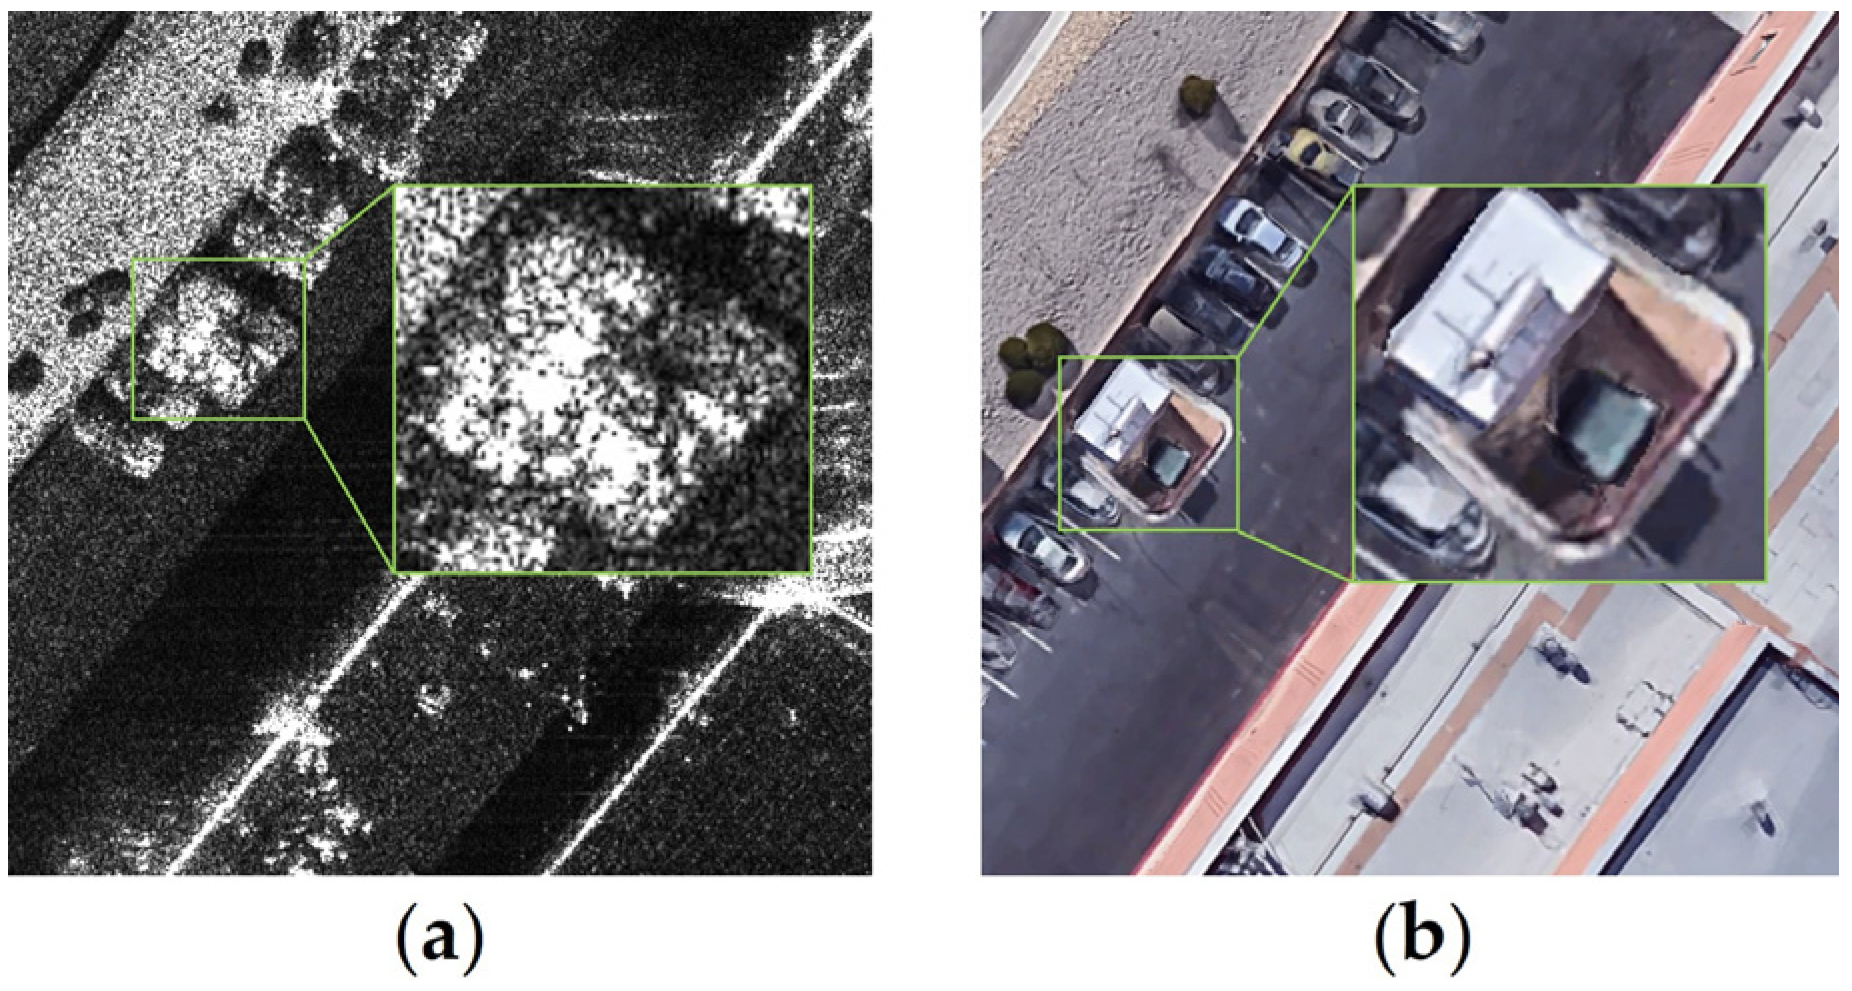
Before the annotation process, special cases need to be described. In urban scene images, there are usually small buildings that match the size of vehicles and show strong scattering features. They are easily confused, but the geographic location does not change, so we used Google Earth to compare and identify them. The corresponding example is shown in Figure 6.
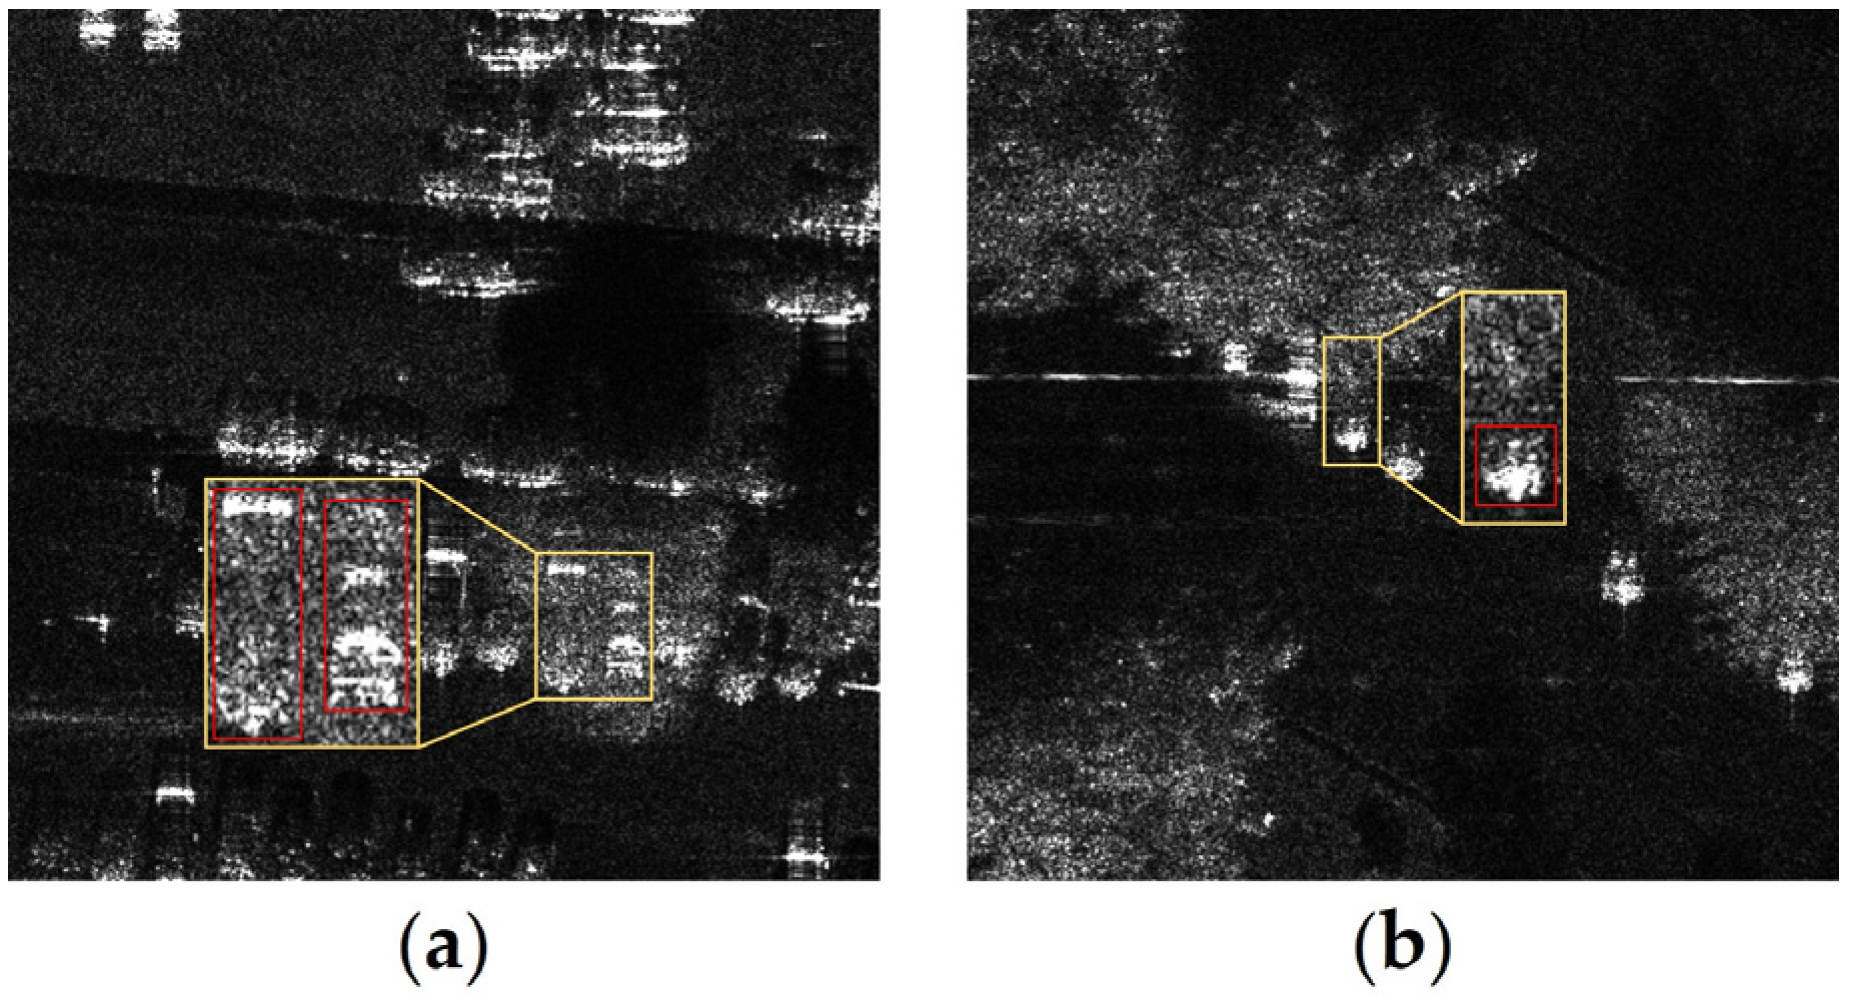
Meanwhile, there will be regions where trees and vehicle targets overlap each other, which can be divided into two cases: the target is obscured by trees but exhibits strong scattering properties and contains the combined scattering information of vehicles and trees, as shown in Figure 7a; the target is partially obscured by trees, and the obscured part is entirely invisible, as shown in Figure 7b. In the first case, the target is labeled according to the complete profile, and in the second case, only the visible part of the target is marked.
3.2. Semi-Automatic Annotation of SIVED
The vehicle targets in urban scenes are manually annotated by visual interpretation. For the vehicles in MSTAR, semi-automatic annotation is used; the specific process is shown in Figure 4, including the automatic annotation algorithm, detection network annotation, and manual correction. The details of each step are as follows.
- 1.
- Algorithm Automatic Annotation: In this paper, an automatic annotation algorithm is designed for MSTAR; the input is the MSTAR chips, and the output is the visual annotation box and the coordinate values of the four corner points. After the chip is input, a 30 × 30 area in the center is first selected for masking. The main purpose is to roughly mask the target area to prevent pixel leakage, which affects the clutter distribution estimation. The second step for clutter estimation is to select the Rayleigh distribution [34], whose probability density function (PDF) is described as follows:where denotes the pixel values that the range is defined as [0, 255], and denotes the variance of the pixel values in the estimated region.
In the third step, given the false alarm rate , according to PDF and to calculate the threshold , the relationship between and as follows:
In the fourth step, a pixel-by-pixel comparison is performed; those larger than the threshold are determined as target pixels for forming a binary image. In the fifth step, the connected domain is calculated for the binary image, the one with the largest area will be extracted as the target, and the target is then expanded to make the target structure more complete. In the sixth step, Canny edge detection [35] is performed; next, the edges are extracted, and the contour containing the largest area is then found, and the minimum external moments are drawn. Finally, the coordinates are output.
- 2.
- Detection Network Annotation: The previous step automatically outputs 5168 annotation boxes for all chips. Next, a total of 2893 chips, about 56% of the total number of chips, are confirmed by visual interpretation, and the position of its annotation boxes are accurate. Then, these chips form a sample set that is fed into the rotated YOLOv5 network for precise detection. Finally, with a total of 50 epochs trained and the weights retained, the remaining 2275 chips are fed into the trained network, and the coordinates of the detection boxes are output.
- 3.
- Manual Correction of Labeling: Eventually, 162 detected boxes are offset, accounting for about 7% of the network output chips. They only contain part of the target or contain more non-target pixels and are corrected by manual labeling. Finally, MSTAR data annotation is complete.
Compared with manual labeling, the proposed semi-automatic annotation algorithm improves efficiency and saves on labor cost. Ultimately, the manually modified chips account for about 3% of the total, significantly reducing the workload and labeling time.
3.3. Dataset Production
If the pixel area of the vehicle in the chips is larger than 80% of the original pixel area during the crop, it is labeled as a positive sample, which means a sample that is retained in the chip. The pixel values are converted to 8-bit integer data, and the annotation information is output to DOTA format and PASCAL VOC format as TXT files and XML files, respectively. For MSTAR chips, the stitching operation is performed, and the annotation files are integrated to add offsets to the coordinates of each target. Next is visualization of the annotation boxes. Finally, all chips are divided into the training, test, and validation sets according to the ratio of 8:1:1.
3.4. File Structure
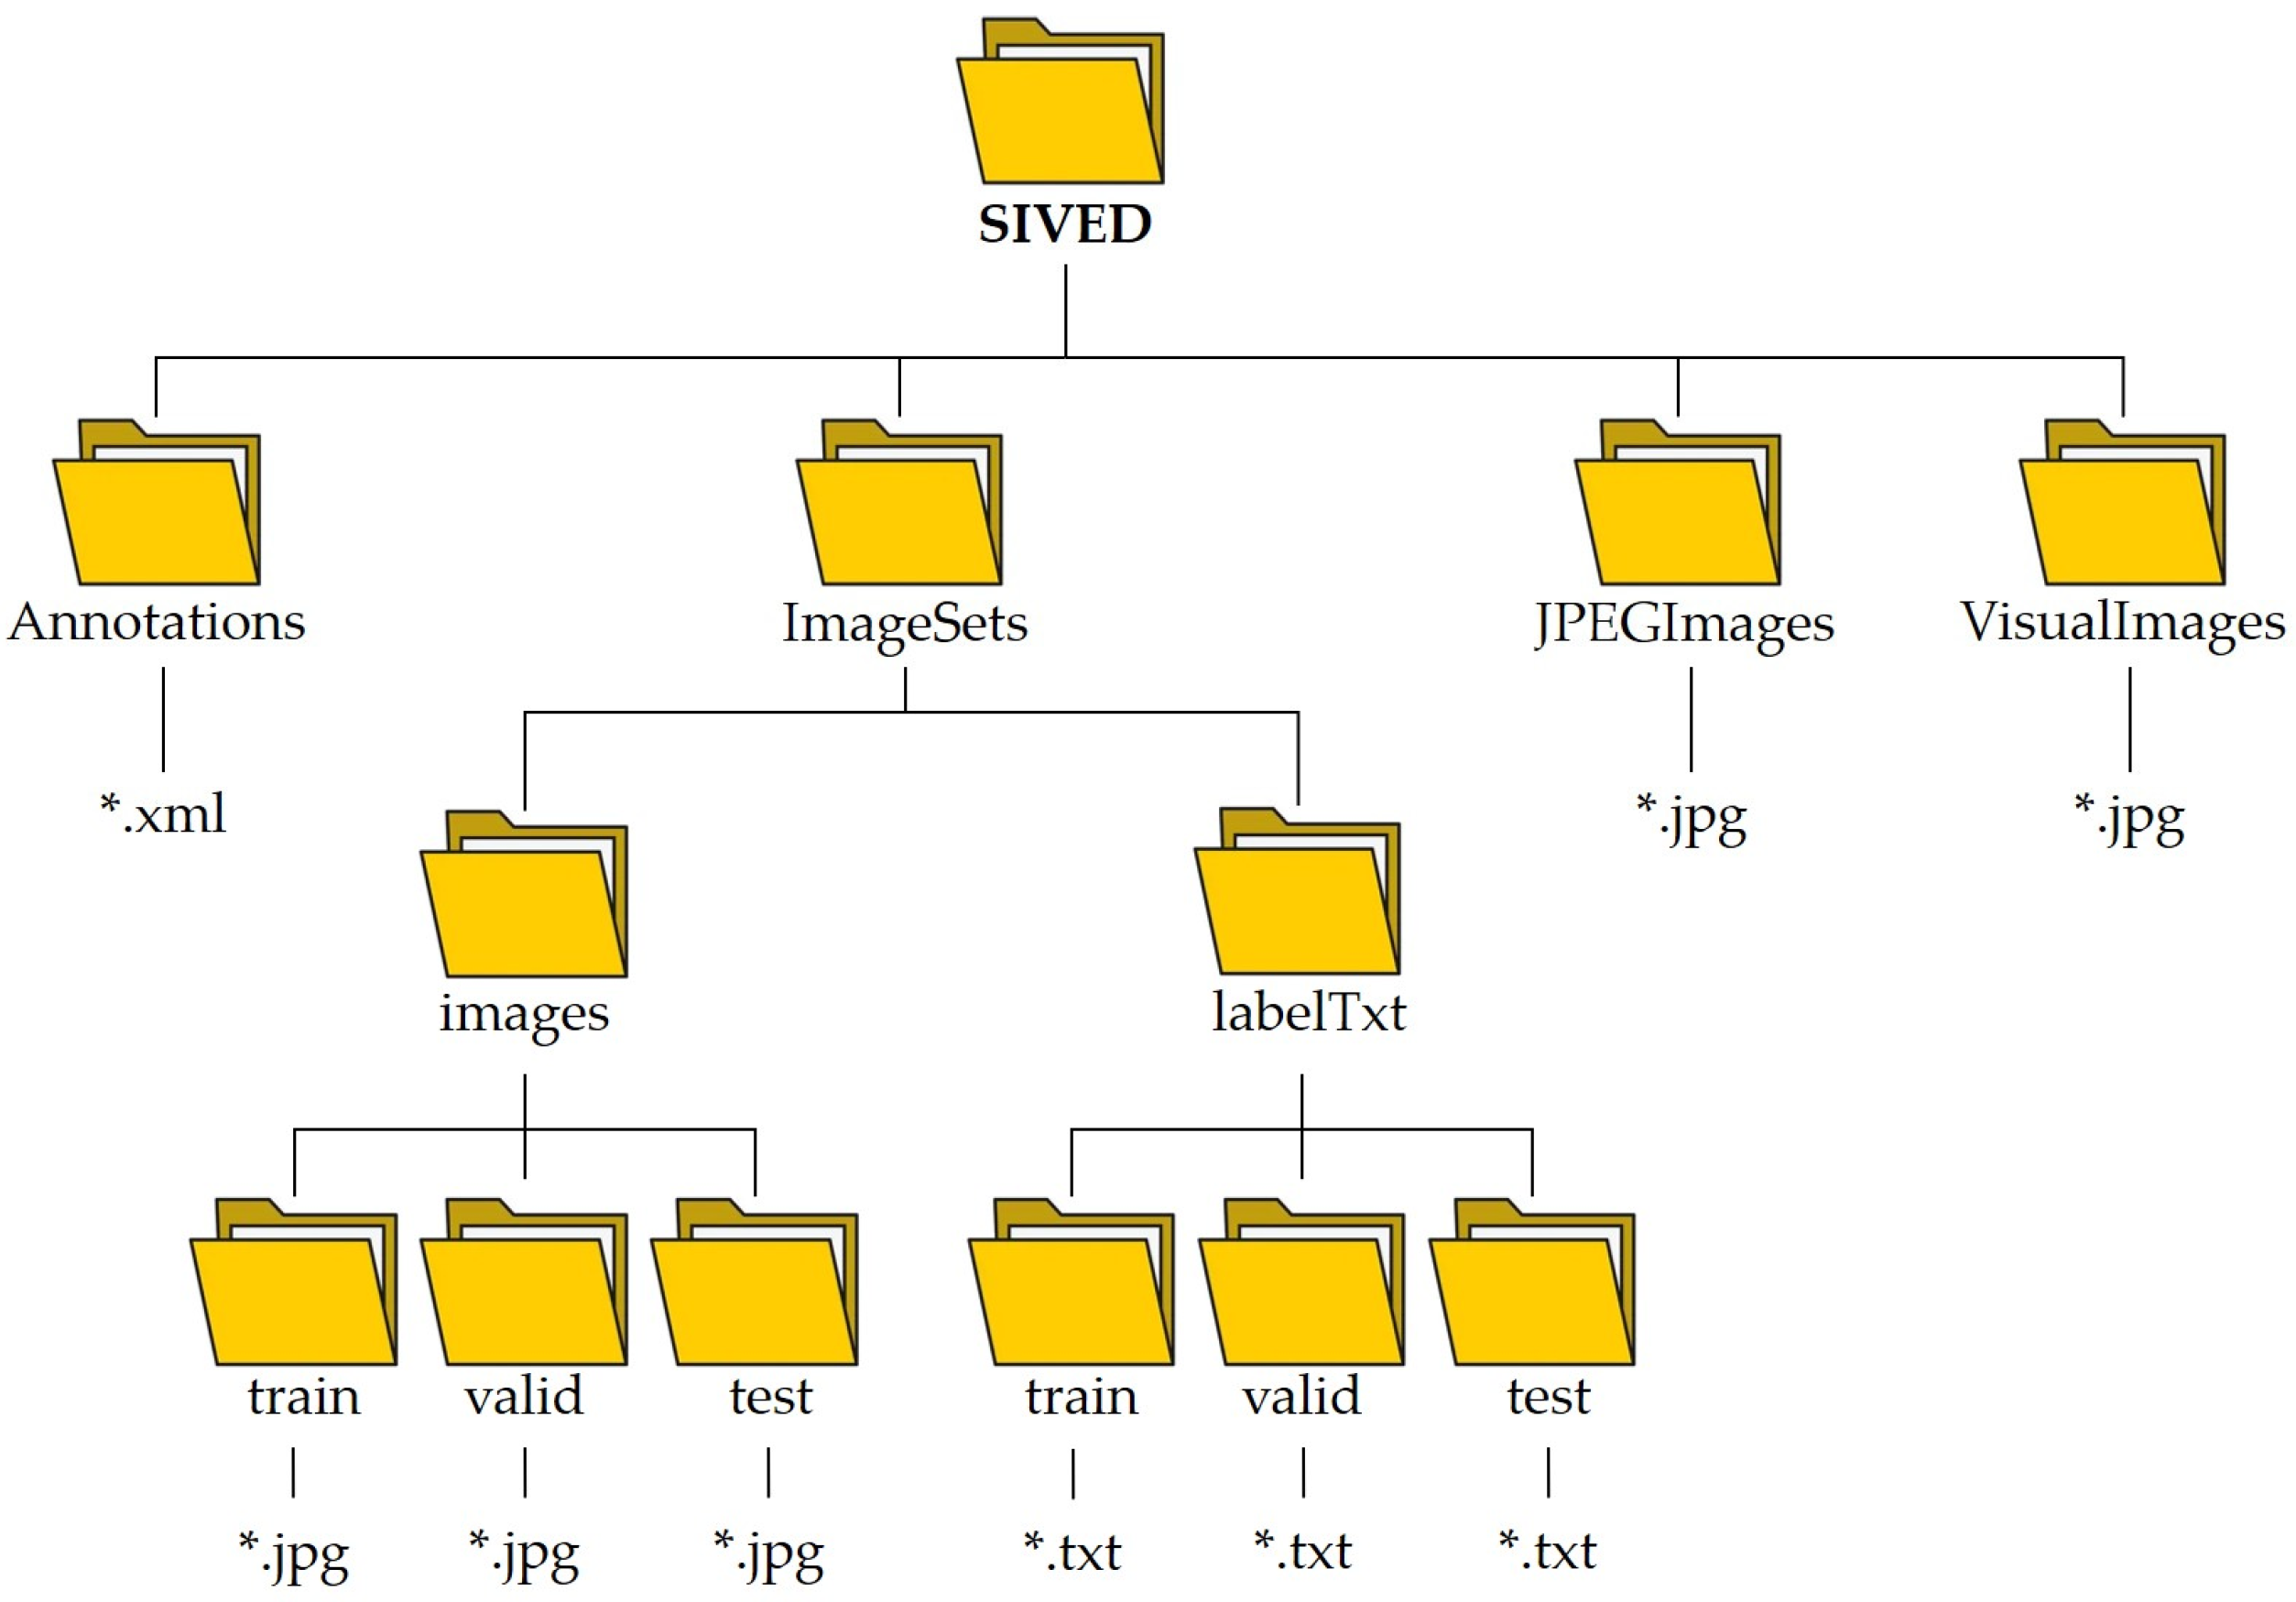
The dataset is constructed, and its file structure is presented in Figure 8. The Annotations folder contains the annotation files in XML format, while JPEGImages holds all the image chips. VisualImages contains the annotated visual chips, and ImageSets holds the dataset that has been divided into the training, test, and validation sets. These sets mainly contain image chips and annotation files in TXT format. It is worth noting that all images and annotation files are named in the form of source with a serial number, such as FARAD_1.*, and the front sub-name indicates its source to enable researchers to freely select either urban scene data (FARAD and MiniSAR) or MSTAR simple scene data. Additionally, relevant experiments will be conducted in later chapters to provide benchmark metrics under different scenes, thereby facilitating convenience for the researchers.
4. Dataset Analysis
Two primary metrics are considered to provide an overall analysis of the dataset: the scale distribution and the angle distribution of the vehicles. The scale distribution is specific to all datasets and can be used to analyze the target scale that the dataset focuses on and its level of challenge for detection algorithms. Meanwhile, the angle distribution takes the imaging mechanism of SAR into consideration. Assuming all other conditions are the same, the target features will significantly differ at different azimuth angles. The presence of targets at various angles will contribute to the network’s ability to extract features and rapidly converge toward stability in the training procedure.
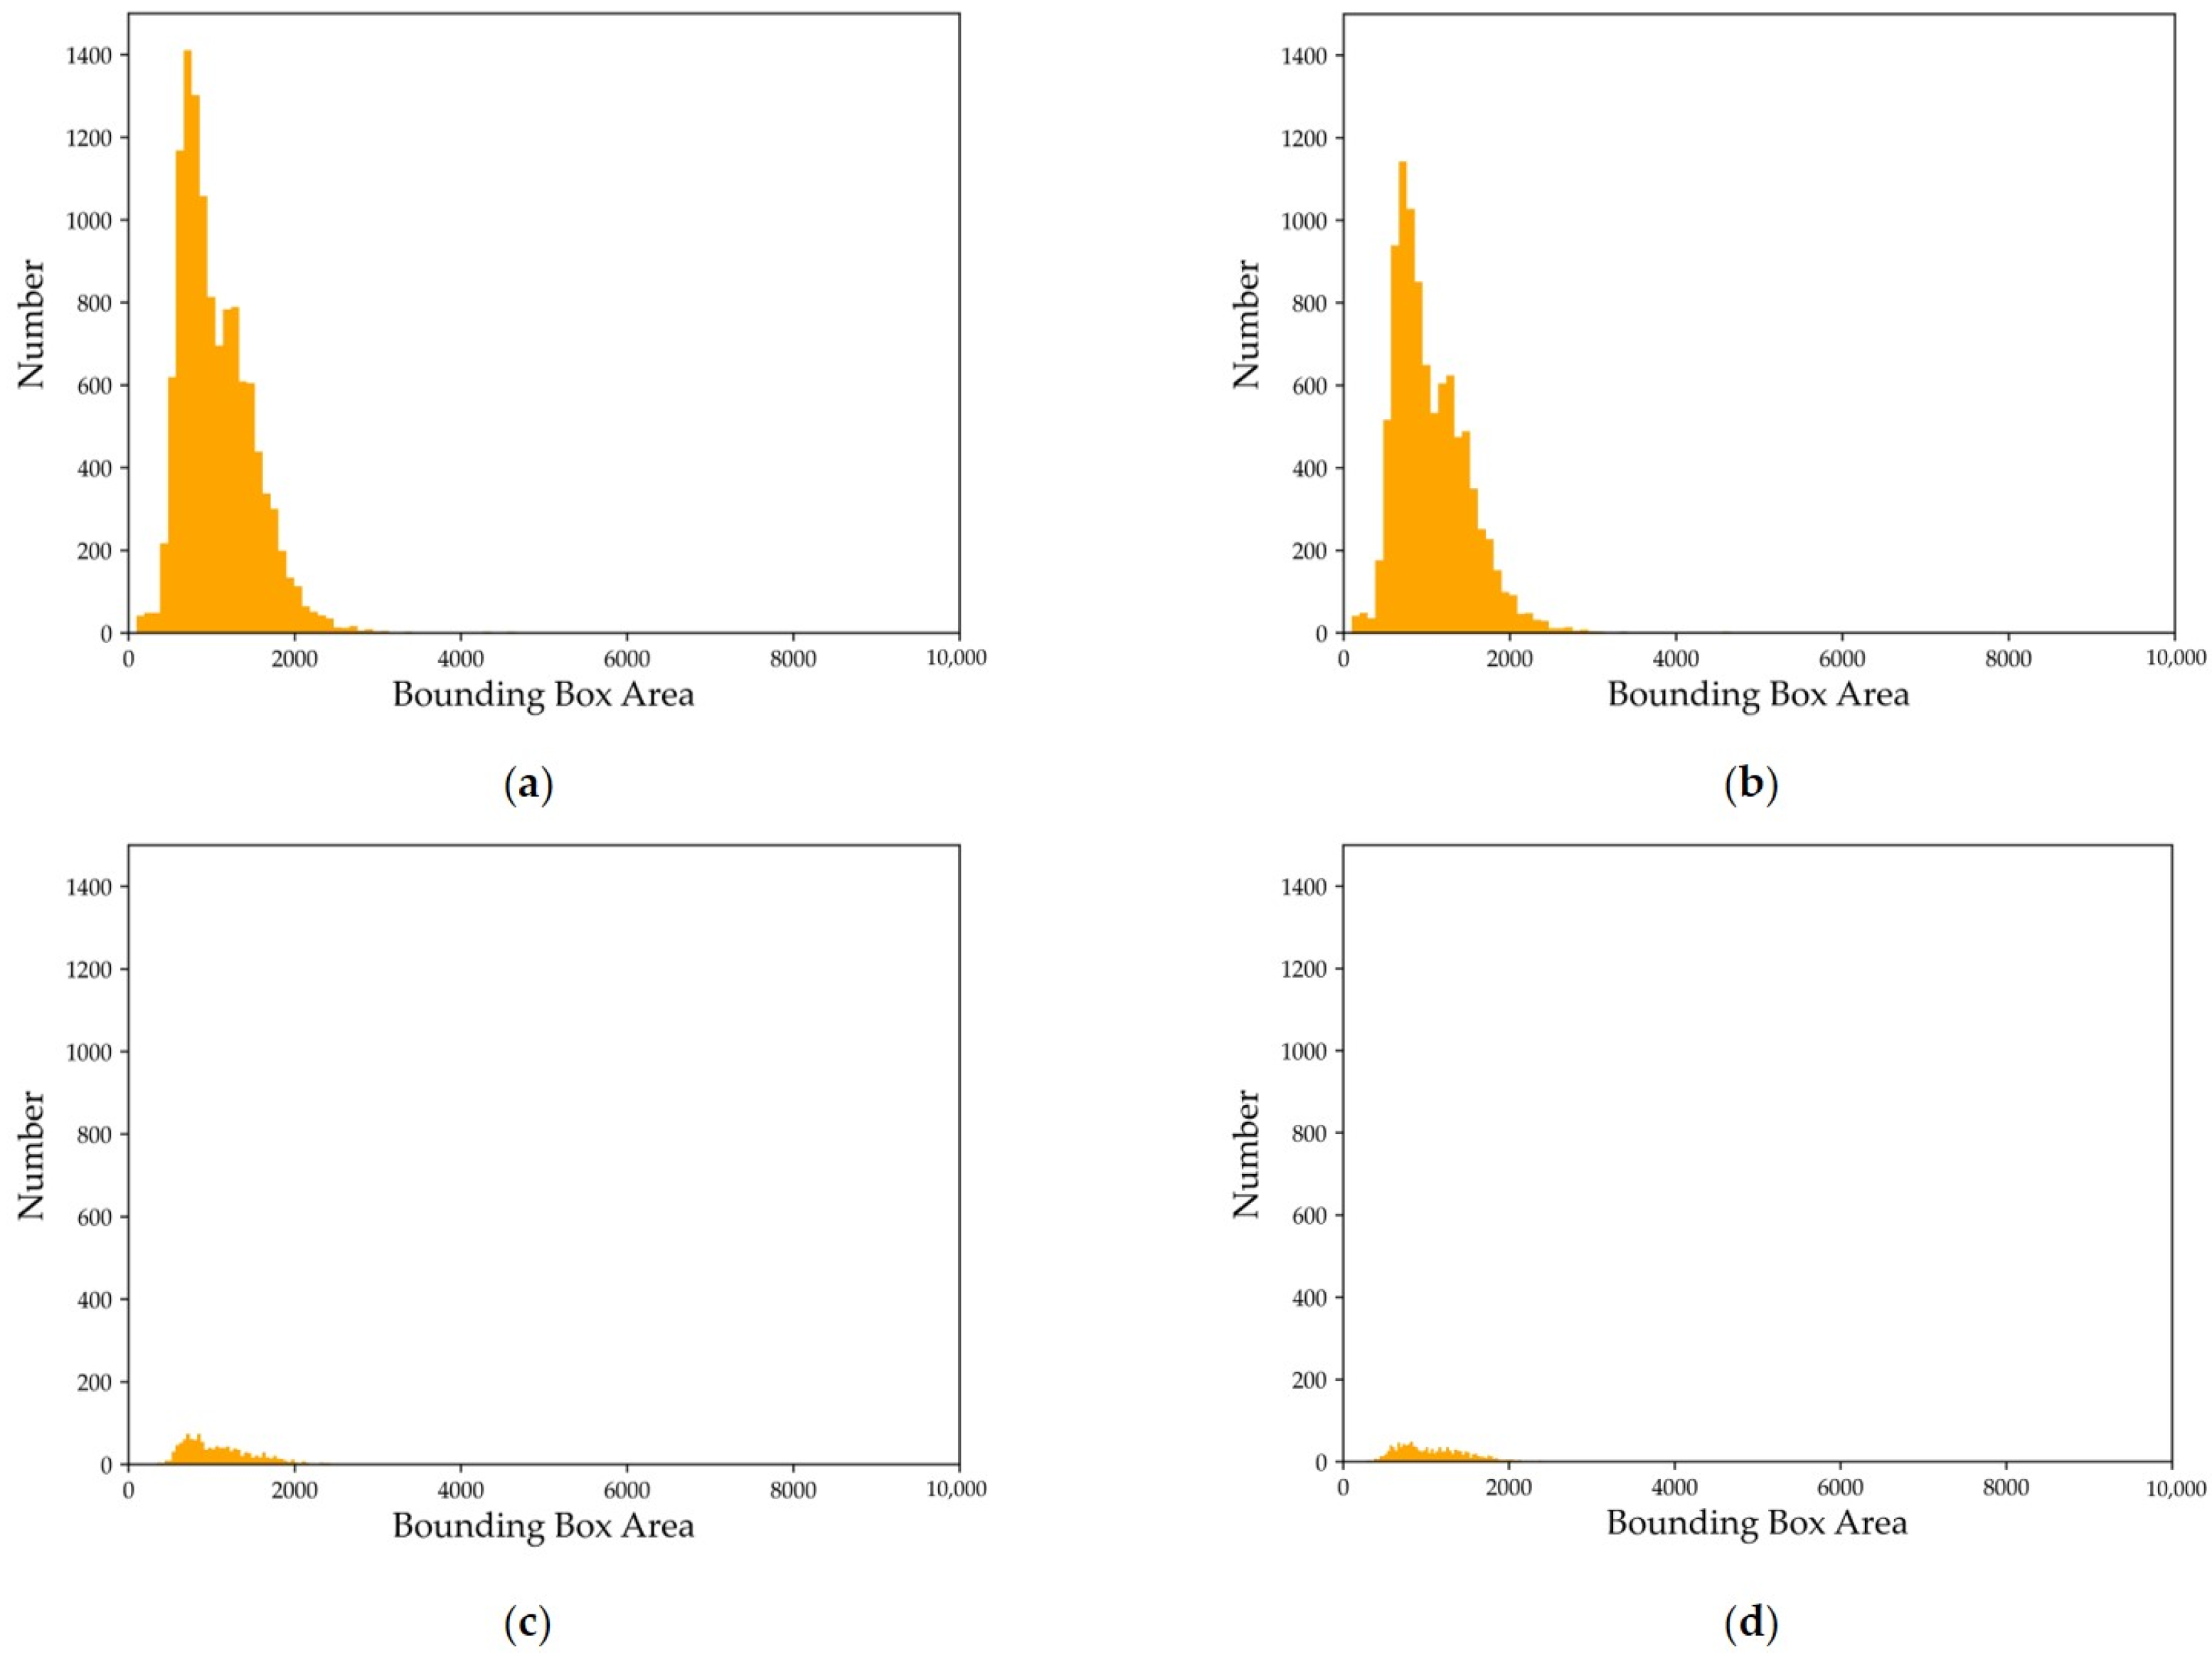
4.1. Scale Distribution Analysis
The scale of a target can be defined as the pixel area it occupies. In the COCO dataset [36], targets are classified as small, medium, or large based on their pixel area range, as shown in Table 3. The detection of small targets is generally considered to be the most challenging task, and this is attributed to three main characteristics of small-target detection:
- 1.
- Few features are available, meaning less visual information, and extracting features with discriminatory power is complicated. Moreover, this process is easily disturbed by environmental factors.
- 2.
- High localization accuracy is required because small targets cover a small area in the image. An offset of even a single pixel point from the bounding box can cause significant errors in the prediction process.
- 3.
- Dense scenes are common, and small targets in proximity are prone to interference from neighboring targets.
The target scale distribution of our dataset in each set is shown in Figure 9. Small targets make up 54.5% of the dataset, and 99.8% of the targets have an area less than 3072 (which is three times the area of small targets). This indicates that the dataset mainly comprises small- and medium-sized targets, making it challenging for detection algorithms to accurately identify them.
4.2. Angle Distribution Analysis
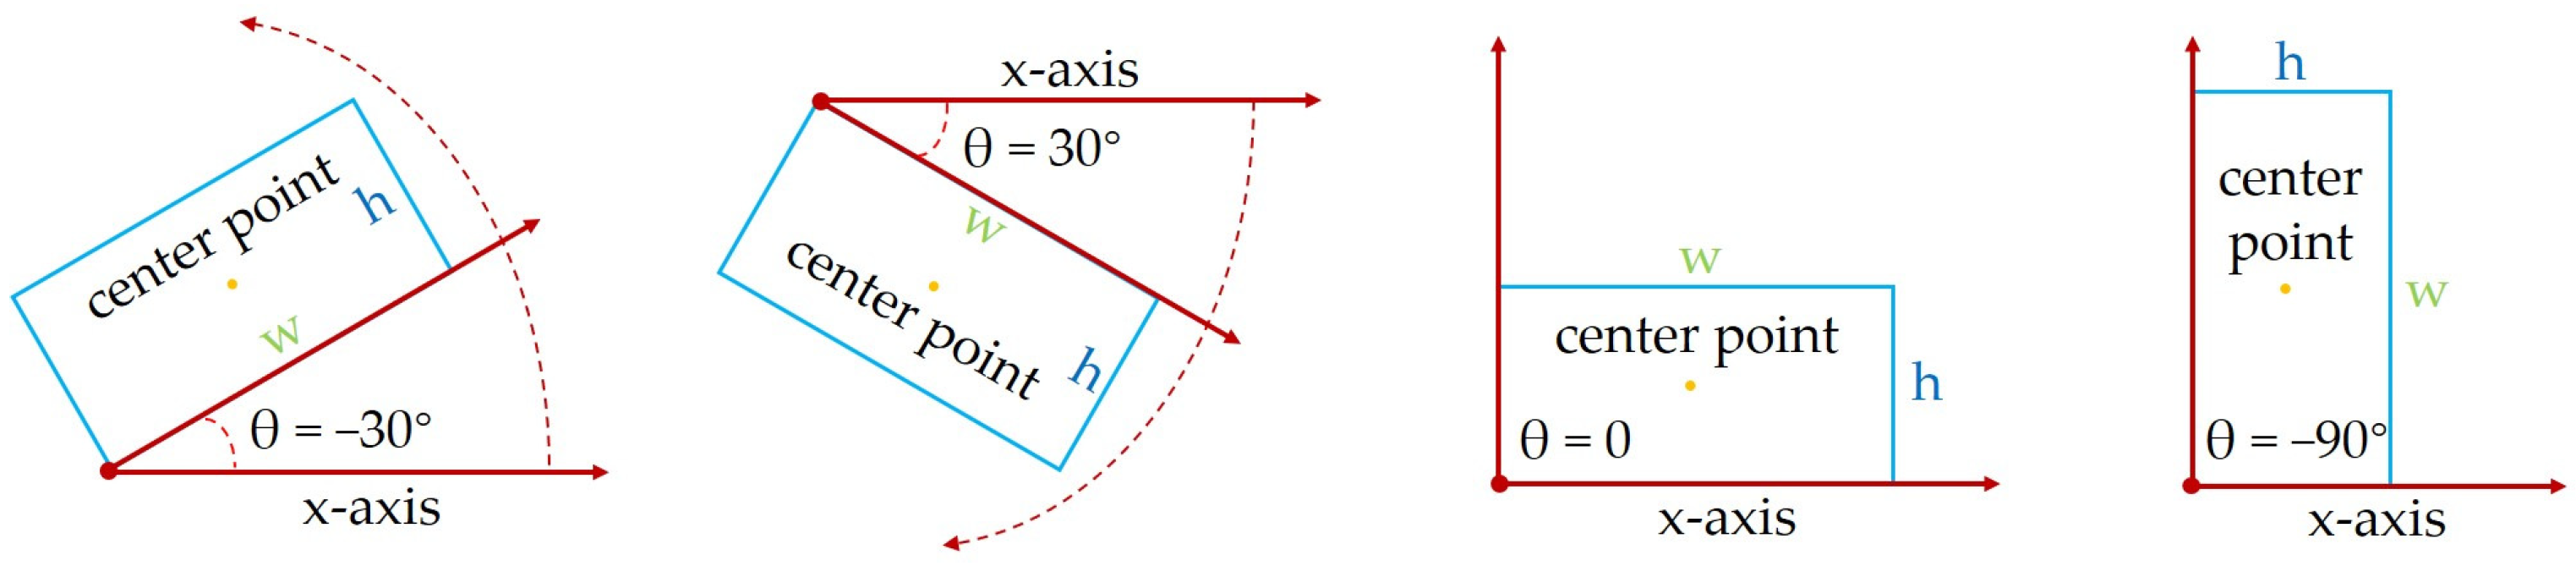
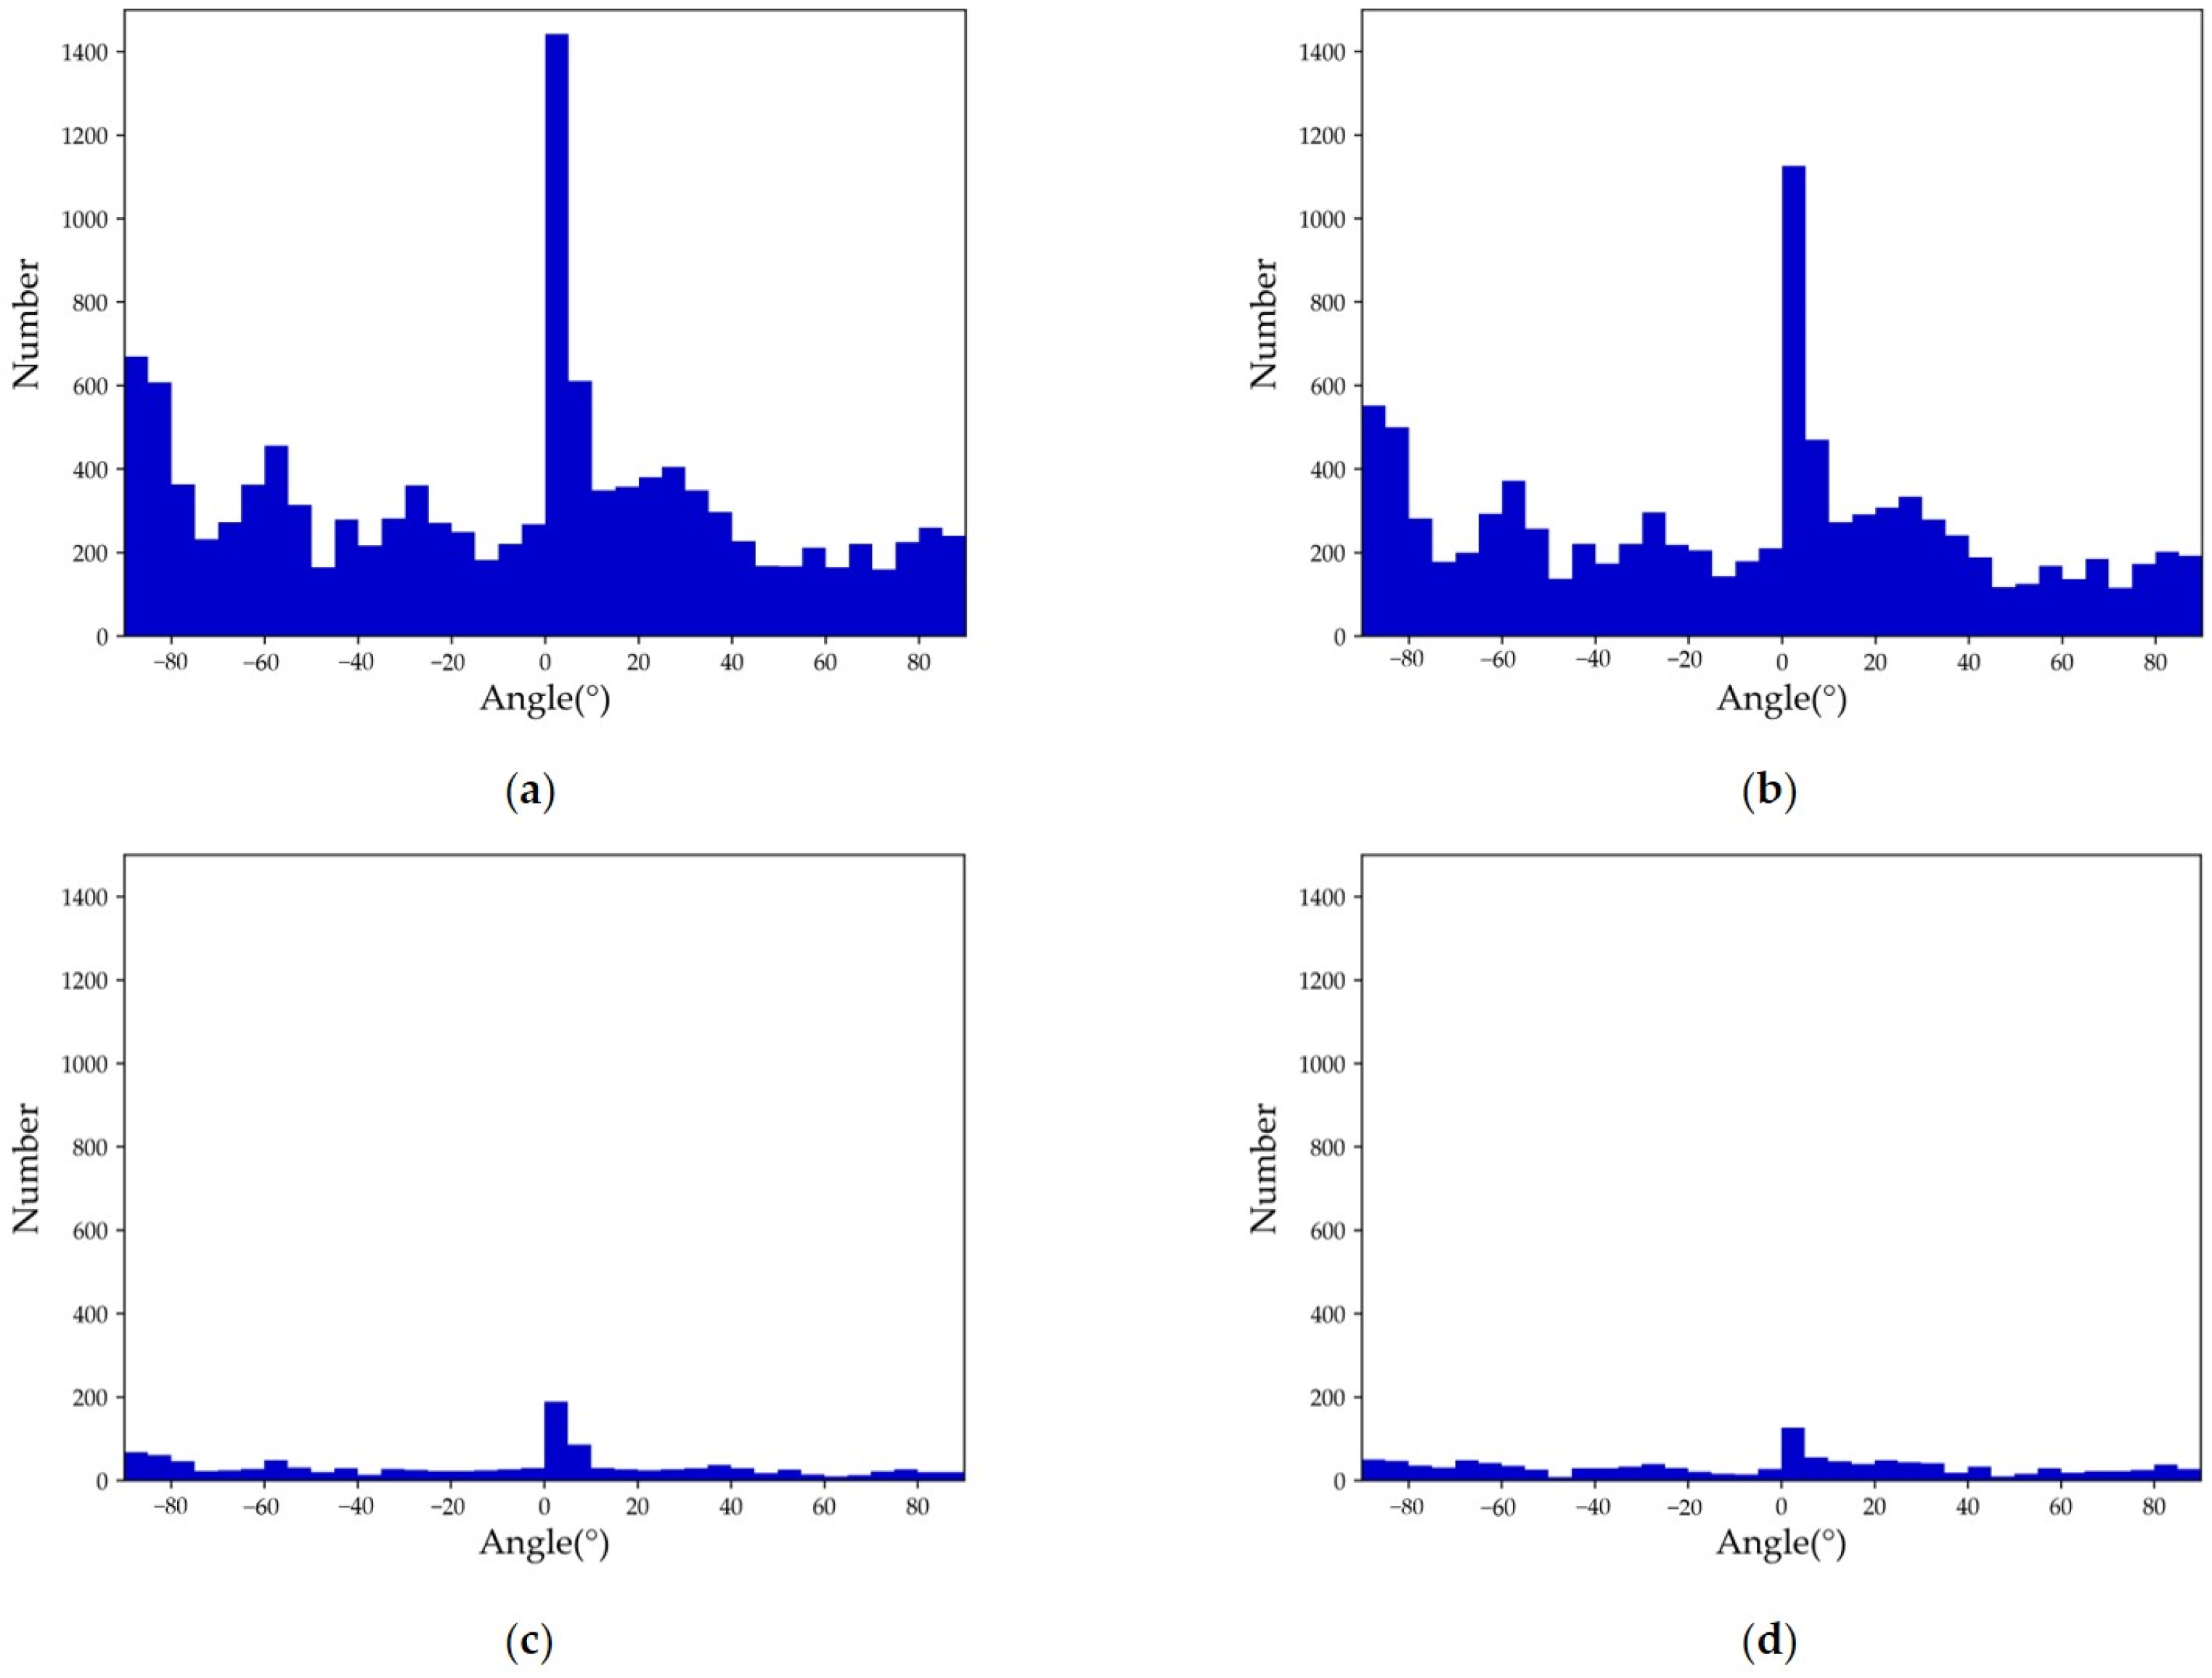
Due to the difficulty in determining the direction of a vehicle’s head, the azimuthal definition of 0°~360° cannot be used to evaluate the target angle. Instead, the long edge definition method is employed. As depicted in Figure 10, the range is defined as [−90°,90°), where the clockwise direction is positive. This method takes into account the relatively extensive and symmetrically distributed natural angle range, resulting in more uniform characterization of the target angle distribution. Figure 11 presents the angle distribution statistics of SIVED, which demonstrate that the targets are distributed at different angles, thereby promoting the integrity of feature extraction and dataset stability.
4.3. Properties of SIVED
SIVED has three main properties: richness, stability, and challenge. It contains SAR data in X, Ku, and Ka bands, which enrich the target features compared to previous SAR datasets that lack multi-source image. Additionally, SIVED includes vehicle targets in multiple scenarios and with various properties, making it suitable for meeting actual mission requirements.
All the vehicles in SIVED are distributed at different azimuths, which is beneficial for maintaining the integrity of target characteristics under SAR imaging. In the later section, advanced detection network experiments will be used to verify its stability.
SIVED primarily focuses on small targets and complex backgrounds, and it has been designed to satisfy this requirement, as analyzed in Section 4.1. Detecting small targets is always challenging in object detection tasks, and urban areas, in particular, pose an added challenge with multiple features and tiny structures that can be easily confused with vehicle targets.
5. Methodology
Currently, there are two mainstream classification methods for deep detection algorithms. The first method divides algorithms into two-stage and one-stage based on their process. The second method categorizes algorithms as anchor-based or anchor-free, depending on whether they use anchors. Additionally, there are different regression strategies or designed modules for detecting rotatable bounding boxes. In this paper, we will experiment with eight different models to verify the stable reliability of the dataset. We will describe these models in the following sections.
5.1. Object Detection Framework Overview
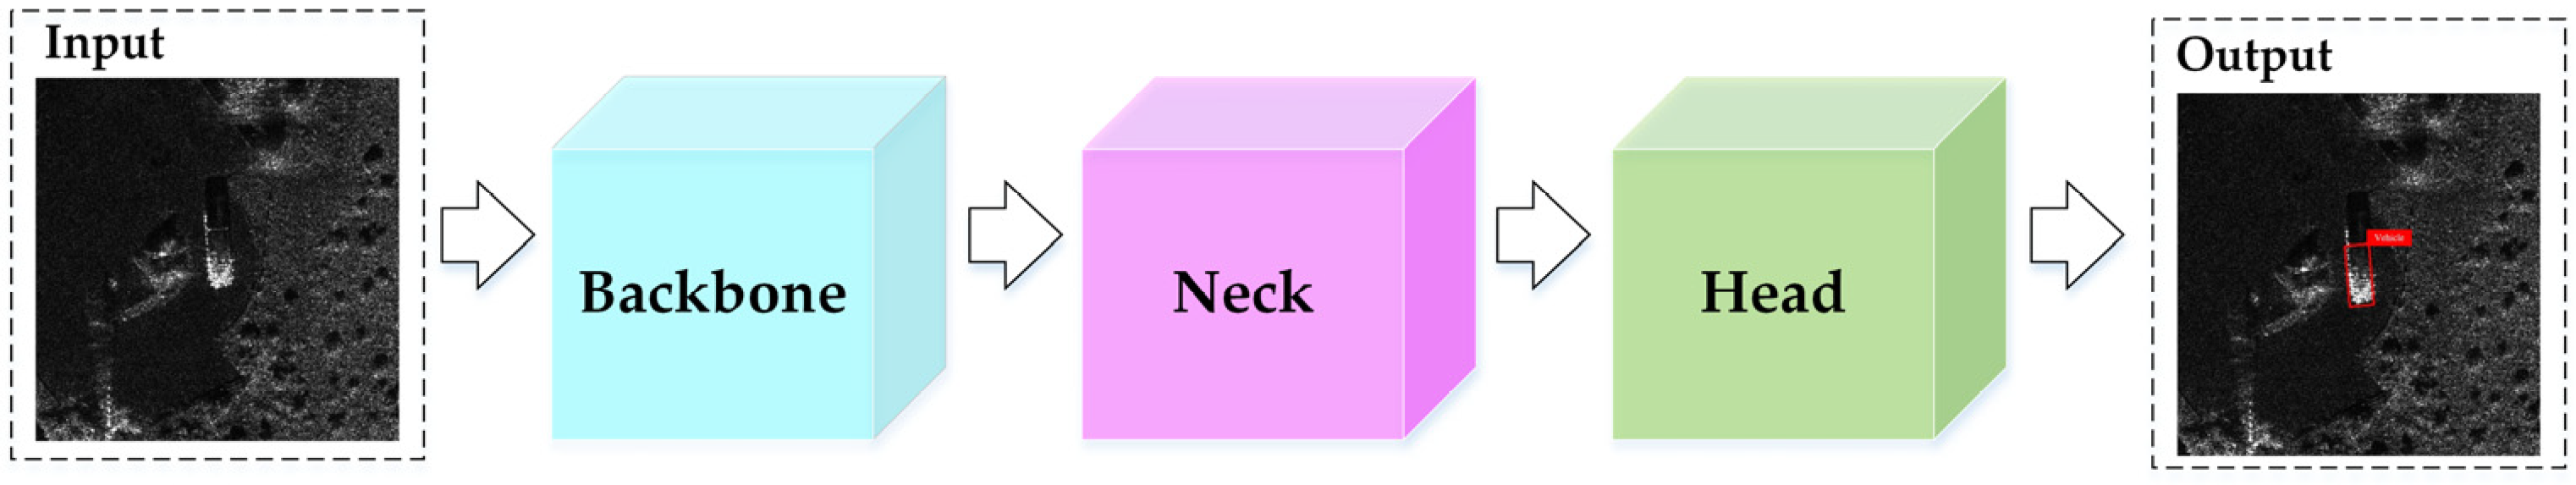
Most object detection networks consist of four parts: input, backbone, neck, and head, as shown in Figure 12. The backbone is responsible for feature extraction and typically uses classical CNN networks such as VGG [37] or ResNet [38]. In this paper, the backbone of all networks is ResNet50 [38]. The neck plays a top-down role and is mainly used for feature fusion, which makes the features learned by the network richer and more diverse and improves the detection performance. The neck used in this paper in all cases is feature pyramid networks (FPN) [39]. The head, also known as the detection head, is responsible for generating network outputs, making predictions using the extracted features, and ultimately outputting the object’s class and location.
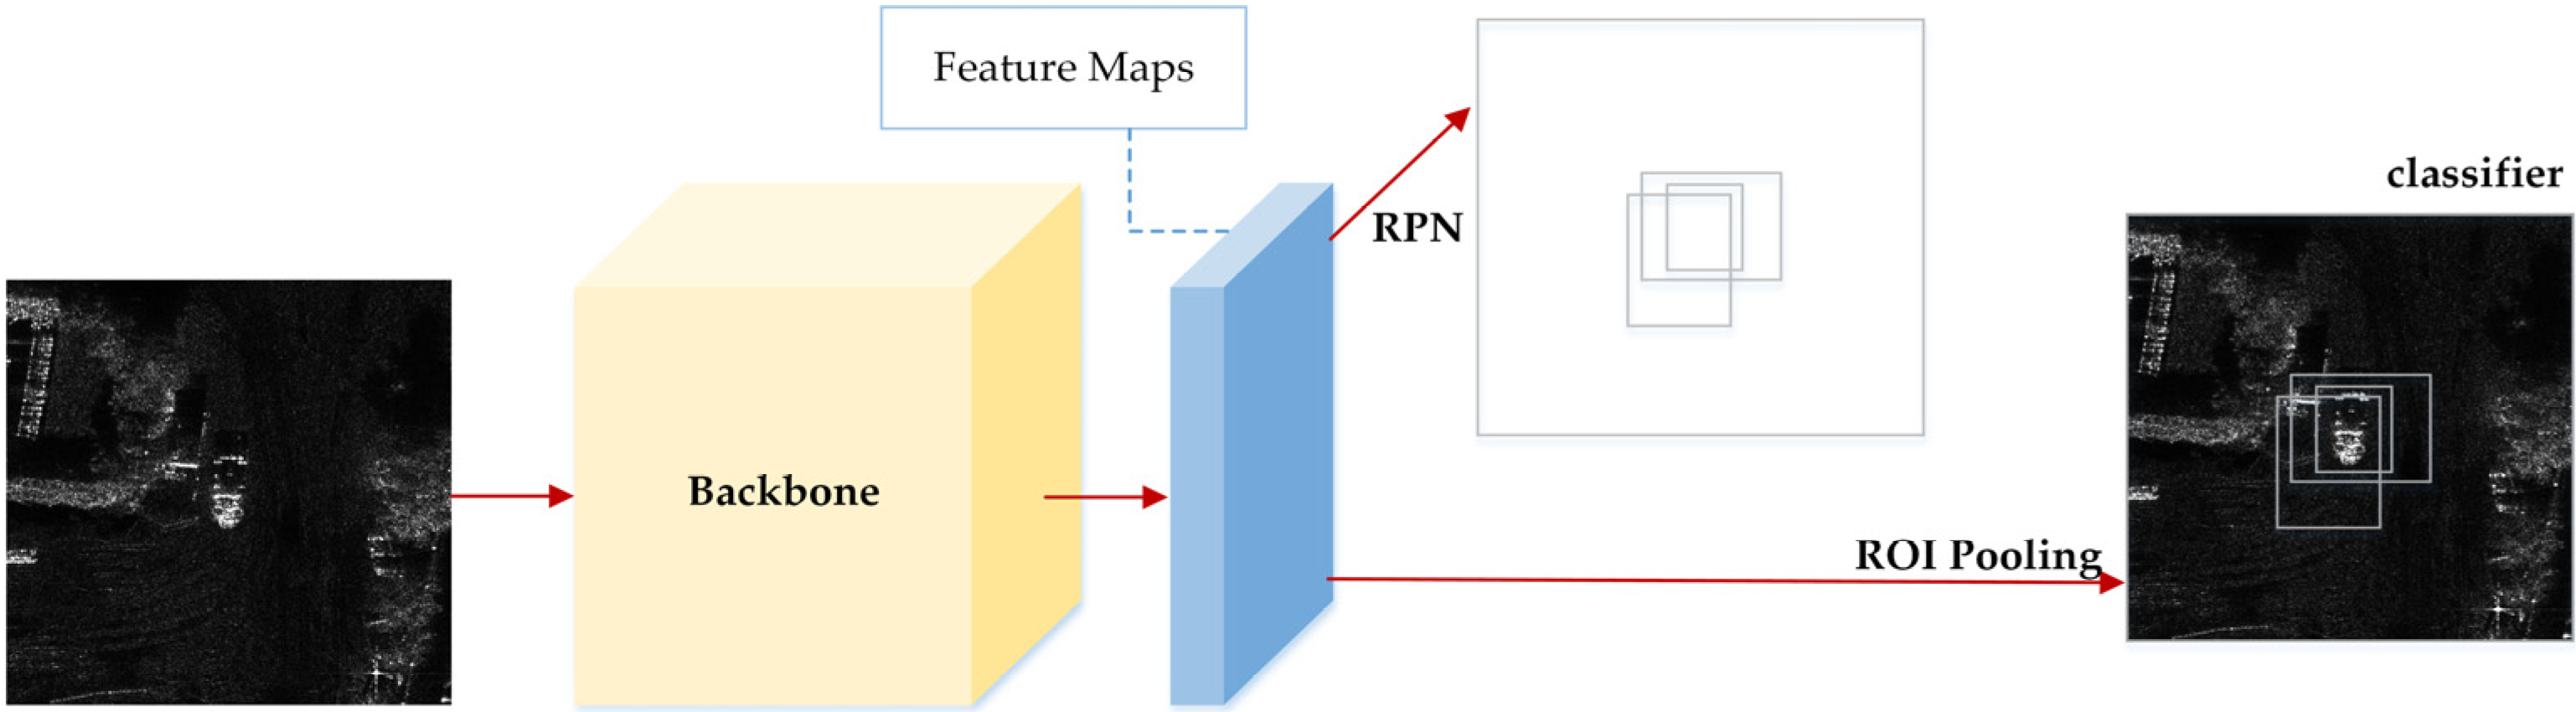
5.2. Rotated Faster-RCNN
Faster-RCNN [40] is a two-stage detection algorithm with a structure shown in Figure 13. The main parts include the feature extraction network, region proposal network (RPN), and ROI pooling. As mentioned earlier, the feature extraction network is the backbone, while the RPN and ROI pooling layers form the head. The RPN generates candidate regions, and the ROI pooling layer extracts those regions from the feature map for final classification and regression. Angular parameters are added to the network for regression to form the final Rotated Faster R-CNN.
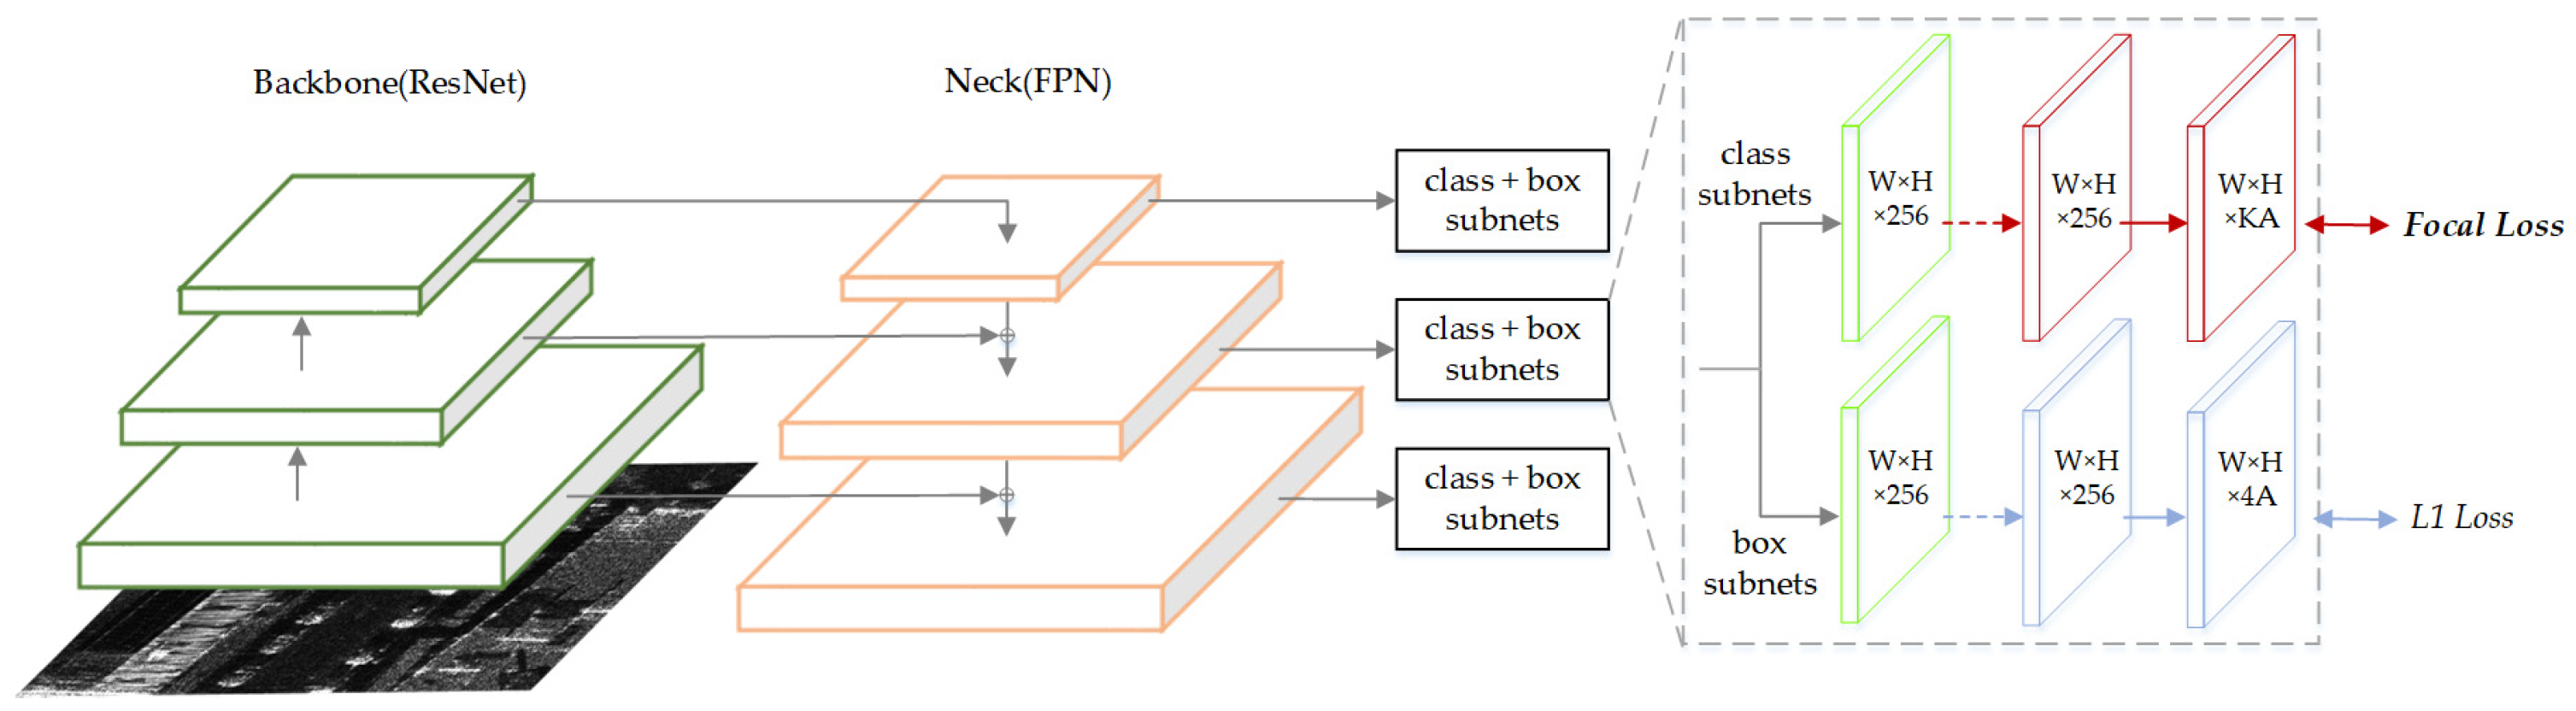
5.3. Rotated RetinaNet
RetinaNet [41] is a one-stage network with a typical structure, as shown in Figure 14. The feature maps of different dimensions extracted by the ResNet50 backbone are input to the FPN, and the classification and box regression sub-networks complete the detection process. Focal Loss, proposed by the authors to balance positive and negative samples, is the core contribution of the paper. By introducing Focal Loss, one-stage detection performance surpasses that of two-stage detection networks for the first time. The same technique is applied for angle parameter regression, resulting in the creation of Rotated RetinaNet.
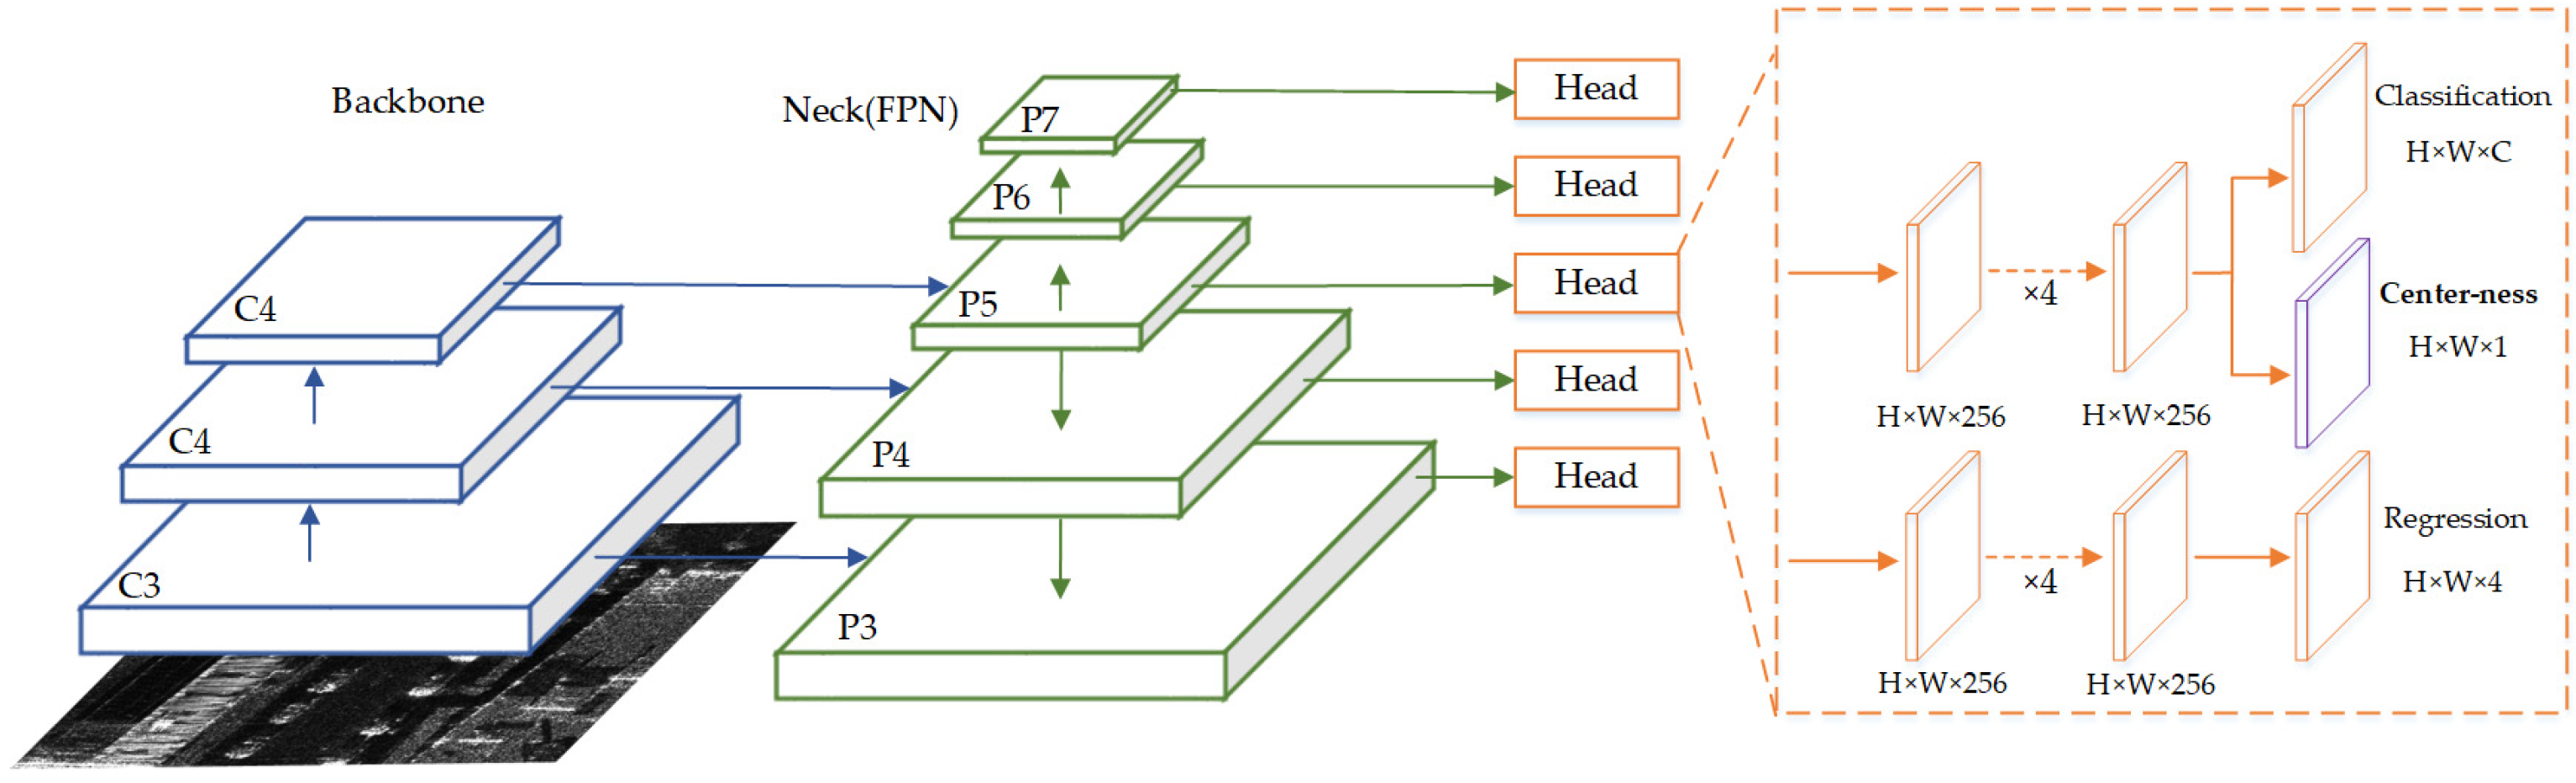
5.4. Rotated FCOS
FCOS [42] is a typical one-stage anchor-free network with a structure shown in Figure 15. It outputs fused feature maps through the backbone network and FPN. Later, it outputs feature vectors at each point location on each feature map through the detection head network, which is used to represent the final bounding box results. In contrast to anchor-based networks, the detection head network in FCOS does not use anchors for regression but introduces center-ness to describe the distance from the point position in the feature map to the center of the target to achieve target localization. By including the calculation of angular loss, it becomes Rotated FCOS.
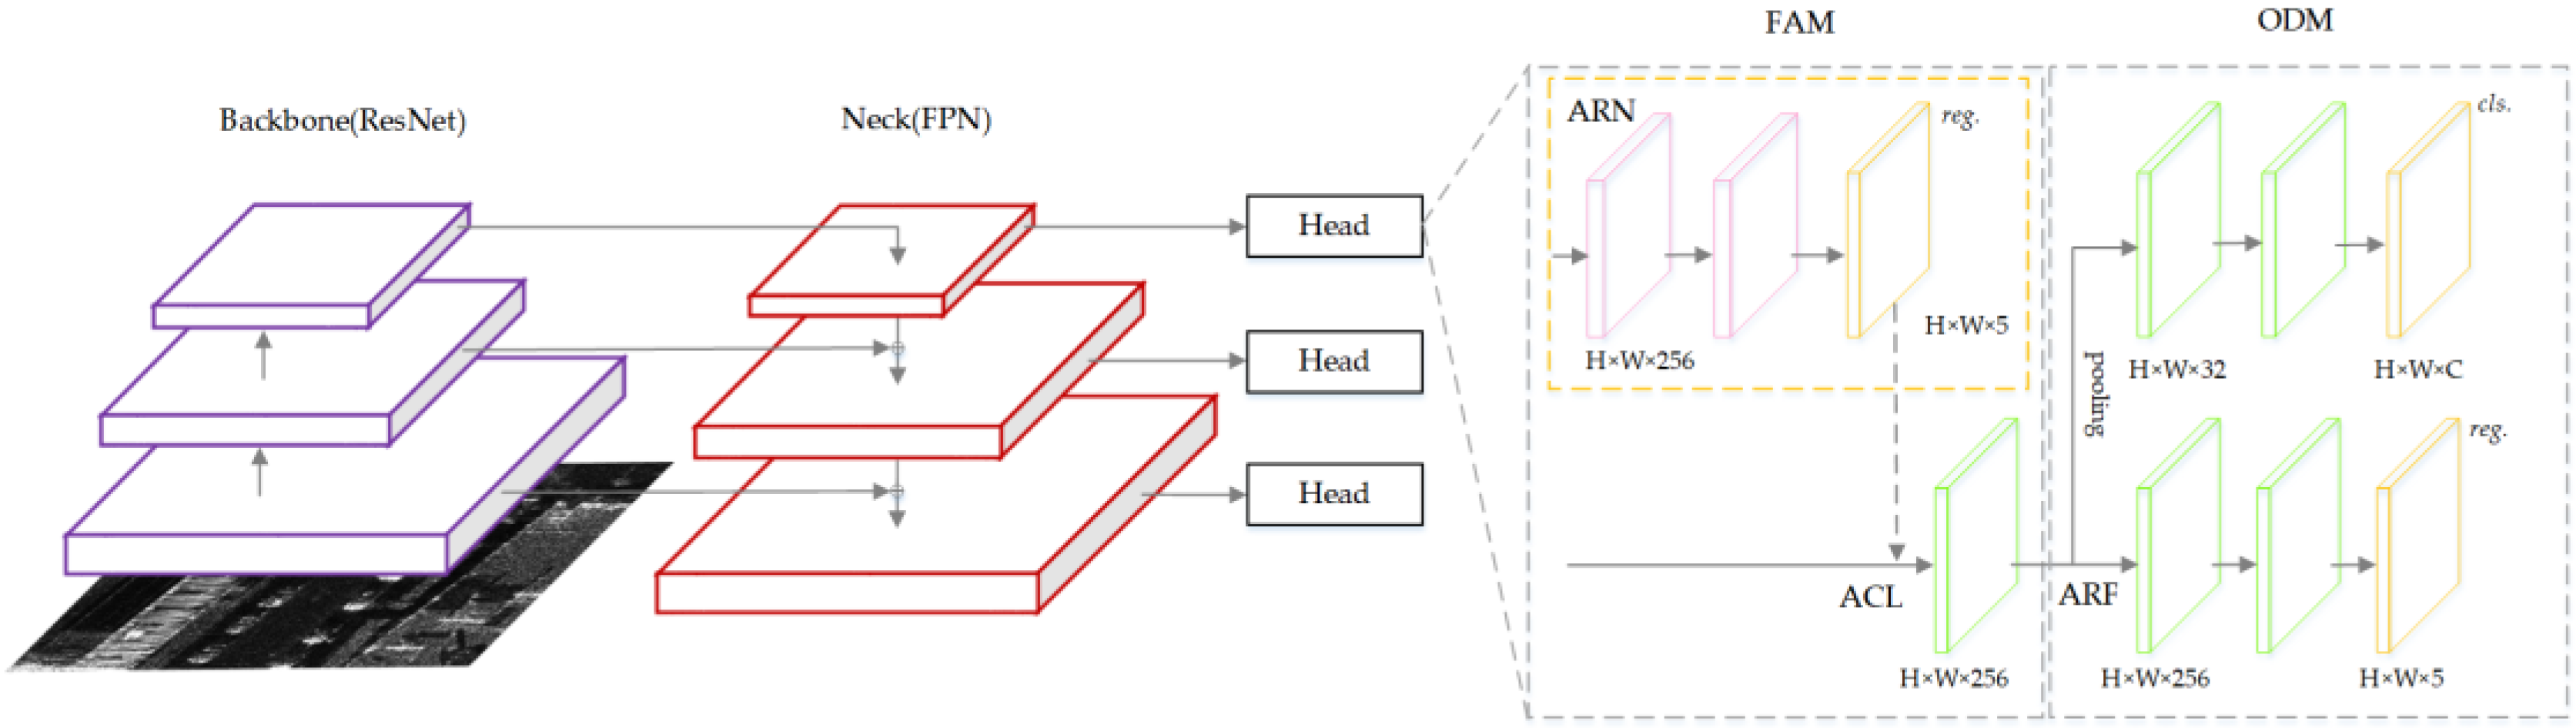
5.5. S2A-Net
Single-Shot Alignment Network (S2A-Net) [43] is a one-stage detector for rotated objects with the structure shown in Figure 16. It consists of two modules: the Feature Alignment Module (FAM) and the Orientation Detection Module (ODM). The FAM can generate a high-quality anchor using the Anchor Refinement Network and adaptively align the convolutional features according to the anchor box using novel alignment convolution. The ODM first employs an active rotation filter for encoding, and direction-sensitive and direction-invariant features are then generated to mitigate the inconsistency between classification scores and localization accuracy.
5.6. RoI Transformer
RoI Transformer [44] is a module used in rotated two-stage detectors. It consists of two parts: the first part is the supervised rotated RoI learner, which learns the transformation parameters from horizontal RoIs to rotated RoIs; the second part is the Rotated Position Sensitive RoI Alignment module, which extracts rotationally invariant features from rotated RoIs to enhance target classification and boundary regression.
5.7. Gliding Vertex
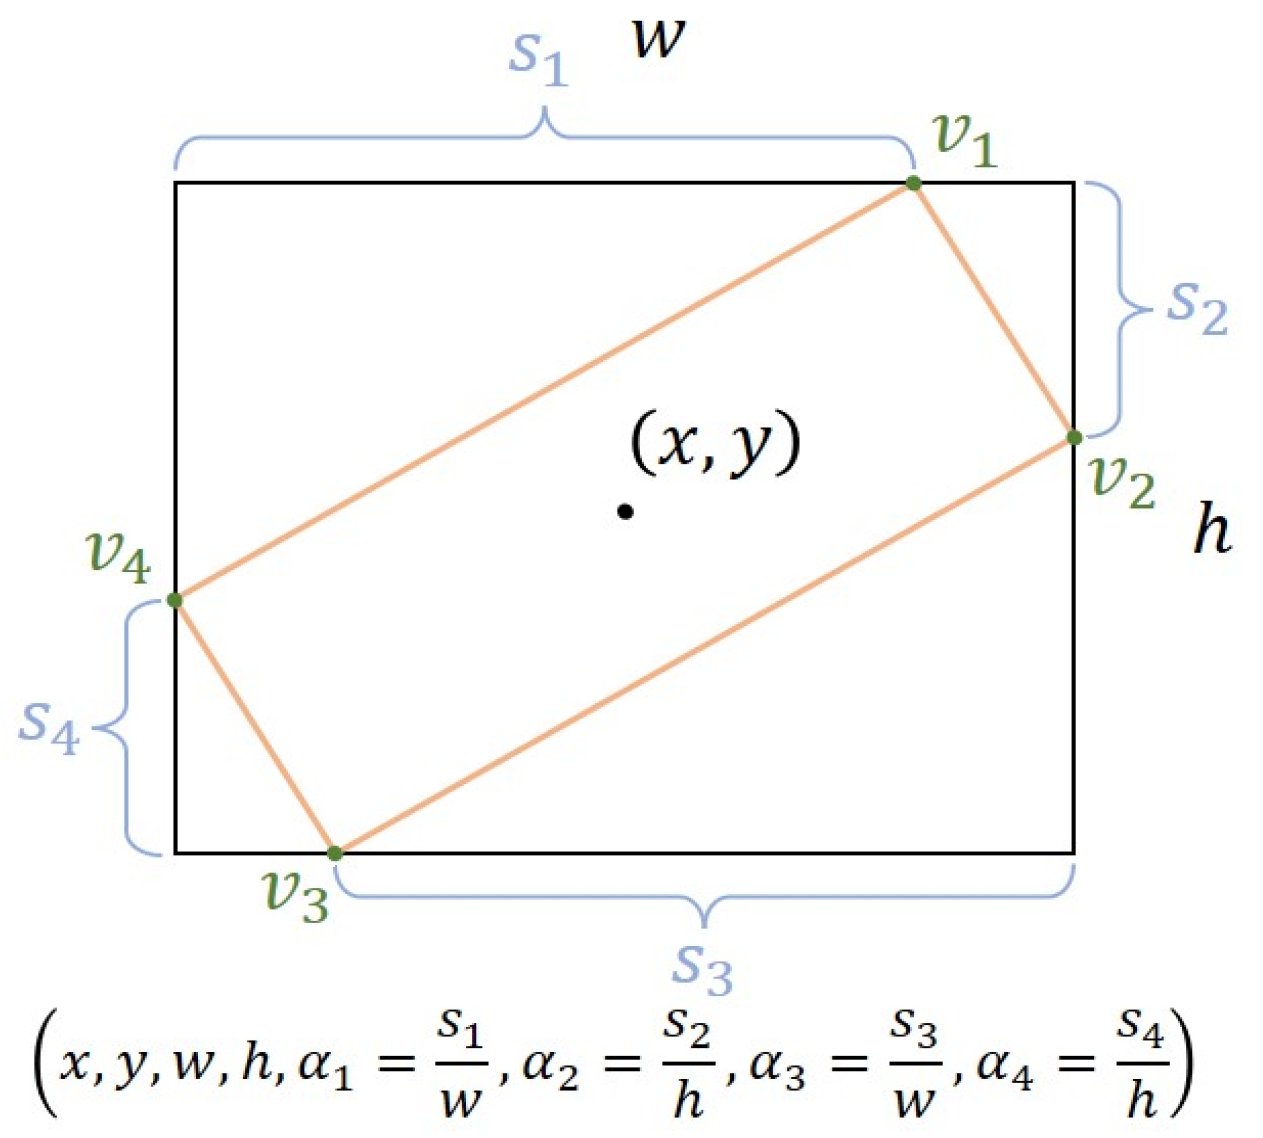
The Gliding Vertex [45] is also a simple yet effective strategy for rotated box regression. It replaces the direct regression of the four vertices of the rotated box with sliding of the vertices of the horizontal bounding box on each corresponding edge to accurately describe multi-directional objects. The parameter representation is shown in Figure 17. Specifically, the algorithm regresses four length ratios that characterize the relative glide offsets of each corresponding face. This approach facilitates the learning of offsets and avoids confusion in the sequential labeling points of oriented objects. To further address the confusion problem for near-horizontal objects, the authors introduce a skewness factor based on the area ratio between an object and its horizontal bounding box. This factor guides the choice of horizontal or oriented detection for each object. When using this method, the overall network architecture is referred to as the structure of Rotated Faster-RCNN, and five additional variables are simply added to the regression headers.
5.8. Oriented RepPoints
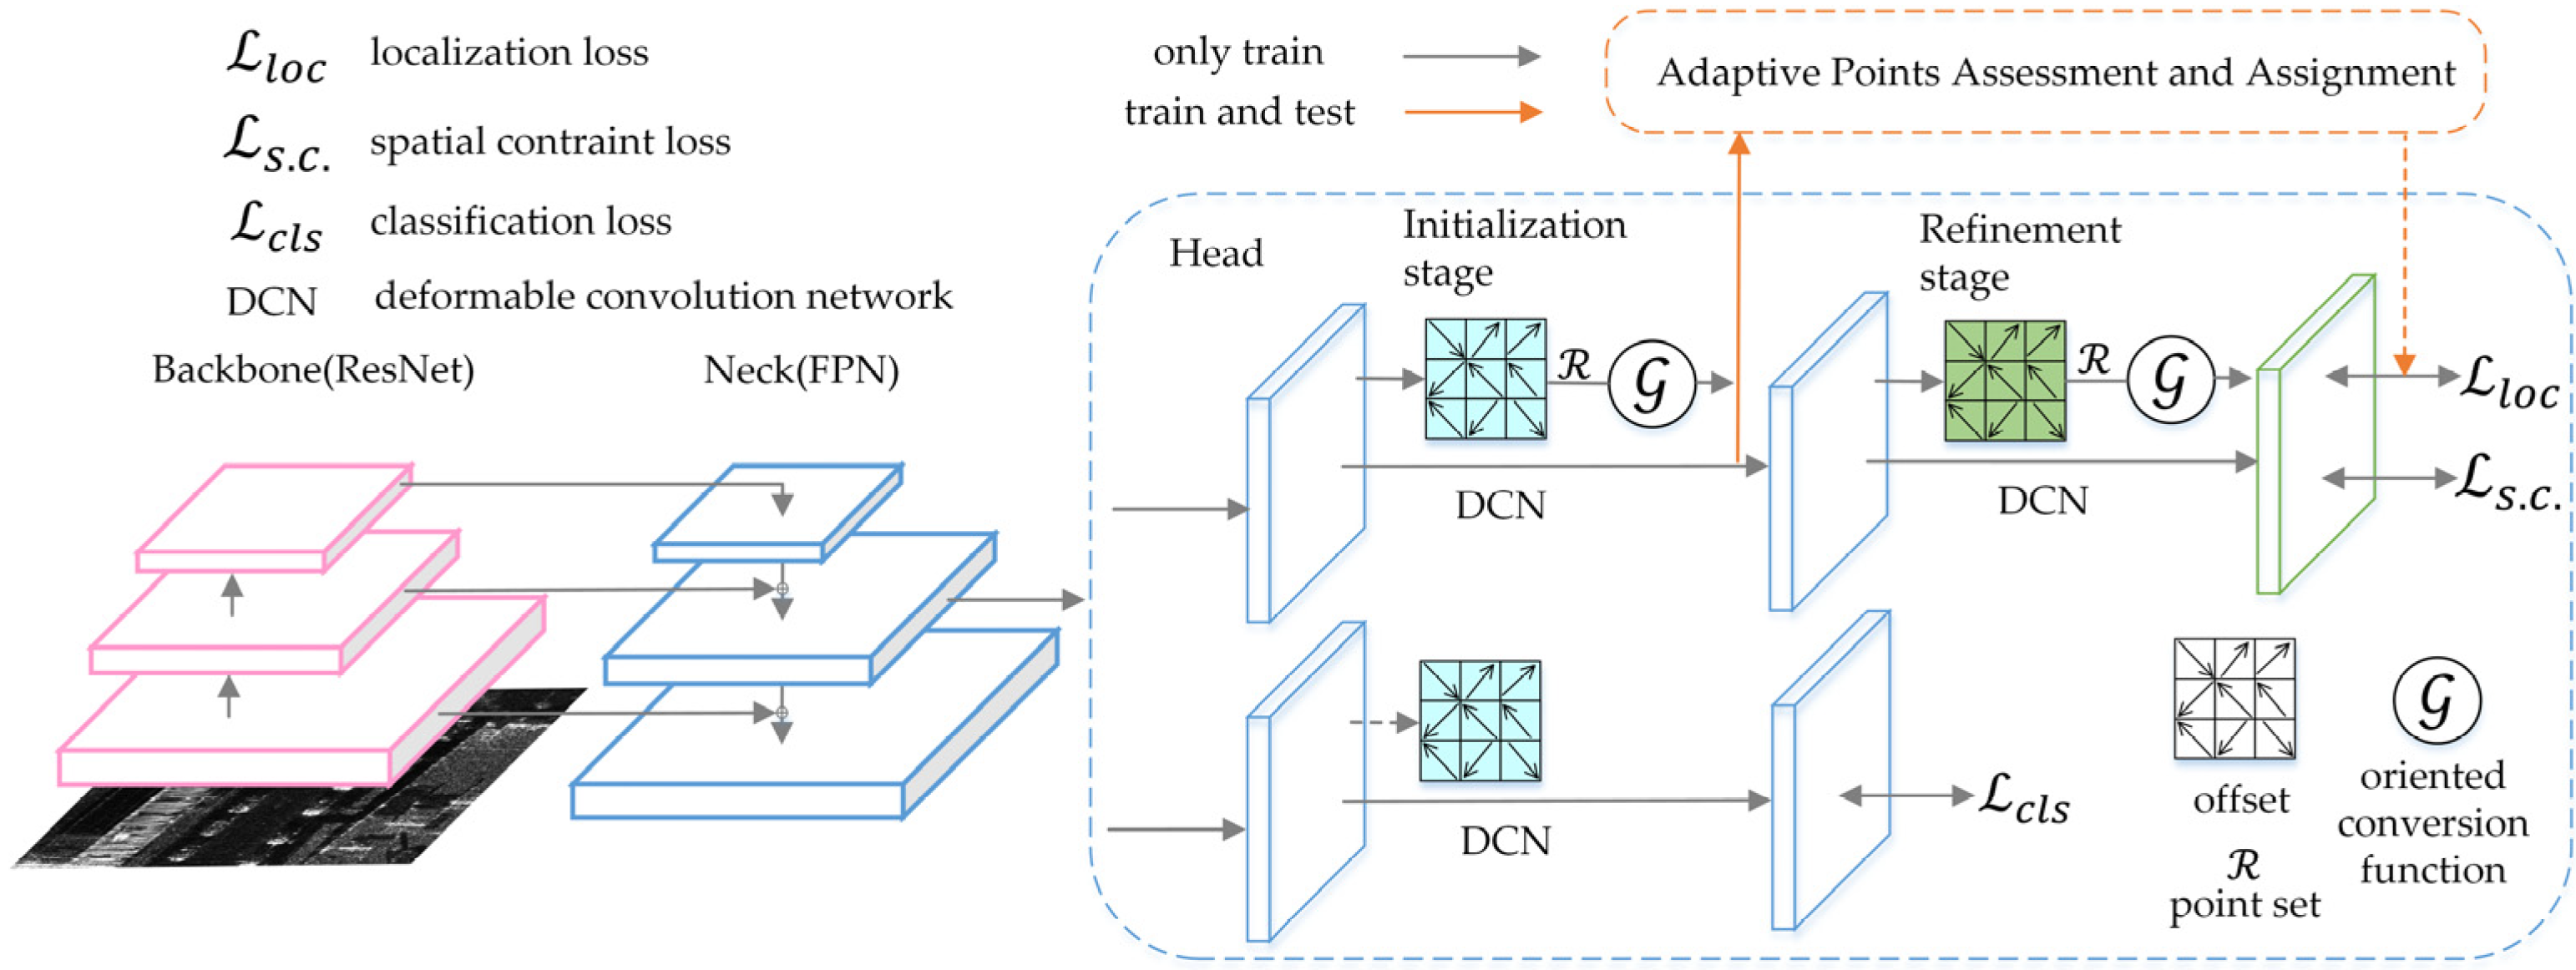
Oriented RepPoints [46] adopts a strategy for rotated bounding box regression that generates adaptive point sets for geometric structure representation using an adaptive points learning method. It employs three directed transformation functions that aid in accurate classification and localization with proper orientation. The architecture of Oriented RepPoints is shown in Figure 18. To select a representative sample of oriented points during training, an adaptive points assessment and assignment scheme is proposed for adaptive point learning that can capture non-axis aligned features from neighboring objects or background noise. A spatial constraint is introduced to penalize outlier points to enable adaptive learning. This method uses a one-stage network architecture, which is similar to RetinaNet while retaining Focal Loss. The corresponding detection network is formed by adding the corresponding strategy to the head.
5.9. KLD
KLD [47] is a strategy for rotated bounding box regression. Specifically, it first converts the rotated bounding box into a two-dimensional Gaussian distribution and then calculates the Kullback–Leibler divergence (KLD) between the Gaussian distributions as the regression loss. KLD can also be understood as a new loss function and will be added to the Rotate RetinaNet framework in the experiments of this paper.
Previous studies have successfully applied the Faster-RCNN, Retinanet, and FCOS frameworks to SAR ship detection [10,48,49,50], demonstrating their versatility in characterizing and learning from SAR images. Meanwhile, the Oriented RepPoints, Gliding Vertex RoI Transformer, and KLD methods are novel regression strategies, and S2A-Net is a model tailored to optical remote sensing images; these methods are awaiting evaluated for dataset compatibility. These various methods represent both stable classical and emerging algorithms. Thus, they are suitable for establishing a baseline and validating dataset performance.
6. Experimental Results
In this section, we will conduct experiments to validate the dataset using the rotated detection algorithms selected in Section 5. The purpose of these experiments is to test the dataset’s stability, compare the performance of different algorithms, and analyze the algorithm that achieves the best results.
6.1. Experimental Setup and Evaluation Metrics
The experiments were conducted with Ubuntu 18.04, using an Intel(R) Xeon(R) Gold 6230R CPU @ 2.10 GHz, and an NVIDIA Geforce RTX 3090 GPU. The detection algorithms are based on the mmrotate [51] deep learning framework, with the SGD optimizer, initial learning rate set to 0.01, momentum set to 0.937, and weight decay set to 0.0005. The batchsize is set to 8, the number of training epochs is set to 150, and a warm-up of 500 iterations is performed before training, with the warm-up learning rate set as one-third of the initial learning rate. During training, the validation set was used for verification, and the optimal weights were saved for testing.
To evaluate the effectiveness of the detection models on the constructed dataset, various metrics such as recall (R), precision (P), and mean average precision (mAP) were introduced. These metrics evaluate the model’s ability to recognize objects in each image as a whole. The definitions for these metrics are as follows:
the mAP metric is calculated using TP (the number of detected targets), FN (the number of missed targets), and FP (the number of false alarms). For a detailed explanation of the mAP metric, please refer to Table 4, where the IOU represents the overlap ratio between the predicted bounding box and the actual labeled box to the total area of both boxes.
6.2. Experiments for Baselines
The evaluation experiments for the dataset were performed using the eight networks described in Section 5. The corresponding test set evaluation metric values for each network are presented in Table 5. The results show that all networks achieved an mAP50 above 95% except the RoI Transformer. Additionally, the recall remained above 97% for all networks except the Rotated FCOS and RoI Transformer, and precision remained above 90% for all networks except the RoI Transformer. Notably, Oriented RepPoints demonstrated the best performance, maintaining the highest mAP across different definitions.
Figure 19 illustrates the detection results of various algorithms in typical scenes. The first and second rows depict the background of strongly scattering buildings, while the third row presents a dense scene with trees. The fourth row displays easily confused small objects, and the fifth and sixth rows depict cluttered scenes. Finally, the seventh row displays MSTAR chips. In urban scenarios, all algorithms exhibited instances of missing detections and false alarms.
6.3. Additional Experiments
We conducted two additional experiments, and the details are as follows:
- 1.
- An experimental test to establish baseline metrics for two different scenarios: urban and MSTAR simple. The training set comprises data from all scenarios. These metrics can serve as a point of reference for researchers when selecting challenging datasets for their own experiments. As shown in Table 6, the mAP50 score is higher for the MSTAR scene test than for the urban scene, reflecting the greater complexity and interference that exists in urban settings.
- 2.
- To verify the superiority of the SIVED dataset over FARAD and MSTAR, we chose a simple structured Rotated RetinaNet, trained with those three datasets, respectively. We compared the performance of the network trained with those datasets via the specific metric values shown in Table 7. The results show that the constructed SVID dataset improved the network performance.
7. Discussion
As discussed in the previous section, currently available datasets for SAR image target detection are primarily focused on ship targets. However, as ships are much larger than vehicles in terms of physical scale, our dataset is positioned to address the detection of small targets defined based on image pixels. Thus, SIVED would serve as a valuable complement to constructing a multiple-target dataset with various scales. Compared to the typical SAR ship dataset SSDD [21], SIVED offers rich associated information in its annotation file. Although SSDD employs rotatable bounding boxes, the annotation file only includes the position and angle of the target. In contrast, SIVED is annotated with the source of the slices and the basic information of the corresponding sensors, such as band, polarization mode, and resolution. This additional information will be useful in small-target detection research based on SAR imaging mechanisms. SSDD contains 1160 chips and 2587 ship targets, with an average of two targets per chip. On the other hand, SIVED’s urban area comprises 721 chips and 6845 vehicle targets, indicating an average of nine targets per chip. This suggests that SIVED’s distribution of targets is denser while the target capacity is larger, which puts forward a higher challenge for the positioning accuracy of the detection algorithm. Furthermore, rich land features and clutters constitute a complex background.
The characteristics of vehicles in SAR imaging are closely related to the wavelength of the band used. Typically, longer wavelengths lead to a deeper penetration but worse characterization ability for target details, whereas shorter wavelengths result in a weaker penetration but better characterization ability for target details. In this paper, we constructed a dataset of Ka, Ku, and X bands, with sequential increases in their wavelengths. Figure 20 shows the imaging results of different bands in FARAD, and it is evident that the vehicles in Ka-band images exhibit more texture features than those in X-band images. The inclusion of images of different bands indicates that the features become rich, enabling the network to learn more knowledge and improve the generalization ability. In addition, due to the side-view imaging of SAR and the penetration of the microwave, it can form a mixed area of vehicles and trees as shown in Figure 7, where the pixel information is formed by the combination of trees and vehicles, and the vehicle targets in the above scenes are labeled, which further enriches the features of the dataset while making full use of SAR imaging characteristics.
As a high recall indicates a high rate of target detection, the results of the experiment in Table 4 suggest that the dataset is relatively stable. However, the precision does not reach the same level as the recall, resulting in more false alarms, which means that the background was wrongly identified as the target. This finding verifies the complexity of the dataset’s background. It provides further evidence that the dataset is challenging but still maintains stability. Generally, the one-stage network has a lower detection accuracy compared to the two-stage network since the two-stage network distinguishes the background from the target in the RPN, whereas the one-stage network performs regression directly, resulting in an imbalance between the categories of background and target. Nonetheless, Oriented RepPoints utilizes the Focal Loss in RetinaNet to provide appropriate weight control to cross-entropy loss and focus loss calculation on target categories, which improves upon the influence caused by the imbalance between background and target. Combined with the adaptive improvements for rotatable bounding box regression, it thus obtains the highest performance.
The visual detection results presented in Figure 18 reveal that the phenomenon of missing detection and false alarm exists in the detection results of different algorithms. This finding is in line with the actual scenario, where there is greater interference and difficulty in distinguishing dense targets in urban environments, ultimately highlighting the challenge of the dataset.
When constructing SIVED, multiple sources of data are used, making full use of the SAR imaging mechanism, and sensor information is recorded during annotation, which endows the dataset with richness. Compared with the typical ship dataset, SIVED mainly focuses on small targets, and contains more dense scenes and complex backgrounds, which make the dataset challenging. The targets are distributed at different angles, and the different algorithms maintain high recall values in the experiment, which demonstrates the stability of the dataset. In summary, SIVED exhibits three properties: richness, stability, and challenge.
8. Conclusions
This paper presents the construction of a new SAR image vehicle detection dataset, named SIVED, which addresses the lack of rich scene datasets in the field. It includes 120,133 vehicle targets and more than 270 dense scene chips. Targets are annotated by rotatable bounding boxes, which improve localization accuracy and reduce interference from background and adjacent targets, and a semi-automatic annotation method is proposed to improve efficiency. Robust baselines are created through eight models in a unified framework. SIVED has three main properties: richness, reliability, and challenge. It comprises complex urban context and rich dense scenes, which are not available in other SAR datasets. Although the images currently in use are limited, we believe SIVED will be a valuable resource for advancing the development of vehicle detection technology for SAR imagery. We will also make further additions to the dataset in the future.
Author Contributions
Conceptualization, X.L. and B.Z.; methodology, X.L.; software, X.L.; validation, B.Z.; formal analysis, X.L.; investigation, B.Z.; resources, B.Z.; data curation, X.L.; data analysis, Y.Y. and H.C.; writing—original draft reparation, X.L.; writing—review and editing, B.Z. and F.W.; visualization, X.L.; supervision, B.Z.; project administration, C.W. and B.Z.; funding acquisition, C.W. All authors have read and agreed to the published version of the manuscript.
Funding
This research was funded by the National Natural Science Foundation of China (Grant No. 41930110).
Data Availability Statement
The dataset was shared on the GitHub web for researchers. The link is https://github.com/CAESAR-Radi/SIVED (accessed on 15 May 2023).
Acknowledgments
The authors would like to thank Sandia National Laboratory (USA) for providing public MiniSAR and FARAD data online and the U.S. Air Force for providing MSTAR data online.
Conflicts of Interest
The authors declare no conflict of interest.
References
- Jiao, J.; Zhang, Y.; Sun, H.; Yang, X.; Gao, X.; Hong, W.; Fu, K.; Sun, X. A densely connected end-to-end neural network for multiscale and multiscene SAR ship detection. IEEE Access 2018, 6, 20881–20892. [Google Scholar] [CrossRef]
- Cui, Z.; Li, Q.; Cao, Z.; Liu, N. Dense attention pyramid networks for multi-scale ship detection in SAR images. IEEE Trans. Geosci. Remote Sens. 2019, 57, 8983–8997. [Google Scholar] [CrossRef]
- Zhang, T.; Zhang, X.; Liu, C.; Shi, J.; Wei, S.; Ahmad, I.; Zhan, X.; Zhou, Y.; Pan, D.; Li, J. Balance learning for ship detection from synthetic aperture radar remote sensing imagery. ISPRS J. Photogramm. Remote Sens. 2021, 182, 190–207. [Google Scholar] [CrossRef]
- Zhang, T.; Zhang, X. High-speed ship detection in SAR images based on a grid convolutional neural network. Remote Sens. 2019, 11, 1206. [Google Scholar] [CrossRef]
- Zhang, T.; Zhang, X.; Shi, J.; Wei, S. Depthwise separable convolution neural network for high-speed SAR ship detection. Remote Sens. 2019, 11, 2483. [Google Scholar] [CrossRef]
- Zhang, T.; Zhang, X.; Shi, J.; Wei, S. HyperLi-Net: A hyper-light deep learning network for high-accurate and high-speed ship detection from synthetic aperture radar imagery. ISPRS J. Photogramm. Remote Sens. 2020, 167, 123–153. [Google Scholar] [CrossRef]
- An, Q.; Pan, Z.; Liu, L.; You, H. DRBox-v2: An improved detector with rotatable boxes for target detection in SAR images. IEEE Trans. Geosci. Remote Sens. 2019, 57, 8333–8349. [Google Scholar] [CrossRef]
- Chen, C.; He, C.; Hu, C.; Pei, H.; Jiao, L. MSARN: A deep neural network based on an adaptive recalibration mechanism for multiscale and arbitrary-oriented SAR ship detection. IEEE Access 2019, 7, 159262–159283. [Google Scholar] [CrossRef]
- Chen, S.; Zhang, J.; Zhan, R. R2FA-Det: Delving into high-quality rotatable boxes for ship detection in SAR images. Remote Sens. 2020, 12, 2031. [Google Scholar] [CrossRef]
- Xu, C.; Zhang, B.; Gao, J.; Wu, F.; Zhang, H.; Wang, C. FCOSR: An anchor-free method for arbitrary-oriented ship detection in SAR images. J. Radars 2022, 11, 1–12. [Google Scholar] [CrossRef]
- He, C.; Tu, M.; Xiong, D.; Tu, F.; Liao, M. A Component-Based Multi-Layer Parallel Network for Airplane Detection in SAR Imagery. Remote Sens. 2018, 10, 1016. [Google Scholar] [CrossRef]
- Wang, J.; Xiao, H.; Chen, L.; Xing, J.; Pan, Z.; Luo, R.; Cai, X. Integrating weighted feature fusion and the spatial attention module with convolutional neural networks for automatic aircraft detection from SAR images. Remote Sens. 2021, 13, 910. [Google Scholar] [CrossRef]
- Zhao, Y.; Zhao, L.; Liu, Z.; Hu, D.; Kuang, G.; Liu, L. Attentional Feature Refinement and Alignment Network for Aircraft Detection in SAR Imagery. IEEE Trans. Geosci. Remote Sens. 2021, 60, 1–16. [Google Scholar] [CrossRef]
- Zhang, P.; Xu, H.; Tian, T.; Gao, P.; Li, L.; Zhao, T.; Zhang, N.; Tian, J. SEFEPNet: Scale Expansion and Feature Enhancement Pyramid Network for SAR Aircraft Detection with Small Sample Dataset. IEEE J. Sel. Top. Appl. Earth Obs. Remote Sens. 2022, 15, 3365–3375. [Google Scholar] [CrossRef]
- Bao, W.; Hu, J.; Huang, M.; Xu, Y.; Ji, N.; Xiang, X. Detecting Fine-Grained Airplanes in SAR Images With Sparse Attention-Guided Pyramid and Class-Balanced Data Augmentation. IEEE J. Sel. Top. Appl. Earth Obs. Remote Sens. 2022, 15, 8586–8599. [Google Scholar] [CrossRef]
- Ma, C.; Zhang, Y.; Guo, J.; Hu, Y.; Geng, X.; Li, F.; Lei, B.; Ding, C. End-to-end method with transformer for 3-D detection of oil tank from single SAR image. IEEE Trans. Geosci. Remote Sens. 2021, 60, 1–19. [Google Scholar] [CrossRef]
- Wu, Q.; Zhang, B.; Xu, C.; Zhang, H.; Wang, C. Dense Oil Tank Detection and Classification via YOLOX-TR Network in Large-Scale SAR Images. Remote Sens. 2022, 14, 3246. [Google Scholar] [CrossRef]
- Xu, X.; Zhang, X.; Zhang, T.; Yang, Z.; Shi, J.; Zhan, X. Shadow-Background-Noise 3D Spatial Decomposition Using Sparse Low-Rank Gaussian Properties for Video-SAR Moving Target Shadow Enhancement. IEEE Geosci. Remote Sens. Lett. 2022, 19, 1–5. [Google Scholar] [CrossRef]
- Wang, Y.; Wang, C.; Zhang, H.; Dong, Y.; Wei, S. A SAR dataset of ship detection for deep learning under complex backgrounds. Remote Sens. 2019, 11, 765. [Google Scholar] [CrossRef]
- Wei, S.; Zeng, X.; Qu, Q.; Wang, M.; Su, H.; Shi, J. HRSID: A high-resolution SAR images dataset for ship detection and instance segmentation. IEEE Access 2020, 8, 120234–120254. [Google Scholar] [CrossRef]
- Zhang, T.; Zhang, X.; Li, J.; Xu, X.; Wang, B.; Zhan, X.; Xu, Y.; Ke, X.; Zeng, T.; Su, H. Sar ship detection dataset (ssdd): Official release and comprehensive data analysis. Remote Sens. 2021, 13, 3690. [Google Scholar] [CrossRef]
- Xu, C.; Su, H.; Li, J.; Liu, Y.; Yao, L.; Gao, L.; Yan, W.; Wang, T. RSDD-SAR: Rotated ship detection dataset in SAR images. J. Radars 2022, 11, 581–599. [Google Scholar] [CrossRef]
- Zhang, T.; Zhang, X.; Ke, X.; Zhan, X.; Shi, J.; Wei, S.; Pan, D.; Li, J.; Su, H.; Zhou, Y. Ls-ssdd-v1. 0: A deep learning dataset dedicated to small ship detection from large-scale sentinel-1 sar images. Remote Sens. 2020, 12, 2997. [Google Scholar] [CrossRef]
- Keydel, E.R.; Lee, S.W.; Moore, J.T. MSTAR extended operating conditions: A tutorial. In Proceedings of the SPIE 2757, Algorithm for Synthetic Aperture Radar Imagery III, Orlando, FL, USA, 10–12 April 1996; SPIE: Bellingham, WA, USA, 1996; pp. 228–242. [Google Scholar] [CrossRef]
- Long, Y.; Jiang, X.; Liu, X.; Zhang, Y. Sar Atr with Rotated Region Based on Convolution Neural Network. In Proceedings of the IGARSS 2019—2019 IEEE International Geoscience and Remote Sensing Symposium, Yokohama, Japan, 28 July–2 August 2019. [Google Scholar] [CrossRef]
- Zhang, X.; Chai, X.; Chen, Y.; Yang, Z.; Liu, G.; He, A.; Li, Y. A Novel Data Augmentation Method for SAR Image Target Detection and Recognition. In Proceedings of the 2021 IEEE International Geoscience and Remote Sensing Symposium IGARSS, Brussels, Belgium, 11–16 July 2021; pp. 3581–3584. [Google Scholar] [CrossRef]
- Sun, Y.; Wang, W.; Zhang, Q.; Ni, H.; Zhang, X. Improved YOLOv5 with transformer for large scene military vehicle detection on SAR image. In Proceedings of the 2022 7th International Conference on Image, Vision and Computing (ICIVC), Xi’an, China, 26–28 July 2022; pp. 87–93. [Google Scholar] [CrossRef]
- Complex SAR Data. Available online: https://www.sandia.gov/radar/pathfinder-radar-isr-and-synthetic-aperture-radar-sar-systems/complex-data/ (accessed on 11 October 2022).
- Wang, Z.; Du, L.; Mao, J.; Liu, B.; Yang, D. SAR target detection based on SSD with data augmentation and transfer learning. IEEE Geosci. Remote Sens. Lett. 2018, 16, 150–154. [Google Scholar] [CrossRef]
- Zou, B.; Qin, J.; Zhang, L. Vehicle detection based on semantic-context enhancement for high-resolution SAR images in complex background. IEEE Geosci. Remote Sens. Lett. 2021, 19, 1–5. [Google Scholar] [CrossRef]
- Tang, T.; Wang, Y.; Liu, H.; Zou, S. CFAR-Guided Dual-Stream Single-Shot Multibox Detector for Vehicle Detection in SAR Images. IEEE Geosci. Remote Sens. Lett. 2022, 19, 1–5. [Google Scholar] [CrossRef]
- Xia, G.-S.; Bai, X.; Ding, J.; Zhu, Z.; Belongie, S.; Luo, J.; Datcu, M.; Pelillo, M.; Zhang, L. DOTA: A large-scale dataset for object detection in aerial images. In Proceedings of the IEEE Conference on Computer Vision and Pattern Recognition, Salt Lake City, UT, USA, 18–23 June 2018; pp. 3974–3983. [Google Scholar] [CrossRef]
- Everingham, M.; Van Gool, L.; Williams, C.K.; Winn, J.; Zisserman, A. The pascal visual object classes (voc) challenge. Int. J. Comput. Vis. 2009, 88, 303–308. [Google Scholar] [CrossRef]
- Ward, K. Compound representation of high resolution sea clutter. Electron. Lett. 1981, 7, 561–565. [Google Scholar] [CrossRef]
- Canny, J. A computational approach to edge detection. IEEE Trans. Pattern Anal. Mach. Intell. 1986, 6, 679–698. [Google Scholar] [CrossRef]
- Lin, T.-Y.; Maire, M.; Belongie, S.; Hays, J.; Perona, P.; Ramanan, D.; Dollár, P.; Zitnick, C.L. Microsoft coco: Common objects in context. In Proceedings of the Computer Vision–ECCV 2014: 13th European Conference, Zurich, Switzerland, 6–12 September 2014; Proceedings, Part V 13, 2014. pp. 740–755. [Google Scholar] [CrossRef]
- Simonyan, K.; Zisserman, A. Very Deep Convolutional Networks for Large-Scale Image Recognition. In Proceedings of the International Conference on Learning Representations (ICLR), San Diego, CA, USA, 7–9 May 2015. [Google Scholar] [CrossRef]
- He, K.; Zhang, X.; Ren, S.; Sun, J. Deep residual learning for image recognition. In Proceedings of the Proceedings of the IEEE Conference on Computer Vision and Pattern Recognition, Las Vegas, NV, USA, 26 June–1 July 2016; pp. 770–778. [Google Scholar] [CrossRef]
- Lin, T.-Y.; Dollár, P.; Girshick, R.; He, K.; Hariharan, B.; Belongie, S. Feature pyramid networks for object detection. In Proceedings of the IEEE Conference on Computer Vision and Pattern Recognition, Honolulu, HI, USA, 21–26 July 2017; pp. 2117–2125. [Google Scholar] [CrossRef]
- Ren, S.; He, K.; Girshick, R.; Sun, J. Faster r-cnn: Towards real-time object detection with region proposal networks. IEEE Trans. Pattern Anal. Mach. Intell. 2017, 39, 1137–1149. [Google Scholar] [CrossRef]
- Lin, T.-Y.; Goyal, P.; Girshick, R.; He, K.; Dollár, P. Focal loss for dense object detection. In Proceedings of the IEEE International Conference on Computer Vision, Venice, Italy, 22–29 October 2017; pp. 2980–2988. [Google Scholar] [CrossRef]
- Tian, Z.; Shen, C.; Chen, H.; He, T. Fcos: Fully convolutional one-stage object detection. In Proceedings of the IEEE/CVF International Conference on Computer Vision, Seoul, Republic of Korea, 27 October–2 November 2019; pp. 9627–9636. [Google Scholar] [CrossRef]
- Han, J.; Ding, J.; Li, J.; Xia, G.-S. Align deep features for oriented object detection. IEEE Trans. Geosci. Remote Sens. 2021, 60, 1–11. [Google Scholar] [CrossRef]
- Ding, J.; Xue, N.; Long, Y.; Xia, G.-S.; Lu, Q. Learning roi transformer for oriented object detection in aerial images. In Proceedings of the IEEE/CVF Conference on Computer Vision and Pattern Recognition, Long Beach, CA, USA, 15–20 June 2019; pp. 2849–2858. [Google Scholar] [CrossRef]
- Xu, Y.; Fu, M.; Wang, Q.; Wang, Y.; Chen, K.; Xia, G.-S.; Bai, X. Gliding vertex on the horizontal bounding box for multi-oriented object detection. IEEE Trans. Pattern Anal. Mach. Intell. 2020, 43, 1452–1459. [Google Scholar] [CrossRef] [PubMed]
- Li, W.; Chen, Y.; Hu, K.; Zhu, J. Oriented reppoints for aerial object detection. In Proceedings of the IEEE/CVF Conference on Computer Vision and Pattern Recognition, New Orleans, LA, USA, 18–24 June 2022; pp. 1829–1838. [Google Scholar] [CrossRef]
- Yang, X.; Yang, X.; Yang, J.; Ming, Q.; Wang, W.; Tian, Q.; Yan, J. Learning high-precision bounding box for rotated object detection via kullback-leibler divergence. Adv. Neural Inf. Process. Syst. 2021, 34, 18381–18394. [Google Scholar] [CrossRef]
- Lin, Z.; Ji, K.; Leng, X.; Kuang, G. Squeeze and excitation rank faster R-CNN for ship detection in SAR images. IEEE Geosci. Remote Sens. Lett. 2018, 16, 751–755. [Google Scholar] [CrossRef]
- Wang, Y.; Wang, C.; Zhang, H.; Dong, Y.; Wei, S. Automatic ship detection based on RetinaNet using multi-resolution Gaofen-3 imagery. Remote Sens. 2019, 11, 531. [Google Scholar] [CrossRef]
- Sun, Z.; Dai, M.; Leng, X.; Lei, Y.; Xiong, B.; Ji, K.; Kuang, G. An anchor-free detection method for ship targets in high-resolution SAR images. IEEE J. Sel. Top. Appl. Earth Obs. Remote Sens. 2021, 14, 7799–7816. [Google Scholar] [CrossRef]
- Zhou, Y.; Yang, X.; Zhang, G.; Wang, J.; Liu, Y.; Hou, L.; Jiang, X.; Liu, X.; Yan, J.; Lyu, C. Mmrotate: A rotated object detection benchmark using pytorch. In Proceedings of the 30th ACM International Conference on Multimedia, Lisbon, Portugal, 10 October 2022; pp. 7331–7334. [Google Scholar] [CrossRef]
Figure 1.
The chips with the size of 512 × 512 in SIVED. (a) Vehicles in different urban scenarios; (b) MSTAR chips after splicing.
Figure 1.
The chips with the size of 512 × 512 in SIVED. (a) Vehicles in different urban scenarios; (b) MSTAR chips after splicing.

Figure 2.
Presentation of annotation example. (a) Visualization of target annotation; (b) presentation of annotation TXT file.
Figure 2.
Presentation of annotation example. (a) Visualization of target annotation; (b) presentation of annotation TXT file.

Figure 3.
Presentation of an annotation XML file.

Figure 4.
The construction workflow of SIVED, * represents file name.

Figure 5.
The presentation of vehicles that cannot be extracted effectively: (a) area 1; (b) area 2.
Figure 5.
The presentation of vehicles that cannot be extracted effectively: (a) area 1; (b) area 2.

Figure 6.
Example of a small building easily confused with vehicle targets in (a) SAR image and (b) Google Earth.
Figure 6.
Example of a small building easily confused with vehicle targets in (a) SAR image and (b) Google Earth.

Figure 7.
Example in regions where trees and vehicles overlap each other, red boxes represent labeled vehicles: (a) completely covered but visible situation; (b) partially covered and partially visible case.
Figure 7.
Example in regions where trees and vehicles overlap each other, red boxes represent labeled vehicles: (a) completely covered but visible situation; (b) partially covered and partially visible case.

Figure 8.
Structure of SIVED, * represents file name.

Figure 9.
Statistical chart of vehicle scale size in SIVED: (a) entire dataset; (b) training set; (c) valid set; (d) test set.
Figure 9.
Statistical chart of vehicle scale size in SIVED: (a) entire dataset; (b) training set; (c) valid set; (d) test set.

Figure 10.
Rotatable bounding box long edge definition method.

Figure 11.
Statistical chart of vehicle angle in SIVED: (a) entire dataset; (b) training set; (c) valid set; (d) test set.
Figure 11.
Statistical chart of vehicle angle in SIVED: (a) entire dataset; (b) training set; (c) valid set; (d) test set.

Figure 12.
The architecture of the object detection framework.

Figure 13.
The architecture of Faster R-CNN.

Figure 14.
The architecture of RetinaNet.

Figure 15.
The architecture of FCOS.

Figure 16.
The architecture of S2A-Net.

Figure 17.
Parameter representation of Gliding Vertex.

Figure 18.
The architecture of Oriented RepPoints.

Figure 19.
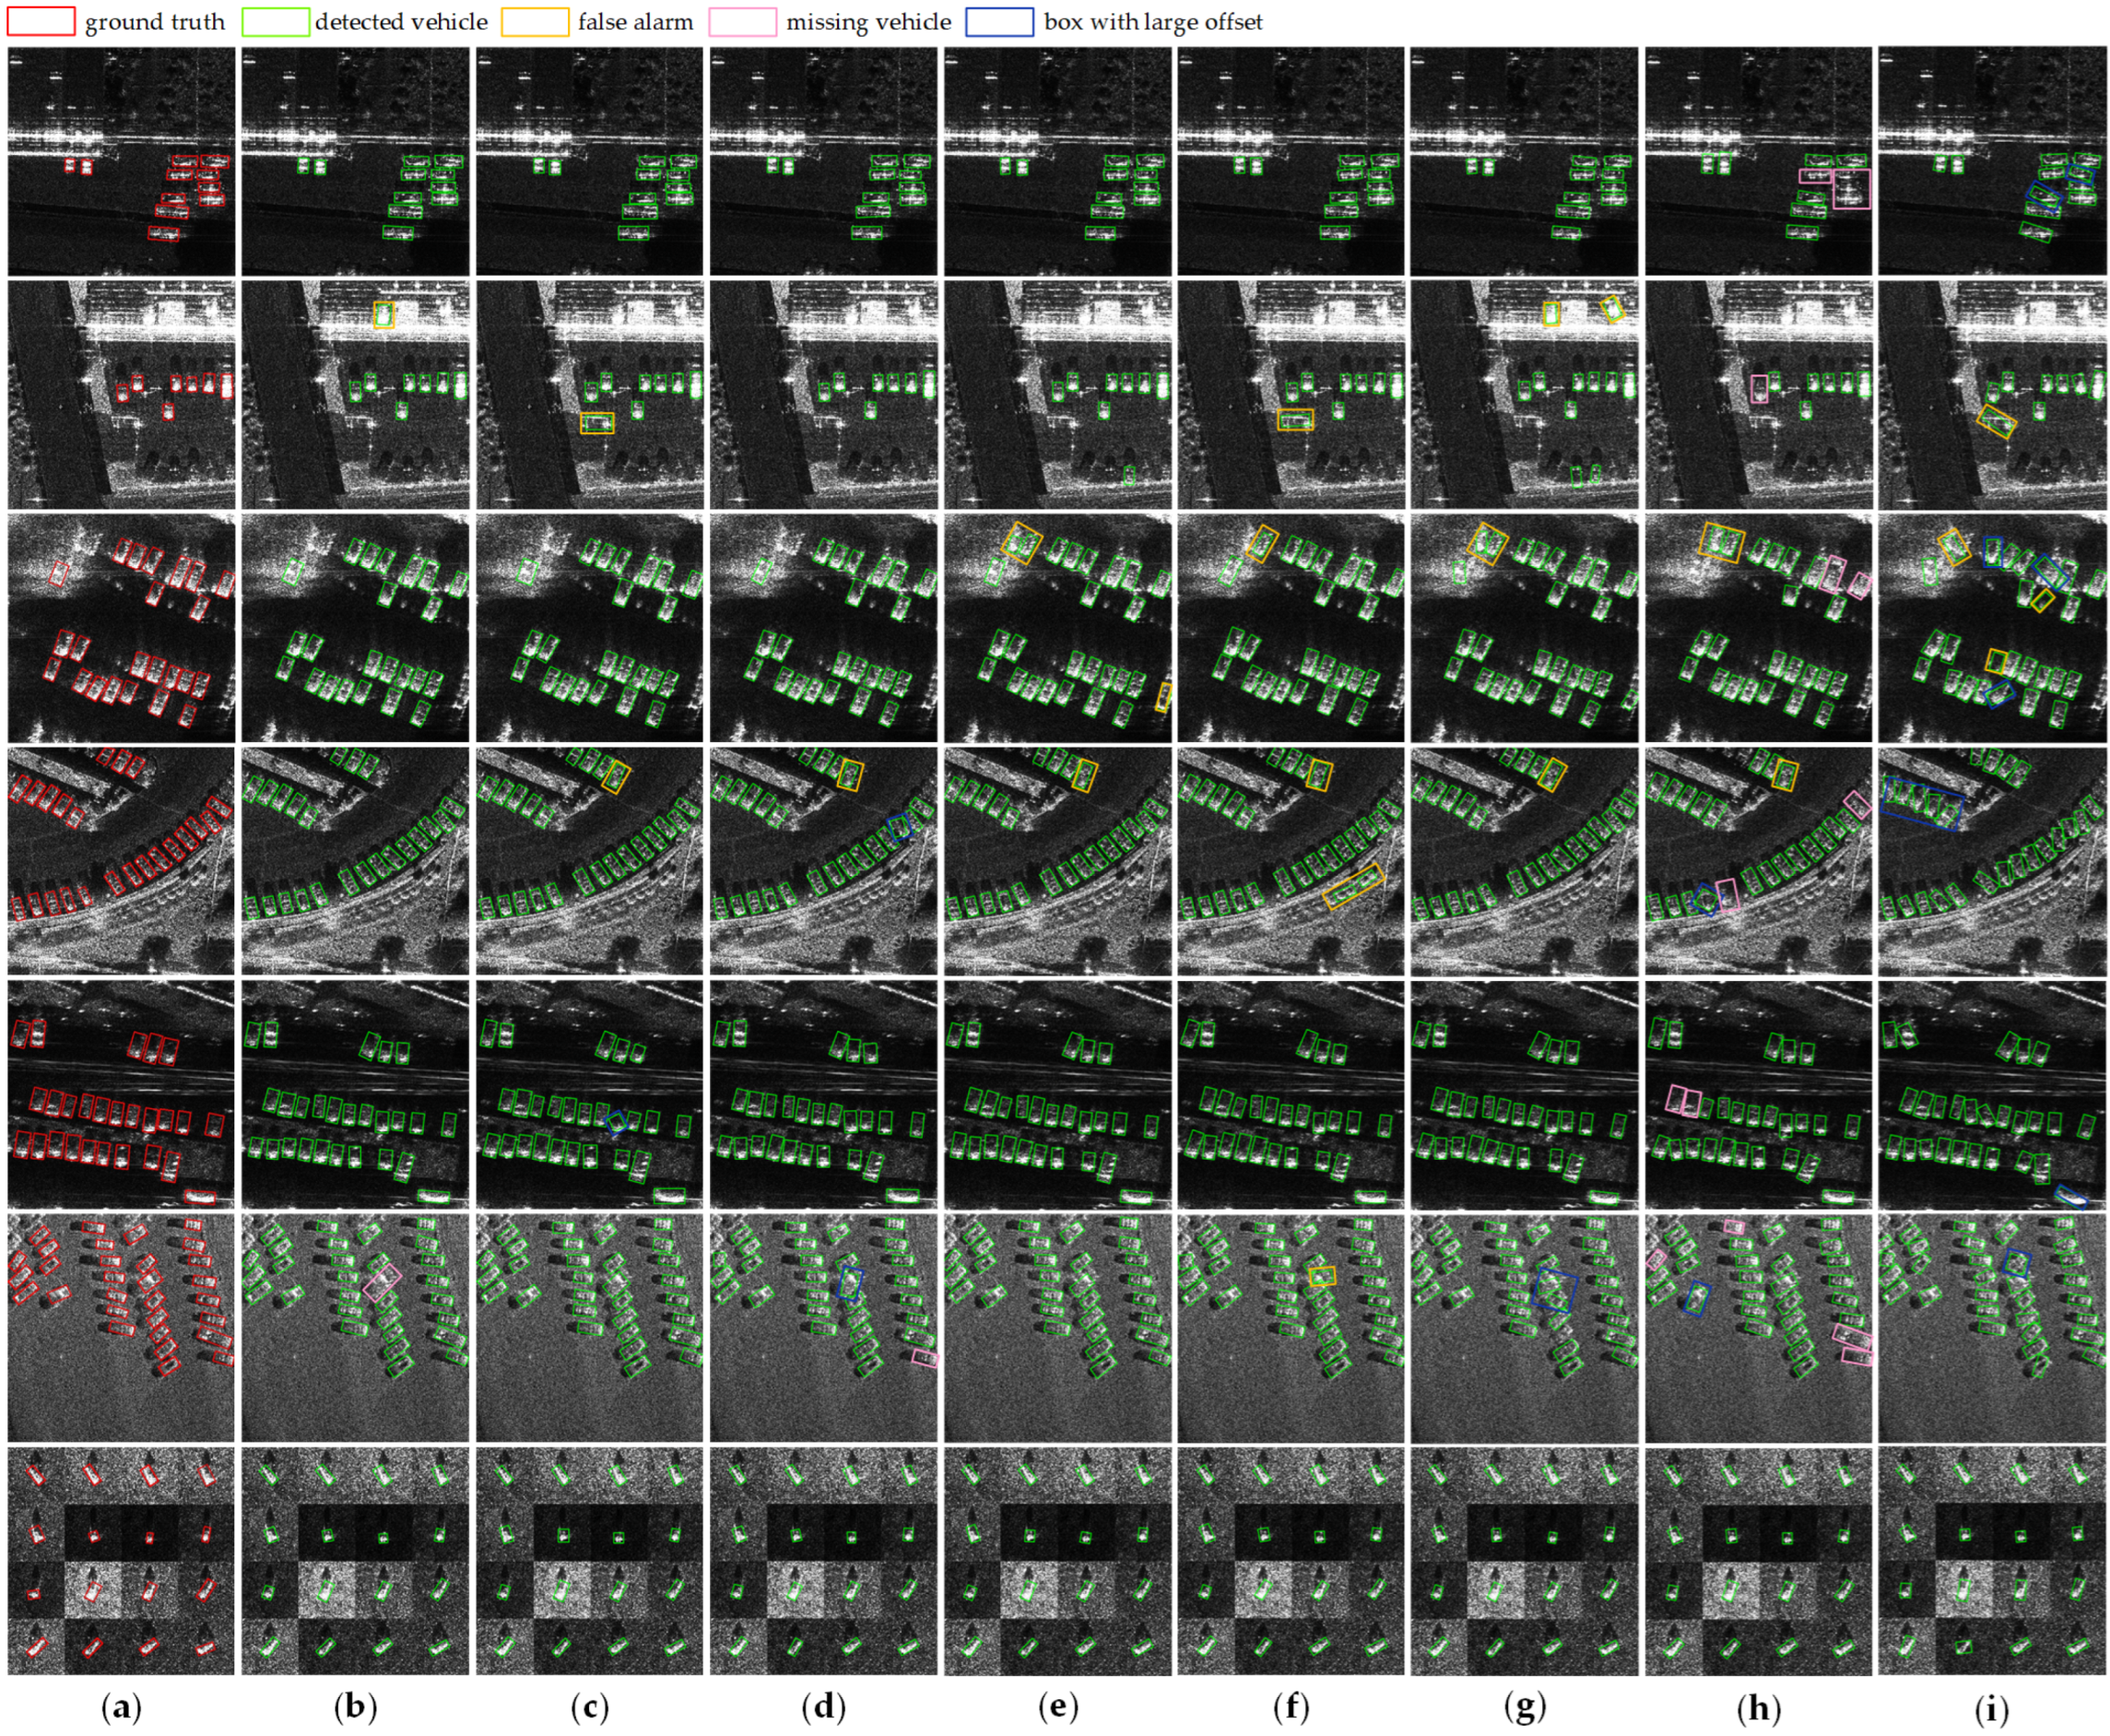
Ground truth and detection results of eight detection networks. The red boxes in the first column represent ground truths, while the green boxes in other columns denote detected vehicles. False alarms are shown in yellow boxes, missing vehicles in pink boxes, and bounding boxes with large offsets in blue boxes. (a) Ground truth; (b) Oriented RepPoints; (c) Gliding Vertex; (d) Rotated Faster R-CNN; (e) KLD; (f) Rotated RetinaNet; (g) S2A-Net; (h) Rotated FCOS; (i) RoI Transformer.
Figure 19.
Ground truth and detection results of eight detection networks. The red boxes in the first column represent ground truths, while the green boxes in other columns denote detected vehicles. False alarms are shown in yellow boxes, missing vehicles in pink boxes, and bounding boxes with large offsets in blue boxes. (a) Ground truth; (b) Oriented RepPoints; (c) Gliding Vertex; (d) Rotated Faster R-CNN; (e) KLD; (f) Rotated RetinaNet; (g) S2A-Net; (h) Rotated FCOS; (i) RoI Transformer.

Figure 20.
Chips of FARAD of different bands: (a) Ka band; (b) X band.


Table 1.
Basic information of open data.
| Data | Source | Location | Band | Polarization | Resolution |
|---|---|---|---|---|---|
| FARAD | Sandia National Laboratory | Albuquerque, NM, USA | Ka/X | VV/HH | 0.1 m × 0.1 m |
| MiniSAR | Sandia National Laboratory | Albuquerque, NM, USA | Ku | - | 0.1 m × 0.1 m |
| MSTAR | U.S. Air Force | - | X | HH | 0.3 m × 0.3 m |
Table 2.
Statistics on the sub-set number of SIVED in two scenarios.
| Scene | Train | Valid | Test | Total | ||
|---|---|---|---|---|---|---|
| number of chips | urban | 578 | 72 | 71 | 721 | 1044 |
| MSTAR | 259 | 32 | 32 | 323 | ||
| number of vehicles | urban | 5417 | 710 | 718 | 6845 | 12,013 |
| MSTAR | 4144 | 512 | 512 | 5168 | ||
Table 3.
The official definition of the COCO dataset for the size of targets.
| Type | Area |
|---|---|
| Small target | |
| Medium target | |
| Large target |
Table 4.
Definition of metrics.
| Metrics | Explanation |
|---|---|
| mAP | mAP when IOU = 0.5:0.05:0.95 |
| mAP50 | mAP when IOU = 0.5 |
| mAP75 | mAP when IOU = 0.75 |
Table 5.
Metric values of different networks on SIVED.
| Network | Recall * | Precision * | mAP * | mAP75 * | mAP50 * |
|---|---|---|---|---|---|
| RoI Transformer | 95.61 | 84.40 | 37.45 | 16.91 | 93.47 |
| Rotated FCOS | 88.86 | 96.47 | 50.40 | 48.13 | 95.60 |
| S2A-Net | 97.48 | 90.90 | 55.49 | 57.32 | 97.72 |
| Rotated RetinaNet | 97.48 | 92.73 | 53.11 | 50.93 | 97.76 |
| KLD | 98.05 | 93.34 | 57.49 | 64.48 | 97.92 |
| Rotated Faster R-CNN | 97.80 | 95.55 | 56.03 | 59.00 | 98.09 |
| Gliding Vertex | 98.13 | 95.72 | 56.06 | 59.59 | 98.33 |
| Oriented RepPoints | 98.05 | 95.11 | 60.15 | 70.69 | 99.13 |
* All metric values are in percentages (%).
Table 6.
Values of mAP50 in different scenarios.
| Network | mAP50_all * | mAP50_urban * | mAP50_MSTAR * |
|---|---|---|---|
| RoI Transformer | 93.47 | 89.23 | 97.91 |
| Rotated FCOS | 95.60 | 92.19 | 98.86 |
| S2A-Net | 97.72 | 96.69 | 97.91 |
| Rotated RetinaNet | 97.76 | 96.45 | 99.32 |
| KLD | 97.92 | 97.46 | 98.83 |
| Rotated Faster R-CNN | 98.09 | 97.53 | 98.76 |
| Gliding Vertex | 98.33 | 96.71 | 100 |
| Oriented RepPoints | 99.13 | 98.34 | 99.73 |
* All metric values are expressed as percentages (%). The metric mAP50_all indicates that the test set contains data from all scenarios, while mAP50_urban and mAP50_MSTAR indicate that the test sets only contain data from the urban (FARAD and MiniSAR) and MSTAR scenarios, respectively.
Table 7.
Values of mAP50 in different scenarios.
| Training data | mAP50_FARAD * | mAP50_MSTAR * |
|---|---|---|
| FARAD | 96.53 | - |
| MSTAR | - | 99.24 |
| SIVED | 96.77 | 99.32 |
* All metric values are expressed as percentages (%). The metric mAP50_FARAD indicates that the test set only contains data from FARAD, while mAP50_MSTAR indicates that the test set only contains data from MSTAR.
Disclaimer/Publisher’s Note: The statements, opinions and data contained in all publications are solely those of the individual author(s) and contributor(s) and not of MDPI and/or the editor(s). MDPI and/or the editor(s) disclaim responsibility for any injury to people or property resulting from any ideas, methods, instructions or products referred to in the content. |
© 2023 by the authors. Licensee MDPI, Basel, Switzerland. This article is an open access article distributed under the terms and conditions of the Creative Commons Attribution (CC BY) license (https://creativecommons.org/licenses/by/4.0/).
Share and Cite
MDPI and ACS Style
Lin, X.; Zhang, B.; Wu, F.; Wang, C.; Yang, Y.; Chen, H. SIVED: A SAR Image Dataset for Vehicle Detection Based on Rotatable Bounding Box. Remote Sens. 2023, 15, 2825. https://0-doi-org.brum.beds.ac.uk/10.3390/rs15112825
AMA Style
Lin X, Zhang B, Wu F, Wang C, Yang Y, Chen H. SIVED: A SAR Image Dataset for Vehicle Detection Based on Rotatable Bounding Box. Remote Sensing. 2023; 15(11):2825. https://0-doi-org.brum.beds.ac.uk/10.3390/rs15112825
Chicago/Turabian StyleLin, Xin, Bo Zhang, Fan Wu, Chao Wang, Yali Yang, and Huiqin Chen. 2023. "SIVED: A SAR Image Dataset for Vehicle Detection Based on Rotatable Bounding Box" Remote Sensing 15, no. 11: 2825. https://0-doi-org.brum.beds.ac.uk/10.3390/rs15112825
Note that from the first issue of 2016, this journal uses article numbers instead of page numbers. See further details here.