

Improving YOLOv7-Tiny for Infrared and Visible Light Image Object Detection on Drones

National Key Laboratory of Science and Technology on Automatic Target Recognition, College of Electronic Science and Technology, National University of Defense Technology, Changsha 410073, China
*
Author to whom correspondence should be addressed.
Remote Sens. 2023, 15(13), 3214; https://0-doi-org.brum.beds.ac.uk/10.3390/rs15133214
Submission received: 17 April 2023
/
Revised: 17 June 2023
/
Accepted: 18 June 2023
/
Published: 21 June 2023
(This article belongs to the Special Issue Artificial Intelligence-Driven Methods for Remote Sensing Target and Object Detection)
Abstract
:To address the phenomenon of many small and hard-to-detect objects in drone images, this study proposes an improved algorithm based on the YOLOv7-tiny model. The proposed algorithm assigns anchor boxes according to the aspect ratio of ground truth boxes to provide prior information on object shape for the network and uses a hard sample mining loss function (HSM Loss) to guide the network to enhance learning from hard samples. This study finds that the aspect ratio difference of vehicle objects under drone perspective is more obvious than the scale difference, so the anchor boxes assigned by aspect ratio can provide more effective prior information for the network than those assigned by size. This study evaluates the algorithm on a drone image dataset (DroneVehicle) and compares it with other state-of-the-art algorithms. The experimental results show that the proposed algorithm achieves superior average precision values on both infrared and visible light images, while maintaining a light weight.
1. Introduction
Object detection algorithms and drone technology have become increasingly mature and play important roles in many fields, such as traffic management, agricultural irrigation, forest patrol, and battlefield reconnaissance. These tasks can achieve higher accuracy and efficiency by using drones while also reducing casualties. However, many problems still need to be solved for object detection in remote sensing images because of the small object size and complex background in drone perspective. Moreover, the computation of algorithms is restricted by the limited computing power of edge platforms on drones, which poses challenges for their practical application.
Object detection algorithms aim to obtain the location and category of objects in images. In recent years, deep-learning-based object detection algorithms have developed rapidly. General object detection algorithms include two-stage algorithms based on candidate boxes, such as RCNN [1], Fast RCNN [2], Mask RCNN [3], etc. These algorithms first generate several candidate boxes that may contain objects in the image, then classify these candidate boxes, and finally detect all objects in the image: one-stage algorithms based on regression, such as YOLO [4,5,6,7,8,9] series, SSD [10] series, RetinaNet [11], etc. These algorithms divide the image into several cells and directly predict whether each cell contains an object, as well as the category and location of the object. These methods have good detection performance on general object detection datasets such as VOC [12] and COCO [13] datasets. Among them, one-stage algorithms often achieve real-time detection speed and are easier to apply to edge devices. General object detection algorithms use horizontal bounding boxes (HBB) to surround objects, which are simple and intuitive in form but not accurate enough for object localization. Oriented object detection algorithms [14,15,16,17,18,19,20] predict oriented bounding boxes (OBB) to surround objects, which are closer to the shape of objects and can also obtain the motion direction of objects. RoI Transformer [18] is a two-stage object detection algorithm that achieves oriented object detection by transforming a horizontal region of interest (RoI) into a rotated RoI. However, steps such as horizontal candidate box generation, RoI alignment and oriented candidate box generation require a large amount of computation; oriented R-CNN [19] proposes an oriented candidate box generation network (oriented RPN), which reduces the computational cost of generating oriented candidate boxes, but as a two-stage algorithm, it is still difficult to meet real-time detection; S2ANet [20] aligns convolutional features and arbitrary orientation objects through a feature alignment module (FAM) and then uses an oriented detection module (ODM) to achieve one-stage rotation object detection. Oriented bounding boxes require more parameters, and post-processing such as non-maximum suppression (NMS) for oriented bounding boxes is more complex than horizontal bounding boxes, which is unacceptable for embedded devices in terms of computational cost. In addition, some algorithms explore object detection algorithms that fuse infrared and visible light images. D-ViTDet [21] and LAIIFusion [22] use illumination perception modules to perceive the illumination difference in each region of the image, providing more suitable reference for cross-modal image fusion. UA-CMDet [23], RISNet [24], and ECISNet [25] optimize the cross-modal mutual information utilization to improve the detection performance. TSFADet [26] aligns cross-modal objects from translation, scaling, and rotation aspects through a network.
There are some datasets for object detection from a drone perspective, such as [23,27,28,29,30,31]. However, only a small portion of the dataset contains both infrared and visible light images. The VEDAI [29] dataset comprises infrared and visible light dual-band images that include 1200 pairs of images and 9 different ground vehicle categories. The DroneVehicle [23] dataset is the first large-scale cross-modal dataset that covers all time periods under a drone perspective. It contains infrared and visible light dual-modal data that include 28,439 pairs of images and 5 different vehicle categories: car, truck, bus, van, and freight car. The objects are annotated with polygons and there are 953,087 annotations in total. The visible light images have 389,779 cars, 22,123 trucks, 15,333 buses, 11,935 vans, and 13,400 freight cars. The infrared images have 428,086 cars, 25,960 trucks, 16,590 buses, 12,708 vans, and 17,173 freight cars. The images cover scenes during day, evening, and night and show drones at different heights (80 m, 100 m, and 120 m) and angles (15°, 30°, and 45°). Each pair of images undergoes affine transformation and region cropping to ensure that most cross-modal image pairs are aligned. The DroneVehicle dataset is divided into a training set with 17,990 image pairs, a validation set with 1469 image pairs, and a test set with 8980 image pairs. All experiments are conducted in a fair comparison according to the given division method. Because oriented bounding boxes can provide additional direction information compared to horizontal bounding boxes, but they also introduce more complex post-processing operations and larger computational overheads, this paper mainly focuses on object location and algorithm speed; therefore, this paper uses horizontal bounding boxes.
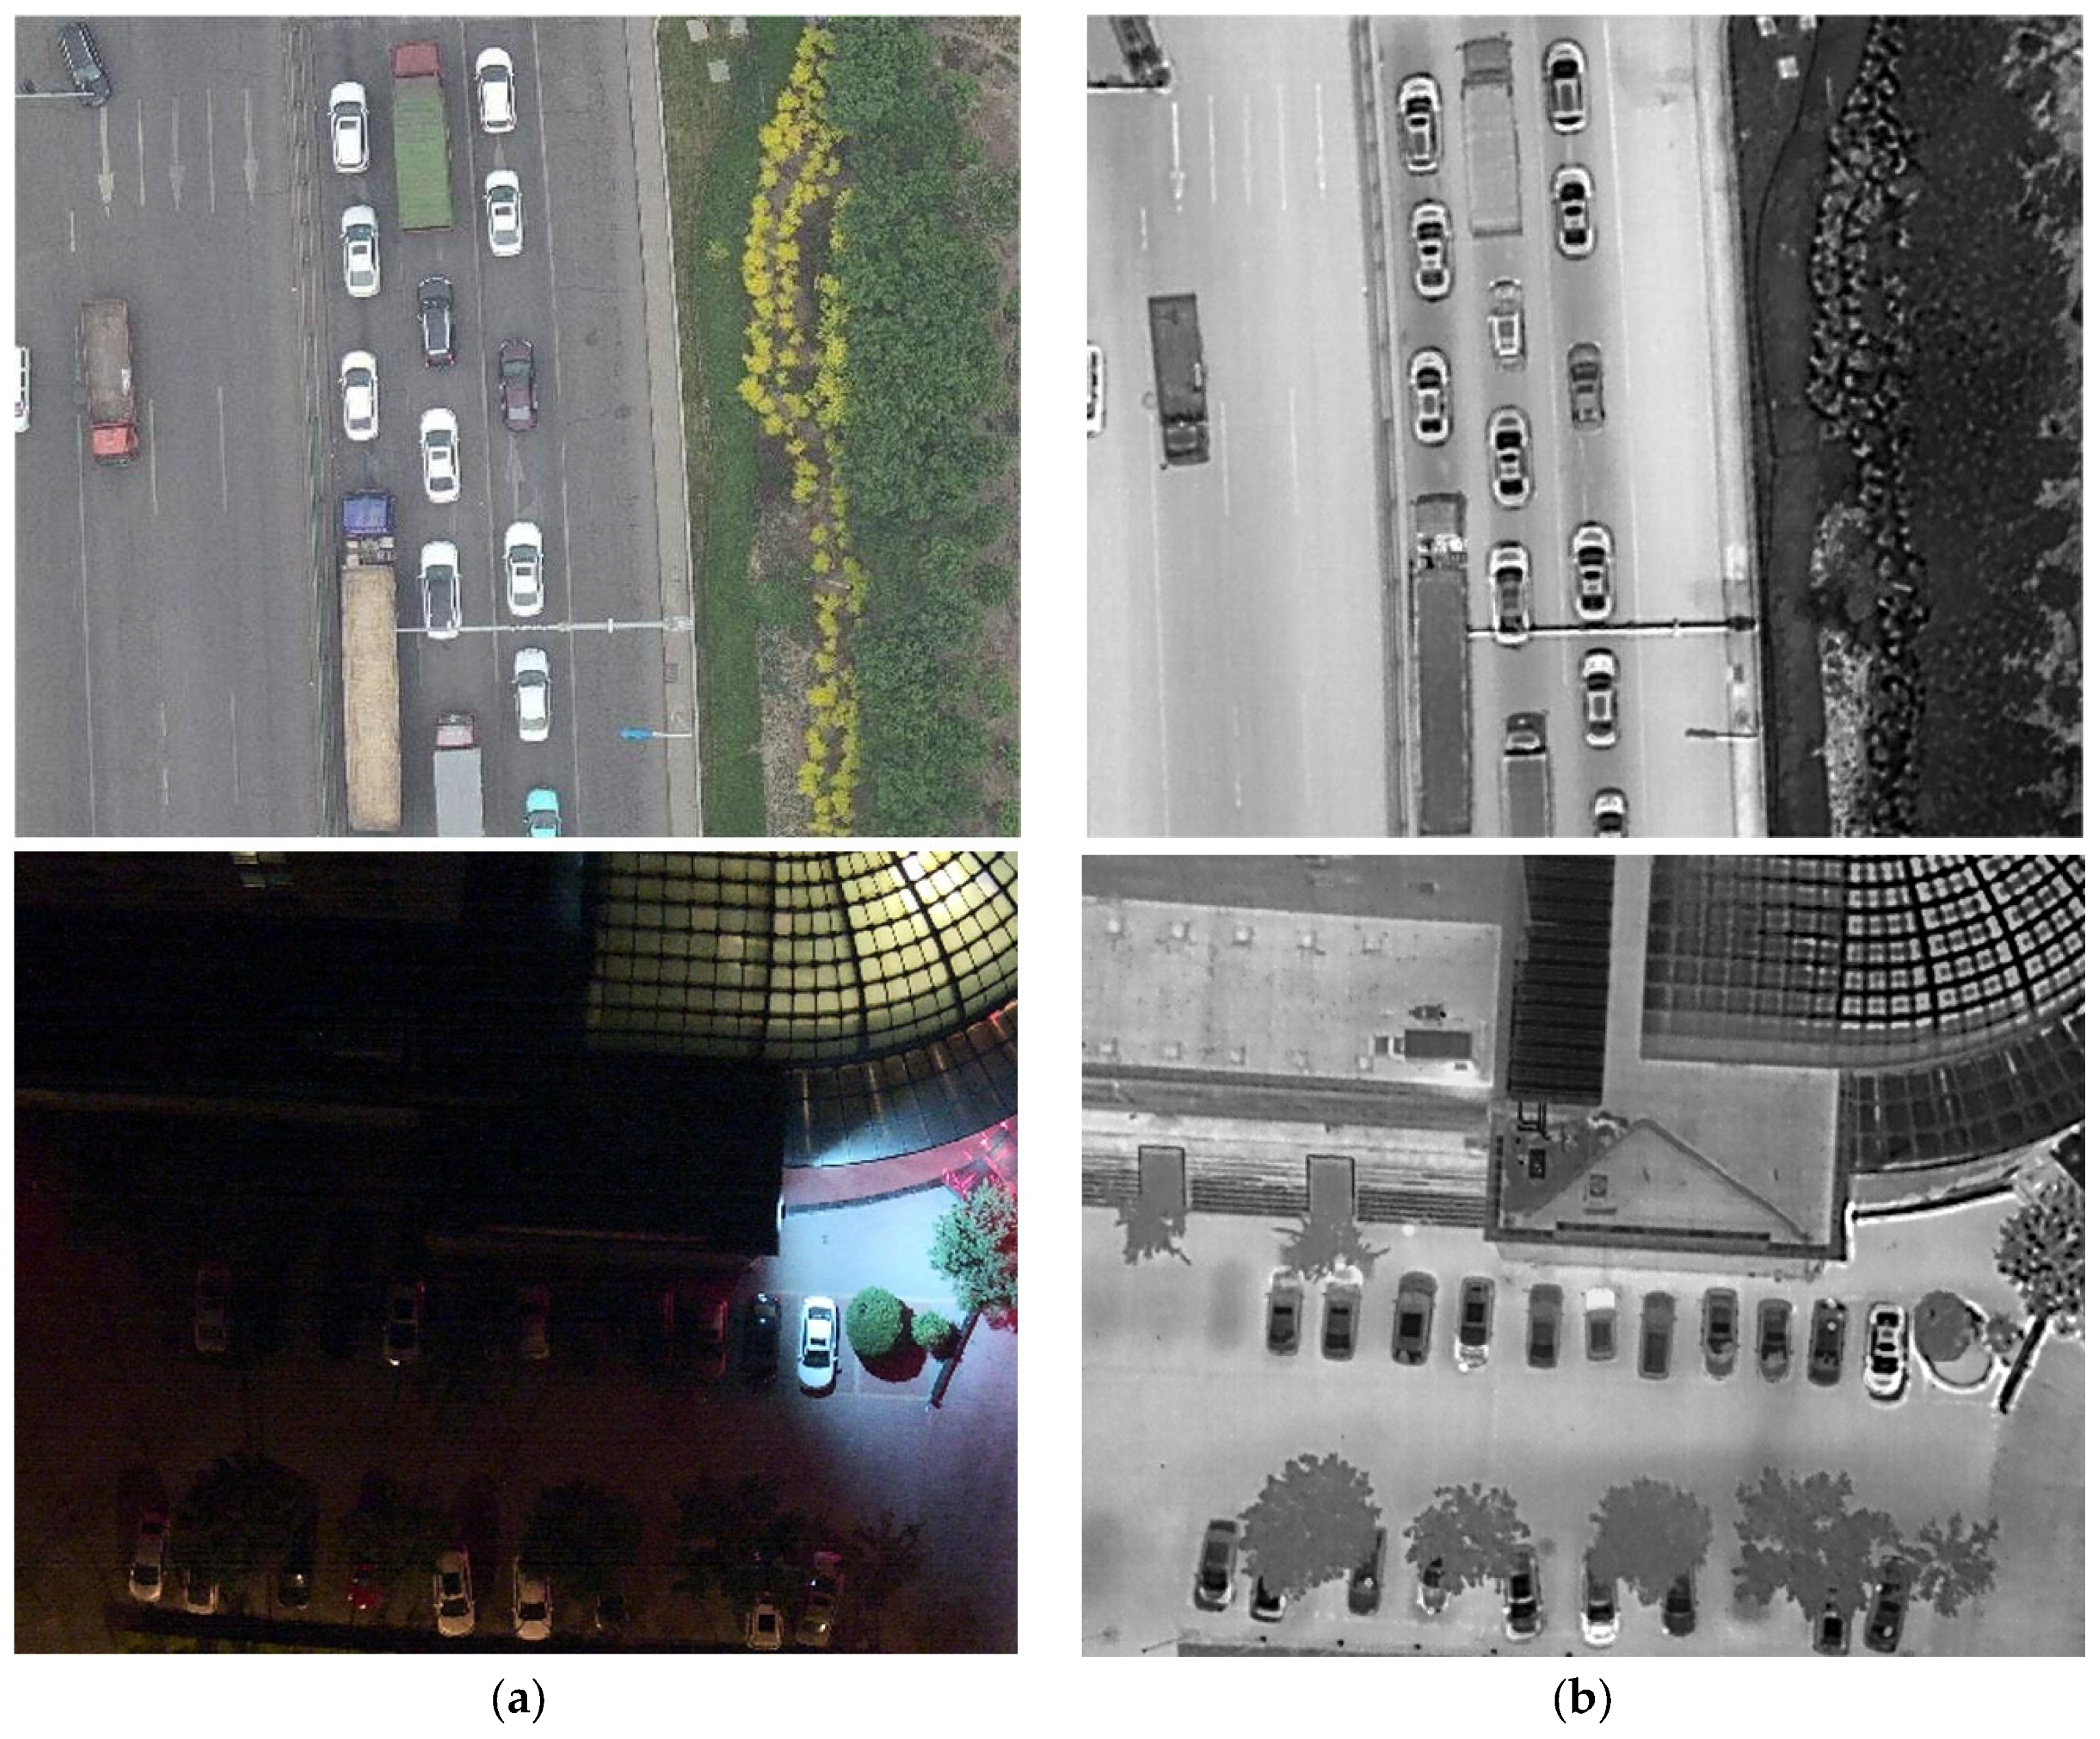
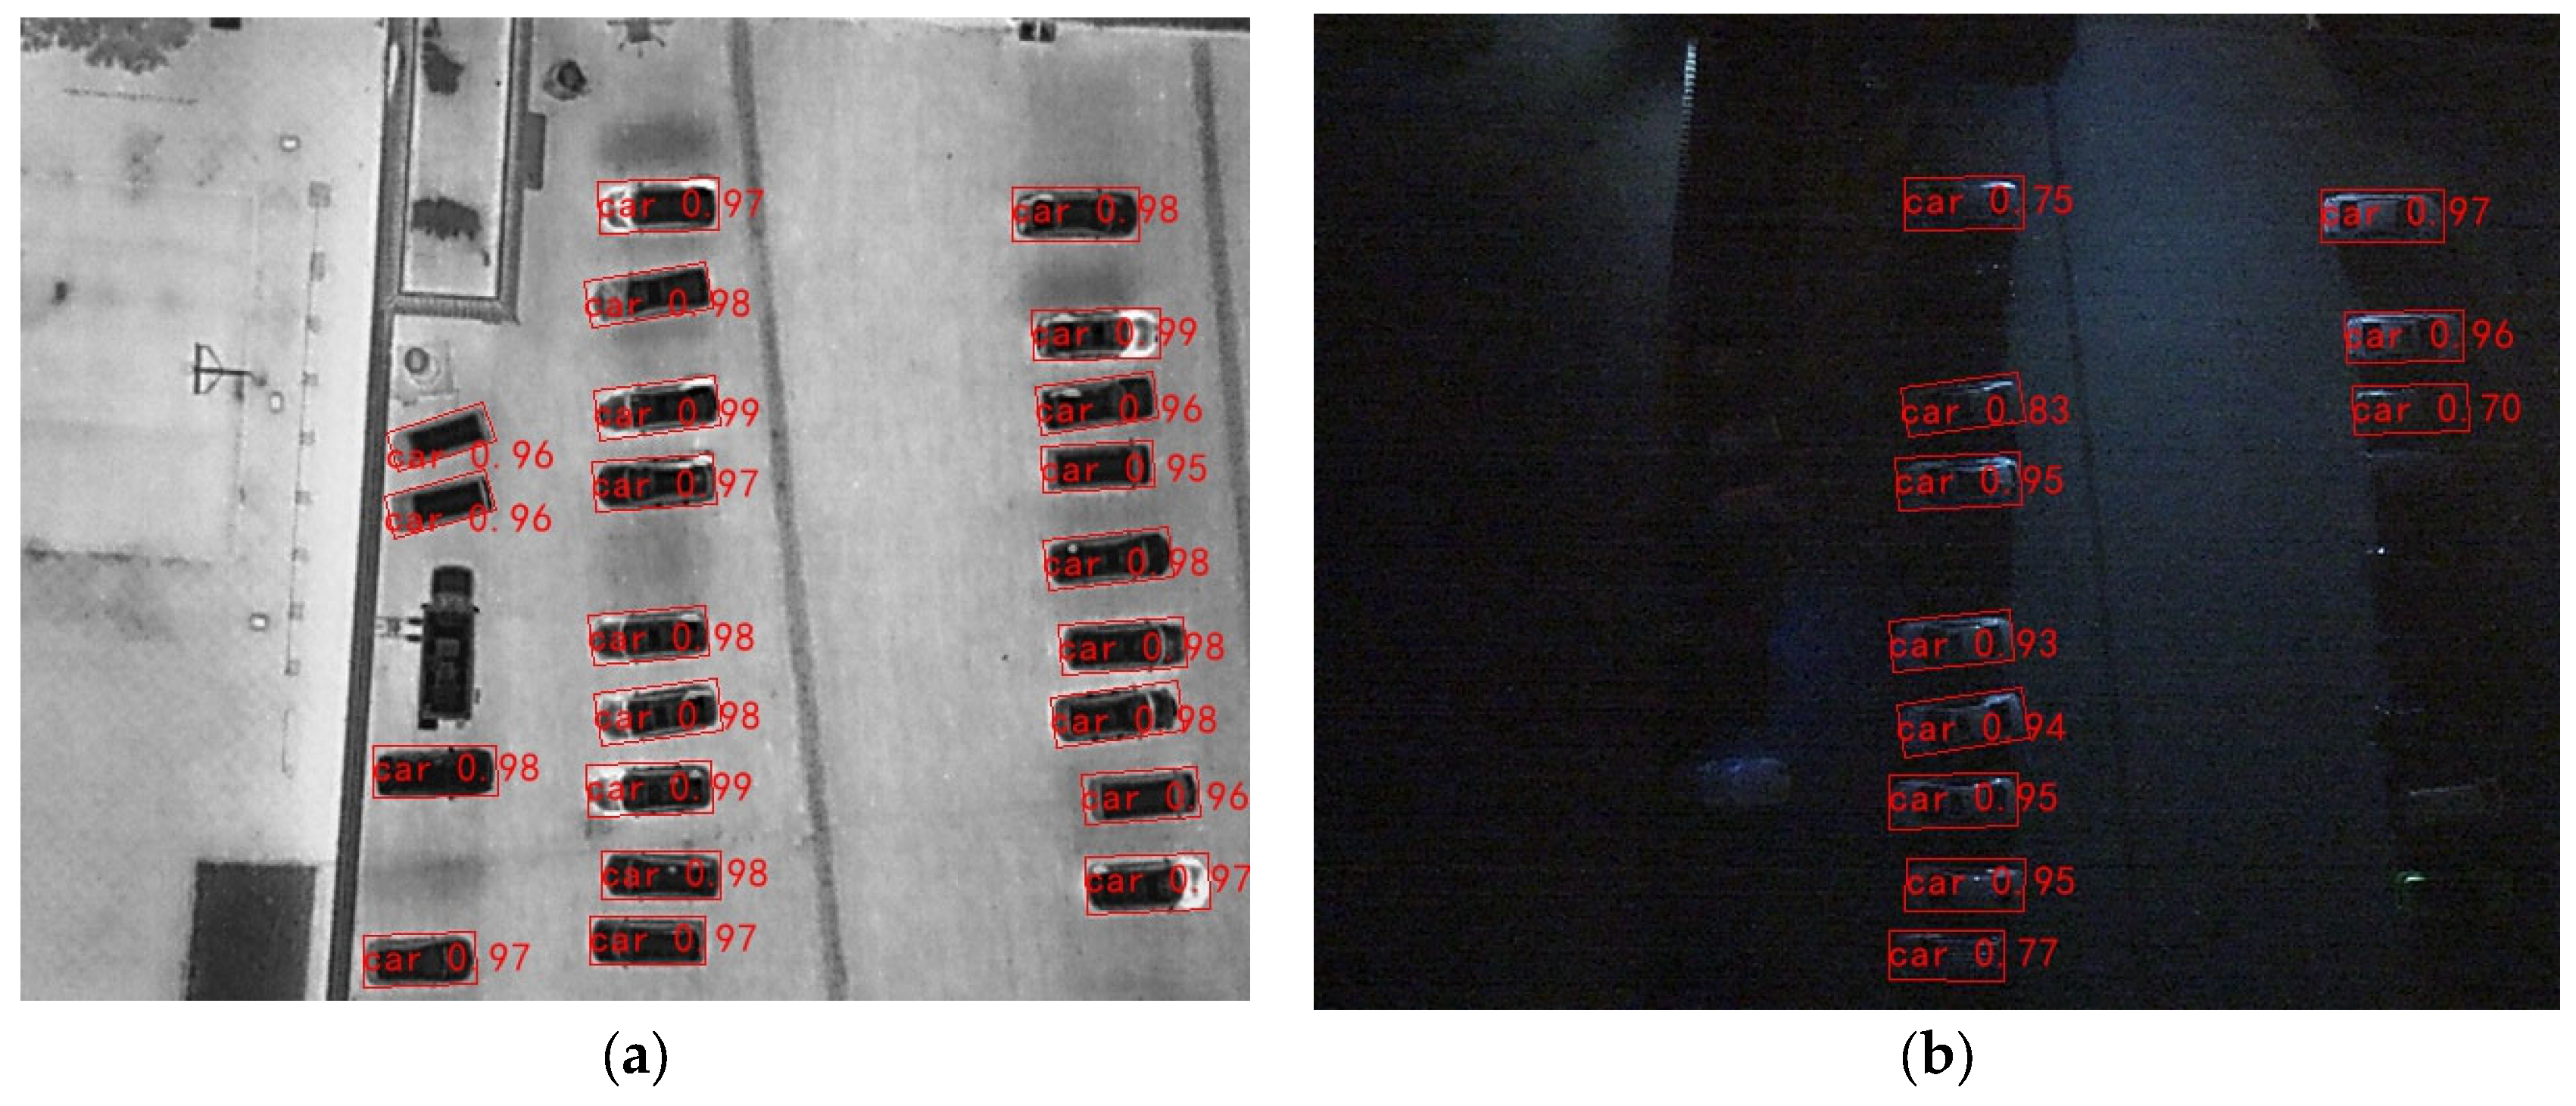
Due to the large distance between the ground objects and the drone, the objects occupy a small number of pixels in the image, resulting in unsatisfactory detection performance. Moreover, since the object size span is small under the drone perspective, some methods such as feature pyramid network (FPN) [32] are not as effective as in natural scenes with multi-scale objects. Most of the existing object detection algorithms are developed on visible light image datasets, which are greatly affected by illumination. Visible light images have richer texture information than infrared images when the illumination condition is good, but they have poor detection performance when the illumination condition is bad. As shown in Figure 1, the objects are clearer in visible light images during daytime, but many objects are invisible in visible light images at night, while they are more obvious in infrared images. Combining different sensor information can improve the adaptability of drones to complex environments. However, due to the limited payload of drones, only some low-power embedded devices can be mounted. To achieve real-time object detection on drone images, the algorithm needs to be simple and fast.
The above-mentioned problems limit the application of object detection algorithms on drones. To enable drones to adapt to complex environments, this paper conducts research on both infrared and visible light modalities of data and improves the lightweight model YOLOv7-tiny to make it run in real time on edge devices. To address the small size span of objects in drone images and the class imbalance problem, this paper proposes a new anchor box assignment method to balance the imbalanced class samples. This method can provide more prior information that matches the size characteristics of objects under drone perspective and improve the accuracy of the network. This paper also improves the loss function to deal with the hard–easy sample imbalance problem and proposes HSM Loss to dynamically adjust the weights of hard-to-detect samples and enhance the network’s learning of hard-to-detect samples.
In summary, the main contributions of this paper are as follows:
- We propose a novel anchor assignment method for drone images, AR-anchor (aspect ratio-anchor), which alleviates the sample imbalance problem, provides more effective prior information for the network, and improves the object detection performance.
- We propose a hard-sample mining loss function (HSM Loss), which alleviates the hard–easy sample imbalance problem and enhances the detection ability of the network without increasing computational cost.
- We demonstrate that our algorithm can be effective on both infrared and visible light modalities of data, enhancing the robustness and generalization of drone image object detection.
- We present a lightweight algorithm that can be more efficiently applied in practice.
The structure of this paper is as follows: Section 2 introduces the network structure and method in detail. Section 3 presents our work and experimental results and compares them with related methods to verify the effectiveness of our approach. Finally, Section 4 discusses the research content, and Section 5 concludes the paper.
2. Materials and Methods
This section first introduces the framework and idea of deep-learning-based object detection algorithms, as well as their advantages and disadvantages, then introduces the structure and principle of the YOLOv7-tiny algorithm, and finally introduces the idea and details of our proposed anchor assignment method and improved loss function.
2.1. Overall Network Framework
Deep-learning-based object detection algorithms usually consist of three components: a backbone network for extracting image features, a neck for fusing deep semantic information and shallow detail information, and a detection head for predicting object classes and locations. The backbone network can be a network for image classification with the last classification layer removed, such as ResNet [33], or a backbone network designed for object detection tasks such as DarkNet [6]. These networks are often pre-trained on large-scale datasets to learn the ability to extract image features, which can significantly improve the performance for small-scale and similar-scene object detection datasets. Images are features extracted by the network to obtain feature maps. To reduce the computational complexity, the resolution of the feature maps gradually decreases in the network. Most backbone networks are designed to perform downsampling 5 times. The last layer of feature maps has a width and height of 1/32 of the original image. An object occupying 32 × 32 pixels in the image only occupies one point in the last layer of feature maps. As the network depth increases, the feature maps have stronger semantic information, but lose detail information. Therefore, object detection algorithms do not only detect objects from the last layer of feature maps but also do multi-scale detection from the last 3 layers of feature maps with different resolutions. By using the feature pyramid structure of the neck, the characteristics of different layers of the network are fully utilized to improve the adaptability of the network to multi-scale objects. The detection head realizes the classification and localization of objects. Different algorithms have different detection mechanisms. Some detection heads divide the image into several cells; each cell shares the extracted features and predicts the confidence, category, location, and width and height of the object, such as YOLOv7. Some algorithms use decoupled detection heads, which separate classification and regression tasks, such as Efficientdet [34].
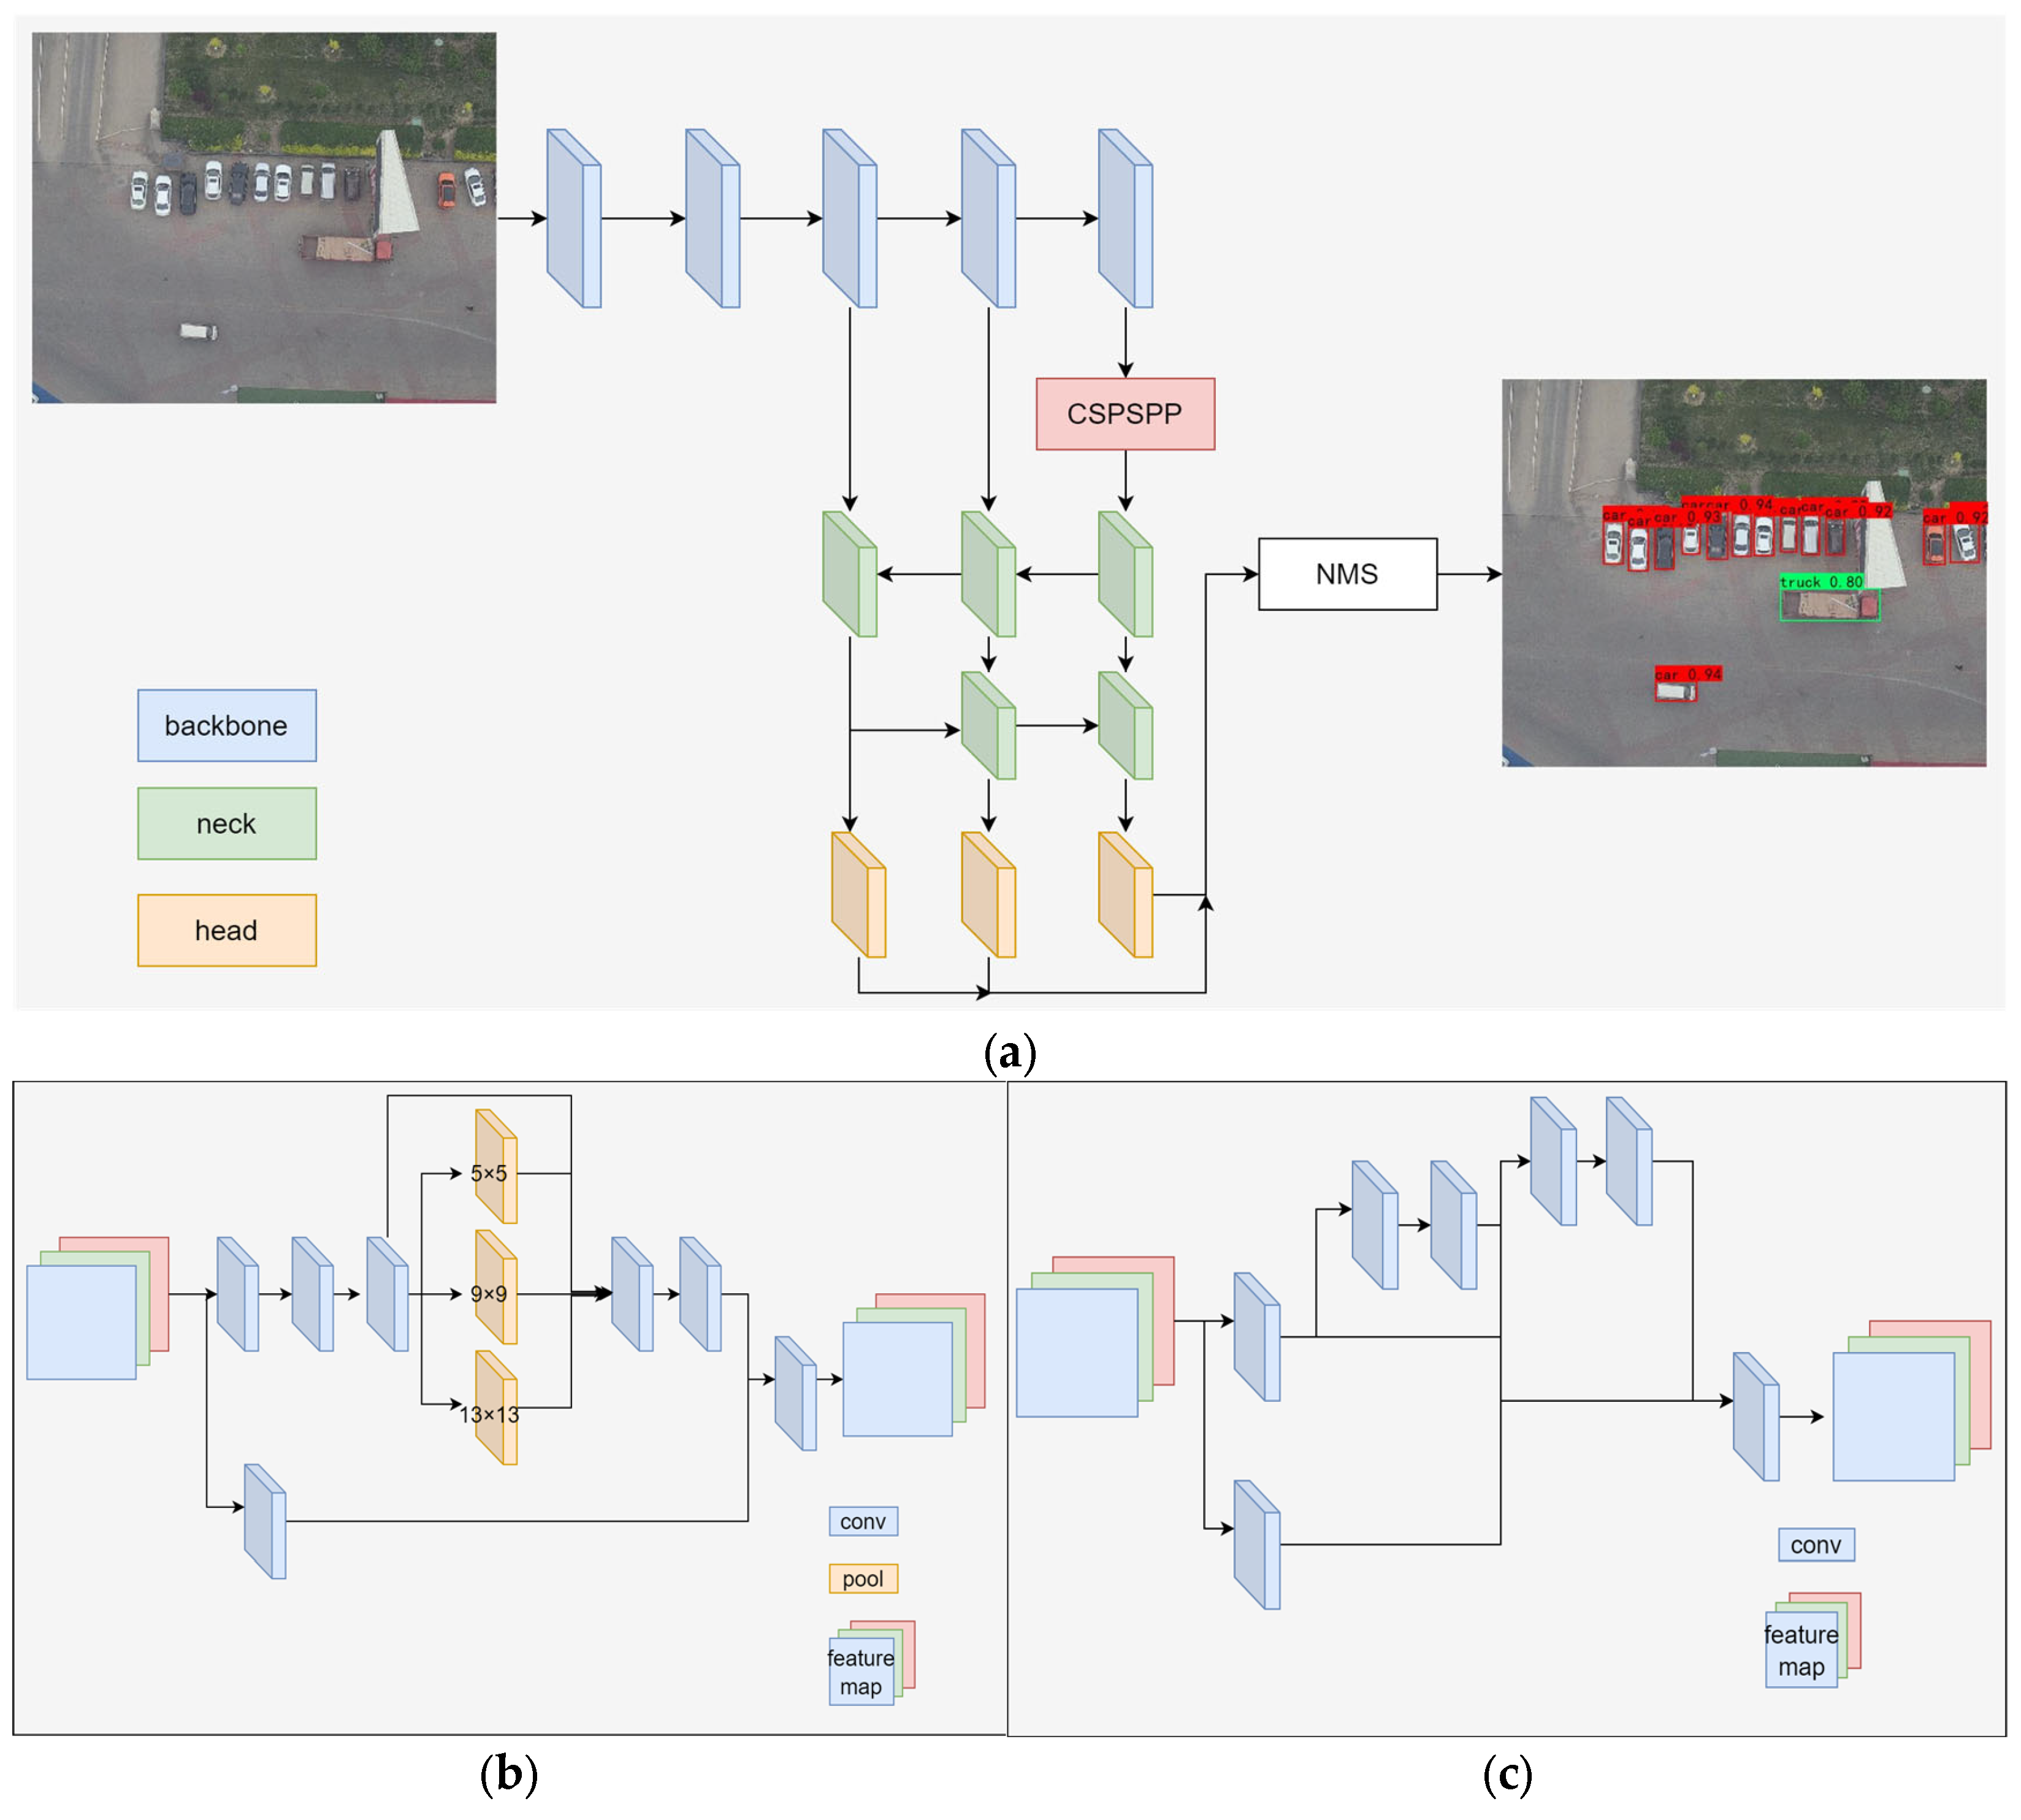
The network structure is shown in Figure 2. Its backbone network uses a multi-branch stacked structure for feature extraction, which can extract more effective features while reducing computation. After the input image goes through the backbone network for feature extraction, the feature layers after downsampling 3, 4, and 5 times are used to predict objects; at the last feature layer of the backbone network, there is an SPP [35] module with a CSP [36] structure, which has max pooling layers with different sizes and can enable the network to learn more effective features from different receptive fields, allowing deep convolutional networks to extract richer semantic information; the neck part uses a PANet [37] structure to fuse deep-feature map upsampling to shallow-feature maps to enhance the semantic information of shallow networks, while fusing shallow-feature map downsampling to deep-feature maps to supplement the detail information of deep-feature maps; a detection head with shared weights is used for final object classification and localization. Each layer uses three anchor boxes with different shapes, which are responsible for detecting objects with different shapes. Finally, non-maximum suppression is used to filter out multiple anchor boxes’ repeated predictions for the same object; the reparameterization technique is used, and there are different network branches on the same layer with different sizes of convolution kernels. During inference, convolution kernels of different branches are equivalently replaced by convolution kernels with the same size and then fused into a single branch. This improves the parallelism of computation and reduces storage and inference speed on the GPU when inferring. During training, YOLOv7-tiny uses the simOTA strategy to assign positive and negative samples. This strategy calculates the cost matrix between each ground truth box and anchor box then assigns one ground truth box to k anchor boxes. These anchor boxes are regarded as positive samples. If an anchor box is assigned multiple ground truth boxes for prediction, then this anchor box only predicts the ground truth box with the lowest cost. This strategy can greatly increase the number of positive samples.
2.2. Anchor Allocation Method Based on Aspect Ratio
The network predicts the width and height of the object by predicting the offset of the object size relative to the anchor box. Therefore, objects that are close to the size of the anchor box are easier to detect, while objects that have a large difference in size from the anchor box are easily ignored. Usually, the design of anchor boxes includes objects of various scales and shapes. Different feature layers with different receptive fields of the network are assigned different sizes of anchor boxes. Multiple anchor boxes on the same layer cover different shapes of objects according to the aspect ratio. Carefully designed anchor boxes provide effective prior information for the network and greatly improve its detection ability. However, under the drone perspective, the object size difference is not obvious. The algorithm in this paper groups the objects from the perspective of aspect ratio and assigns anchor boxes that are closer to the object shape distribution, providing more effective prior information for the network.
YOLOv7-tiny uses 9 different sizes of anchor boxes: 3 small anchor boxes on the feature layer with 3 times downsampling to detect small objects, 3 large anchor boxes on the feature layer with 5 times downsampling to detect large objects, and each layer has 3 anchor boxes with aspect ratios greater than 1, less than 1, and close to 1, respectively, to detect objects with different scales and shapes. The design method of anchor boxes is mainly based on clustering algorithms, such as K-means, on the bounding boxes to obtain the object sizes as prior information for the network. This design method can reflect the sizes of most objects in the data, but most datasets have a long-tail distribution situation where some object samples are far beyond the rest of the samples. The obtained anchor boxes mainly reflect the sizes of objects with more samples, resulting in better detection performance for categories with more samples and worse detection performance for other categories. In addition, in natural scenes, objects can be very close or far away from the camera; plus, size differences between objects exist from point objects to objects that occupy almost all the pixels of an image. Using different sizes of anchor boxes to guide different layers of the network to detect different sizes of objects is a good strategy, but when flying a drone, objects are far away from the camera, so they are mostly small objects without obvious size differences like natural scenes. At this time, what differs greatly among bounding boxes is the aspect ratio, so the original allocation method is not that effective anymore.
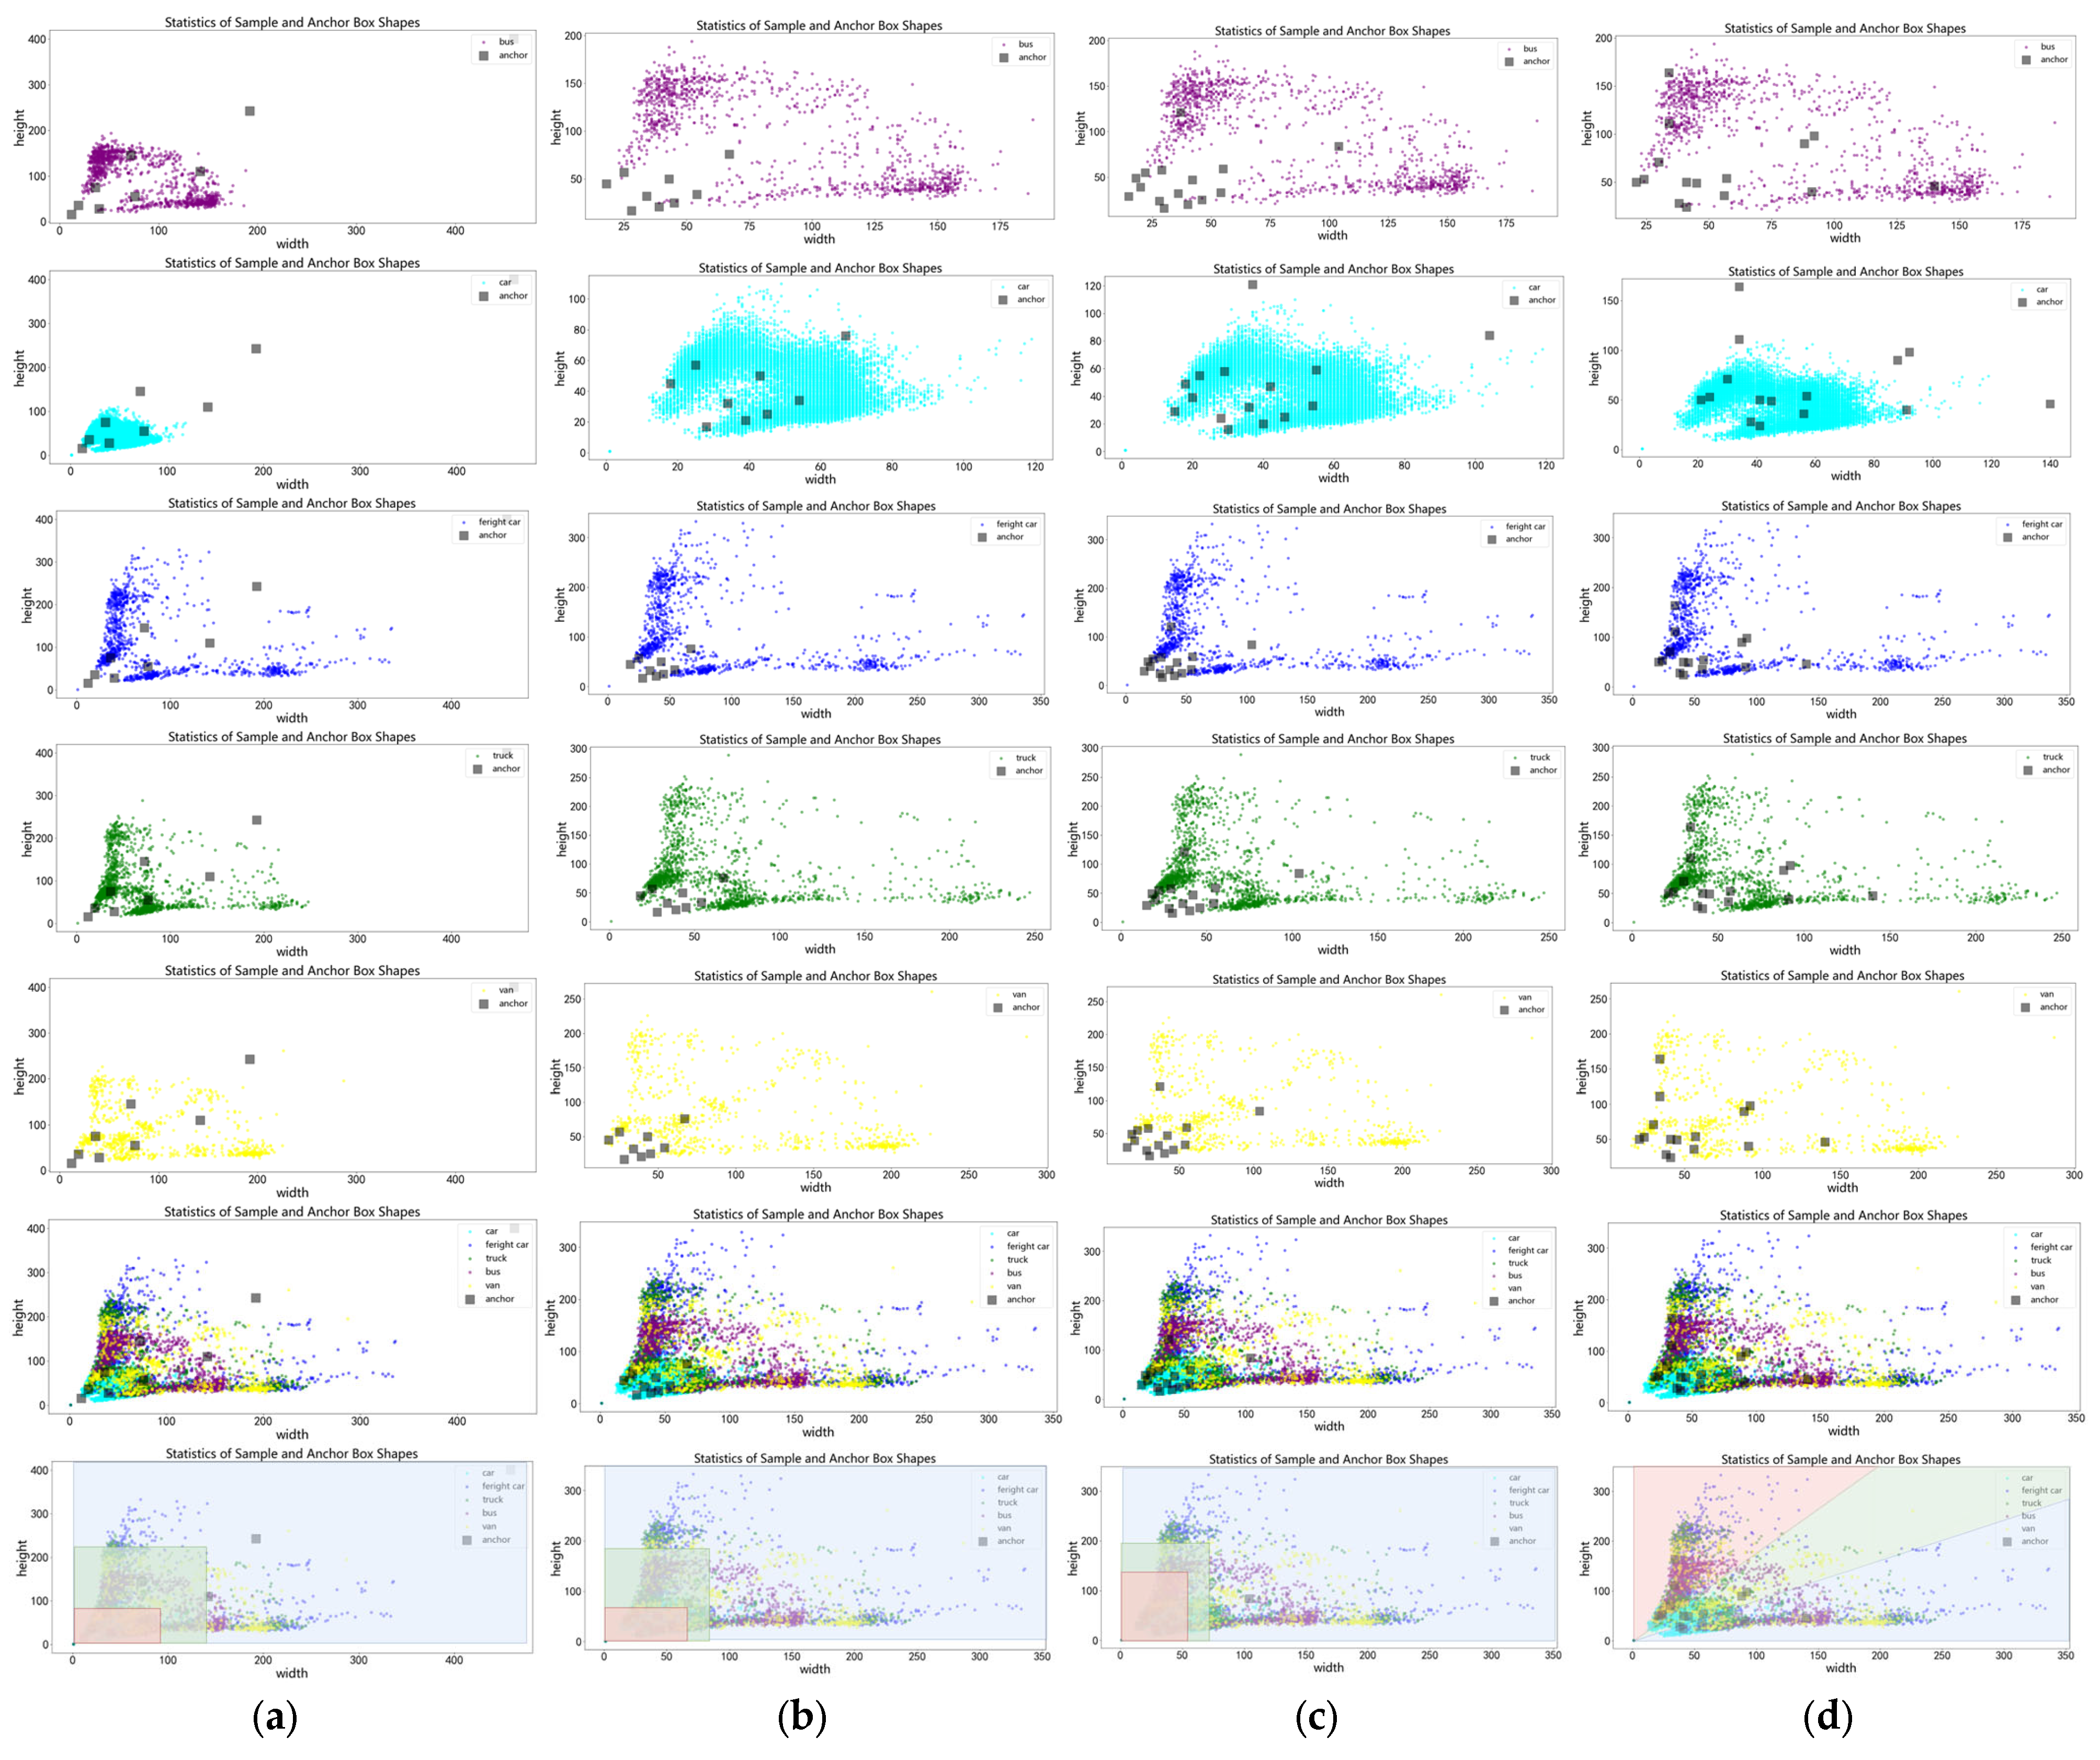
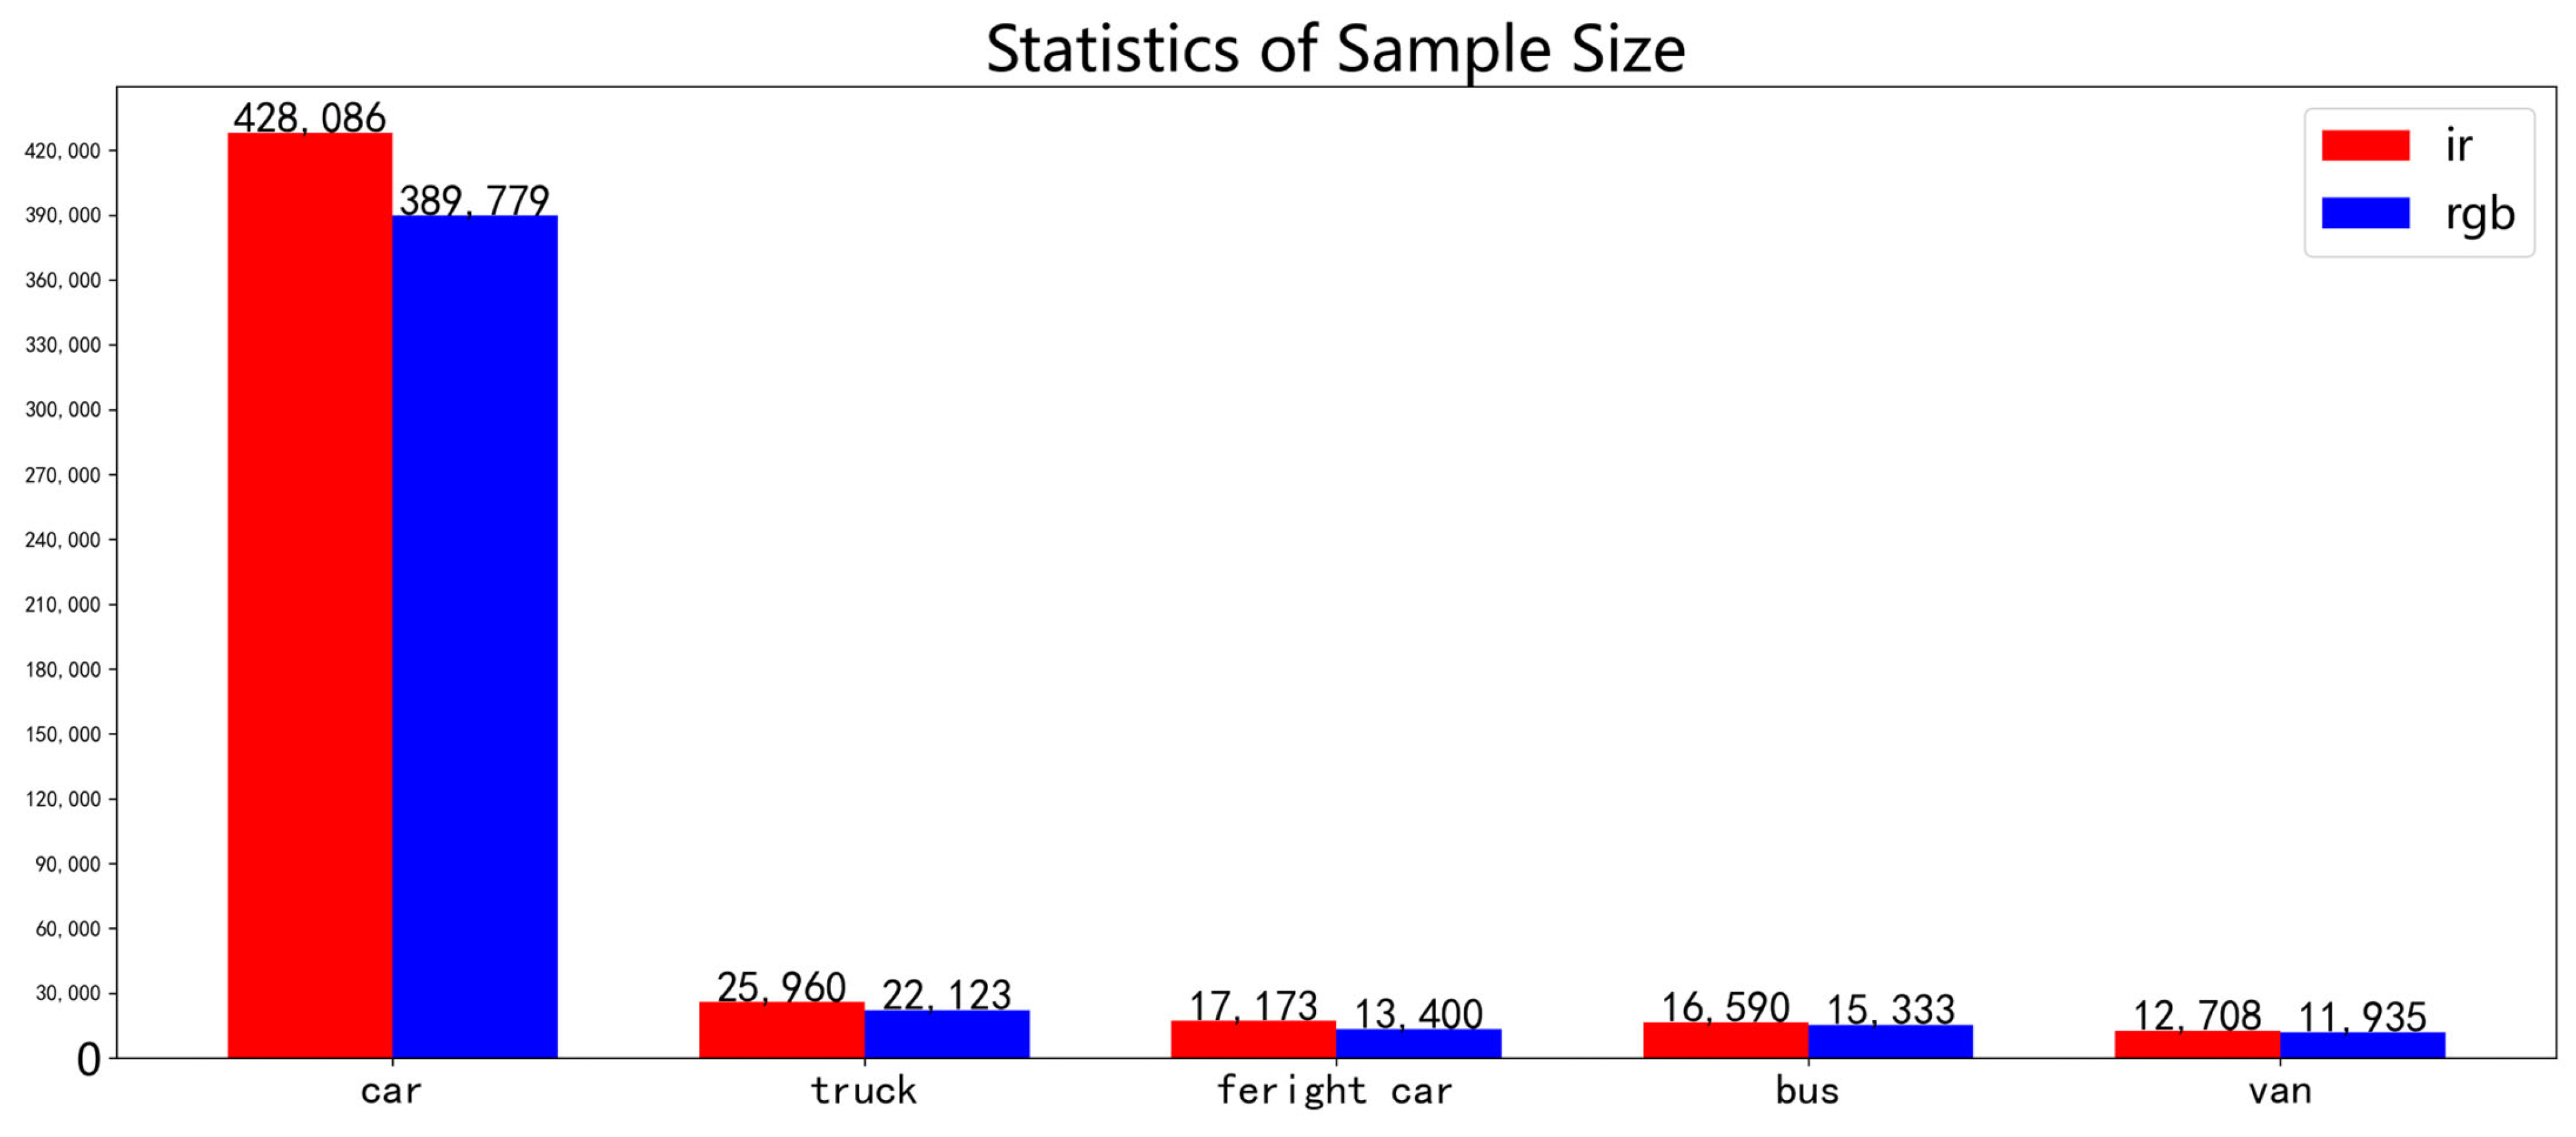
Based on the above problems, this paper proposes a new anchor box allocation method for object detection under drone perspective, abandoning the original strategy of allocating anchor boxes to different layers according to object size and using different aspect ratios of anchor boxes on different layers, making the network possess stronger detection ability for objects under drone perspective and allocating prior boxes separately for different types of objects to alleviate the impact of long-tail distribution of sample categories. Specifically, this paper first statistically analyzes the object size and anchor box size in the DroneVehicle dataset. As shown in Figure 3, the horizontal axis represents width and the vertical axis represents height in units of pixel number. Since the objects are obtained from drone perspective, their size does not exceed 350 × 350. The default anchor boxes of YOLOv7-tiny differ greatly from object size distribution. Using the k-means algorithm to cluster on the dataset obtains 9 anchor boxes and 15 anchor boxes, which are more consistent with object size than the original default anchor boxes, but they will be affected by sample number difference among different categories. The sample categories are counted as shown in Figure 4. Car has 428,086 samples in the infrared images and 389,779 samples in the visible light images, which are far more than other categories. Most anchor box sizes obtained directly by k-means are close to a car, so they are seriously affected by long-tail distribution of samples. Therefore, this paper’s algorithm first clusters each category’s object size using the k-means algorithm, separately obtaining 3 anchor boxes for each category. The DroneVehicle dataset has 5 categories, so it obtains a total of 15 anchor boxes. At this time, obtained anchor boxes can take into account each category’s size. Then, it explores allocation methods for the anchor boxes. From Figure 3, it can be seen that most samples gather near the angle bisector line of the first quadrant of the coordinate system and approximate axial symmetry distribution. If it classifies objects according to the original allocation method by size as shown in Figure 3a–c, it is equivalent to dividing objects into three parts according to the area of the rectangle formed by the coordinates with the origin point, which introduces prior information that does not match the characteristics of vehicle object size distribution under drone perspective into the network very well, so according to this paper’s method, it allocates according to the object aspect ratio, which is equivalent to using two straight lines with different slopes dividing object shape into three areas with different colors, as shown in Figure 3d. At this time, the rule dividing objects becomes the aspect ratio, which is more suitable for object size distribution under drone perspective. Since all objects are vehicles, their own sizes have aspect ratios less than one, so when the drone direction is the same or perpendicular to the object, the bounding box shape is close to the object shape, but when the drone direction is at a 45° angle with respect to the object, the bounding box shape differs greatly from the object shape, so at this time, the bounding box aspect ratio is close to 1, so the network needs stronger semantic information for learning the difference between object and bounding box, so it puts each category’s aspect ratio close-to-one prior box on the last layer predicting network. That is to say, the green area samples in the sample distribution are allocated predicting the network with a larger receptive field and stronger semantic information deeper layer network, while because there are more samples with the same direction between the drone and vehicle than the perpendicular direction, it allocates a less-than-one aspect ratio prior box, that is, the red area samples predicting a network with less downsampling times, higher resolution, and shallower layer network.
2.3. HSM Loss (Hard-Sample Mining Loss)
Object detection from a drone’s perspective faces many challenges, mainly because objects in drone-captured images usually have small sizes, resulting in insufficient features, the contrast of visible light images is low under low illumination, and the contrast of infrared images is low when the ambient temperature and the object are close, making it difficult to distinguish between the object and the background and the motion blur of moving objects. These factors result in hard-to-detect objects that are difficult to accurately locate and identify in images, thus affecting the performance of drones in various application scenarios. For hard-sample mining, there are methods such as focal loss [11] that adjust the weights of easy and hard samples according to confidence scores, the gradient harmonizing mechanism (GHM) [38] that adjusts weights according to gradient contributions, online hard example mining (OHEM) [39] that increases the number of hard samples in training samples, etc. The core of these methods is to increase the weight of hard samples during training. Based on focal loss, this paper conducts research on hard sample mining.
The loss function of object detection algorithms consists of two parts: classification and regression. YOLOv7 matches positive and negative samples based on the aspect ratio of ground truth boxes and anchor boxes, instead of using IoU as in previous versions. Classification uses cross-entropy loss.
For positive samples, the larger the prediction value, the smaller the loss; for negative samples, the larger the prediction value, the larger the loss. Focal loss is proposed to mainly solve two problems: class imbalance and easy–hard sample imbalance. Since one-stage object detection algorithms divide images into several grids, each grid has multiple anchor boxes to predict the different shapes of objects. Each prediction generates a large number of bounding boxes, among which only a small part are assigned as positive samples. The problem of class imbalance is serious.
In focal loss, parameter is used to control the weight of different samples. is a number between 0 and 1. For negative samples, most of them are background pixels. Since there is a large number of detection boxes that are negative samples in the network, a modulation factor is multiplied by the cross-entropy loss to suppress the weight of negative samples and achieve the purpose of balancing positive and negative samples. For positive samples, focal loss also has the ability to dynamically adjust the network learning difficulty of samples. When is close to 1, the sample belongs to an easy-to-detect sample, and the network reduces its weight. Smaller values indicate positive samples that are difficult to detect, and the network increases their loss. Due to excessive suppression of a large number of negative samples by the modulation factor, is used to adjust the weight of positive and negative samples, so that the network achieves a balance between positive and negative samples. The typical values for and are 0.25 and 2, respectively [11].
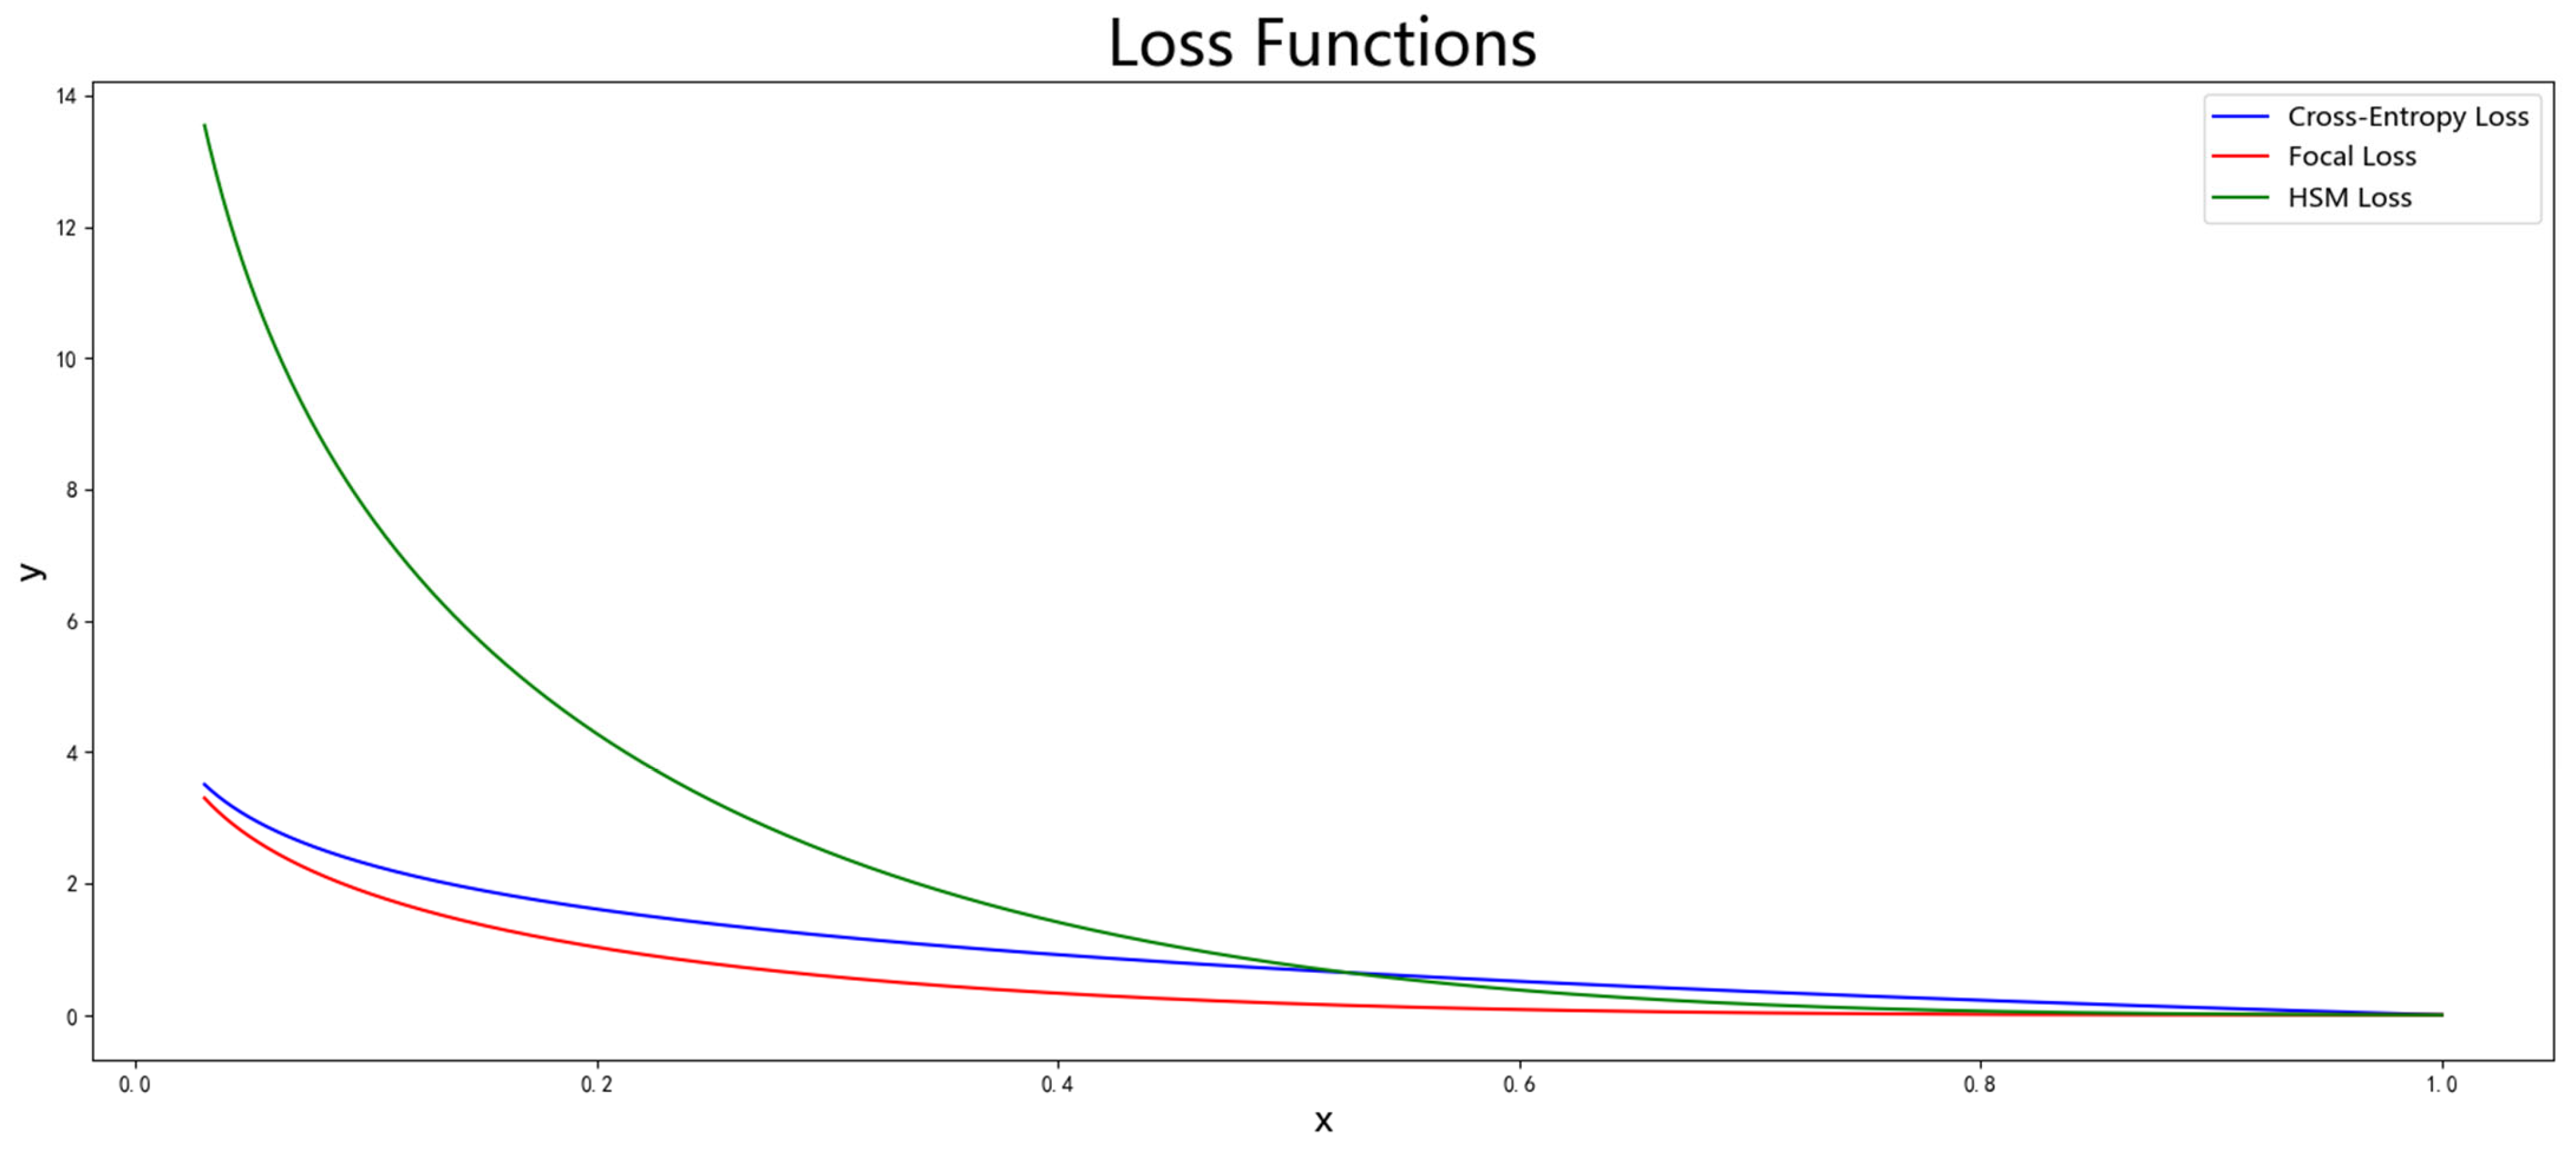
Focal loss has been proven to balance positive and negative samples and hard and easy samples in many experiments, but it performs poorly in the YOLO series, sometimes even leading to network performance degradation. This paper analyzes this problem and finds that YOLOv7-tiny itself has the ability to adjust positive and negative samples, using the simOTA strategy to assign positive and negative samples. Under this strategy, a ground truth box can match multiple anchor boxes as positive samples, and there are different modulation factors for positive and negative samples. Therefore, the imbalance of positive and negative samples in YOLOv7-tiny is not obvious, and directly introducing focal loss will cause negative samples in the network to be suppressed. The most intuitive phenomenon of this is that after introducing focal loss, the network performance does not increase but decreases, and when the confidence threshold is set low, the network will have a large amount of background predicted as objects, and negative samples are suppressed too much. At the same time, because focal loss dynamically allocates the weights of hard and easy samples by multiplying a modulation factor greater than 0 and less than 1 on the basis of cross-entropy loss, it always shows a suppressive effect on classification loss. For objects with a confidence of 0.9, the loss is only one percent of the cross-entropy loss. Although this can make the network learn more fully from hard samples, it limits the learning of easy samples. This paper improves this problem. First, this paper believes that balancing hard and easy samples should not always suppress them but also amplify them. We define hard samples as those with confidence lower than 0.5, which is consistent with the threshold used for prediction. When applying the algorithm to real images, we use 0.5 as the confidence threshold and take the objects with network prediction confidence higher than 0.5 as the prediction results. Therefore, this paper adds a modulation factor to make the weights of easy detection samples with confidence greater than 0.5 decay and the weights of hard detection samples with confidence less than 0.5 amplify; therefore, the loss of hard samples is amplified, while easy samples are suppressed. At this point, there is still a problem. For simple samples, as the confidence increases, the decay factor decreases exponentially, which will cause the network to stop learning after learning to a certain extent for easy samples. Therefore, a lower limit is set for the modulation coefficient to reduce the impact on the hard and easy sample boundaries as much as possible. A 0.1 is added to the modulation coefficient, and then, the lower limit of decay for easy samples is 10 times, and the impact on the hard and easy boundaries is relatively small; when γ = 2, the boundary is about 0.53. This bias will cause greater changes in the boundary of hard and easy samples, while a bias that is too small will cause the lower limit of the modulation coefficient decay to be too low. Therefore, 0.1 is a suitable bias. At this time, the modulation factor ranges from 0.1 to 4.1. Finally, in focal loss, after adjusting the weights of positive and negative samples by focal loss, the weight of negative samples is less than that of positive samples, which is used to reduce the weight of positive samples. This paper’s algorithm does not need this parameter to adjust the weight and removes it to obtain HSM Loss. The images of three loss functions are shown in Figure 5. The focal loss value is always smaller than the cross-entropy loss, while the HSM Loss proposed in this paper is smaller than cross-entropy loss when the confidence is greater than 0.5 and larger than cross-entropy loss when the confidence is less than 0.5, which can better mine hard samples.
3. Results
This paper conducted a large number of experiments on the public dataset DroneVehicle. This section first introduces the DroneVehicle dataset, then designs a series of ablation experiments to prove the effectiveness of the method proposed in this paper and finally compares it with some advanced object detection algorithms to demonstrate its superiority.
3.1. Implementation Details
The experimental environment setup of this paper includes CPU: i7-12700, GPU: 1080TI, and pytorch1.10.2. We use mAP as the evaluation metric and consider a predicted box as a positive sample when its IoU with the ground truth box is larger than 0.5. The mAP obtained by testing is the highest value on the test set. The data annotation is oriented bounding boxes, and we obtain horizontal bounding boxes by taking the minimum horizontal circumscribed rectangle of each box. All data splits are based on the original splits of each dataset. Parameter settings during training: the image resolution for training models is 640 × 640. We pad the original images with a resolution of 840 × 712 to have equal width and height and, then, resize them to 640 × 640 to ensure that the image content maintains its original aspect ratio; we use mosaic data augmentation and mixup data augmentation; when using pre-trained weights, we freeze the backbone part for training for the first 30 epochs and, then, train the whole network; the batch size is 64 when freezing the backbone and 32 when training the whole network; the pre-trained weights are YOLOv7-tiny trained on the COCO dataset; the learning rate is set to 0.001 and adjusted by cosine annealing strategy; the optimizer is Adam with a momentum of 0.937; when using focal loss, we set α = 0.25 and γ = 2.
3.2. Ablation Study
This paper designed a series of ablation experiments on the proposed anchor box design method and loss function improvement, which fully demonstrated the effectiveness of our method.
3.2.1. AR-Anchor
First, we conducted an ablation experiment on the anchor box assignment method and verified it on both infrared and visible light images. This experiment aimed to validate that our method of assigning prior boxes according to aspect ratio was more effective than assigning them according to size under the drone perspective and that it could alleviate the problem of poor detection performance for classes with few samples because of class imbalance. The default anchor boxes of YOLOv7-tiny are shown in Table 1, and Table 2 shows the mAP of using different anchor boxes on infrared and visible light images. We first tested with the default anchor boxes of YOLOv7-tiny and obtained a mAP of 73.79% on visible light images and 76.89% on infrared images. Then, we clustered the ground truth boxes of the training set of the DroneVehicle dataset and obtained nine different shapes of anchor boxes, which we grouped by size. Since the DroneVehicle dataset contains night scenes where the objects are hard to see in visible light images and the infrared and visible light images are not strictly aligned, there are differences in the annotations. Therefore, we clustered separately on infrared and visible light images and obtained three groups of anchor boxes as shown in Table 1. The size differences among different groups of anchor boxes are not large. The results of training with these anchor boxes were a mAP of 74.88% on visible light images and 78.29% on infrared images. To prove that the performance improvement was brought by our proposed algorithm, we used this result as the baseline for subsequent comparison, rather than making an unfair comparison with the result using default anchor boxes. This also reflected the impact of prior information of anchor boxes on network performance. Appropriate prior information could greatly improve network performance and accelerate convergence speed.
This paper proposes an anchor box assignment method that clusters the bounding boxes of five vehicle categories on the DroneVehicle dataset separately, obtaining 15 anchor boxes. Then, according to the aspect ratio, the anchor boxes are grouped into different network layers: the ones with an aspect ratio less than 1 are assigned to the shallow layer, the ones with an aspect ratio close to 1 are assigned to the deep layer, and the ones with an aspect ratio greater than 1 are assigned to the middle layer. The grouping results based on aspect ratio are shown in Table 1. The experimental results show that the proposed method achieves a mAP of 76.10% on visible light images and 79.62% on infrared images. To verify the effectiveness of the proposed anchor box assignment method, we compare it with a baseline method that clusters 15 anchor boxes based on their size and assigns them to different network layers. The anchor boxes obtained by the baseline method for infrared and visible light images are also shown in Table 1. The experimental results show that the proposed method achieves a mAP of 75.57% on visible light images and 79.07% on infrared images. Compared with the baseline method, the proposed method improves the mAP by 1.33% on infrared images and 1.22% on visible light images. Moreover, using the proposed assignment method has an additional improvement of 0.55% on infrared images and 0.53% on visible light images compared with using more anchor boxes. This demonstrates that the proposed algorithm based on aspect ratio assignment is more suitable for object detection from drone perspective. In addition, from the AP of each category, it can be seen that except for bus, which has a small improvement, the detection performance of categories with fewer samples has a more significant improvement. From the perspective of the samples themselves, the anchor boxes obtained by the direct clustering method tend to have the size of a car, which has the most samples. The convolutional neural network extracts features by using shared convolutional kernels, and the network is more inclined to extract features of categories with more samples. Since bus and car are close in size, although there are few bus samples in the data, they benefit from the network’s preference for car, and the AP of bus is much higher than the other categories with few samples. The anchor box allocation method proposed in this paper reduces the impact of sample imbalance on the network and anchor boxes. The AP of car, which has the largest sample size, even decreases slightly, but the AP of other categories increases. Since bus is closer to car, the network and anchor boxes themselves have a certain preference for it, so its AP baseline is high, resulting in a less obvious improvement by the proposed method.
3.2.2. HSM Loss
We designed ablation experiments to improve the loss function. This section still uses the baseline obtained in the previous section. This subsection experimentally verifies that focal loss balances positive and negative samples by suppressing negative samples and dynamically adjusts the weights of positive samples to mine hard learning samples. At the same time, combining focal loss and simOTA strategy, we propose HSM Loss for YOLOv7-tiny to achieve a balance between positive and negative samples and easy and hard samples. Table 3 shows the mAP using different loss functions on infrared and visible light images. First, we use the original focal loss for experiments. The mAP on visible light data is 71.90%, and the mAP on infrared images is 76.15%. Compared with the baseline, it can be seen that the introduction of focal loss has a negative effect. At the same time, when the network confidence threshold is set low, there will be a large amount of background being regarded as objects, indicating that the network’s learning of background is insufficient and that negative samples are suppressed too much. HSM Loss reduces the suppression degree of easy samples, resulting in a mAP of 75.72% on visible light data and a mAP of 78.76% on infrared images. It can be seen that compared with the original focal loss, performance has been greatly improved. Moreover, since visible light images are greatly affected by illumination, there are many images taken in the evening or at night in the data, where visible light images have more hard objects to detect. HSM Loss outperforms the baseline by 0.84% on visible light images and by 0.47% on infrared images. The larger improvement on visible light images demonstrates the effectiveness of HSM Loss in mining hard samples.
We conducted experiments combining the anchor box allocation method and loss function improvement method proposed in this paper. The results are shown in Table 4. The mAP of our algorithm on visible light data is 76.31%, and the mAP on infrared images is 79.82%. Compared with the baseline, our algorithm has an increase of 1.53% on visible light images mAP and an increase of 1.43% on infrared images mAP, which fully proves the effectiveness of our method.
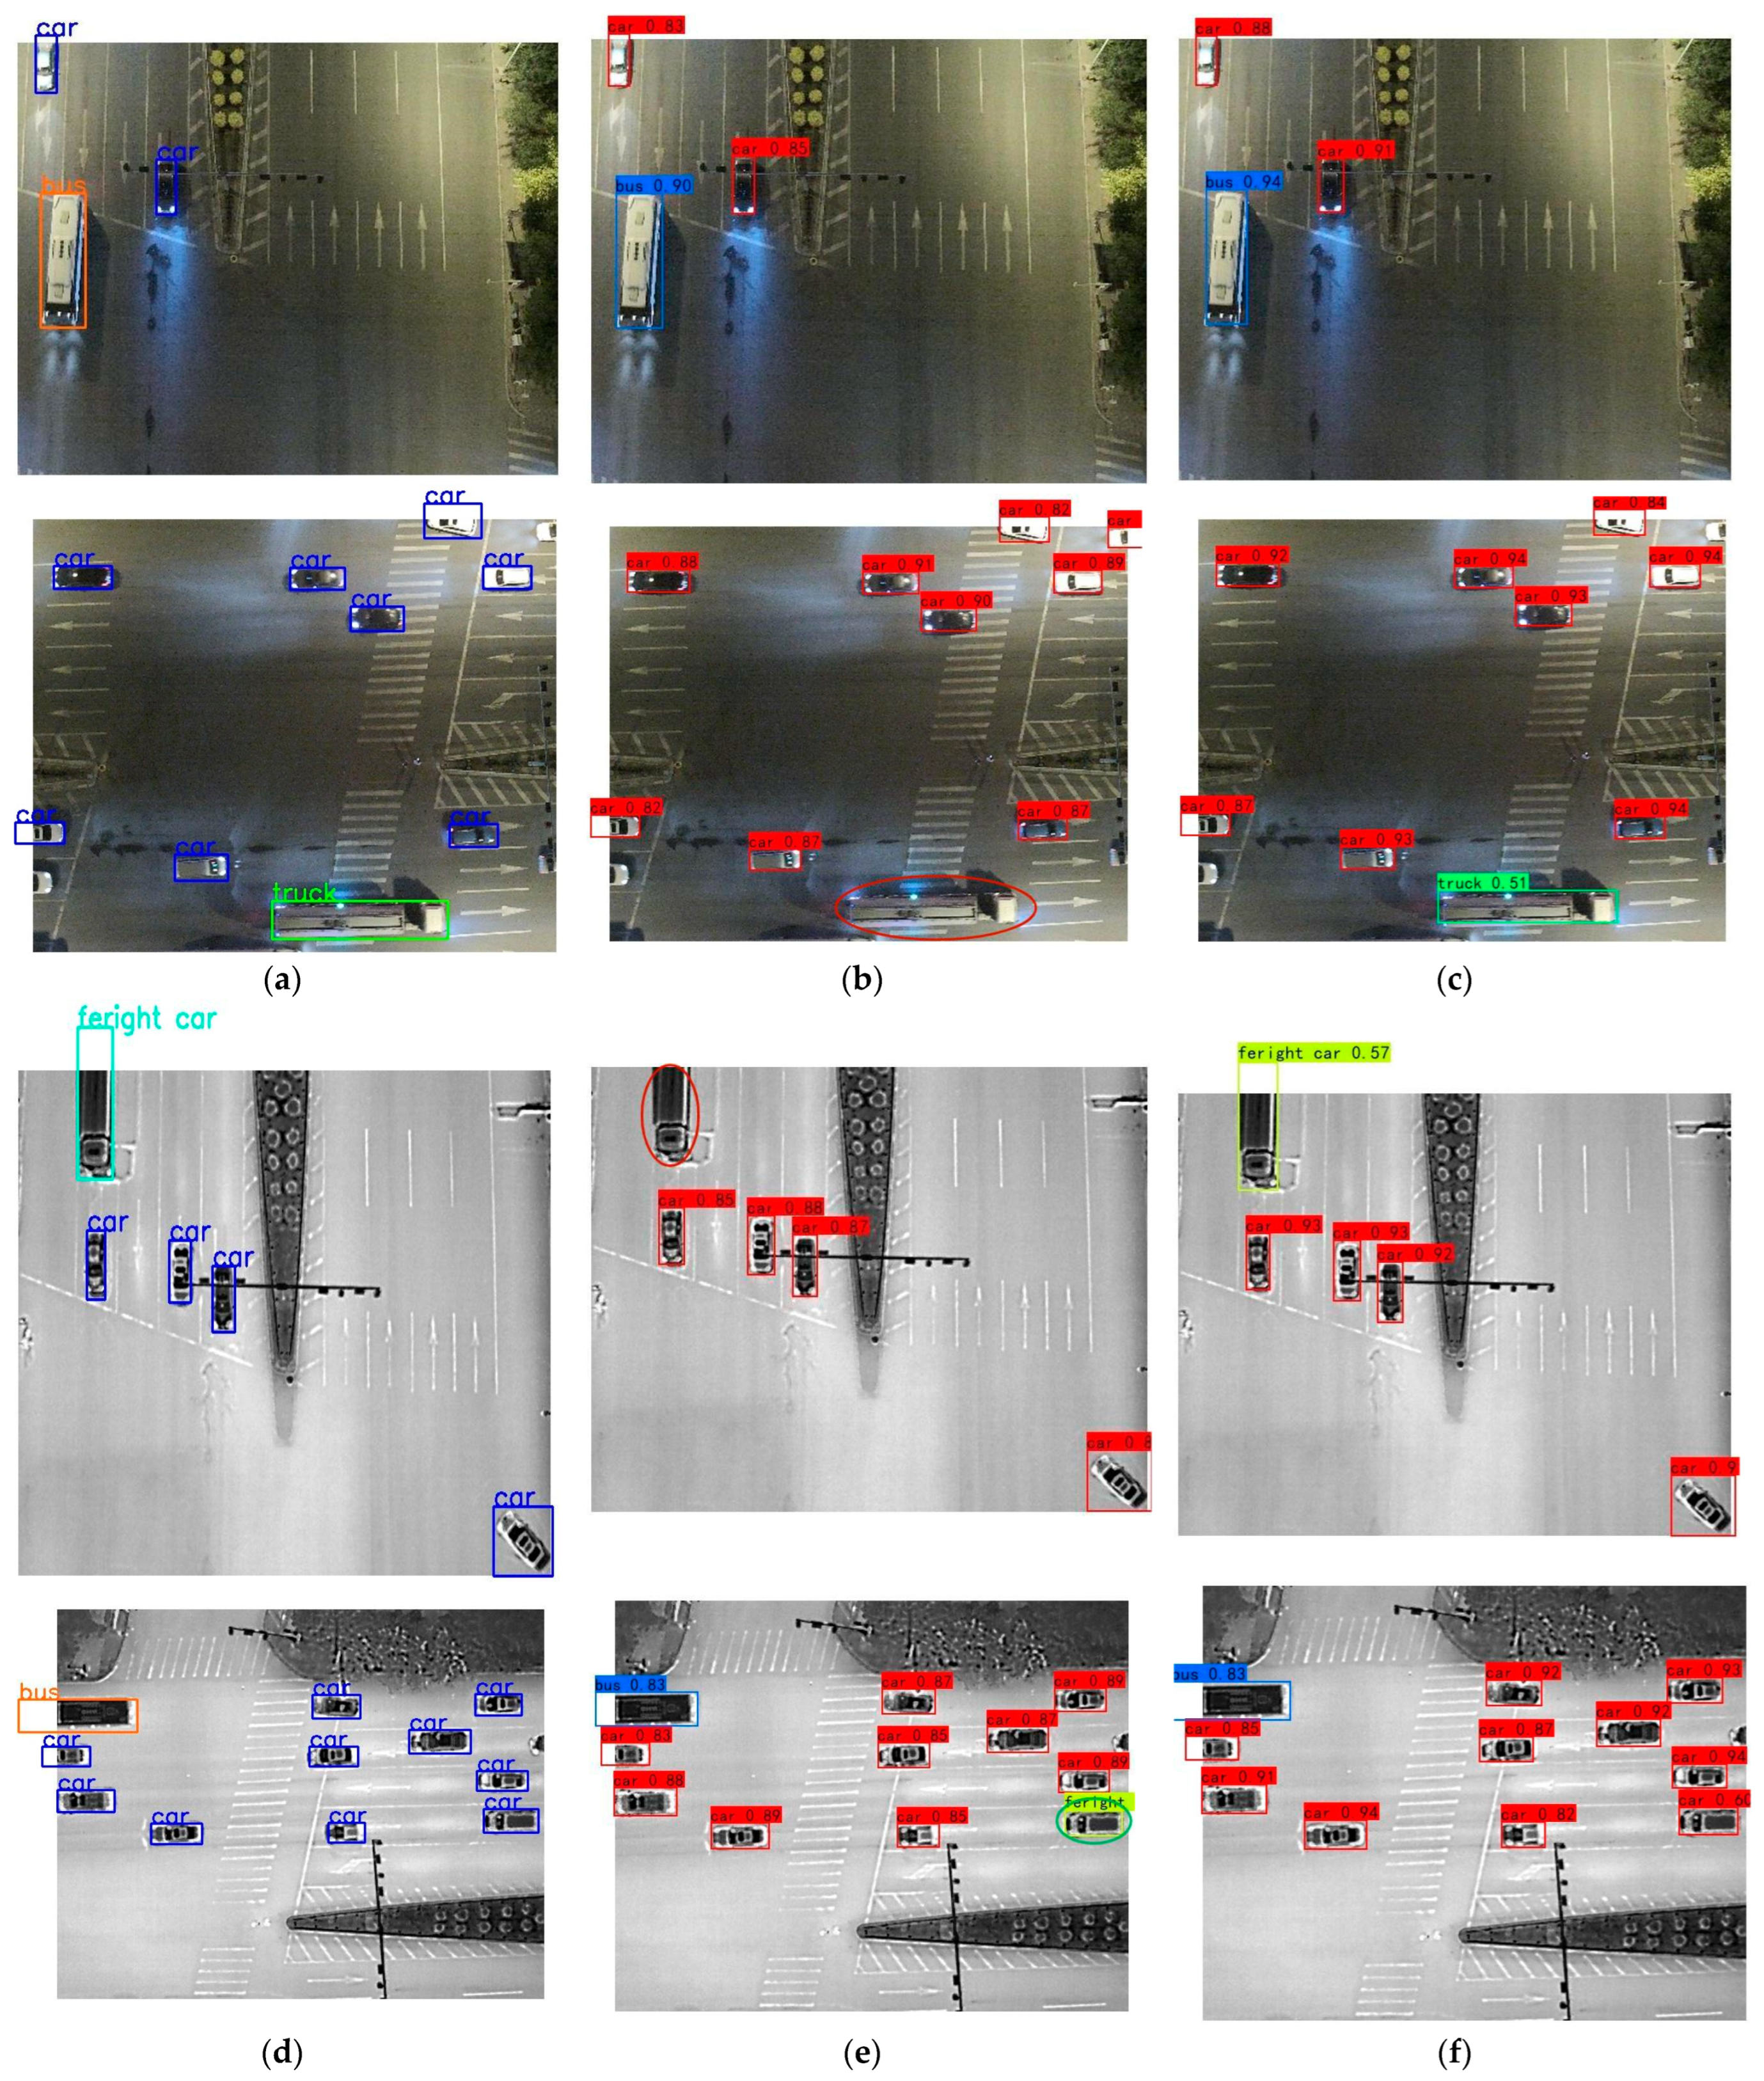
Some image detection results are shown in Figure 6. For the car object with the largest sample size, both YOLOv7-tiny and our algorithm can effectively detect it, and our algorithm has a higher confidence level. For the hard-to-detect objects, the original YOLOv7-tiny missed some of them, while our proposed method can detect them more effectively.
3.3. Comparison with Other Object Detection Algorithms
In this paper, we compare our method with some state-of-the-art real-time object detection algorithms on the DroneVehicle dataset. Since our method is based on horizontal bounding boxes, we first select some advanced real-time object detection methods for experiments, including YOLOv5-s and YOLOX-tiny [40]. YOLOv5-s is an anchor-based algorithm, while YOLOX-tiny is an anchor-free algorithm. Then, we convert our method into an oriented object detection algorithm and compare it with some mainstream oriented object detection algorithms. We trained YOLOv5-s with the same strategy as YOLOv7-tiny, using the same anchors, learning rate, Adam optimizer, resolution, and pre-trained weights on the COCO dataset. We froze the backbone for the first 30 epochs and trained the whole network for the remaining epochs. YOLOX-tiny did not have anchor hyperparameters and showed gradient instability when using Adam optimizer, resulting in difficulty in convergence. Therefore, we used SGD optimizer with a learning rate of 0.01 and ignored samples with large loss values during training. The final results are shown in Table 5.
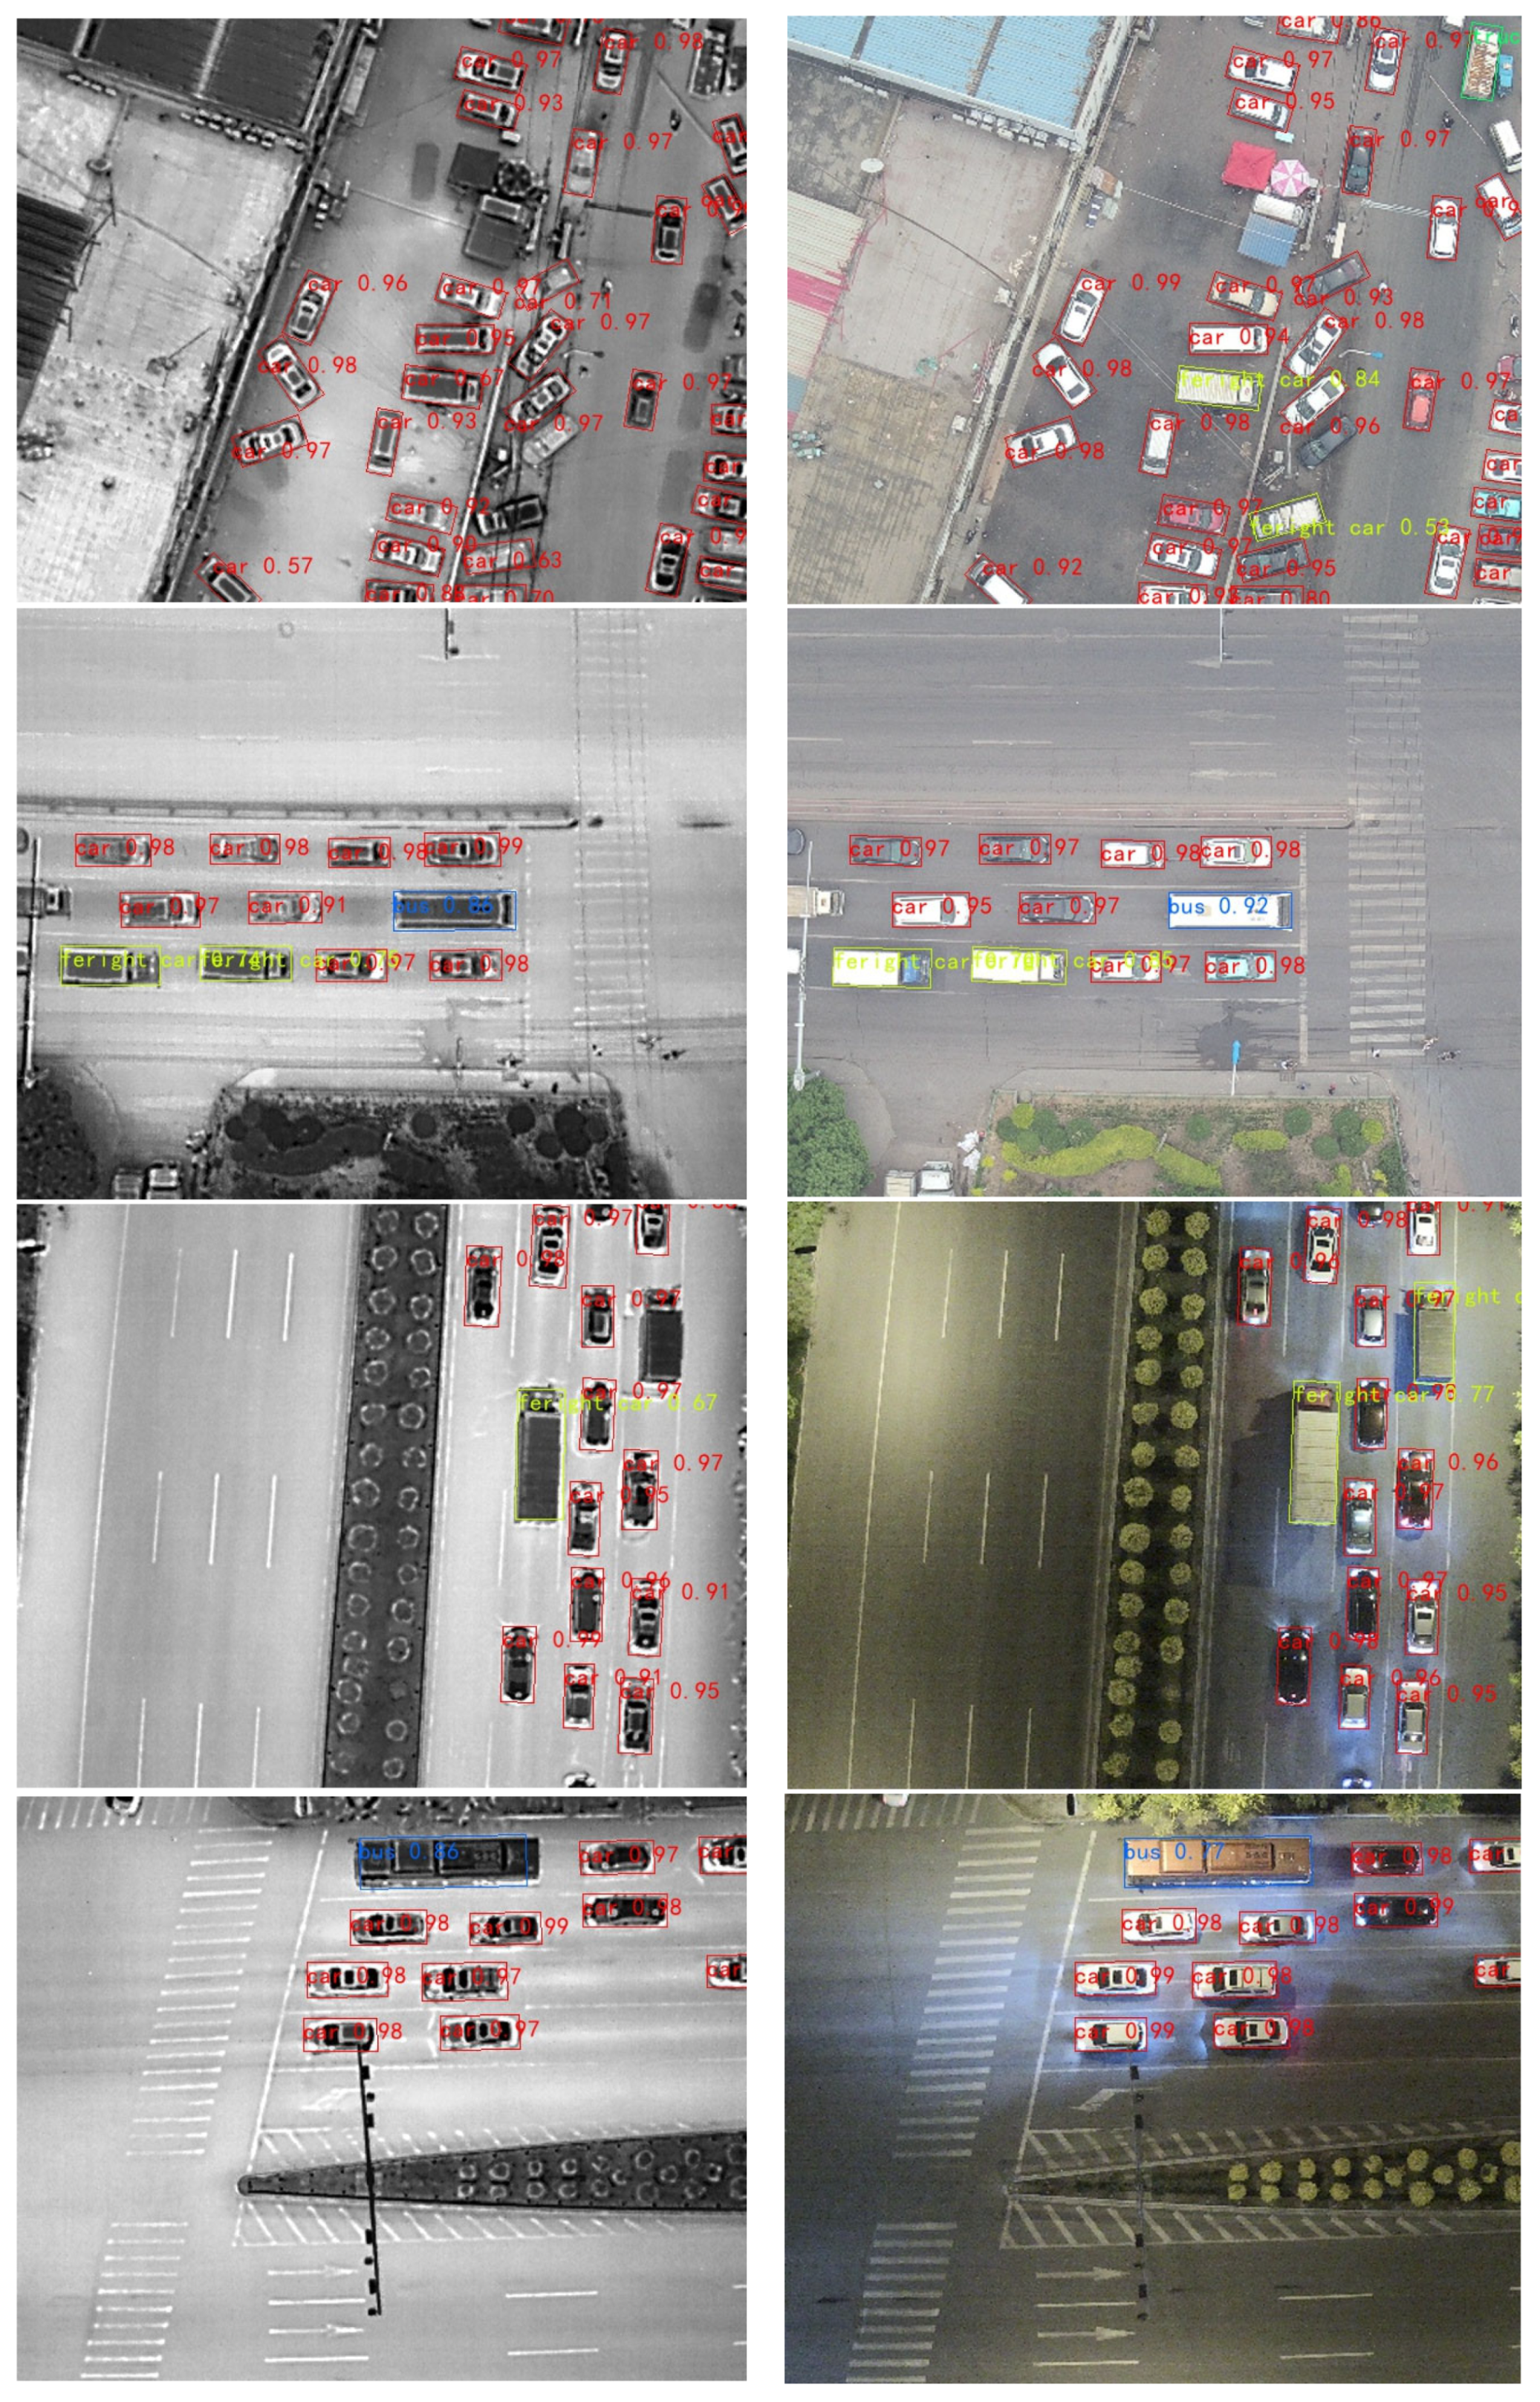
The results in the table show that the anchor-free algorithm YOLOX can achieve good detection performance without introducing prior information artificially, and it surpasses YOLOv5-s and YOLOv7-tiny on both infrared and visible light images, which indirectly indicates the effectiveness of the prior information provided by our method. We add angle prediction to the network output and KLD loss [41] to this part, then obtain the network anchors according to the ground truth of oriented bounding boxes and retrain the network. The detection results are shown in Figure 7, which demonstrate that our method can accurately detect the objects in both infrared and visible light images. We compare our method with some oriented object detection algorithms as shown in Table 6, and it can be seen that our method has good detection performance on both infrared and visible light images. Moreover, by comparing the detection performance of horizontal boxes and oriented boxes, we find that the IoU calculation of oriented boxes is stricter, and it requires more accurate bounding boxes to have IoU greater than 0.5 with the ground truth. Therefore, the mAP of oriented object detection is lower than that of horizontal object detection. In addition, oriented object detection can obtain the orientation information of the objects.
We also compare the parameter size, computation amount, and FPS of several algorithms as shown in Table 7, where FPS is measured on 1080TI. Due to the convolutional operation with shared parameters used by CNN, the parameter size and computation amount are different, and the network inference speed is more closely related to the computation amount. Therefore, YOLOv7-tiny is faster than YOLOX, and YOLOv5-s is the slowest. The overall network speed also includes the post-processing computation, in which NMS takes the longest time. The HBB algorithm proposed in this paper has a slightly higher computation amount than YOLOv7-tiny, but it enhances the network detection performance, reduces redundant detection boxes, and lowers the post-processing time. Therefore, it has the fastest speed among all algorithms. The OBB object detection algorithm proposed in this paper has the slowest speed because its NMS needs to calculate the IoU of rotated boxes, which requires a lot of time.
4. Discussion
4.1. AR-Anchor
Object detection algorithms based on anchor box mechanism rely on the prior information provided by anchor boxes. For datasets with known ground truth object sizes, using anchor boxes can make the network more targeted to detect objects. Therefore, object detection algorithms based on an anchor box mechanism often perform better and train more stably than anchor-free algorithms. The prior information provided by anchor boxes guides different layers of the network to pay more attention to objects with different characteristics. In natural scenes, object sizes span a large range, and different layers of the network have different resolutions and receptive fields. Therefore, grouping anchor boxes according to size and matching them with the network’s receptive field can bring effective prior information of object size to the network. When increasing the number of anchor boxes, different anchor boxes are responsible for predicting more clear object shapes, and the detection effect is better. At the same time, more anchor boxes also bring greater computational cost. However, under drone perspective, object size differences are not that large. Grouping anchor boxes clustered from ground truth boxes in the dataset according to size results in small size differences between adjacent groups of anchor boxes, which is not ideal for detection performance. In this paper, we use a more suitable vehicle object distribution characteristic under drone perspective and group anchor boxes according to aspect ratio. Different layers predict objects with different orientations, and three anchor boxes are assigned for each class of objects, which alleviates the influence of long-tail effect of sample quantity and achieves better detection performance. The reasons for the AR-anchor’s effectiveness include (1) using more anchor boxes, (2) using a distribution method that is more in line with the object characteristics of drone perspective, and (3) balancing sample quantity imbalance.
4.2. HSM Loss
Since the number of objects in the image is always much smaller than anchor boxes in the one-stage object detection algorithm, and some objects have less obvious features, there are problems of positive and negative sample imbalance and hard and easy sample imbalance. Many methods have been proposed to solve these problems, such as focal loss. However, when focal loss is directly introduced into YOLOv7-tiny, the detection effect will become worse. The main reason is that focal loss is aimed at the phenomenon that the number of negative samples in the single-stage algorithm is much larger than that of positive samples, and the negative samples are almost easy samples. It balances positive and negative samples by suppressing negative samples. The lower the confidence of negative samples, the more severe the loss decay. The background with a confidence of 0.01 will be decayed to one-ten-thousandth of the cross-entropy loss. YOLOv7-tiny itself has the ability to adjust positive and negative samples. After adding focal loss, it leads to too much suppression of negative samples during training, which destroys the original balance. This paper reduces the suppression of focal loss on negative samples by controlling the lower limit of sample modulation coefficient and scales the modulation coefficient. The final value range is from 0.1 to 4.1, which makes the loss of hard samples with confidence less than 0.5 amplified and obtains HSM Loss that can mine hard samples better. This loss function can balance hard and easy samples on the basis of maintaining the original YOLOv7-tiny positive and negative sample balance and improve network detection effect. HSM Loss mainly reduces the suppression of negative samples by controlling the lower limit of modulation coefficient and makes it have stronger hard sample mining ability by scaling modulation coefficient.
5. Conclusions
This paper aims to improve the object detection performance under drone perspective, which is a challenging problem because of the complex background and small object size. A novel algorithm based on YOLOv7-tiny is proposed, which uses an aspect-ratio-based anchor box assignment method and a hard sample mining loss function. The designed anchor boxes provide more prior information that matches the object size characteristics under drone perspective and also consider the class imbalance problem among samples. The anchor boxes are designed separately for each class, reducing the influence of classes with more samples on classes with less samples and enhancing the network’s ability to detect objects. The designed loss function strengthens the learning of hard samples and improves the network’s detection performance on hard samples. Compared with the original model, our algorithm achieves 1.53% improvement in mAP on infrared images and 1.43% improvement on visible light images, with only a 0.3% increase in parameters and 0.4% increase in computational cost. It retains the lightweight feature of the original model, making it easier to apply to drones and more practical.
Infrared and visible light images each have their advantages and strong complementarity. By fusing the two types of images, one can obtain both the rich detail information of visible light images and the interference resistance of infrared images, which can lead to better applications. This paper will explore the algorithms of image fusion and detection and will validate the effectiveness of the proposed algorithms on more datasets.
Author Contributions
Conceptualization, S.H.; methodology, S.H. and J.D.; software, S.H. and Y.D.; validation, S.H., Y.D. and F.Z.; formal analysis, S.H., F.Z. and H.L.; investigation, S.H. and F.Z.; resources, S.H.; data curation, S.H. and Y.D.; writing—original draft preparation, S.H.; writing—review and editing, S.H., F.Z., X.S. and J.D.; visualization, S.H. and F.Z.; supervision, F.Z. and H.L.; project administration, F.Z.; funding acquisition, X.S. All authors have read and agreed to the published version of the manuscript.
Funding
This work was supported by the National Natural Science Foundation of China (61901489).
Data Availability Statement
The DroneVehicle remote sensing dataset was obtained from https://github.com/VisDrone/DroneVehicle, accessed on 29 December 2021.
Conflicts of Interest
The authors declare no conflict of interest.
References
- Girshick, R.; Donahue, J.; Darrell, T. Rich feature hierarchies for accurate object detection and semantic segmentation. In Proceedings of the IEEE Conference on Computer Vision and Pattern Recognition, Columbus, OH, USA, 23–28 June 2014; pp. 580–587. [Google Scholar]
- Girshick, R. Fast r-cnn. In Proceedings of the IEEE International Conference on Computer Vision, Santiago, Chile, 7–13 December 2015; pp. 1440–1448. [Google Scholar]
- He, K.; Gkioxari, G.; Dollár, P. Mask r-cnn. In Proceedings of the IEEE International Conference on Computer Vision, Venice, Italy, 22–29 October 2017; pp. 2961–2969. [Google Scholar]
- Redmon, J.; Divvala, S.; Girshick, R. You only look once: Unified, real-time object detection. In Proceedings of the IEEE Conference on Computer Vision and Pattern Recognition, Las Vegas, NV, USA, 27–30 June 2016; pp. 779–788. [Google Scholar]
- Redmon, J.; Farhadi, A. YOLO9000: Better.; faster.; stronger. In Proceedings of the IEEE Conference on Computer Vision and Pattern Recognition, Honolulu, HI, USA, 21–26 July 2017; pp. 7263–7271. [Google Scholar]
- Redmon, J.; Farhadi, A. Yolov3: An incremental improvement. arXiv 2018, arXiv:1804.02767. [Google Scholar]
- Bochkovskiy, A.; Wang, C.Y.; Liao, H.Y.M. Yolov4: Optimal speed and accuracy of object detection. arXiv 2020, arXiv:2004.10934. [Google Scholar]
- Li, C.; Li, L.; Jiang, H. YOLOv6: A single-stage object detection framework for industrial applications. arXiv 2022, arXiv:2209.02976. [Google Scholar]
- Wang, C.Y.; Bochkovskiy, A.; Liao, H.Y.M. YOLOv7: Trainable bag-of-freebies sets new state-of-the-art for real-time object detectors. arXiv 2022, arXiv:2207.02696. [Google Scholar]
- Liu, W.; Anguelov, D.; Erhan, D. Ssd: Single shot multibox detector. In Proceedings of the European conference on computer vision, Amsterdam, The Netherlands, 11–14 October 2016; Springer: Cham, Switzerland; pp. 21–37. [Google Scholar]
- Lin, T.Y.; Goyal, P.; Girshick, R. Focal loss for dense object detection. In Proceedings of the IEEE International Conference on Computer Vision, Venice, Italy, 22–29 October 2017; pp. 2980–2988. [Google Scholar]
- Everingham, M.; Eslami, S.M.A.; Van Gool, L. The pascal visual object classes challenge: A retrospective. Int. J. Comput. Vis. 2015, 111, 98–136. [Google Scholar] [CrossRef]
- Lin, T.Y.; Maire, M.; Belongie, S. Microsoft coco: Common objects in context. In Proceedings of the European Conference on Computer Vision, Zurich, Switzerland, 6–12 September 2014; Springer: Cham, Switzerland; pp. 740–755. [Google Scholar]
- Li, C.; Xu, C.; Cui, Z. Feature-attentioned object detection in remote sensing imagery. In Proceedings of the 2019 IEEE International Conference on Image Processing (ICIP), Taipei, Taiwan, 22–25 September 2019; IEEE: Piscataway, NJ, USA; pp. 3886–3890. [Google Scholar]
- Liu, Z.; Wang, H.; Weng, L. Ship rotated bounding box space for ship extraction from high-resolution optical satellite images with complex backgrounds. IEEE Geosci. Remote Sens. Lett. 2016, 13, 1074–1078. [Google Scholar] [CrossRef]
- Ma, J.; Shao, W.; Ye, H. Arbitrary-oriented scene text detection via rotation proposals. IEEE Trans. Multimed. 2018, 20, 3111–3122. [Google Scholar] [CrossRef] [Green Version]
- Xu, Y.; Fu, M.; Wang, Q. Gliding vertex on the horizontal bounding box for multi-oriented object detection. IEEE Trans. Pattern Anal. Mach. Intell. 2020, 43, 1452–1459. [Google Scholar] [CrossRef] [PubMed] [Green Version]
- Ding, J.; Xue, N.; Long, Y. Learning roi transformer for oriented object detection in aerial images. In Proceedings of the IEEE/CVF Conference on Computer Vision and Pattern Recognition, Long Beach, CA, USA, 15–20 June 2019; pp. 2849–2858. [Google Scholar]
- Xie, X.; Cheng, G.; Wang, J. Oriented R-CNN for object detection. In Proceedings of the IEEE/CVF International Conference on Computer Vision, Montreal, BC, Canada, 11–17 October 2021; pp. 3520–3529. [Google Scholar]
- Han, J.; Ding, J.; Li, J. Align deep features for oriented object detection. IEEE Trans. Geosci. Remote Sens. 2021, 60, 1–11. [Google Scholar] [CrossRef]
- Fang, Z.; Zhang, T.; Fan, X.H. A ViTDet based dual-source fusion object detection method of UAV. In Proceedings of the 2022 International Conference on Image Processing, Computer Vision and Machine Learning (ICICML), Xi’an, China, 28–30 October 2022; IEEE: Piscataway, NJ, USA; pp. 628–633. [Google Scholar]
- Wu, J.; Shen, T.; Wang, Q. Local Adaptive Illumination-Driven Input-Level Fusion for Infrared and Visible Object Detection. Remote Sens. 2023, 15, 660. [Google Scholar] [CrossRef]
- Sun, Y.; Cao, B.; Zhu, P. Drone-based RGB-infrared cross-modality vehicle detection via uncertainty-aware learning. IEEE Trans. Circuits Syst. Video Technol. 2022, 32, 6700–6713. [Google Scholar] [CrossRef]
- Wang, Q.; Chi, Y.; Shen, T. Improving RGB-infrared object detection by reducing cross-modality redundancy. Remote Sens. 2022, 14, 2020. [Google Scholar] [CrossRef]
- An, Z.; Liu, C.; Han, Y. Effectiveness Guided Cross-Modal Information Sharing for Aligned RGB-T Object Detection. IEEE Signal Process. Lett. 2022, 29, 2562–2566. [Google Scholar] [CrossRef]
- Yuan, M.; Wang, Y.; Wei, X. Translation, Scale and Rotation: Cross-Modal Alignment Meets RGB-Infrared Vehicle Detection. In Proceedings of the Computer Vision–ECCV 2022: 17th European Conference, Tel Aviv, Israel, 23–27 October 2022; Proceedings, Part IX; Springer Nature: Cham, Switzerland, 2022; pp. 509–525. [Google Scholar]
- Zhu, P.; Wen, L.; Bian, X. Vision meets drones: A challenge. arXiv 2018, arXiv:1804.07437. [Google Scholar]
- Xia, G.S.; Bai, X.; Ding, J. DOTA: A large-scale dataset for object detection in aerial images. In Proceedings of the IEEE Conference on Computer Vision and Pattern Recognition, Salt Lake City, UT, USA, 18–23 June 2018; pp. 3974–3983. [Google Scholar]
- Razakarivony, S.; Jurie, F. Vehicle detection in aerial imagery: A small target detection benchmark. J. Vis. Commun. Image Represent. 2016, 34, 187–203. [Google Scholar] [CrossRef] [Green Version]
- Pang, D.; Ma, P.; Feng, Y. Tensor Spectral k-support Norm Minimization for Detecting Infrared Dim and Small Target against Urban Backgrounds. IEEE Trans. Geosci. Remote Sens. 2023. [Google Scholar] [CrossRef]
- Fu, R.; Fan, H.; Zhu, Y. A dataset for infrared time-sensitive target detection and tracking for air-ground application. China Sci. Data 2022, 7, 206–221. [Google Scholar]
- Lin, T.Y.; Dollár, P.; Girshick, R. Feature pyramid networks for object detection. In Proceedings of the IEEE Conference on Computer Vision and Pattern Recognition, Honolulu, HI, USA, 21–26 July 2017; pp. 2117–2125. [Google Scholar]
- He, K.; Zhang, X.; Ren, S. Deep residual learning for image recognition. In Proceedings of the IEEE Conference on Computer Vision and Pattern Recognition, Las Vegas, NV, USA, 27–30 June 2016; pp. 770–778. [Google Scholar]
- Tan, M.; Pang, R.; Le, Q.V. Efficientdet: Scalable and efficient object detection. In Proceedings of the IEEE/CVF Conference on Computer Vision and Pattern Recognition, Seattle, WA, USA, 13–19 June 2020; pp. 10781–10790. [Google Scholar]
- He, K.; Zhang, X.; Ren, S. Spatial pyramid pooling in deep convolutional networks for visual recognition. IEEE Trans. Pattern Anal. Mach. Intell. 2015, 37, 1904–1916. [Google Scholar] [CrossRef] [PubMed] [Green Version]
- Wang, C.Y.; Liao, H.Y.M.; Wu, Y.H. CSPNet: A new backbone that can enhance learning capability of CNN. In Proceedings of the IEEE/CVF Conference on Computer Vision and Pattern Recognition Workshops, Seattle, WA, USA, 14–19 June 2020; pp. 390–391. [Google Scholar]
- Liu, S.; Qi, L.; Qin, H. Path aggregation network for instance segmentation. In Proceedings of the IEEE Conference on Computer Vision and Pattern Recognition, Salt Lake City, UT, USA, 18–23 June 2018; pp. 8759–8768. [Google Scholar]
- Li, B.; Liu, Y.; Wang, X. Gradient harmonized single-stage detector. In Proceedings of the AAAI Conference on Artificial Intelligence, Honolulu, HI, USA, 29–31 January 2019; Volume 33, pp. 8577–8584. [Google Scholar]
- Shrivastava, A.; Gupta, A.; Girshick, R. Training region-based object detectors with online hard example mining. In Proceedings of the IEEE Conference on Computer Vision and Pattern Recognition, Las Vegas, NV, USA, 27–30 June 2016; pp. 761–769. [Google Scholar]
- Ge, Z.; Liu, S.; Wang, F. Yolox: Exceeding yolo series in 2021. arXiv 2021, arXiv:2107.08430. [Google Scholar]
- Yang, X.; Yang, X.; Yang, J. Learning high-precision bounding box for rotated object detection via kullback-leibler divergence. Adv. Neural Inf. Process. Syst. 2021, 34, 18381–18394. [Google Scholar]
Figure 1.
Images of ground vehicles from a drone perspective, where (a) is a visible light image and (b) is an infrared image.
Figure 1.
Images of ground vehicles from a drone perspective, where (a) is a visible light image and (b) is an infrared image.

Figure 2.
YOLOv7-tiny structure, where (a) is the overall algorithm structure, (b) is the CSPSPP structure, and (c) is the multi-branch stacked structure. The backbone extracts the features of the input image and then neck fuses the features of different scales. The detection head predicts the position and type of the object and finally obtains the final detection result through NMS. The CSPSPP structure greatly increases the receptive field and separates the most significant contextual features, while the multi-branch stack module enables the network to learn more features and has stronger robustness by controlling the shortest and longest gradient paths.

Figure 3.
The object sizes of different classes were statistically analyzed: (a) shows the distribution of the original anchor boxes of YOLOv7-tiny on objects; (b) shows nine anchor boxes obtained by k-means clustering; (c) shows 15 anchor boxes obtained by k-means clustering; (d) shows the proposed method, where the first five rows are the object distributions of each class, the sixth row is the overall distribution, and the last row is the sample interval for anchor box division. Different color regions represent different groups of anchor boxes that are mainly responsible for predicting objects with different shapes.

Figure 4.
Statistical analysis of sample numbers for different classes. Red represents the sample count in infrared images, while blue represents the sample count in visible light images.
Figure 4.
Statistical analysis of sample numbers for different classes. Red represents the sample count in infrared images, while blue represents the sample count in visible light images.

Figure 5.
Loss function of cross-entropy, focal loss, and HSM Loss. When the confidence level of HSM Loss is less than 0.5, compared with the cross-entropy loss, it will be amplified, which is conducive to the learning of hard samples. In addition, when the confidence level is high, there is an upper limit for the attenuation, and the samples with a high confidence level still have the ability to continue learning.

Figure 6.
Detection results of YOLOv7-tiny and our proposed algorithm: (a,d) are ground truth for these images, (b,e) are for YOLOv7-tiny, while (c,f) are for our proposed algorithm; (a–c) are visible light images, while (d–f) are infrared images. Red circles indicate missed detection, while green circles indicate false detection.

Figure 7.
Detection results of our proposed algorithm with oriented object detection: (a) shows detection results on infrared images; (b) shows detection results on visible light images.
Figure 7.
Detection results of our proposed algorithm with oriented object detection: (a) shows detection results on infrared images; (b) shows detection results on visible light images.


Table 1.
Loss function of cross-entropy, focal loss, and HSM Loss.
| Methods | Anchor Boxes |
|---|---|
| YOLO-anchor | (12, 16), (19, 36), (40, 28); (36, 75), (76, 55), (72, 146); (142, 110), (192, 243), (459, 401) |
| Kmeans (3 × 3, RGB) | (28, 17), (39, 21), (18, 45); (34, 32), (45, 25), (25, 57); (54, 34), (67, 76), (43, 50) |
| Kmeans (3 × 5, RGB) | (29, 15), (16, 29), (35, 21), (18, 44), (43, 22), (30, 33), (20, 52), (47, 28), (25, 58), (44, 40), (35, 52), (64, 34), (51, 58), (35, 120), (98, 84) |
| Ours (RGB) | (21, 49), (27, 69), (28, 70), (34, 111), (37, 64); (42, 24), (49, 26), (58, 37), (91, 39), (52, 35); (43, 49), (62, 48), (85, 93), (91, 93), (30, 26) |
| YOLO-anchor | (12, 16), (19, 36), (40, 28); (36, 75), (76, 55), (72, 146); (142, 110), (192, 243), (459, 401) |
| Kmeans (3 × 3, IR) | (17, 31), (33, 19), (20, 50), (40, 48), (44, 25), (27, 58), (52, 34), (55, 58), (85, 110) |
| Kmeans (3 × 5, IR) | (15, 29), (30, 16), (28, 24), (20, 39), (40, 20), (18, 49), (46, 25), (36, 32), (22, 55), (29, 58), (54, 33), (42, 47), (55, 59), (37, 121), (104, 84) |
| Ours (IR) | (21, 50), (34, 164), (30, 71), (34, 111), (24, 53); (41, 24), (140, 46), (56, 36), (91, 40), (38, 28); (45, 49), (41, 50), (88, 90), (92, 98), (57, 54) |
Table 2.
Detection results of different anchor boxes.
| Anchor | Modality | Car | Truck | Freight Car | Bus | Van | mAP |
|---|---|---|---|---|---|---|---|
| YOLO-anchor | RGB | 96.06 | 73.66 | 53.52 | 94.35 | 51.34 | 73.79 |
| Kmeans (3 × 3) | 96.28 | 74.77 | 53.99 | 94.44 | 54.94 | 74.88 | |
| Kmeans (3 × 5) | 96.17 | 75.89 | 55.97 | 94.81 | 55.03 | 75.57 | |
| Ours | 96.19 | 75.75 | 57.34 | 94.52 | 56.68 | 76.10 | |
| YOLO-anchor | IR | 97.89 | 76.11 | 62.88 | 94.16 | 53.42 | 76.89 |
| Kmeans (3 × 3) | 98.03 | 76.79 | 65.27 | 94.62 | 56.74 | 78.29 | |
| Kmeans (3 × 5) | 98.08 | 77.89 | 66.48 | 94.54 | 58.34 | 79.07 | |
| Ours | 98.02 | 79.47 | 67.22 | 94.82 | 58.59 | 79.62 |
Table 3.
Detection results of different loss functions.
| Loss Function | Modality | Car | Truck | Freight Car | Bus | Van | mAP |
|---|---|---|---|---|---|---|---|
| Cross Entropy | RGB | 96.28 | 74.77 | 53.99 | 94.44 | 54.94 | 74.88 |
| Focal Loss | 96.15 | 71.04 | 47.79 | 93.71 | 50.82 | 71.90 | |
| HSM Loss | 96.43 | 74.96 | 55.86 | 94.96 | 56.38 | 75.72 | |
| Cross Entropy | IR | 98.03 | 76.79 | 65.27 | 94.62 | 56.74 | 78.29 |
| Focal Loss | 98.22 | 74.98 | 61.88 | 93.84 | 51.82 | 76.15 | |
| HSM Loss | 98.34 | 77.29 | 66.44 | 94.91 | 56.81 | 78.76 |
Table 4.
Detection results of different methods.
| Methods | Modality | Car | Truck | Freight Car | Bus | Van | mAP |
|---|---|---|---|---|---|---|---|
| Baseline | RGB | 96.28 | 74.77 | 53.99 | 94.44 | 54.94 | 74.88 |
| Baseline + HSM Loss | 96.43 | 74.96 | 55.86 | 94.96 | 56.38 | 75.72 | |
| Baseline + AR-anchor | 96.19 | 75.75 | 57.34 | 94.52 | 56.68 | 76.10 | |
| Ours | 96.09 | 75.89 | 57.35 | 95.19 | 57.00 | 76.31 | |
| Baseline | IR | 98.03 | 76.79 | 65.27 | 94.62 | 56.74 | 78.29 |
| Baseline + HSM Loss | 98.34 | 77.29 | 66.44 | 94.91 | 56.81 | 78.76 | |
| Baseline + AR-anchor | 98.02 | 79.47 | 67.22 | 94.82 | 58.59 | 79.62 | |
| Ours | 98.10 | 79.31 | 67.56 | 95.31 | 58.81 | 79.82 |
Table 5.
Detection results of different algorithms.
| Algorithm | Modality | Car | Trunk | Freight Car | Bus | Van | mAP |
|---|---|---|---|---|---|---|---|
| YOLOv5-s | RGB | 95.89 | 74.07 | 53.45 | 94.85 | 49.31 | 73.52 |
| YOLOX | 96.11 | 74.18 | 55.35 | 94.74 | 54.34 | 74.95 | |
| YOLOv7-tiny | 96.28 | 74.77 | 53.99 | 94.44 | 54.94 | 74.88 | |
| Ours | 96.09 | 75.89 | 57.35 | 95.19 | 57.00 | 76.31 | |
| YOLOv5-s | IR | 97.72 | 74.71 | 62.24 | 94.64 | 49.23 | 75.71 |
| YOLOX | 97.99 | 76.60 | 65.73 | 94.46 | 56.98 | 78.35 | |
| YOLOv7-tiny | 98.03 | 76.79 | 65.27 | 94.62 | 56.74 | 78.29 | |
| Ours | 98.10 | 79.31 | 67.56 | 95.31 | 58.81 | 79.82 |
Table 6.
Detection results of different oriented object detection algorithms.
| Algorithm | Modality | Car | Trunk | Freight Car | Bus | Van | mAP |
|---|---|---|---|---|---|---|---|
| ROI Transformer | RGB | 61.55 | 55.05 | 42.26 | 85.48 | 44.84 | 61.55 |
| S2ANet | 79.86 | 50.02 | 36.21 | 82.77 | 37.52 | 57.28 | |
| Oriented R-CNN | 80.26 | 55.39 | 42.12 | 86.84 | 46.92 | 62.30 | |
| Ours | 92.42 | 68.12 | 50.85 | 93.11 | 53.79 | 71.66 | |
| ROI Transformer | IR | 89.64 | 50.98 | 53.42 | 88.86 | 44.47 | 65.47 |
| S2ANet | 89.71 | 51.03 | 50.27 | 88.97 | 44.03 | 64.80 | |
| Oriented R-CNN | 89.63 | 53.92 | 53.86 | 89.15 | 40.95 | 65.50 | |
| Ours | 97.03 | 69.49 | 58.32 | 93.09 | 52.64 | 74.12 |
Table 7.
The parameter size, computational cost, and speed of different algorithms.
| Algorithm | Parameter (M) | FLOPs (G) | FPS |
|---|---|---|---|
| YOLOv5-s (HBB) | 7.033 | 15.980 | 96.3 |
| YOLOX (HBB) | 5.034 | 15.238 | 102.6 |
| YOLOv7-tiny (HBB) | 6.025 | 13.215 | 113.3 |
| Ours (HBB) | 6.043 | 13.273 | 118.0 |
| Ours (OBB) | 6.047 | 13.287 | 88.7 |
Disclaimer/Publisher’s Note: The statements, opinions and data contained in all publications are solely those of the individual author(s) and contributor(s) and not of MDPI and/or the editor(s). MDPI and/or the editor(s) disclaim responsibility for any injury to people or property resulting from any ideas, methods, instructions or products referred to in the content. |
© 2023 by the authors. Licensee MDPI, Basel, Switzerland. This article is an open access article distributed under the terms and conditions of the Creative Commons Attribution (CC BY) license (https://creativecommons.org/licenses/by/4.0/).
Share and Cite
MDPI and ACS Style
Hu, S.; Zhao, F.; Lu, H.; Deng, Y.; Du, J.; Shen, X. Improving YOLOv7-Tiny for Infrared and Visible Light Image Object Detection on Drones. Remote Sens. 2023, 15, 3214. https://0-doi-org.brum.beds.ac.uk/10.3390/rs15133214
AMA Style
Hu S, Zhao F, Lu H, Deng Y, Du J, Shen X. Improving YOLOv7-Tiny for Infrared and Visible Light Image Object Detection on Drones. Remote Sensing. 2023; 15(13):3214. https://0-doi-org.brum.beds.ac.uk/10.3390/rs15133214
Chicago/Turabian StyleHu, Shuming, Fei Zhao, Huanzhang Lu, Yingjie Deng, Jinming Du, and Xinglin Shen. 2023. "Improving YOLOv7-Tiny for Infrared and Visible Light Image Object Detection on Drones" Remote Sensing 15, no. 13: 3214. https://0-doi-org.brum.beds.ac.uk/10.3390/rs15133214
Note that from the first issue of 2016, this journal uses article numbers instead of page numbers. See further details here.