

Unmanned Aerial Vehicle Perspective Small Target Recognition Algorithm Based on Improved YOLOv5

1
School of Computer Science, Nanjing University of Posts and Telecommunications, Nanjing 210023, China
2
Jiangsu High Technology Research Key Laboratory for Wireless Sensor Networks, Nanjing 210023, China
3
Jiangsu HPC and Intelligent Processing Engineer Research Center, Nanjing 210023, China
*
Author to whom correspondence should be addressed.
Remote Sens. 2023, 15(14), 3583; https://0-doi-org.brum.beds.ac.uk/10.3390/rs15143583
Submission received: 19 June 2023
/
Revised: 11 July 2023
/
Accepted: 16 July 2023
/
Published: 17 July 2023
(This article belongs to the Special Issue Artificial Intelligence-Driven Methods for Remote Sensing Target and Object Detection)
Abstract
:Small target detection has been widely used in applications that are relevant to everyday life and have many real-time requirements, such as road patrols and security surveillance. Although object detection methods based on deep learning have achieved great success in recent years, they are not effective in small target detection. In order to solve the problem of low recognition rate caused by factors such as low resolution of UAV viewpoint images and little valid information, this paper proposes an improved algorithm based on the YOLOv5s model, called YOLOv5s-pp. First, to better suppress interference from complex backgrounds and negative samples in images, we add a CA attention module, which can better focus on task-specific important channels while weakening the influence of irrelevant channels. Secondly, we improve the forward propagation and generalisation of the network using the Meta-ACON activation function, which adaptively learns to adjust the degree of linearity or nonlinearity of the activation function based on the input data. Again, the SPD Conv module is incorporated into the network model to address the problems of reduced learning efficiency and loss of fine-grained information due to cross-layer convolution in the model. Finally, the detection head is improved by using smaller, smaller-target detection heads to reduce missed detections. We evaluated the algorithm on the VisDrone2019-DET and UAVDT datasets and compared it with other state-of-the-art algorithms. Compared to YOLOv5s, [email protected] improved by 7.4% and 6.5% on the VisDrone2019-DET and UAVDT datasets, respectively, and compared to YOLOv8s, [email protected] improved by 0.8% and 2.1%, respectively. For improving the performance of the UAV-side small target detection algorithm, it will help to enhance the reliability and safety of UAVs in critical missions such as military reconnaissance, road patrol and security surveillance.
1. Introduction
In recent years, the unmanned aerial vehicle (UAV) industry has developed rapidly, and UAVs have been widely used in various industries. Low-cost and easy-to-use consumer-grade UAVs have been developed and used in aerial photography, highway traffic, military reconnaissance, agriculture, construction and other fields, bringing great convenience to people. However, when using target recognition algorithms such as YOLO for small target detection tasks from the perspective of UAVs, there are still many challenges that need to be overcome which pose a significant challenge to target recognition tasks on the UAV side. According to the definition of the international organization SPIE, targets with sizes less than 0.12% of the original image are considered as small targets in this paper.
The YOLO (You Only Look Once) algorithm is widely used in image recognition tasks, and has also received a lot of attention in drone or remote sensing image recognition. The first version of YOLO, YOLOv1 [1], was first proposed by Redmon et al. in 2015, followed by YOLOv2 [2] and YOLOv3 [3], both also by Redmon et al. In 2020, Bochkovskiy et al. proposed YOLOv4 [4], and since then YOLOv5, YOLOv6, YOLOv7, YOLOv8 and other models have been developed, all of which play an important role in computer vision.
This article cites several previous studies. In Reference [5], this paper investigates how replacing certain structural elements of a model (as well as their connections and other parameters) affects performance and inference time. In this process, a series of models at different scales are proposed and named YOLO-Z. In Reference [6], the paper proposes to add a prediction head to detect objects of different scales based on YOLOv5. Then, the original prediction head is replaced with a transformer prediction head to explore the potential of self-attention mechanism. The Convolutional Block Attention Module (CBAM) is also integrated to find attention regions in scenes with dense objects. Attention regions are searched for in scenes with dense objects. Reference [7] selects YOLOv5s as the benchmark method of the article. By introducing the feature extraction structure of shufflenetv2, the backbone of YOLOv5s is improved to reduce the amount of calculation of the network, and then the attention mechanism CBMA module is added to the network. Reference [8] addressed the issue of imbalanced quantities of car model pictures in the dataset by using image processing techniques such as image flipping, adding Gaussian noise, and color changes to balance the number of car models. They also added a SimAM attention mechanism without parameters to the bottleneck to improve the network’s feature extraction ability. Reference [9] proposed a strategy combining the Faster-RCNN object detection model and three convolutional neural networks, ZF, VGG-16 and ResNet-101, which demonstrated good generalization ability on the dataset. Reference [10] presents an improved U-Net (SU-Net) model for water body detection by fusing deep neural networks for the interference of mixed and dark features on water body detection. Reference [11] proposes the use of a UAV to acquire aerial imagery of the study area through a predetermined mission. Then, the image data were processed using Structure in Motion (SfM) software to obtain a digital surface model (DSM), digital orthophoto map (DOM), point cloud and 3D model. Finally, the generated spatial data are analysed and studied by spatial feature extraction. Reference [12] proposes to segment the image using multi-resolution image segmentation technique with appropriate scale, compactness and smoothing to form homogeneous image objects. Various parameters (spectral, texture, background and elevation) are calculated for VHR UAV images. Urban feature extraction and classification rules are developed especially for roads and buildings. Segmented roads are classified based on their width and connectivity. Extracted buildings are classified based on their elevation and size. Finally, in Reference [13], a lightweight remote sensing rotating object detection model based on YOLOv5 is proposed in this study to improve the performance of remote sensing image object detection. To solve the problem of detecting rotating objects at any angle, the angle regression problem is transformed into a classification problem, enabling the model to predict an additional angle information that is used to rotate the horizontal bounding box to enclose the rotating objects at any angle. In response to the issue of dense distribution of small objects in remote sensing images, the detection layer structure of the model is improved and an object detection scale is added to pay more attention to small objects.
In summary, based on the application characteristics of the YOLOv5 object detection algorithm in small target recognition from the perspective of unmanned aerial vehicles (UAVs) and the advantages and disadvantages of previous research literature, this article designs a small target detection algorithm for the UAV perspective based on the YOLOv5s network structure, named YOLOv5s-pp. The following improvements were made: (1) The CA [14] attention mechanism was introduced, which can consider lightweight attention in both channel and spatial dimensions and can solve problems such as long-distance dependence. (2) The Meta-ACON [15] adaptive activation function was used, which can adaptively adjust the linear or nonlinear degree of the activation function based on the input data. (3) The SPD Conv [16] module was integrated into the network to reduce the loss of fine-grained information caused by cross-layer convolution and feature representation with low learning efficiency, improving the small target feature extraction ability. (4) The detection head of the network was optimized, using a smaller detection head which can reduce the overall loss and the occurrence of missed and false detections, improving the recognition performance of small target information features. Experimental results show that the improved YOLOv5s-pp algorithm has an [email protected] of 33.8% on the VisDrone2019-DET dataset, which is 7.4 percentage points higher than the original YOLOv5s network.
The remainder of this article is structured as follows. In Section 2, we briefly review the related work of this article. Section 3 briefly introduces the network structure of the Yolov5 algorithm. Section 4 provides detailed information on the modules of the proposed Yolov5s-pp algorithm. Section 5 presents the experimental results. Finally, Section 6 presents the conclusions.
2. Related Work
In this section, we provide a summary of work related to the research presented in this paper. The summary is divided into two parts: general object detection strategies and methods for detecting small objects.
2.1. General Object Detection
Currently, deep convolutional neural networks dominate the field of object detection. Object detection algorithms can be divided into two categories: single-stage and two-stage (region-free and region-based). Single-stage detectors (region-free detectors) directly predict the location of objects without extracting suggestions, such as SSD [17], YOLO and RetinaNet [18]. Two-stage detectors (region-based detectors) generate a set of region proposals and then predict the object categories within the proposed regions of interest (RoIs) and refine the proposals based on the defined position and size. This approach has been adopted in methods such as Fast R-CNN [19], Faster R-CNN [9] and Cascade R-CNN [20]. Typically, single-stage methods are faster than two-stage methods, while two-stage methods have higher accuracy than single-stage methods. With improvements in recent years, single-stage methods (such as YOLO, RetinaNet, etc.) have also made progress, and the overall performance of the algorithms is superior to two-stage methods. However, these algorithms are designed for general object detection and are not good at detecting small and dense objects.
2.2. Small Object Detection
Compared to general image detection, object detection in aerial drone imagery is more challenging. This is because the objects to be detected in aerial imagery are relatively small, their distribution is uncertain and they can be particularly sparse or concentrated, making the distribution uneven and resulting in a large number of overlapping objects to be detected. As a result, many studies have focused specifically on the detection of small objects. For example, in [21], VariFocal is used to replace the binary cross-entropy loss function in the original classification to overcome the problem of uneven sample distribution and improve detection recall. Meanwhile, the Coordinating Attention (CA) mechanism is added to improve the detection accuracy. In [22], the Cross-Layer Context Fusion Module (CCFM) is proposed, which learns different scales of context information in parallel through multiple branches to improve the representational ability of feature information and the recognition ability of the network. To address the problem of spatial information loss of small objects, the Spatial Information Enhancement Module (SIEM) is designed to adaptively learn the weak spatial information to be protected for small objects. In [23], anchor boxes are assigned according to the aspect ratio of the ground truth box to provide the network with prior information about the shape of the object. The network uses the Hard Sample Mining Loss (HSM Loss) function to guide learning and provide prior information about the shape of the object. In [24], appropriate spatial information is adaptively obtained through multi-scale receptive fields to improve the feature extraction capability. In addition, a Segmentation Fusion (SF) submodule is proposed to effectively reduce the time complexity of ASPConv, and a Fast Multi-Scale Fusion (FMF) module is proposed to alleviate the shortcomings of semantic and spatial information fusion.
The aim of this paper is to address the challenges of detecting small and unevenly distributed objects in drone aerial imagery. We choose the relatively lightweight Yolov5s network model as the base algorithm and adopt the Meta-ACON adaptive activation function. This function adaptively learns and adjusts the linear or nonlinear degree of the activation function based on the input data in order to fully learn the feature information in the input data. To reduce the fine-grained information loss caused by cross-layer convolution and the decrease in the efficiency of feature representation, we integrate the SPD Conv module into the integrated network. To address the problem of small objects, we optimise the detection head by using a smaller detection head, which can not only reduce the overall loss, but also reduce the number of missed detections and false detections. To address the problem of information loss due to long-range dependencies, we introduce the CA attention mechanism, which considers lightweight attention in both the channel and spatial dimensions in parallel to improve the feature extraction capability.
3. YOLOv5s Algorithm
The YOLOv5 algorithm is a single-stage target detection algorithm that can complete target detection in a single step. YOLOv5 offers four models in different sizes: YOLOv5s, YOLOv5m, YOLOv5l and YOLOv5x. To improve the detection accuracy while maintaining the detection speed, we chose the YOLOv5s lightweight model. This model follows the detection idea of the YOLO series, which is to divide the input image into a grid and detect the object by detecting the center point of the object within a certain grid.
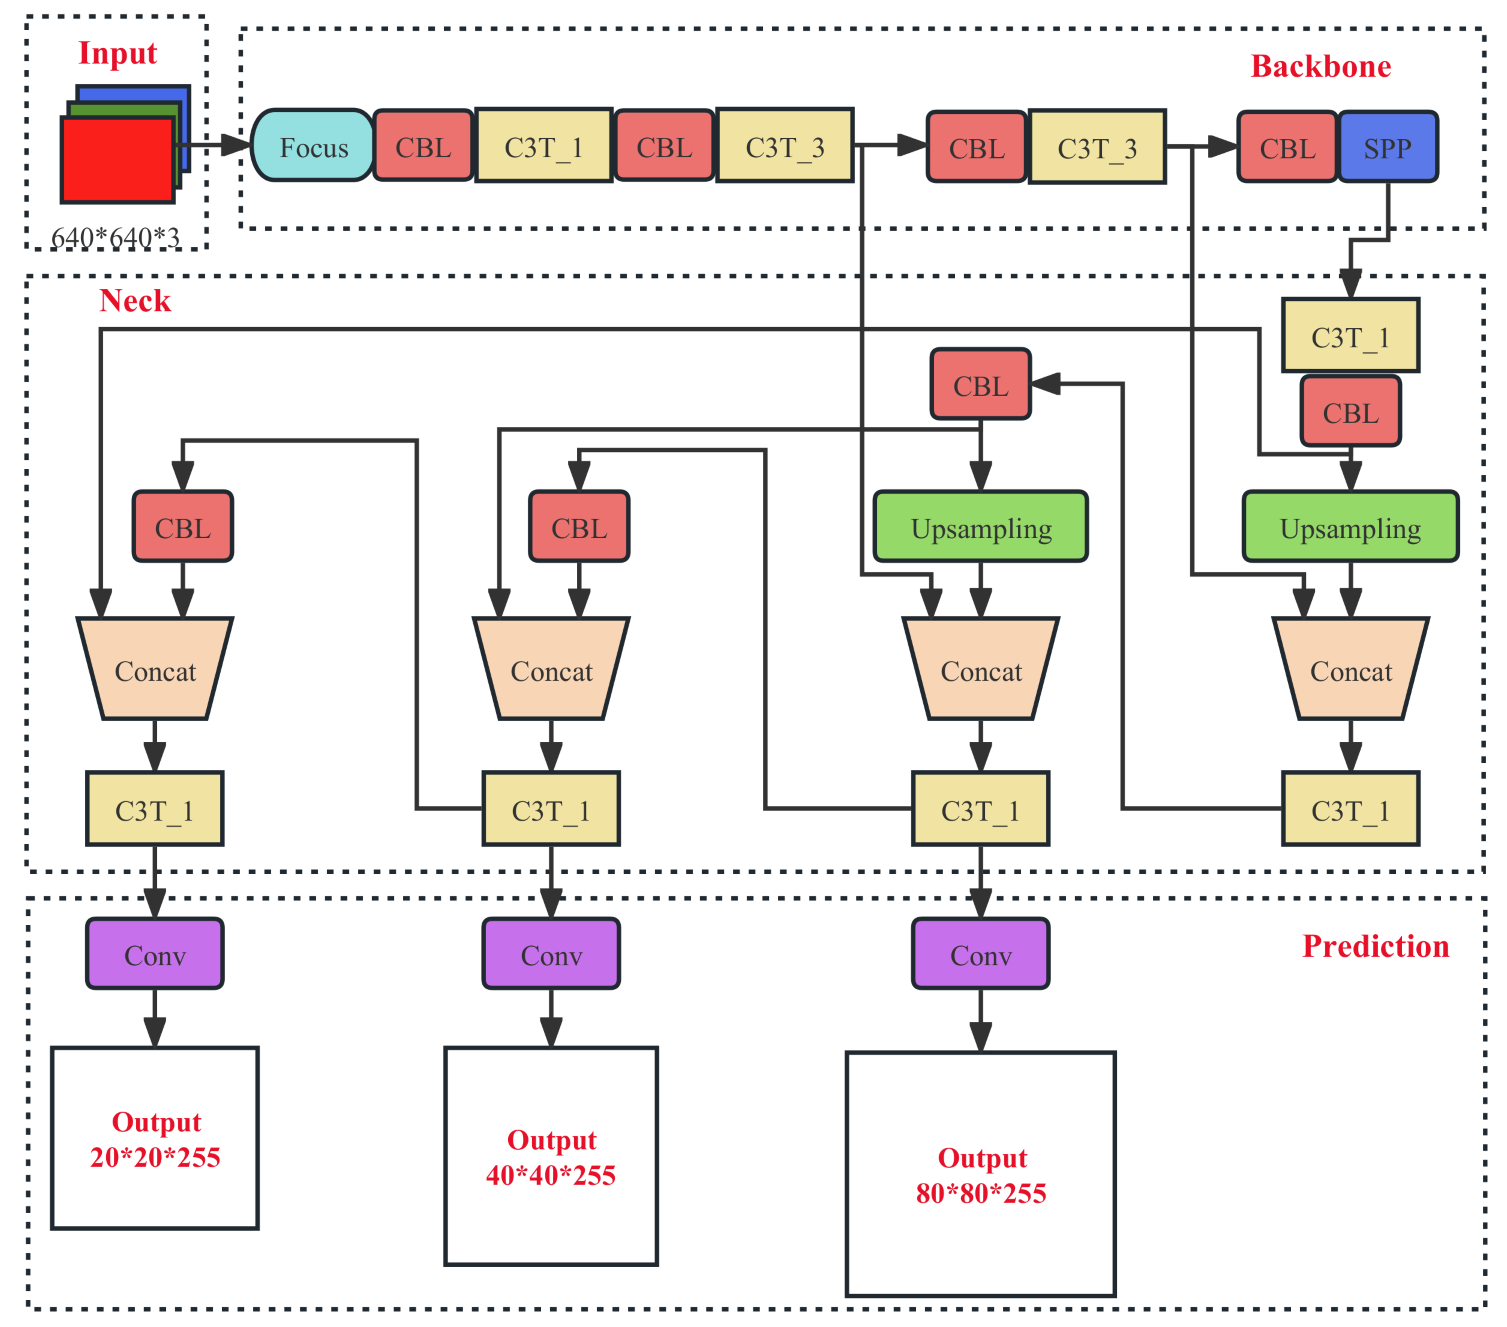
The YOLOv5s model consists of four parts: input, Backbone, Neck, and output (also called head/predict). This paper briefly introduces the YOLOv5s network model using the YOLOv5s-5.0 version as the baseline network. The overall network structure is shown in Figure 1.
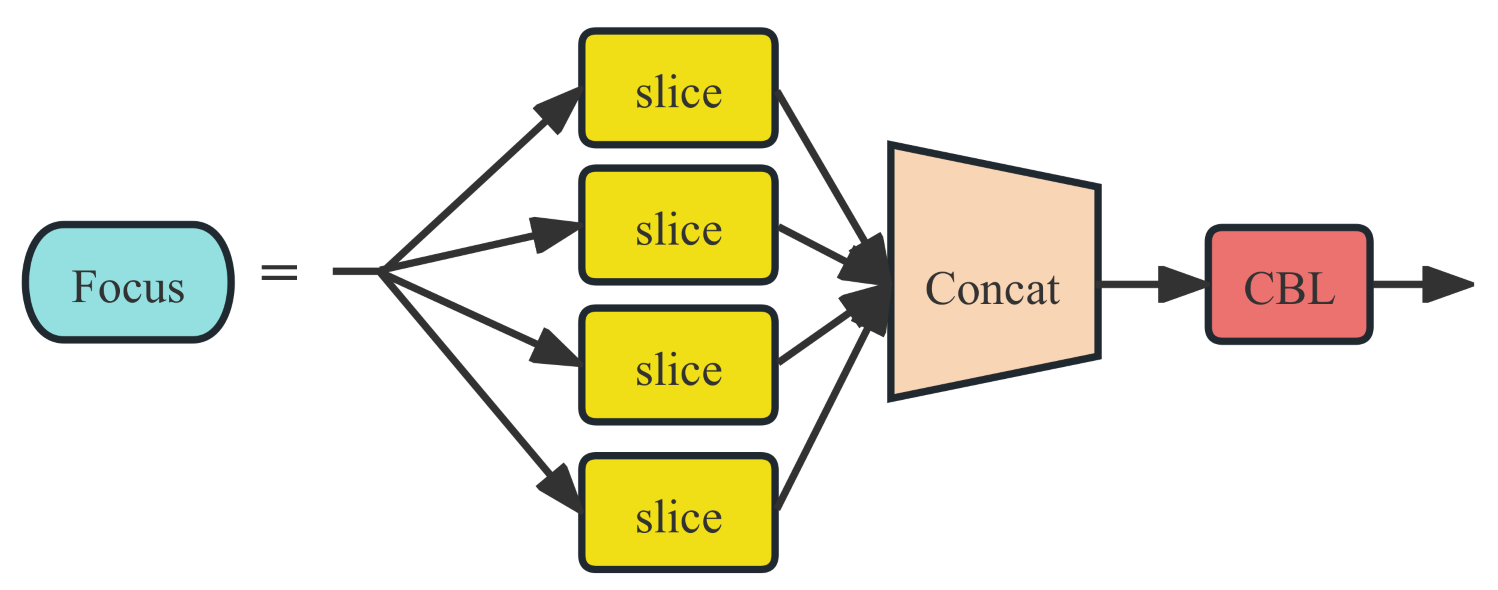
The Focus module mainly performs slicing and reorganization of the input data, and then passes the output data to the next module through CBL operation. This module can better capture the details of objects while reducing computation and memory consumption. The structure diagram of the Focus module is shown in Figure 2.
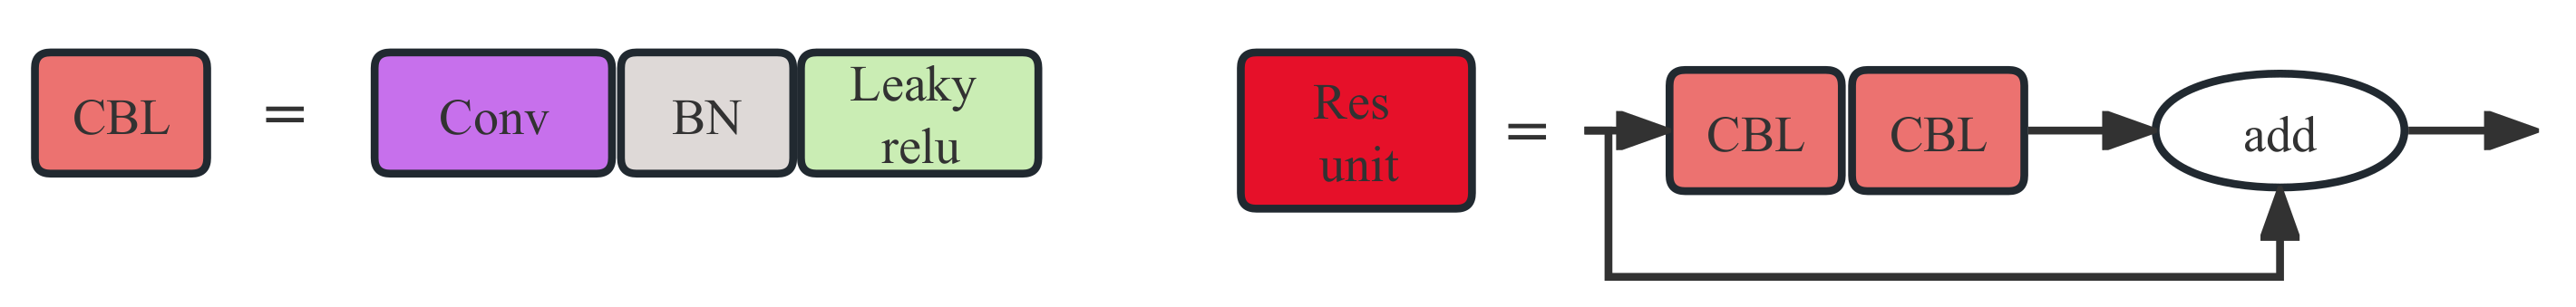
The CBL module consists mainly of a convolution operation, followed by batch normalization and the SiLU [25] activation function, and then outputs the data to the next module. The Res-unit (residual module) consists mainly of a convolution and a convolution. By introducing skip connections, the residual module allows information to flow more smoothly through the network, reducing the problems of gradient vanishing and gradient explosion. Additionally, the residual module can improve the network’s expressive power, enabling it to better fit complex nonlinear functions. The structure diagrams of the CBL module and the Res-unit module are shown in Figure 3.
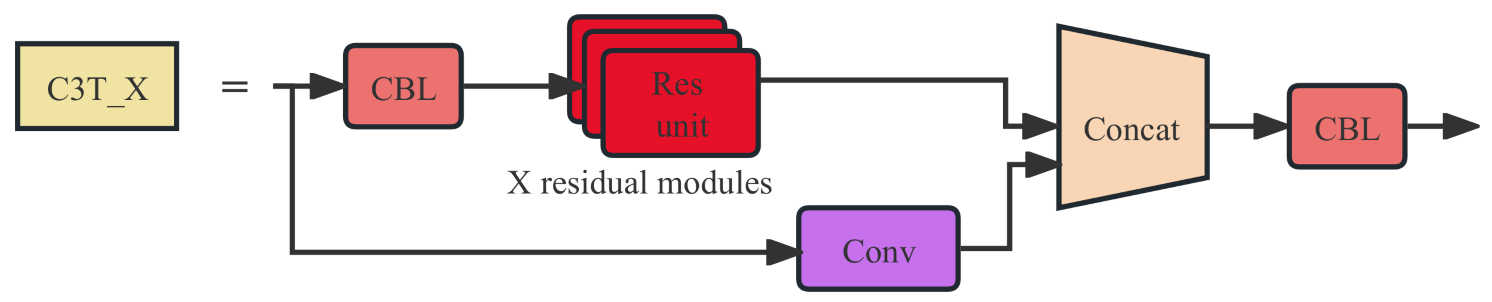
The YOLOv5s model extensively uses the C3 module structure, which is an improvement over the bottleneckCSP structure. In addition, residual modules can be added to the C3 module to make parameter passing more stable, ensuring the overall learning stability of the network. The structure diagram of the C3 module is shown in Figure 4.
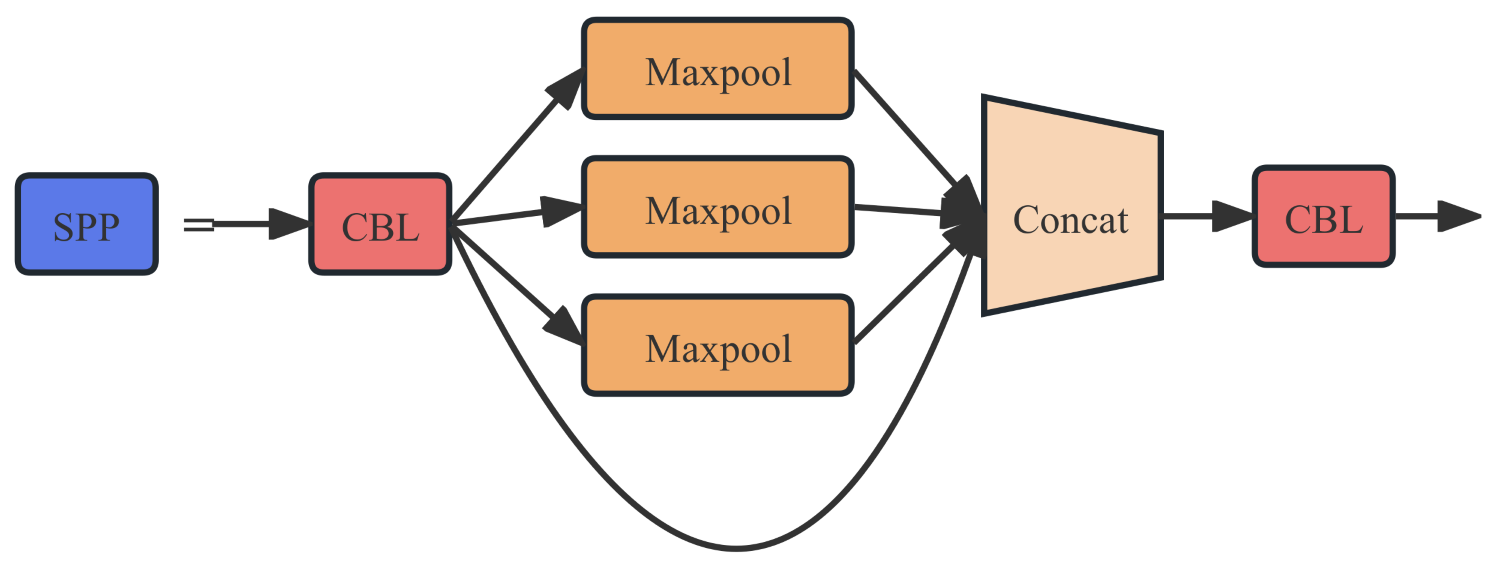
The SPP (Spatial Pyramid Pooling) module is a convolutional neural network module used to enhance feature extraction capabilities. This module can accept input feature maps of any size and output fixed-size feature vectors. The SPP module mainly consists of two convolutional layers, a pooling layer and a concatenation layer. The module uses max pooling to reduce the computational load of network parameters, while also increasing the receptive field. The structure diagram of the SPP module is shown in Figure 5.
4. YOLOv5s-pp Algorithm
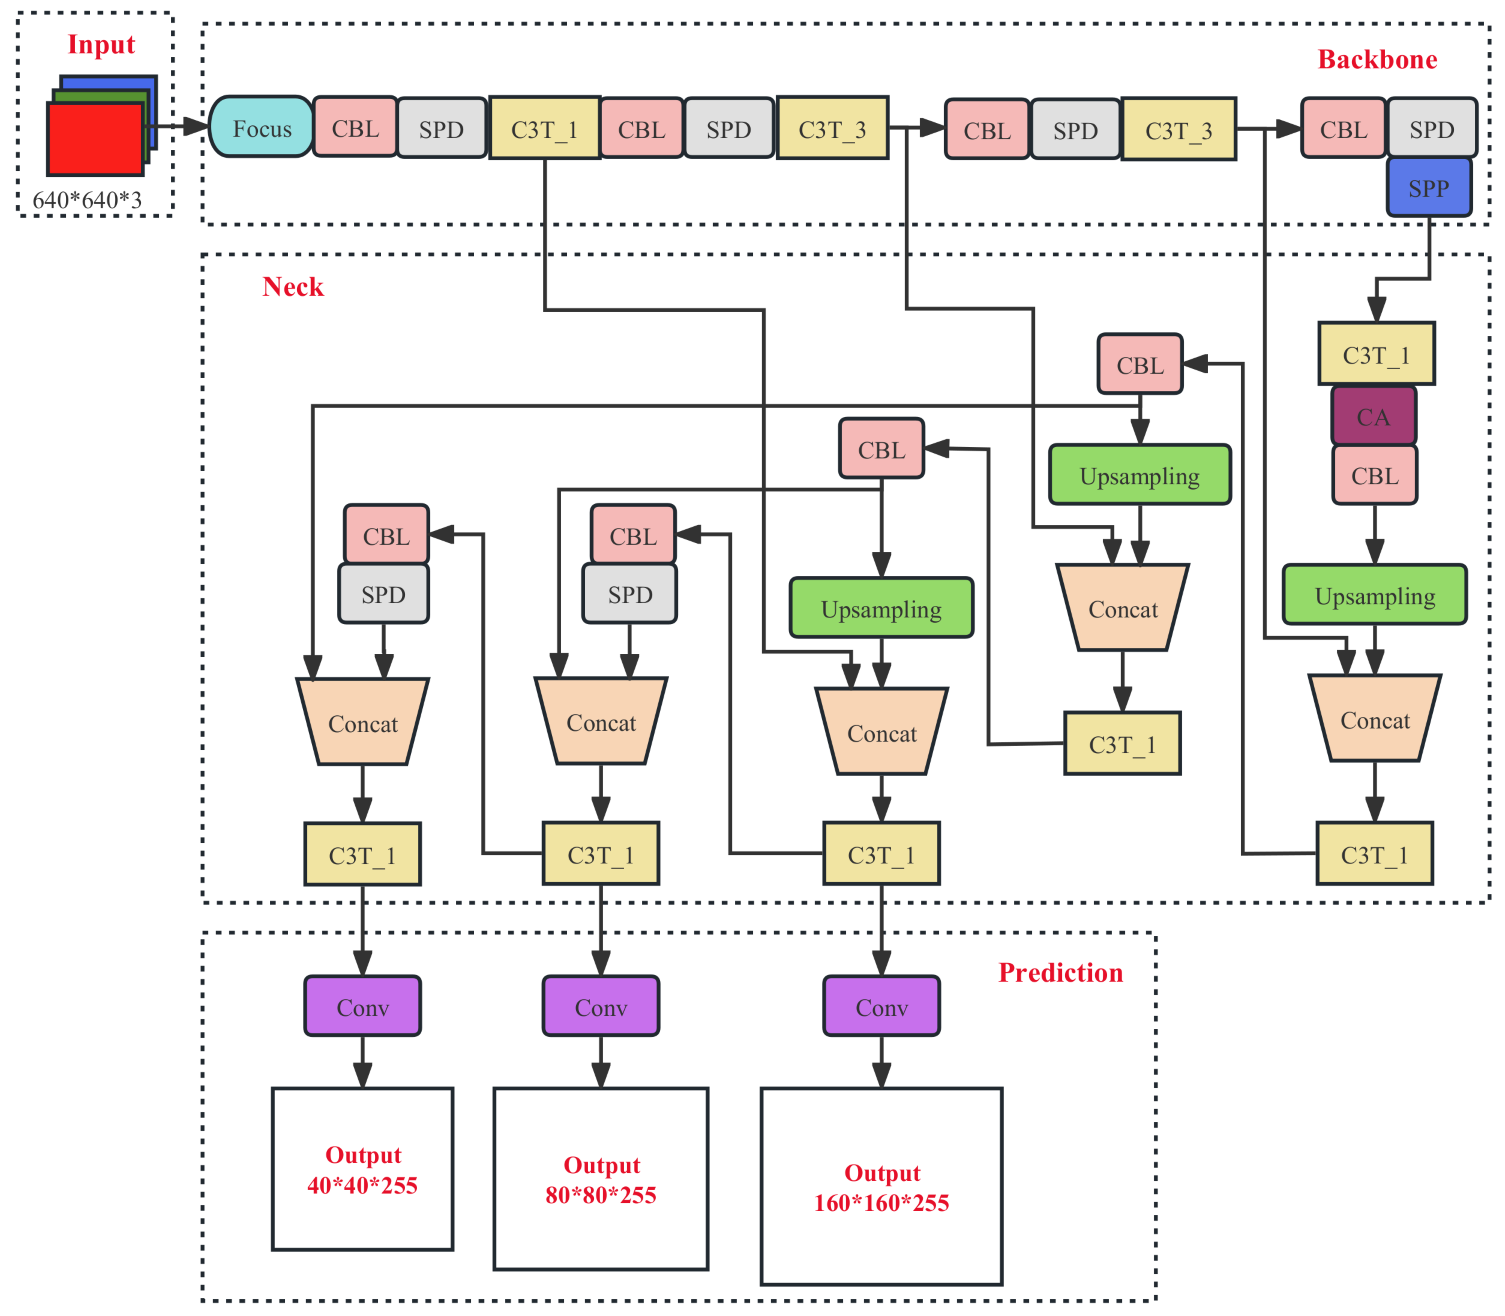
The optimization of the YOLOv5s-pp algorithm compared to the YOLOv5s algorithm mainly involves four aspects: using the Meta-ACON activation function, introducing the CA attention mechanism, optimizing the small target detection head and integrating the SPD Conv module. These optimization measures can effectively improve the recognition performance of the model, making the YOLOv5s-pp algorithm perform better in small target detection tasks. The Meta-ACON activation function can improve the model’s generalization ability and robustness, the CA attention mechanism can improve the model’s focus on important features, the small target detection head can improve the model’s small target detection ability and the SPD Conv module can further improve the model’s feature representation ability. The overall network structure of YOLOv5s-pp is shown in Figure 6.
The improved YOLOv5s-pp network model has a certain increase in depth compared to the YOLOv5s model, and the number of parameters in the whole model increases by about 3.3M compared to YOLOv5s. As the width and depth of the network model increases, the amount of computation required by the model increases and the inference speed of the model decreases, so we hope to make the small target detection algorithm achieve better results with as little increase in the complexity of the network model as possible.
4.1. Meta-ACON Activation Function
To improve the forward propagation and generalization capabilities of the YOLOv5s model, we used the Meta-ACON activation function instead of the original SiLU activation function. The Meta-ACON activation function is a function that combines the ReLU [26] and Swish [27] activation functions, and it can not only better solve the problem of neuron death, but also adaptively choose whether to activate neurons and adaptively choose the degree of linearity or nonlinearity of the activation function. The introduction of this activation function can effectively improve the performance and generalization ability of the model, making it more robust and adaptive.
The formula for can be obtained from the definition of smooth maximum [28], as shown in equation:
Assuming that the function , and then using the above Smooth maximum formula to obtain its smooth approximation function, the following formula can be obtained, as shown in this equation:
Let ,, and the expression of Meta-ACON can be obtained, as shown in this equation:
The parameters and of Meta-ACON are two learnable parameters that control the upper and lower limits of the function. The parameter represents the Sigmoid function. The parameter is responsible for dynamically controlling the linearity or nonlinearity of the activation function and adapting the degree of nonlinearity for each layer. In order to make the linear and nonlinear capabilities of the Meta-ACON activation function adaptive, a module is proposed to dynamically learn from the input feature , in order to dynamically adaptively control the linear or nonlinear capabilities of the function. This customised behaviour of the activation function helps to improve generalization and propagation performance. The formula is shown in this equation:
The design space of the adaptive function includes channels, pixels and layers, and the shared parameter of the channel is used here. First, the mean values of the H and W dimensions are calculated, respectively, and then two convolution layers are used to make all pixels in each channel share a weight. Finally, the Sigmoid activation function is used to obtain . It should be noted that a scaling parameter r is added between and to reduce the parameters, which is set to 16 by default.
4.2. SPD Conv Module
Convolutional Neural Networks (CNNs) have achieved tremendous success in computer vision for object detection and image classification tasks. However, for small object detection tasks, especially those involving small objects with overlapping occlusions, their performance can drop dramatically. One of the reasons for this is that the use of cross-convolutional layers can lead to the loss of fine-grained information and low learning efficiency of the feature representation. To solve this problem, we introduce the SPD Conv module to eliminate the effect of each cross-convolution layer. This approach can perform better in small object detection tasks. The SPD Conv module can effectively preserve the detailed information in the image while improving the learning efficiency and feature representation ability of the model.
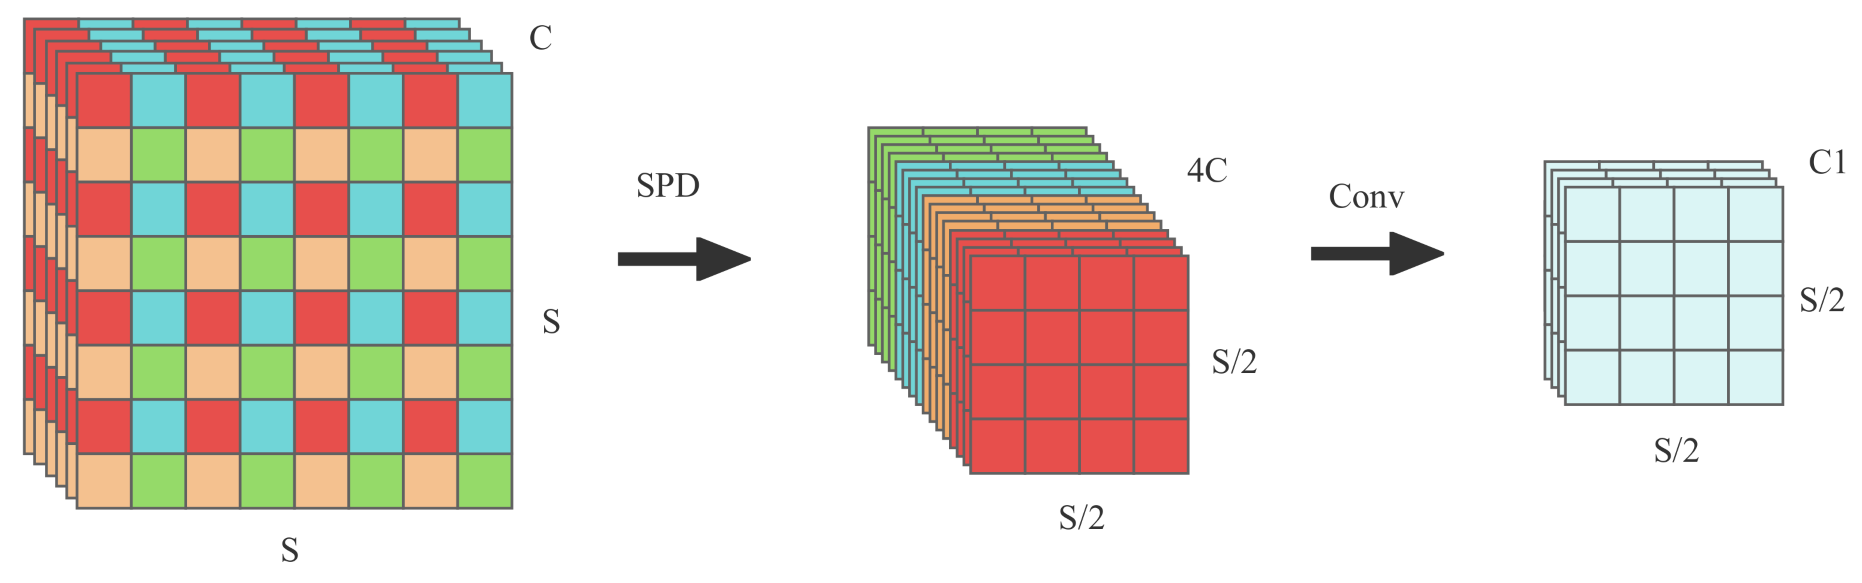
Consider any intermediate feature map X of size , and slice, merge and convolve a series of subfeature maps as shown in Figure 7.
The SPD component integrates the input feature map transformation technique into the entire YOLOv5 network, downsampling the feature maps throughout the network. The specific splitting formula is shown in equation:
Given any feature map X, the submaps are formed by all entries that can be divided proportionally by and . Therefore, each submap downsamples X by a proportional factor, resulting in four submaps , , , and , each downsampling X by a factor of 2x. These submaps are then concatenated along the channel dimension to obtain a feature map , which has reduced spatial dimensions by a proportional factor and increased channel dimensions by a proportional factor two.
After the SPD operation, a non-strided convolution with a stride of one is used to process the output feature map. This is done to preserve as much feature map information as possible. Using a strided convolution could result in the loss of some feature map information. In addition, channel compression on the feature map after the SPD operation does not result in a significant loss of feature information, as each pixel along the channel direction is a sparse matrix and most of the compressed information is not significant. Therefore, we use non-strided convolution to preserve the feature map information and channel compression to reduce the computational complexity of the model while maintaining its performance stability.
4.3. Small Target Detection Head
When detecting objects, YOLOv5s algorithm may encounter problems detecting small targets from the drone’s perspective, such as missed detection or poor detection performance. Although YOLOv5’s default detection heads can complete multi-scale object detection tasks, they may not perform well on detecting small targets. Therefore, we use smaller detection heads to address this issue. Directly adding a small target detection head would increase the number of model parameters and decrease the inference speed, and the overall detection performance may suffer. Therefore, we decided to change the size of the three detection heads in YOLOv5 and set the corresponding prior box sizes. This approach can effectively improve the model’s detection capability and accuracy without significantly affecting the model’s computational speed and inference efficiency.
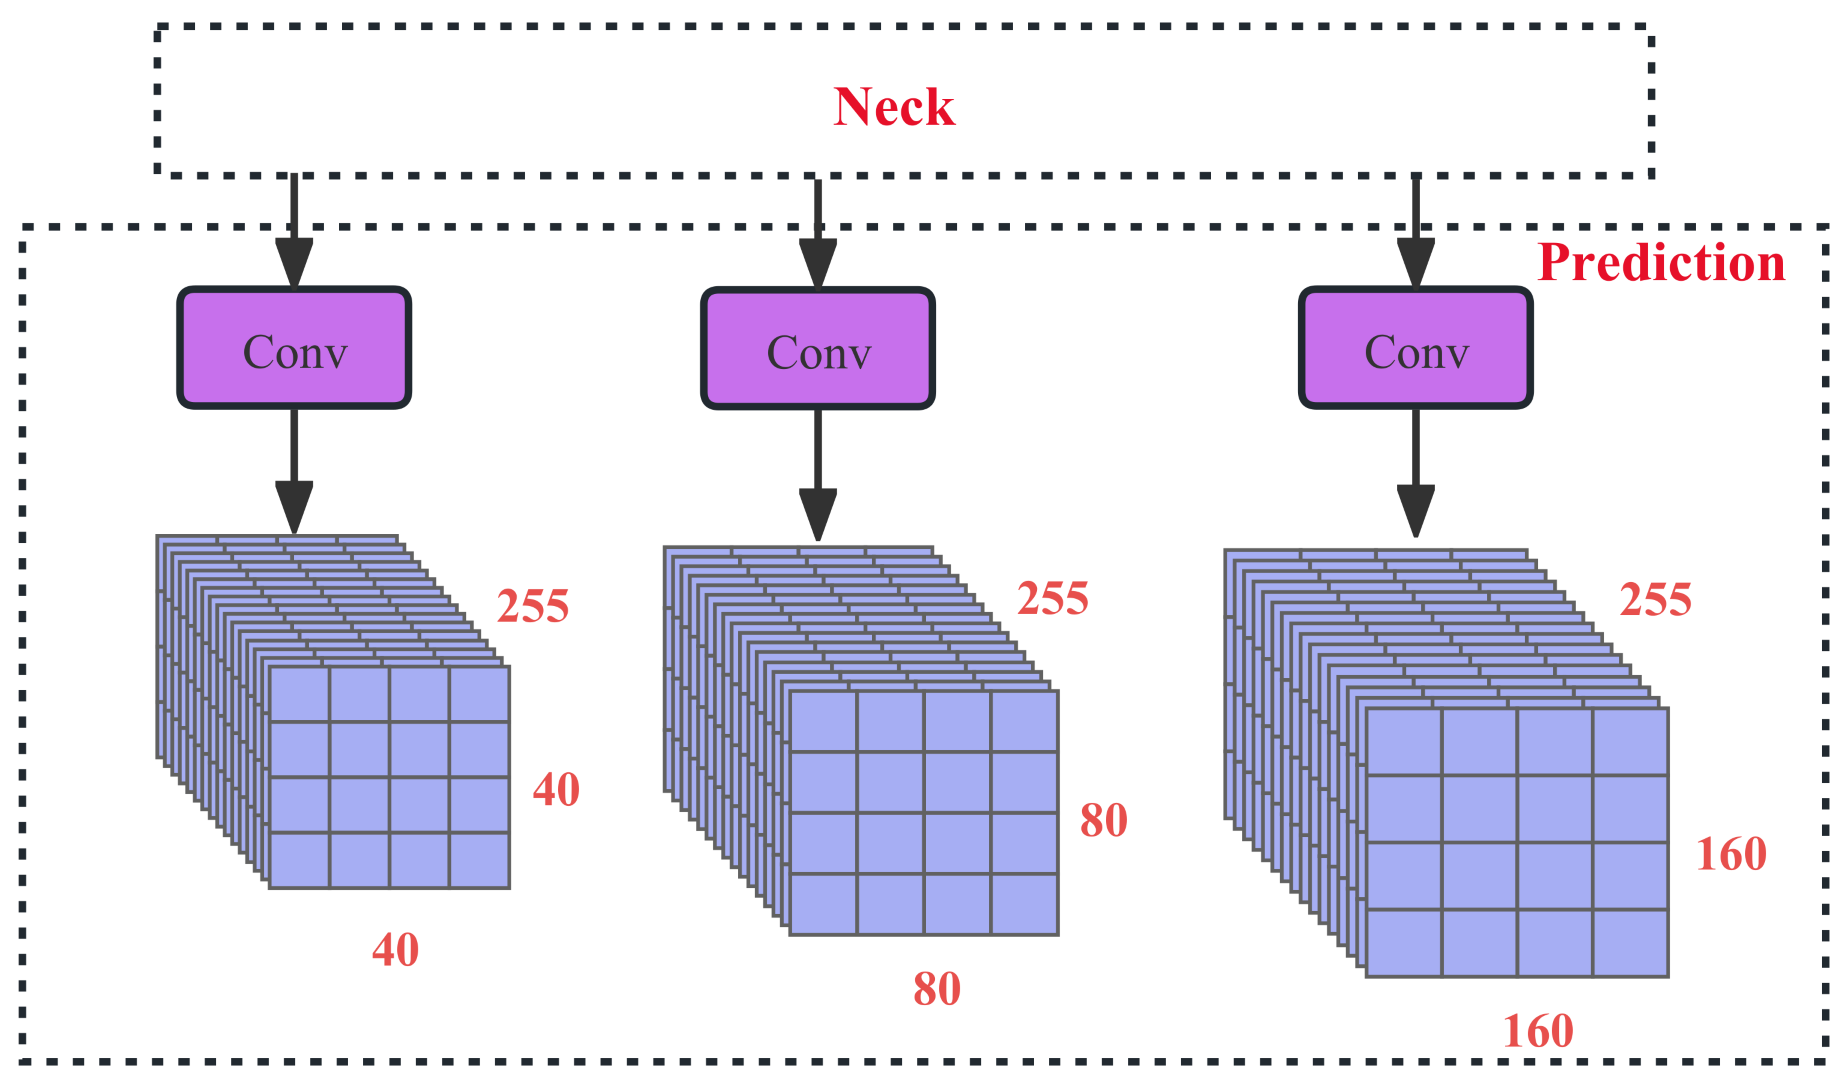
The structure of the output section of the YOLOv5s-pp head is shown in Figure 8.
To match the changed size of the detection heads, the anchor size of the prior boxes must be changed to improve detection performance on small targets. The anchor sizes of the prior boxes are set as shown in Table 1.
On the YOLOv5s-pp model, we introduced a new detection head through the first feature of the C3 layer, shown in Figure 6. The detection head has a resolution of pixels, which corresponds to only two downsampling operations in the backbone network and contains richer low-level feature information. A further upsampling operation is performed in the Neck network to obtain features at the same scale as the input feature map from the backbone network, followed by feature fusion by concatenation. The output feature is the fusion result of multiple input features, which enables the detection head to detect small targets more effectively. The modified small target detection head can better focus on the small target features in the feature map and is more sensitive to small targets. Adding this detection head adds almost no computational and memory overhead to the model, but significantly improves the model’s ability to detect small targets.
4.4. Coordinate Attention Mechanism
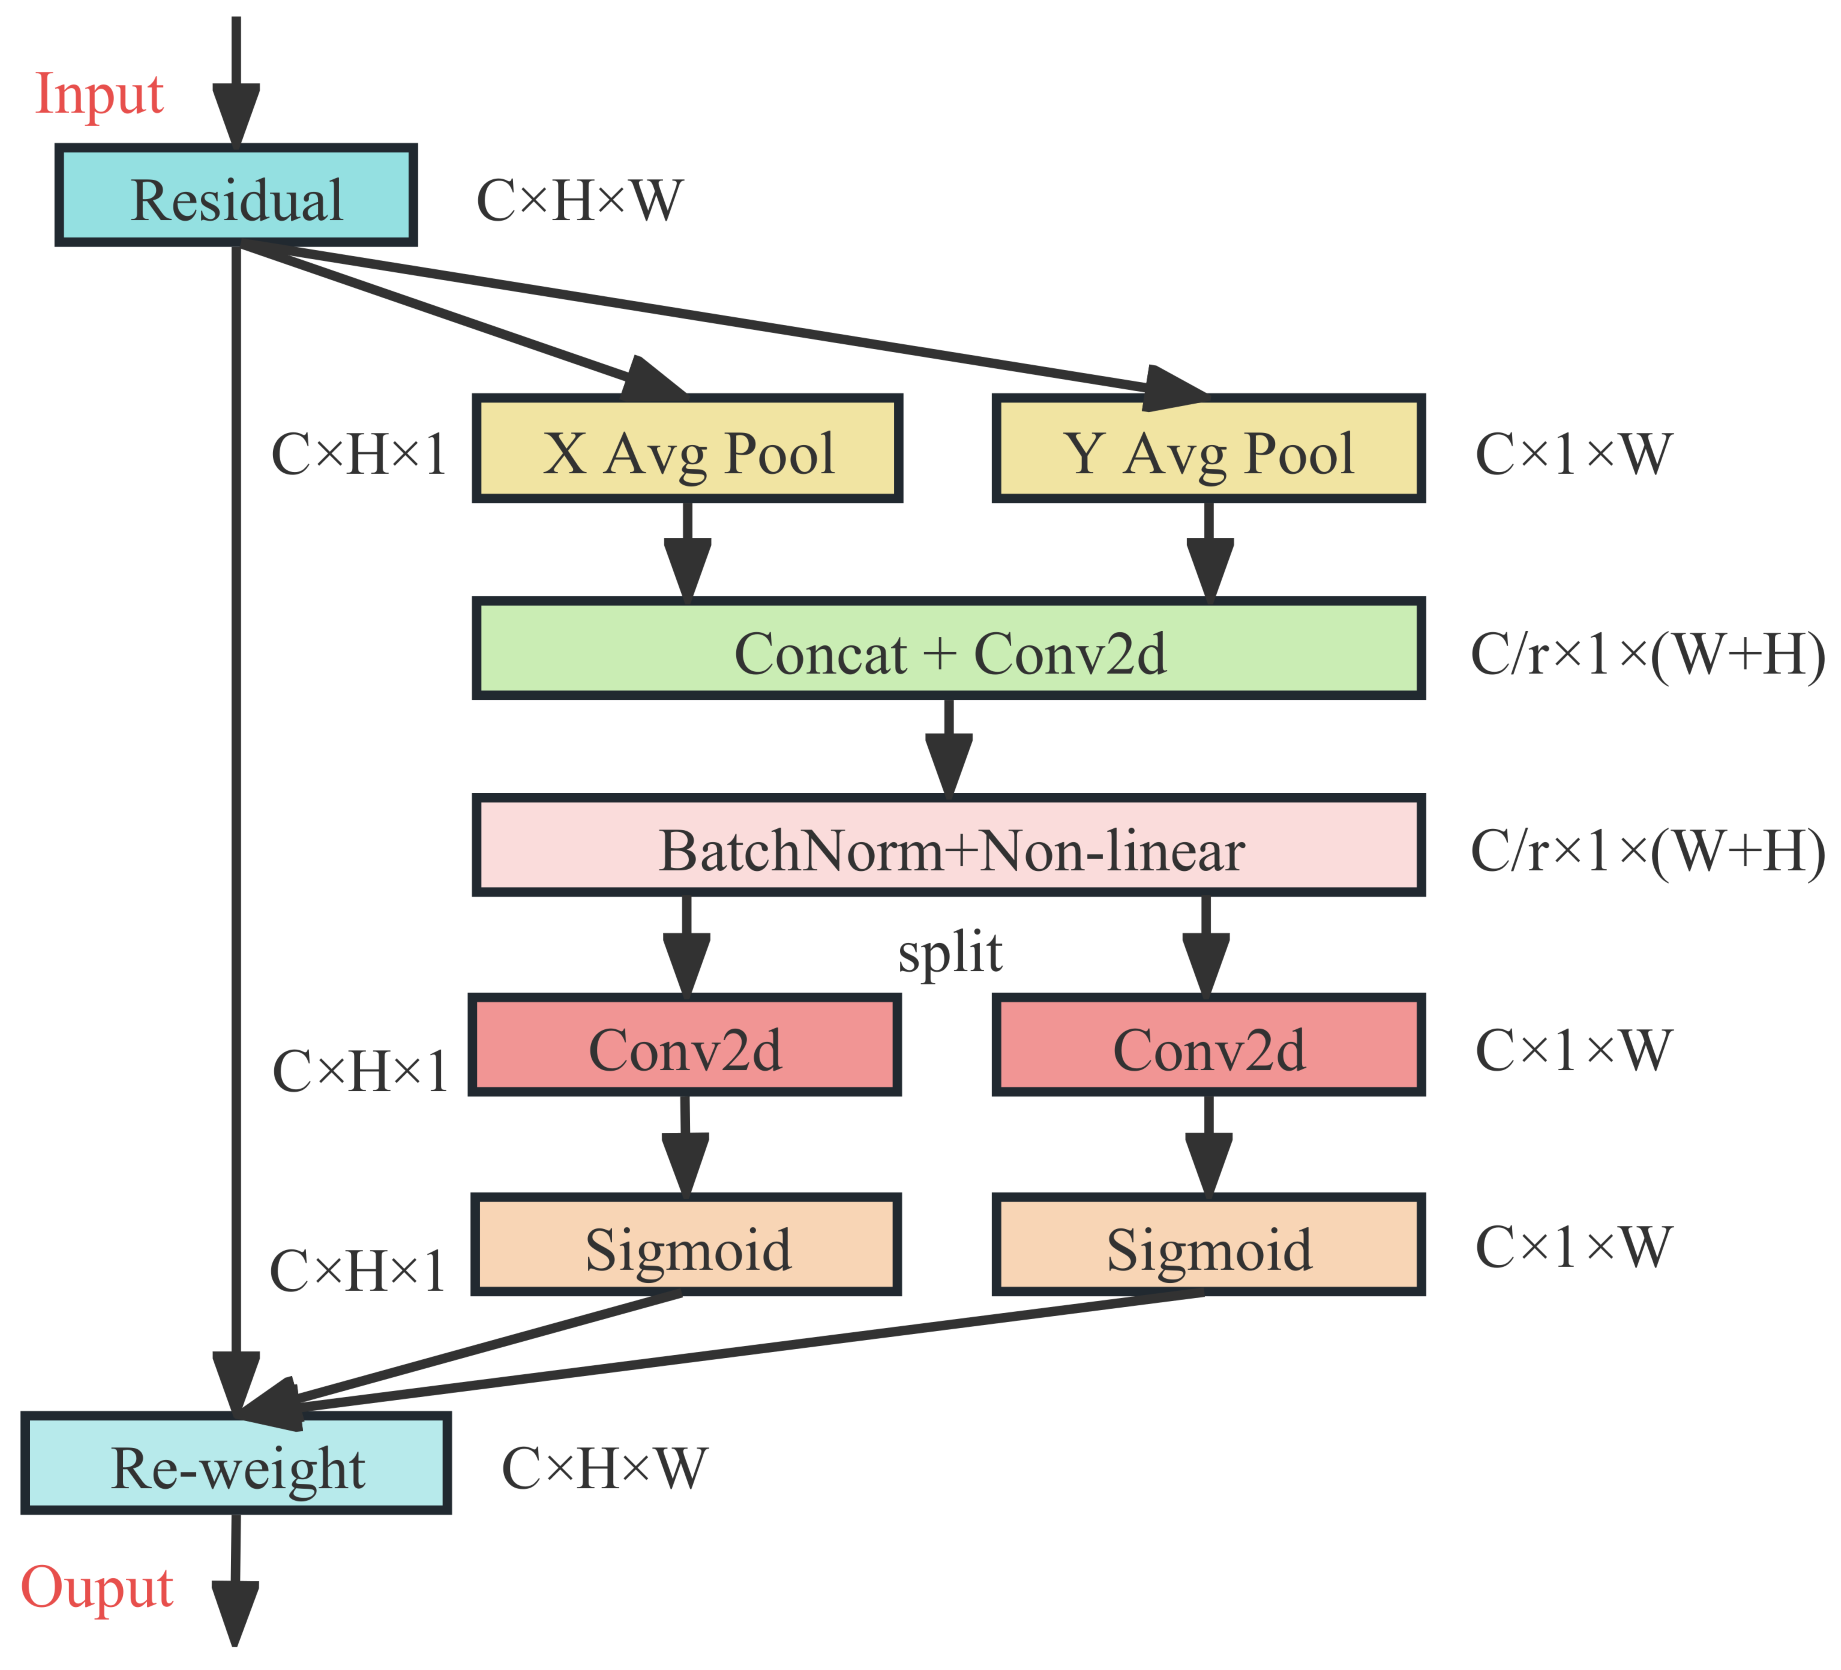
In the YOLOv5s-pp network model, we incorporated the Coordinate Attention (CA) mechanism, which allows the model to focus on key information from a large amount of information and better attend to the detailed features of the input feature map, thus improving the recognition performance of small targets. In convolutional neural networks, attention mechanisms such as SENet [29,30,31] and CBAM [32,33] are widely used, but the SENet attention mechanism only focuses on channel dimension information and does not consider spatial dimension information, while the CBAM attention mechanism, although it integrates both channel and spatial dimension information, cannot solve the problem of long-distance dependencies in spatial dimensions. The CA attention mechanism is a lightweight attention mechanism that concurrently considers both channel and spatial dimensions and can solve problems such as long-distance dependencies. Therefore, we chose to incorporate the CA attention mechanism into YOLOv5s-pp to improve the model’s recognition capability and accuracy for small targets.
The flowchart of the Coordinate Attention (CA) mechanism is shown in Figure 9.
For the input feature map of size , average pooling operations are performed along the horizontal and vertical directions of the feature map. A pooling kernel is used in the horizontal direction (X direction) to obtain an information feature map through global average pooling, as shown in this equation:
Similarly, an pooling kernel is used in the vertical direction (Y direction) to obtain a information feature map through global average pooling, as shown in this equation:
The two information feature maps and , obtained by pooling operations, are concatenated along the spatial dimension. The concatenated feature map is then passed through a convolutional layer with an activation function. The resulting feature map is then sliced along the spatial dimension to obtain two separate feature maps. Each of these feature maps is passed through a convolutional layer with an activation function, resulting in two attention vectors and . The specific equations for these operations are shown in this equation:
where: .
The two attention vectors and obtained in the previous step are broadcast to the dimensions of and multiplied element-wise with the input feature map after residual operations to obtain the final attention features. The equation is shown here:
The CA attention mechanism considers not only the importance of different channel information, but also the importance of spatial information. It concatenates the global features in the horizontal and vertical directions to form the whole global feature, which helps to solve the problem of long-range dependencies to some extent. This allows coordinate attention to more accurately locate the position of the object of interest, thereby improving the recognition performance of the whole model.
5. Experiments
5.1. Experimental Environment Introduction
In the experimental part of this paper, we have chosen the UAV view small target detection datasets VisDrone2019-DET and UAVDT as the experimental datasets. Where the VisDrone2019-DET dataset was used as the main test dataset for the experiments, the UAVDT dataset was used to further test the robustness and applicability of the model. All the images in these two datasets are from the aerial view of UAVs, which are typical UAV view small target detection datasets. Among them, VisDrone2019-DET is a dataset collected and published by the AISKYEYE team [34], which ensures the rigour of the dataset. The UAVDT dataset is a dataset proposed by Dawei Du et al. [35]. at ICCV2018. Both datasets contain images taken with different models of UAV equipment in different scenarios, weather and lighting conditions, respectively, and are highly representative.
The VisDrone2019-DET dataset is a dataset mainly used for image classification and object detection experiments, consisting of 10,209 images divided into four subsets as shown in Table 2. The training subset is used to train the algorithm and contains 6471 images. The validation subset is used to verify the performance of the algorithm during the training process and contains 548 images. The test-challenge subset is used for competition and contains 1580 images. The test-dev subset is the default test set for public evaluation and contains 1610 images. The VisDrone2019-DET dataset contains 10 categories, including motor, bus, awning-tricycle, tricycle, truck, van, car, bicycle, person and pedestrian.
Dividing the dataset is one of the most important steps in the training of a network model. Firstly, dividing the dataset avoids the problem of over-fitting the model to the training data, which can lead to degradation in generalisation performance. Secondly, dividing the dataset helps us to evaluate the performance of the model more accurately. Finally, partitioning the dataset also ensures the independence of the training, validation and testing datasets, which is important for evaluating the performance of the model and avoiding data leakage problems. We will use the following three subsets in the next experiments: the training set, the validation set and the test-dev set. The train set is used to train the model, the validation set is used to evaluate the performance of the model during training and to perform hyperparameter tuning, and the test-dev set is used to finally evaluate the performance of the model.
The UAVDT dataset is specifically designed for vehicle detection tasks from an unmanned aerial vehicle (UAV) perspective. It contains images taken by UAVs at different heights and angles on urban roads, along with corresponding annotation information such as vehicle position, bounding box and category in each frame. Vehicle categories in the dataset include private cars, buses and trucks. The dataset has features such as different perspectives, rich vehicle categories, large data volume and high annotation accuracy.
The UAVDT dataset contains a total of 40,735 images, including 15 scenes and over 20,000 vehicle instances. The dataset is divided into three subsets as shown in Table 3. The training subset is used to train the algorithm and contains 31,515 images; the validation subset is used to verify the performance of the algorithm during training and contains 2396 images; and the test subset is used to evaluate the generalization ability of the overall model and contains 6824 images.
This experimental project is based on the PyTorch open source framework and uses the GPU to train and test the YOLOv5 algorithm. The data is accelerated by GPU computing through the CUDA and CUDNN environments, which speeds up the training process. The batch size of training samples is set to 16. The input image size is . The specific configuration of the training and testing environments is shown in Table 4.
5.2. Evaluation Indicators
The most commonly used metrics in object detection algorithms include Precision (P), Recall (R), F1 Score, Average Precision (AP), and mean Average Precision (mAP). Here are brief introductions to their calculation:
The Precision (P), which represents the proportion of true positive predictions among all samples predicted as positive. Its formula is shown in this equation:
where TP represents the number of true positive samples that are predicted as positive, and FP represents the number of false positive samples that are predicted as positive but are actually negative.
The Recall (R) is used to determine how many true positive samples are successfully detected among all actual positive samples. Its formula is shown in this equation:
where TP represents the number of true positive samples that are predicted as positive, and FN represents the number of false negative samples that are predicted as negative but are actually positive.
The F1 score is the weighted harmonic mean of precision and recall, and is used to balance the trade-off between precision and recall. The formula for calculating the F1 score is shown in equation:
Mean Average Precision (mAP) is an important evaluation metric for object detection that is usually involved in research that involves detecting multiple classes. For each class, the model calculates its corresponding average precision, and the mAP is obtained by summing the average precision of all classes in the dataset and dividing it by the number of classes. The formula for calculating mAP is shown in this equation:
where Average Precision(c) represents the average precision of a class c, and N(classes) represents the total number of classes in the dataset.
5.3. Experimental Results
Through experiments, we can obtain the specific performance comparison between the original YOLOv5s model and the optimized YOLOv5s-pp model on the VisDrone2019-DET dataset, as shown in Table 5. It can be seen that the overall performance of the YOLOv5s-pp model is better than that of the original YOLOv5s model.
The validation results of the YOLOv5s model on the val subset are shown in Table 6.
The validation results of the YOLOv5s-pp model on the val subset are shown in Table 7.
The overall performance of the trained YOLOv5s and YOLOv5s-pp models on the VisDrone2019-DET dataset test-dev subset is shown in Table 8.
The validation results of the YOLOv5s model on the test-dev subset are shown in Table 9.
The validation results of the YOLOv5s-pp model on the test-dev subset are shown in Table 10.
From Table 5, Table 6, Table 7, Table 8, Table 9 and Table 10, it can be observed that the performance of the YOLOv5s-pp model on the VisDrone2019-DET dataset is superior to the original YOLOv5s model for both the val and test subsets. The overall optimization and generalization ability of the YOLOv5s-pp model is better.
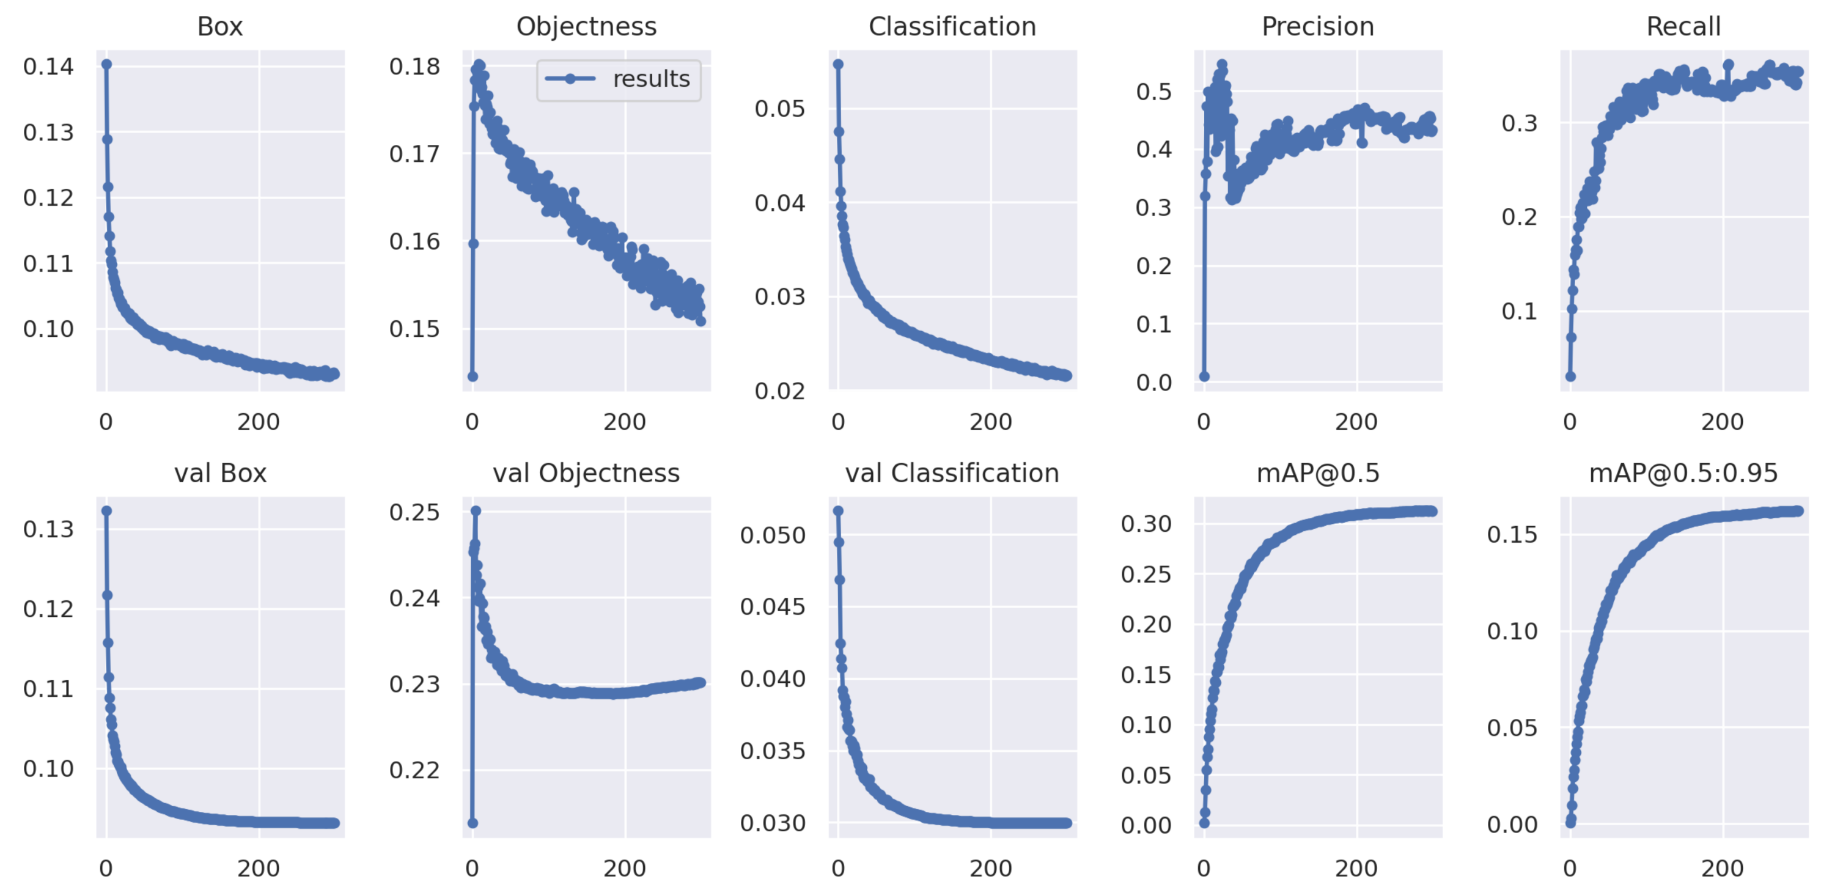
The performance parameter results of YOLOv5s trained on the VisDrone2019-DET dataset are shown in Figure 10.
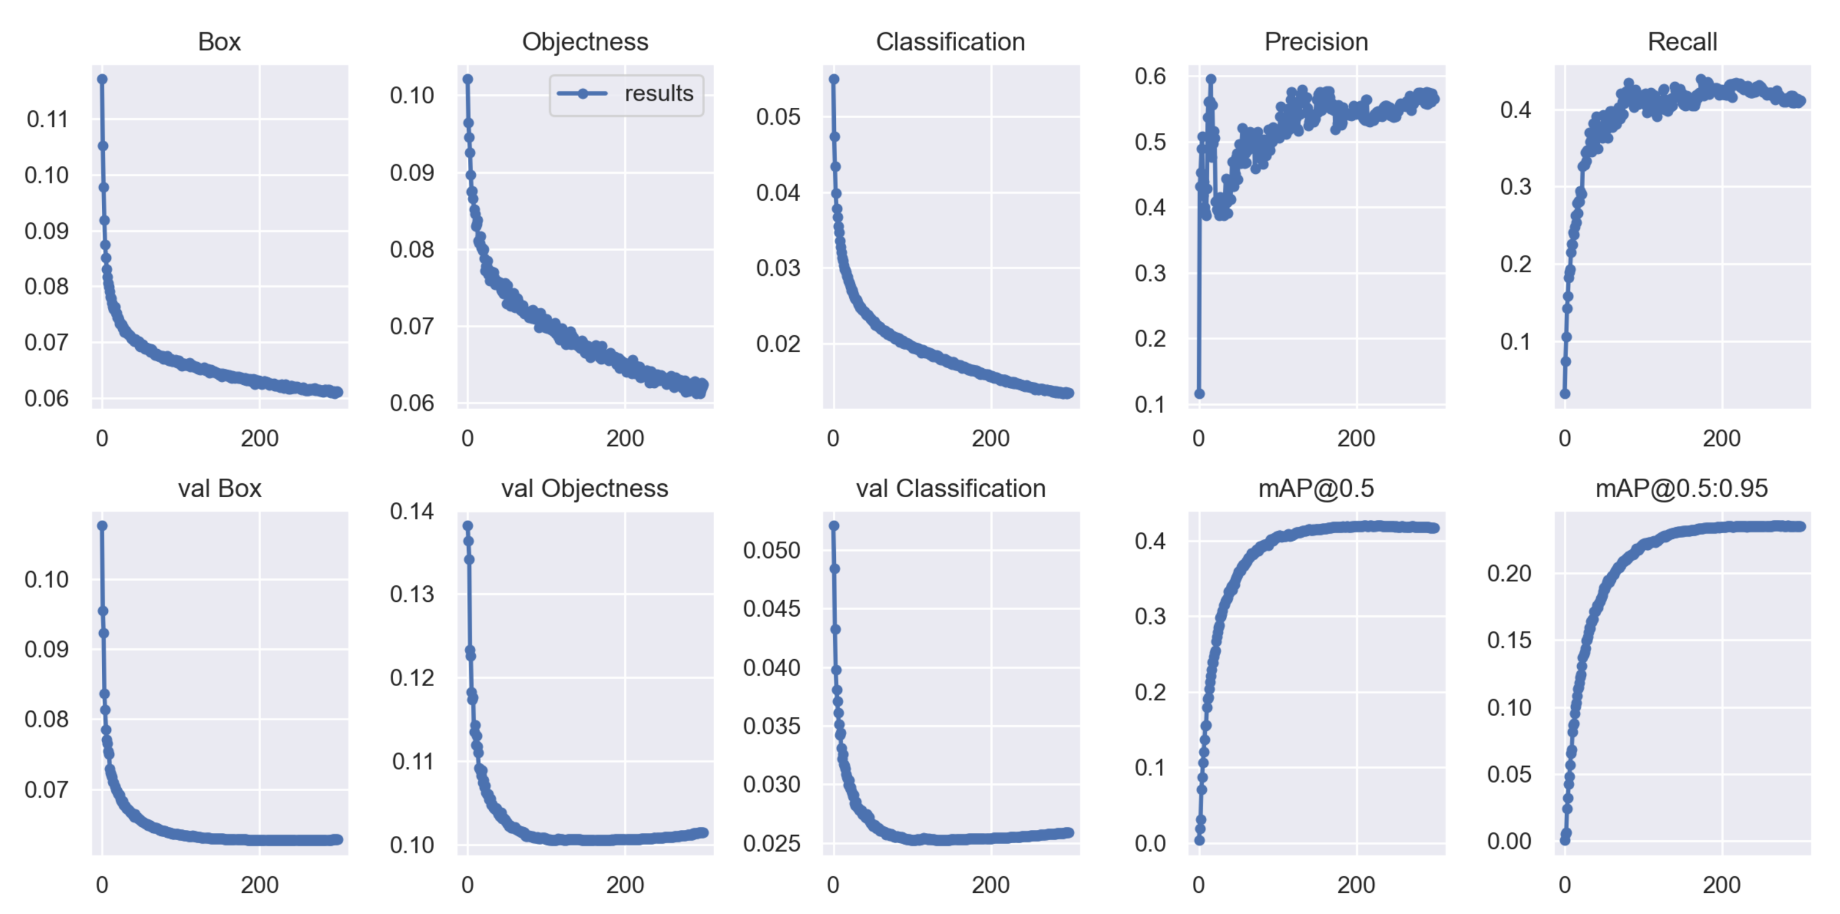
The performance parameter results of YOLOv5s-pp trained on the VisDrone2019-DET dataset are shown in Figure 11.
From the experimental results shown in Figure 10 and Figure 11, we can observe the improvement curves of the overall optimization performance of the model before and after the improvements. The figures not only display performance curves such as Precision, Recall and mAP, but also demonstrate the loss curves of model parameter optimization. Among them, the Box curve is the loss of bounding box using GIOU Loss in YOLOv5s. The smaller the value, the more accurate the selected target is. The Objectness curve is the mean loss inferred as the target, and the smaller the value, the more accurate the target detection is. The Classification curve is the mean loss inferred as classification, and the smaller the value, the more accurate the target classification is. From the before-and-after optimization result figures, it can be seen that the optimized YOLOv5s-pp model has better overall loss and detection performance.
Through experiments, we evaluated the effects of the CA attention mechanism, Meta-ACON activation function, SPD Conv module, and small object detection head on the YOLOv5s-pp network model. Specifically, we refer to the YOLOv5s-pp model with the CA attention mechanism removed as the YOLOv5s-A model; the YOLOv5s-pp model with the Meta-ACON activation function removed as the YOLOv5s-B model; the YOLOv5s-pp model with the SPD Conv module removed as the YOLOv5s-C model; and the YOLOv5s-pp model with the small object detection head modified as the YOLOv5s-D model.
We trained each of the above models on the VisDrone2019-DET dataset and tested them on the validation subset. The comparison results of the test data are shown in Table 11.
After training, each model was tested on the test-dev subset, and the comparison results of the test data are shown in Table 12.
Through Table 11 and Table 12, we can see that when any of the CA attention mechanism, Meta-ACON activation function, SPD Conv module, or any module in the small object detection head is removed from the YOLOv5s-pp model, it will have a negative impact on the overall performance of the model. It is worth noting that the change in the small object detection head has a greater impact on the recognition performance of the entire model, while the impact of the other modules on the model is relatively small. However, overall, the recognition performance of these modified models is better than that of the YOLOv5s model.
In order to further verify the advantages of the YOLOv5s-pp algorithm, we compared it with other object detection models and conducted tests on the test set and validation set of the VisDrone2019-DET dataset. The model training information is shown in Table 13, and the model performance comparison results are shown in Table 14 and Table 15.
The algorithms used for performance comparison in Table 14 and Table 15 are all based on the VisDrone2019-DET dataset, where the FocSDet, ClusDet, HRDNet, YOLOv5sm+, AF-O-YOLOv5, QueryDet, and RRNet algorithms are cited from the training results of other researchers, and since the research results are not explicitly listed in the results of some researchers’ papers, we do not fill in the corresponding F1 scores and Rs in Table 14 and Table 15.The rest of the YOLOv5 versions and the YOLOv8 versions are trained by ourselves.
From Table 13, Table 14 and Table 15, we can see that the overall performance of the YOLOv5s-pp model is superior to the four different sizes of YOLOv5 models. From Table 15, we can see that the [email protected] value of the YOLOv5s-pp algorithm on the test-dev subset is 7.4% higher than that of the YOLOv5s, 4.1% higher than that of the YOLOv5m, 2.6% higher than that of the YOLOv5l and 1.3% higher than that of the YOLOv5x. From Table 13, we can see that the YOLOv5s-pp algorithm has 10.5 M parameters, which is 3.3 M more than the YOLOv5s model, but far less than the parameters of the other three versions of YOLOv5. The main reason for the different numbers of parameters between the different versions of YOLOv5 is the difference in the depth of the network model, which to some extent reflects the width and depth of the network model. As the width and depth of the network model increases, the spatial and temporal complexity of the model also increases, which means that the GPU resources occupied during model training also increase, and the training time and forward inference time of the model will also increase to some extent. This can be reflected from the model training time and model parameters in Table 13. From Table 15, we can also see that the overall performance of the YOLOv5s-pp model is better than that of the YOLOv8s model. The [email protected] value of the YOLOv5s-pp algorithm on the test-dev subset is 0.8% higher than that of the YOLOv8s, and its overall performance is comparable to that of the YOLOv8m model, but lower than that of the YOLOv8l and YOLOv8x models. Although the [email protected] values of YOLOv8l and YOLOv8x models on the test-dev subset are 3.1% and 4.2% higher than that of the YOLOv5s-pp model, respectively, their parameter amounts are 4.1 and 6.5 times that of the YOLOv5s-pp model. Their network model depth and parameter amounts far exceed those of the YOLOv5s-pp model, which requires more GPU resources and time to train and infer the model.
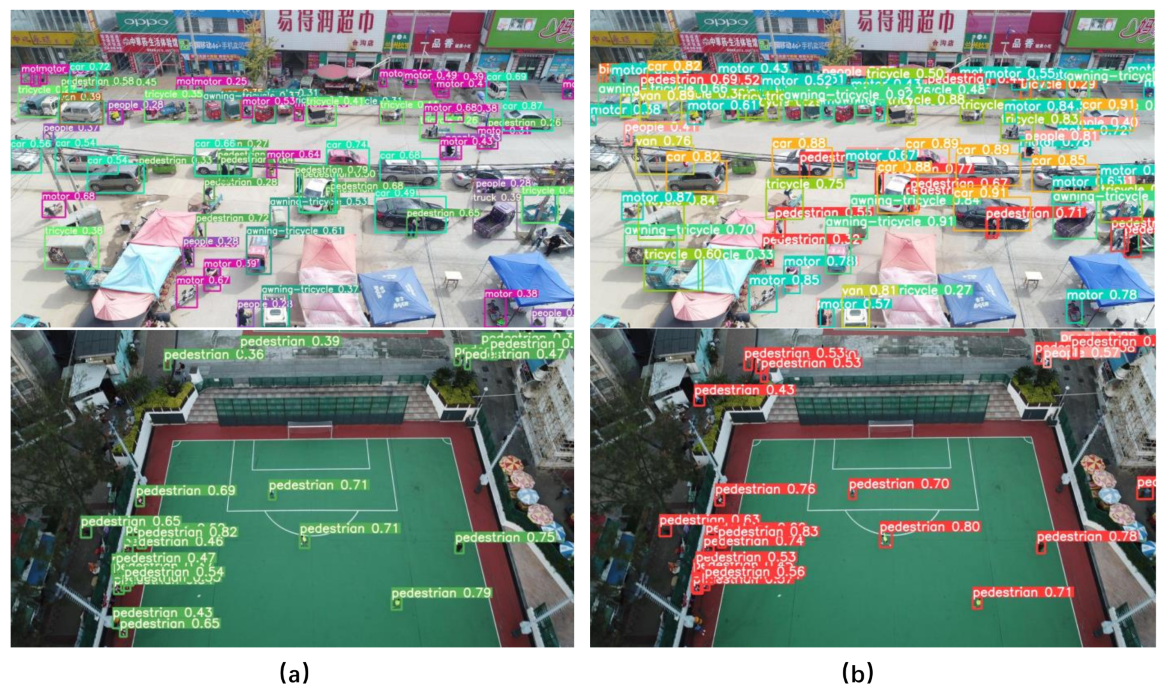
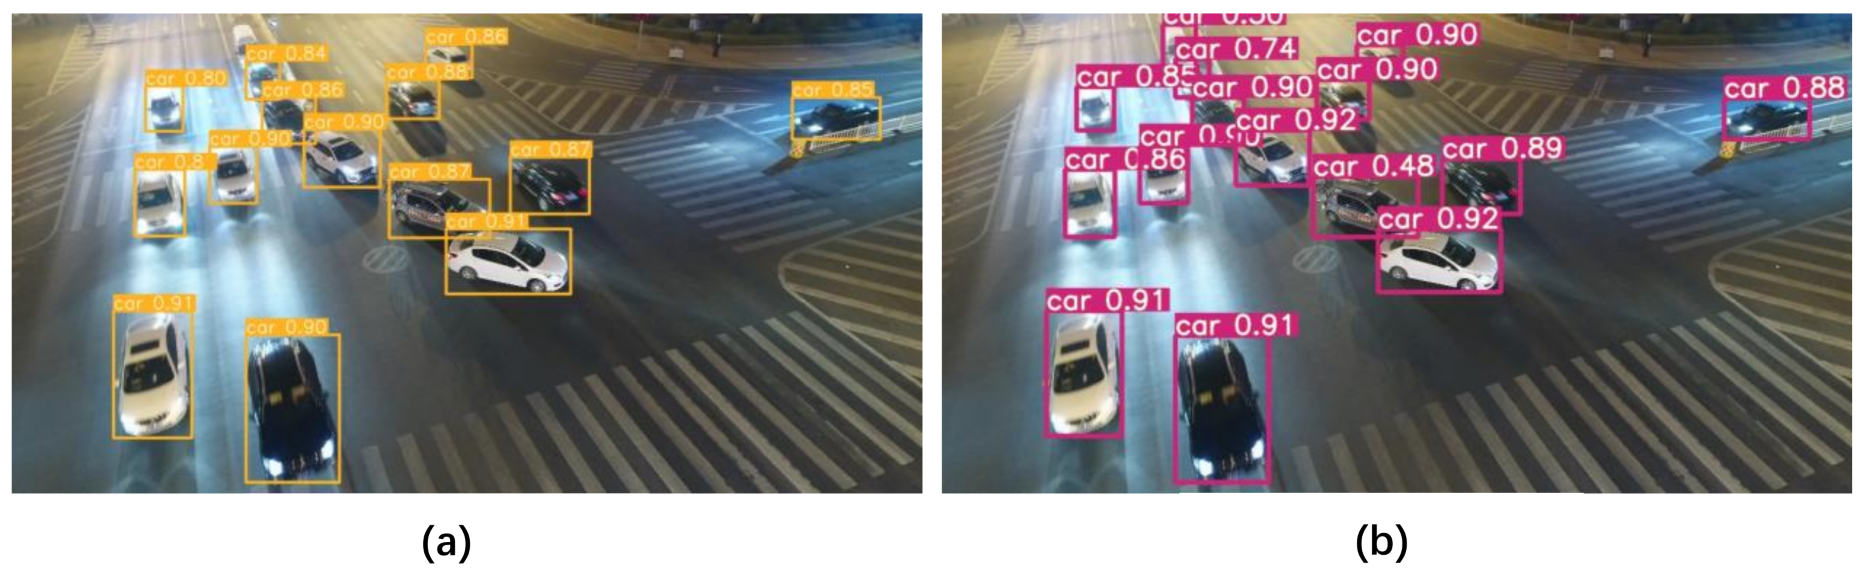
The images in Figure 12 and Figure 13 are selected from real scenes taken from the UAV’s perspective. To better test the model’s performance, we have selected images from both daytime and nighttime scenes, respectively. As we can see in Figure 12, the YOLOv5s model did not recognize the two motorbikes in the lower left corner of the image in the night environment; however, the YOLOv5s-pp model detected the motorbikes successfully. As we can see in Figure 13, in the above set of test comparisons, the YOLOv5s-pp model identified more small targets than the YOLOv5s model, and for the relatively more distant and smaller targets, the YOLOv5s model showed a large number of missed detections. Also in the upper left and right corners of the basketball court, the YOLOv5s model failed to fully detect the pedestrians in the image, while the YOLOv5s-pp model successfully detected the pedestrians in it. In contrast, the YOLOv5s-pp model is more accurate in detecting small targets in the image.
To further test the applicability of the YOLOv5s-pp model, we evaluated the model again on the UAVDT dataset. In this evaluation, we only compared the relatively lightweight YOLOv5s, YOLOv5m, YOLOv8s and YOLOv8m models, as the UAVDT dataset has a larger amount of data and does not train well on the same training environment as heavier models such as YOLOv5l, YOLOv5x, YOLOv8l and YOLOv8x. Detailed information related to the training of the models is presented in Table 16, while Table 17 and Table 18 present the final performance comparison results.
Combining Table 16, Table 17 and Table 18, we can see that the YOLOv5s-pp model has better overall performance than the three different-sized models of YOLOv5s, YOLOv5m and YOLOv8s. In Table 18, it can be observed that the YOLOv5s-pp algorithm’s [email protected] value on the test subset is 6.5% higher than that of YOLOv5s, 4.2% higher than that of YOLOv5m and 2.1% higher than that of YOLOv8m. Compared to the YOLOv8m model, the [email protected] value of the YOLOv5s-pp model on the test subset is slightly lower by 0.2%. However, it should be noted that the parameter size of the YOLOv8m model is 2.5 times that of the YOLOv5s-pp model. The overall network depth and parameter size of YOLOv8m are much larger than those of YOLOv5s-pp, which will have a negative impact on the training and inference speed of the model.
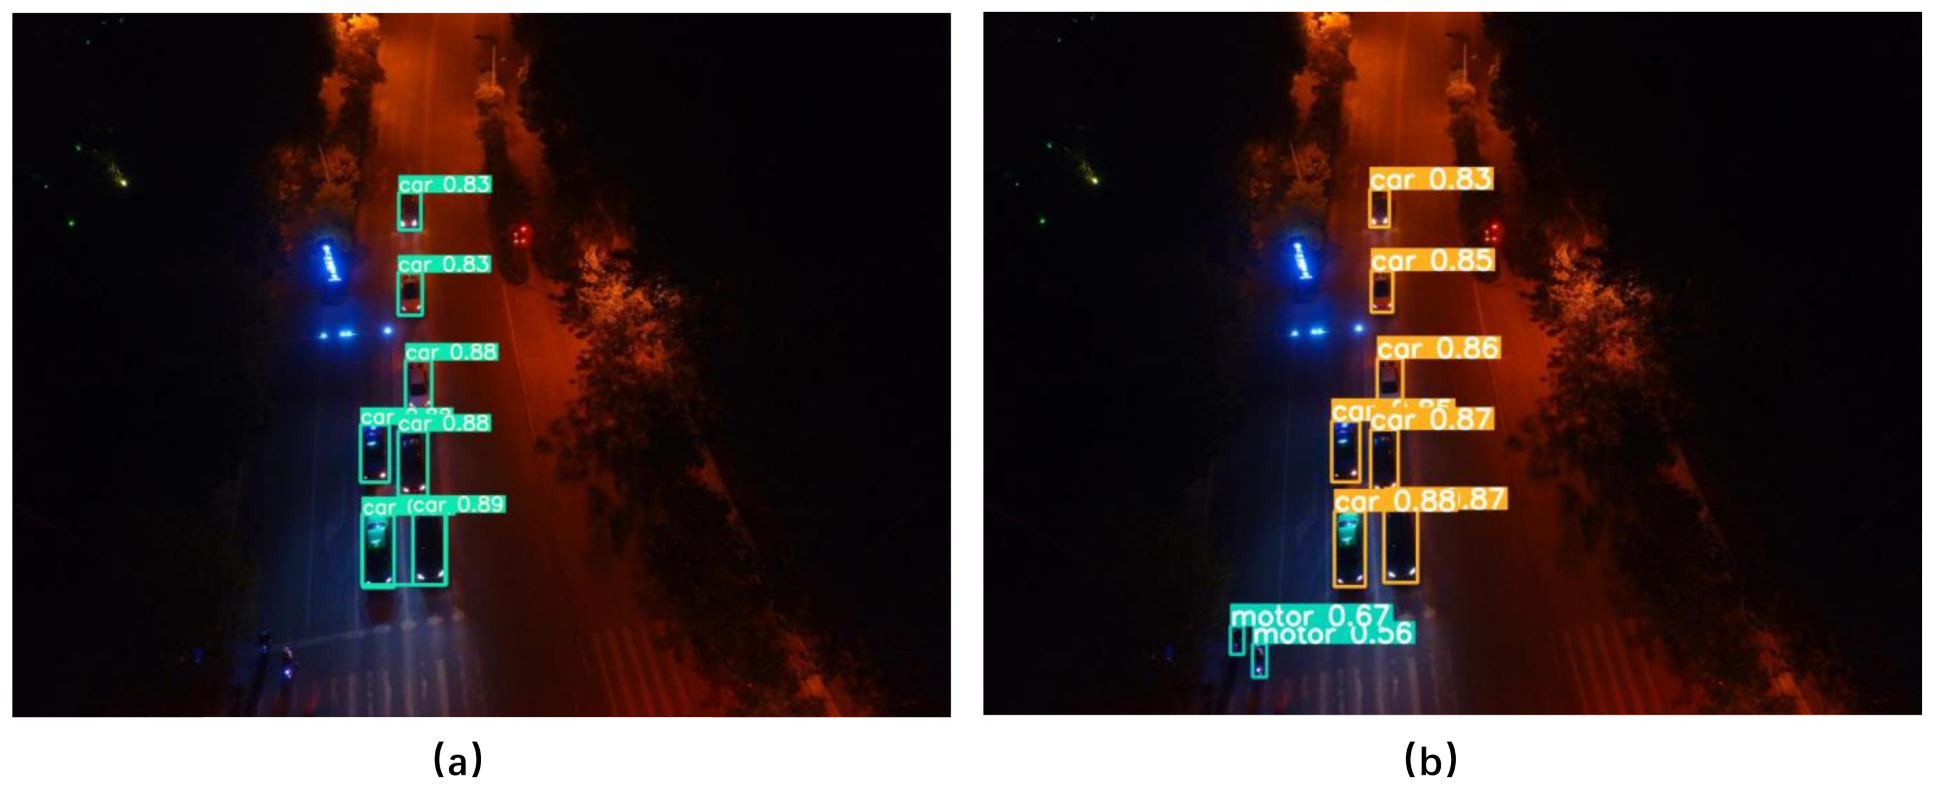
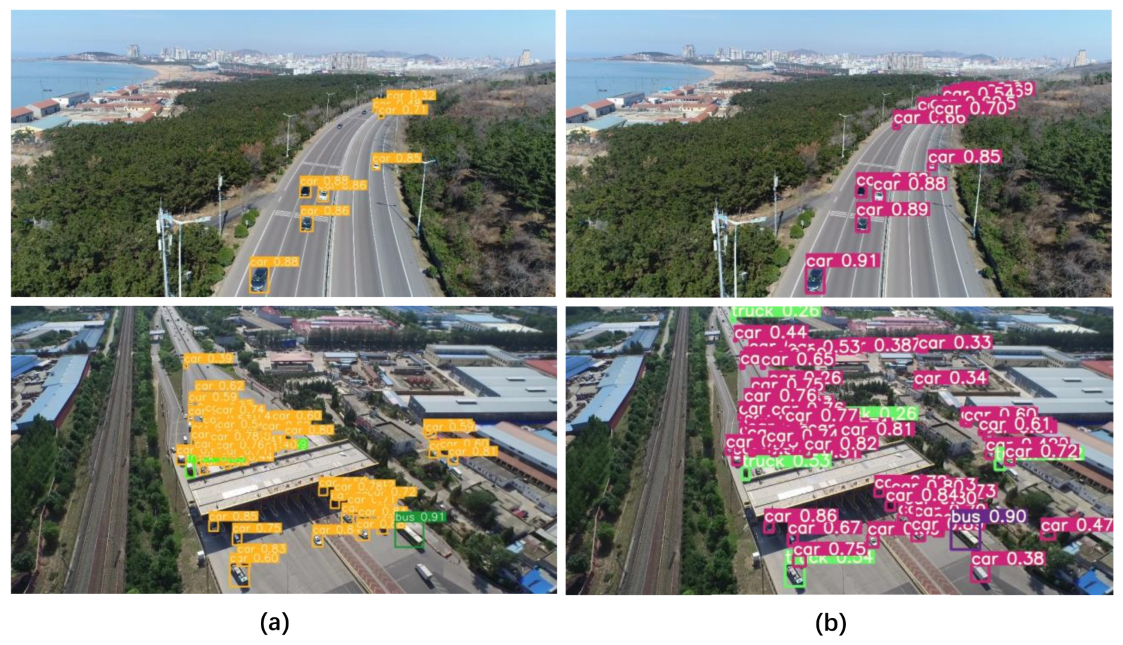
The images in Figure 14 and Figure 15 are also selected from real scene images taken from the UAV viewpoint, and again we selected images from both daytime and nighttime scenes. From Figure 14, we can see that in the night environment, the YOLOv5s model does not recognise the vehicle further away in the upper left corner of the picture; however, the YOLOv5s-pp model detects all the vehicles in the picture smoothly. As we can see from Figure 15, in the above set of test comparisons, the YOLOv5s-pp model identifies more small targets on the motorway than the YOLOv5s model, and there is a significant amount of under-detection by the YOLOv5s model of vehicles that are relatively farther away and smaller in the picture. In addition, near the toll booths in the following set of images, the YOLOv5s model fails to fully detect vehicles further away in the images, while the YOLOv5s-pp model detects more targets. In contrast, the YOLOv5s-pp model has better detection performance for small targets in the pictures.
6. Conclusions
In order to improve the performance of small target recognition algorithms for drone’s perspective images, this paper selected YOLOv5s model as the basic model and made improvements on it. Firstly, we replaced the original SiLU activation function with the Meta-ACON activation function, so that the activation function of the entire model can adaptively select the degree of activation between linear and nonlinear. Secondly, we used the SPD Conv module to enhance the feature extraction capability of small targets and optimized the fine-grained information loss and learning rate decrease caused by cross-layer convolution. In addition, we incorporated the CA attention mechanism into the network model, considering both channel dimensions and spatial dimensions, to solve problems such as long-range dependencies. Finally, we improved the size of the detection head, which not only reduced the overall loss but also improved the accuracy of target detection. The experimental results show that compared with the benchmark model YOLOv5s, the improved YOLOv5s-pp model improves the performance by 7.4% on the test-dev subset of the VisDrone2019-DET dataset and by 6.5% on the test subset of the UAVDT dataset. Compared with the YOLOv8s model, the improved YOLOv5s-pp model improves the performance by 0.8% on the test-dev subset of the VisDrone2019-DET dataset and 2.1% on the test subset of the UAVDT dataset, and the overall performance of the small-target recognition outperforms that of the original YOLOv5s and YOLOv8s models. In further research, we will continue to study the situation where the target cannot be accurately recognised due to occlusion or overlap in the UAV view, and we will also incorporate deep learning-based super-resolution techniques into our research, hoping to further improve the performance of the small target recognition algorithms through this work, and hopefully make some contribution to this field.
Author Contributions
Conceptualization, H.X., W.Z., P.L. and R.W.; methodology, H.X. and W.Z.; software, P.L., F.L. and R.W.; validation, H.X., W.Z. and P.L.; formal analysis, R.W.; investigation, H.X., W.Z., F.L., P.L. and R.W.; resources, H.X. and P.L.; data curation, W.Z. and F.L.; writing—original draft preparation, H.X. and W.Z.; writing—review and editing, H.X., W.Z. and F.L.; visualization, P.L. and R.W.; supervision, P.L. and R.W.; project administration, H.X. and P.L.; funding acquisition, H.X. and P.L. All authors have read and agreed to the published version of the manuscript.
Funding
This work was supported in part by the National Key R&D Program of China under Grant 2019YFB2103003, in part by the Scientific and Technological Support Project of Jiangsu Province under Grant BE2019740, Six Talent Peaks Project of Jiangsu Province (RJFW-111), and in part by the Postgraduate Research and Practice Innovation Program of Jiangsu Province under Grant SJCX22_0267, SJCX22_0275 and SJCX23_0274.
Data Availability Statement
Not applicable.
Conflicts of Interest
The authors declare no conflict of interest.
References
- Redmon, J.; Divvala, S.; Girshick, R.; Farhadi, A. You Only Look Once: Unified, Real-Time Object Detection. In Proceedings of the 2016 IEEE Conference on Computer Vision and Pattern Recognition (CVPR), Las Vegas, NV, USA, 27–30 June 2016; pp. 779–788. [Google Scholar]
- Redmon, J.; Farhadi, A. YOLO9000: Better, Faster, Stronger. In Proceedings of the 2017 IEEE Conference on Computer Vision and Pattern Recognition (CVPR), Honolulu, HI, USA, 21–26 July 2017; pp. 6517–6525. [Google Scholar]
- Redmon, J.; Farhadi, A. YOLOv3: An Incremental Improvement. arXiv 2018, arXiv:1804.02767. [Google Scholar] [CrossRef]
- Bochkovskiy, A.; Wang, C.; Liao, H.M. YOLOv4: Optimal Speed and Accuracy of Object Detection. arXiv 2020, arXiv:2004.10934. [Google Scholar] [CrossRef]
- Benjumea, A.; Teeti, I.; Cuzzolin, F. YOLO-Z: Improving small object detection in YOLOv5 for autonomous vehicles. arXiv 2023, arXiv:2112.11798. [Google Scholar] [CrossRef]
- Zhu, X.K.; Lyu, S.C.; Wang, X. TPH-YOLOv5: Improved YOLOv5 Based on Transformer Prediction Head for Object Detection on Drone-captured Scenarios. In Proceedings of the 2021 IEEE/CVF International Conference on Computer Vision Workshops (ICCVW), Montreal, BC, Canada, 11–17 October 2021; pp. 2778–2788. [Google Scholar]
- Huang, Y.; Cui, H.; Ma, J.; Hao, Y. Research on an aerial object detection algorithm based on improved YOLOv5. In Proceedings of the 2022 International Conference on Computer Engineering and Applications (ICCEA), Changchun, China, 20–22 May 2022; pp. 396–400. [Google Scholar]
- Shao, L.; Wu, H.; Li, C.; Li, J. A Vehicle Recognition Model Based on Improved YOLOv5. Electronics 2023, 12, 1323. [Google Scholar] [CrossRef]
- Ren, S.Q.; He, K.; Sun, J.; Girshick, R. Faster R-CNN: Towards Real-Time Object Detection with Region Proposal Networks. IEEE Trans. Pattern Anal. Mach. Intell. 2017, 39, 1137–1149. [Google Scholar] [CrossRef] [PubMed] [Green Version]
- Li, W.; Li, Y.; Gong, J.; Feng, Q.; Zhou, J.; Sun, J.; Shi, C.; Hu, W. Urban Water Extraction with UAV High-Resolution Remote Sensing Data Based on an Improved U-Net Model. Remote Sens. 2021, 13, 3165. [Google Scholar] [CrossRef]
- Teng, Z.; Li, C.T.; Zhao, W.J.; Wang, Z.X.; Li, R.; Zhang, X.; Song, Y. Extraction and Analysis of Spatial Feature Data of Traditional Villages Based on the Unmanned Aerial Vehicle (UAV) Image. Mob. Inf. Syst. 2022, 2022, 4663740. [Google Scholar] [CrossRef]
- Sharma, S.K.; Kumar, M.; Maithani, S.; Kumar, P. Feature Extraction in Urban Areas Using UAV Data. In Proceedings of the UASG 2021: Wings 4 Sustainability, Roorkee, India, 2–4 April 2021; Springer: Cham, Switzerland, 2023; pp. 87–98. [Google Scholar] [CrossRef]
- Li, Y.; Li, M.; Li, S.; Li, Y. Improved YOLOv5 for Remote Sensing Rotating Object Detection. In Proceedings of the 2021 6th International Conference on Communication, Image and Signal Processing (CCISP), Chengdu, China, 19–21 November 2021; pp. 64–68. [Google Scholar]
- Hou, Q.B.; Zhou, D.Q.; Feng, J.S. Coordinate Attention for Efficient Mobile Network Design. In Proceedings of the 2021 IEEE/CVF Conference on Computer Vision and Pattern Recognition (CVPR), Nashville, TN, USA, 20–25 June 2021; pp. 13708–13717. [Google Scholar]
- Ma, N.; Zhang, X.; Sun, J.; Liu, M. Activate or Not: Learning Customized Activation. In Proceedings of the 2021 IEEE/CVF Conference on Computer Vision and Pattern Recognition (CVPR), Nashville, TN, USA, 20–25 June 2021; pp. 8028–8038. [Google Scholar]
- Sunkara, R.; Luo, T. No More Strided Convolutions or Pooling: A New CNN Building Block for Low-Resolution Images and Small Objects. arXiv 2022, arXiv:2208.03641. [Google Scholar] [CrossRef]
- Liu, W.; Anguelov, D.; Erhan, D.; Szegedy, C.; Reed, S.; Fu, C.-. Y; Berg, A.C. SSD: Single Shot MultiBox Detector. arXiv 2015, arXiv:1512.02325. [Google Scholar] [CrossRef]
- Lin, T.Y.; Goyal, P.; Girshick, R.B.; He, K.; Dollár, P. Focal Loss for Dense Object Detection. In Proceedings of the 2017 IEEE International Conference on Computer Vision (ICCV), Venice, Italy, 22–29 October 2017; pp. 2999–3007. [Google Scholar] [CrossRef]
- Girshick, R.B. Fast R-CNN. In Proceedings of the 2015 IEEE International Conference on Computer Vision (ICCV), Washington, DC, USA, 7–13 December 2015; pp. 1440–1448. [Google Scholar]
- Cai, Z.W.; Vasconcelos, N. Cascade R-CNN: Delving Into High Quality Object Detection. In Proceedings of the 2018 IEEE/CVF Conference on Computer Vision and Pattern Recognition, Salt Lake City, UT, USA, 18–23 June 2018; pp. 6154–6162. [Google Scholar] [CrossRef]
- Hou, H.; Chen, M.; Tie, Y.; Li, W. A Universal Landslide Detection Method in Optical Remote Sensing Images Based on Improved YOLOX. Remote Sens. 2022, 14, 4939. [Google Scholar] [CrossRef]
- Yuan, Y.; Bai, H.; Wu, P.; Guo, H.; Deng, T.; Qin, W. An Intelligent Detection Method for Small and Weak Objects in Space. Remote Sens. 2023, 15, 3169. [Google Scholar] [CrossRef]
- Hu, S.; Zhao, F.; Lu, H.; Deng, Y.; Du, J.; Shen, X. Improving YOLOv7-Tiny for Infrared and Visible Light Image Object Detection on Drones. Remote Sens. 2023, 15, 3214. [Google Scholar] [CrossRef]
- Qi, G.; Zhang, Y.; Wang, K.; Mazur, N.; Liu, Y.; Malaviya, D. Small Object Detection Method Based on Adaptive Spatial Parallel Convolution and Fast Multi-Scale Fusion. Remote Sens. 2022, 14, 420. [Google Scholar] [CrossRef]
- Elfwing, S.; Uchibe, E.; Doya, K. Sigmoid-Weighted Linear Units for Neural Network Function Approximation in Reinforcement Learning. Neural Netw. Off. J. Int. Neural Netw. Soc. 2017, 107, 3–11. [Google Scholar] [CrossRef] [PubMed]
- Glorot, X.; Bordes, A.; Bengio, Y. Deep Sparse Rectifier Neural Networks. J. Mach. Learn. Res. 2011, 15, 315–323. [Google Scholar]
- Ramachandran, P.; Zoph, B.; Le, Q.V. Swish: A Self-Gated Activation Function. arXiv 2017, arXiv:1710.05941. [Google Scholar] [CrossRef]
- Lange, M.; Holz, O.; Villmann, T. Applications of lp-Norms and their Smooth Approximations for Gradient Based Learning Vector Quantization. In Proceedings of the European Symposium on Artificial Neural Networks, Bruges, Belgium, 23–25 April 2014. [Google Scholar]
- Hu, J.; Shen, L.; Sun, G. Squeeze-and-Excitation Networks. In Proceedings of the 2018 IEEE/CVF Conference on Computer Vision and Pattern Recognition, Salt Lake City, UT, USA, 18–23 June 2018; pp. 7132–7141. [Google Scholar]
- Tian, T.; Li, L.L.; Chen, W.T.; Zhou, H. SEMSDNet: A Multiscale Dense Network With Attention for Remote Sensing Scene Classification. IEEE J. Sel. Top. Appl. Earth Obs. Remote. Sens. 2021, 14, 5501–5514. [Google Scholar] [CrossRef]
- Guo, P.Y.; Song, C. Facial Expression Recognition with Squeeze-and-Excitation Network. In Proceedings of the 2022 7th International Conference on Intelligent Computing and Signal Processing (ICSP), Xi’an, China, 15–17 April 2022; pp. 962–967. [Google Scholar]
- Woo, S.; Park, J.; Lee, J.; Kweon, I. CBAM: Convolutional Block Attention Module. In Proceedings of the European Conference on Computer Vision, Munich, Germany, 8–14 September 2018; Springer International Publishing: Cham, Switzerland, 2018; pp. 3–19. [Google Scholar] [CrossRef]
- Zhu, Y.H.; Liu, C.L.; Jiang, S.Q. Multi-Attention Meta Learning for Few-Shot Fine-Grained Image Recognition. In Proceedings of the Twenty-Ninth International Joint Conference on Artificial Intelligence, Yokohama, Japan, 7–15 January 2021; Volume 152, pp. 1090–1096. [Google Scholar]
- Zhu, P.; Du, D.; Wen, L.; Bian, X.; Ling, H.; Hu, Q.; Peng, T.; Zheng, J.; Wang, X.; Zhang, Y.; et al. VisDrone-VID2019: The Vision Meets Drone Object Detection in Video Challenge Results. In Proceedings of the 2019 IEEE/CVF International Conference on Computer Vision Workshop (ICCVW), Seoul, Republic of Korea, 27–28 October 2019; pp. 227–235. [Google Scholar]
- Du, D.; Qi, Y.; Yu, H.; Yang, Y.F.; Duan, K.; Li, G.; Zhang, W.; Huang, Q.; Tian, Q. The Unmanned Aerial Vehicle Benchmark: Object Detection and Tracking. In Proceedings of the European Conference on Computer Vision, Munich, Germany, 8–14 September 2018. [Google Scholar] [CrossRef]
- Zhang, Z.; Yi, H.H.; Zheng, J. Focusing on Small Objects Detector in Aerial Images. Acta Electronica Sinica 2023, 51, 944. [Google Scholar]
- Yang, F.; Fan, H.; Chu, P.; Blasch, E.; Ling, H. Clustered Object Detection in Aerial Images. In Proceedings of the 2019 IEEE/CVF International Conference on Computer Vision (ICCV), Seoul, Republic of Korea, 27 October–2 November 2019; pp. 8310–8319. [Google Scholar]
- Liu, Z.L.; Gao, G.Y.; Sun, L. HRDNet: High-Resolution Detection Network for Small Objects. In Proceedings of the 2021 IEEE International Conference on Multimedia and Expo (ICME), Shenzhen, China, 5–9 July 2021; pp. 1–6. [Google Scholar]
- Ren, S.Q.; He, K.; Sun, J.; Girshick, R. Real-time Object Detection in UAV Images Based on Improved YOLOv5s. Opto-Electron. Eng. 2022, 49, 69–81. [Google Scholar]
- Li, D.N. Research on Small Object Detection Model Based on Optimized YOLOv5. Master’s Thesis, Xinjiang Normal University, Xinjiang, China, 2022. [Google Scholar]
- Yang, C.H.; Huang, Z.H.; Wang, N.Y. QueryDet: Cascaded Sparse Query for Accelerating High-Resolution Small Object Detection. In Proceedings of the 2022 IEEE/CVF Conference on Computer Vision and Pattern Recognition (CVPR), New Orleans, LA, USA, 18–24 June 2022; pp. 13658–13667. [Google Scholar]
- Chen, C.R.; Zhang, Y.; Lv, Q.; Wei, S.; Wang, X. RRNet: A Hybrid Detector for Object Detection in Drone-Captured Images. In Proceedings of the 2019 IEEE/CVF International Conference on Computer Vision Workshop (ICCVW), Seoul, Republic of Korea, 27–28 October 2019; 2019; pp. 100–108. [Google Scholar]
Figure 1.
Overall structure diagram of YOLOv5s.

Figure 2.
Structure diagram of the Focus module.

Figure 3.
Structure diagram of the CBL and Res-unit module.

Figure 4.
Structure diagram of the C3 module.

Figure 5.
Structure diagram of the SPP module.

Figure 6.
Overall structure diagram of YOLOv5s-pp.

Figure 7.
Structure diagram of the SPD Conv module.

Figure 8.
Structure diagram of the small target detection head module.

Figure 9.
Structure diagram of the CA module.

Figure 10.
YOLOv5s performance parameter results diagram.

Figure 11.
YOLOv5s-pp performance parameter results diagram.

Figure 12.
Plot of test results for the example in a daytime environment (Based on VisDrone2019-DET dataset). (a) shows the test results for the yolov5s model and (b) shows the test results for the yolov5s-pp model.
Figure 12.
Plot of test results for the example in a daytime environment (Based on VisDrone2019-DET dataset). (a) shows the test results for the yolov5s model and (b) shows the test results for the yolov5s-pp model.

Figure 13.
Plot of test results for the example in the nighttime environment (Based on VisDrone2019-DET dataset). (a) shows the test results for the yolov5s model and (b) shows the test results for the yolov5s-pp model.
Figure 13.
Plot of test results for the example in the nighttime environment (Based on VisDrone2019-DET dataset). (a) shows the test results for the yolov5s model and (b) shows the test results for the yolov5s-pp model.

Figure 14.
Plot of test results for the example in a daytime environment (Based on UAVDT dataset). (a) shows the test results for the yolov5s model and (b) shows the test results for the yolov5s-pp model.
Figure 14.
Plot of test results for the example in a daytime environment (Based on UAVDT dataset). (a) shows the test results for the yolov5s model and (b) shows the test results for the yolov5s-pp model.

Figure 15.
Plot of test results for the example in the nighttime environment (Based on UAVDT dataset). (a) shows the test results for the yolov5s model and (b) shows the test results for the yolov5s-pp model.
Figure 15.
Plot of test results for the example in the nighttime environment (Based on UAVDT dataset). (a) shows the test results for the yolov5s model and (b) shows the test results for the yolov5s-pp model.


Table 1.
Improved anchors parameters.
| Anchors | Anchor Size |
|---|---|
| Anchor-1 | [ 4, 5 5, 9 9, 7 ] |
| Anchor-2 | [ 8, 14 15, 12 10, 23 ] |
| Anchor-3 | [ 30, 18 24, 28 58, 46 ] |
Table 2.
Number of VisDrone2019-DET dataset images.
| Train | Val | Test-Challenge | Test-Dev |
|---|---|---|---|
| 6471 images | 584 images | 1580 images | 1610 images |
Table 3.
Number of UAVDT dataset images.
| Train | Val | Test |
|---|---|---|
| 31,515 images | 2396 images | 6824 images |
Table 4.
Experimental environment configuration.
| Projects | Environment |
|---|---|
| Operating System | Windows 10(x64) |
| CPU | i5-9300HF [email protected] |
| Memory size | 32GB |
| GPU | NVIDIA GeForce GTX 2080 Ti |
| CUDA Version | 10.2 |
| Python Version | 3.8 |
Table 5.
Improved before and after model in VisDrone2019-DET dataset val subset of experimental data.
Table 5.
Improved before and after model in VisDrone2019-DET dataset val subset of experimental data.
| Models | F1 (%) | R (%) | [email protected] (%) |
|---|---|---|---|
| YOLOv5s | 38.0 | 52.0 | 31.2 |
| YOLOv5s-pp | 47.0 (+9.0) | 63.0 (+11.0) | 41.7 (+10.5) |
Table 6.
Experimental data of YOLOv5s on the val subset.
| Category | P (%) | R (%) | [email protected] (%) |
|---|---|---|---|
| pedestrian | 43.8 | 41.6 | 37.4 |
| people | 44.1 | 36.1 | 29.5 |
| bicycle | 27.2 | 14.0 | 9.8 |
| car | 57.7 | 75.1 | 71.5 |
| van | 44.5 | 35.5 | 33.4 |
| truck | 40.7 | 30.7 | 25.4 |
| tricycle | 38.3 | 24.1 | 17.8 |
| awning-tricycle | 24.1 | 14.2 | 9.2 |
| bus | 64.6 | 38.2 | 41.8 |
| motor | 47.2 | 44.7 | 36.4 |
Table 7.
Experimental data of YOLOv5s-pp on the val subset.
| Category | P (%) | R (%) | [email protected] (%) |
|---|---|---|---|
| pedestrain | 61.9 (+18.1) | 49.9 (+8.3) | 51.7 (+14.3) |
| people | 56.4 (+12.3) | 38.2 (+2.1) | 39.6 (+10.1) |
| bicycle | 40.4 (+13.2) | 19.3 (+5.3) | 19.0 (+9.2) |
| car | 72.5 (+14.8) | 81.8 (+6.7) | 82.1 (+10.6) |
| van | 57.0 (+12.5) | 42.4 (+6.9) | 44.1 (+10.7) |
| truck | 58.7 (+18.0) | 33.6 (+2.9) | 36.0 (+10.6) |
| tricycle | 48.6 (+10.3) | 29.6 (+5.5) | 26.3 (+8.5) |
| awning-tricycle | 38.3 (+14.2) | 17.9 (+3.7) | 14.7 (+5.5) |
| bus | 68.3 (+3.7) | 51.4 (+13.2) | 55.3 (+13.5) |
| motor | 63.0 (+15.8) | 47.2 (+2.5) | 48.2 (+11.8) |
Table 8.
Improved before and after model in VisDrone2019-DET dataset test-dev subset of experimental data.
Table 8.
Improved before and after model in VisDrone2019-DET dataset test-dev subset of experimental data.
| Models | F1 (%) | R (%) | [email protected] (%) |
|---|---|---|---|
| YOLOv5s | 33.0 | 52.0 | 26.4 |
| YOLOv5s-pp | 40.0 (+7.0) | 60.0 (+8.0) | 33.8 (+7.4) |
Table 9.
Experimental data of YOLOv5s on the test-dev subset.
| Category | P (%) | R (%) | [email protected] (%) |
|---|---|---|---|
| pedestrain | 39.9 | 27.1 | 23.6 |
| people | 40.6 | 16.5 | 13.3 |
| bicycle | 26.8 | 7.2 | 6.4 |
| car | 56.7 | 72.5 | 67.3 |
| van | 31.0 | 37.9 | 29.5 |
| truck | 32.4 | 36.1 | 26.1 |
| tricycle | 23.4 | 20.6 | 12.8 |
| awning-tricycle | 34.8 | 16.7 | 13.1 |
| bus | 62.9 | 49.1 | 50.2 |
| motor | 38.8 | 30.0 | 22.0 |
Table 10.
Experimental data of YOLOv5s-pp on the test-dev subset.
| Category | P (%) | R (%) | [email protected] (%) |
|---|---|---|---|
| pedestrain | 49.9 (+10.0) | 35.5 (+8.4) | 33.9 (+10.3) |
| people | 46.4 (+5.8) | 21.0 (+4.5) | 19.5 (+6.2) |
| bicycle | 31.4 (+4.6) | 12.7 (+5.5) | 10.7 (+4.3) |
| car | 65.8 (+9.1) | 77.5 (+5.0) | 75.0 (+7.7) |
| van | 44.9 (+13.9) | 39.6 (+1.7) | 37.8 (+8.3) |
| truck | 44.5 (+12.1) | 40.0 (+3.9) | 34.9 (+8.8) |
| tricycle | 29.3 (+5.9) | 31.1 (+10.5) | 20.2 (+7.4) |
| awning-tricycle | 40.1 (+5.3) | 22.5 (+5.8) | 18.6 (+5.5) |
| bus | 67.1 (+4.2) | 52.6 (+3.5) | 56.1 (+5.9) |
| motor | 47.4 (+8.6) | 36.5 (+6.5) | 31.1 (+9.1) |
Table 11.
Validating the performance impact of each module on a val subset of the VisDrone2019-DET dataset.
Table 11.
Validating the performance impact of each module on a val subset of the VisDrone2019-DET dataset.
| Models | F1 (%) | R (%) | [email protected] (%) |
|---|---|---|---|
| YOLOv5s | 38.0 | 52.0 | 31.2 |
| YOLOv5s-A | 45.0 | 60.0 | 38.5 |
| YOLOv5s-B | 46.0 | 61.0 | 40.6 |
| YOLOv5s-C | 45.0 | 62.0 | 39.3 |
| YOLOv5s-D | 40.0 | 55.0 | 33.2 |
| YOLOv5s-pp | 47.0 | 63.0 | 41.7 |
Table 12.
Validating the performance impact of each module on a test-dev subset of the VisDrone2019-DET dataset.
Table 12.
Validating the performance impact of each module on a test-dev subset of the VisDrone2019-DET dataset.
| Models | F1 (%) | R (%) | [email protected] (%) |
|---|---|---|---|
| YOLOv5s | 33.0 | 52.0 | 26.4 |
| YOLOv5s-A | 38.0 | 57.0 | 31.3 |
| YOLOv5s-B | 39.0 | 56.0 | 31.6 |
| YOLOv5s-C | 37.0 | 58.0 | 32.5 |
| YOLOv5s-D | 36.0 | 54.0 | 28.8 |
| YOLOv5s-pp | 40.0 | 60.0 | 33.8 |
Table 13.
Details of each model trained on the VisDrone2019-DET dataset.
| Models | Size (Pixels) | Batch-Size | Epoch | Training Hours | Params (M) |
|---|---|---|---|---|---|
| YOLOv8s | 640 | 16 | 300 | 8.8 | 11.2 |
| YOLOv8m | 640 | 16 | 300 | 11.1 | 25.9 |
| YOLOv8l | 640 | 16 | 300 | 13.3 | 43.7 |
| YOLOv8x | 640 | 16 | 300 | 16.9 | 68.2 |
| YOLOv5s | 640 | 16 | 300 | 9.4 | 7.2 |
| YOLOv5m | 640 | 16 | 300 | 12.2 | 21.2 |
| YOLOv5l | 640 | 16 | 300 | 13.7 | 46.5 |
| YOLOv5x | 640 | 16 | 300 | 20.5 | 86.7 |
| YOLOv5s-pp | 640 | 16 | 300 | 11.2 | 10.5 |
Table 14.
Experimental results of various models on the val subset of the VisDrone2019-DET dataset.
| Models | F1 (%) | R (%) | [email protected] (%) |
|---|---|---|---|
| FocSDet [36] | - | 41.1 | 30.8 |
| ClusDet [37] | - | - | 32.4 |
| HRDNet [38] | - | 46.6 | 35.5 |
| YOLOv5sm+ [39] | - | - | 36.7 |
| AF-O-YOLOv5 [40] | 45.0 | 61.0 | 41.5 |
| YOLOv8s | 44.0 | 61.0 | 40.9 |
| YOLOv8m | 46.0 | 62.0 | 43.3 |
| YOLOv8l | 49.0 | 62.0 | 45.6 |
| YOLOv8x | 50.0 | 63.0 | 46.9 |
| YOLOv5s | 38.0 | 52.0 | 31.2 |
| YOLOv5m | 42.0 | 57.0 | 35.1 |
| YOLOv5l | 44.0 | 59.0 | 36.9 |
| YOLOv5x | 45.0 | 60.0 | 38.8 |
| YOLOv5s-pp | 47.0 | 63.0 | 41.7 |
Table 15.
Experimental results of various models on the test-dev subset of the VisDrone2019-DET dataset.
Table 15.
Experimental results of various models on the test-dev subset of the VisDrone2019-DET dataset.
| Models | F1 (%) | R (%) | [email protected] (%) |
|---|---|---|---|
| QueryDet [41] | - | - | 28.4 |
| RRNet [42] | - | - | 29.1 |
| AF-O-YOLOv5 [40] | 39.0 | 58.0 | 32.6 |
| YOLOv8s | 38.0 | 56.0 | 33.0 |
| YOLOv8m | 40.0 | 58.0 | 34.4 |
| YOLOv8l | 43.0 | 58.0 | 36.9 |
| YOLOv8x | 43.0 | 59.0 | 38.0 |
| YOLOv5s | 33.0 | 52.0 | 26.4 |
| YOLOv5m | 37.0 | 55.0 | 29.7 |
| YOLOv5l | 38.0 | 56.0 | 31.2 |
| YOLOv5x | 40.0 | 57.0 | 32.5 |
| YOLOv5s-pp | 40.0 | 60.0 | 33.8 |
Table 16.
Details of each model trained on the UAVDT dataset.
| Models | Size (Pixels) | Batch-Size | Epoch | Training Hours | Params (M) |
|---|---|---|---|---|---|
| YOLOv8s | 640 | 16 | 200 | 18.5 | 11.2 |
| YOLOv8m | 640 | 16 | 200 | 31.3 | 25.9 |
| YOLOv5s | 640 | 16 | 200 | 22.7 | 7.2 |
| YOLOv5m | 640 | 16 | 200 | 33.6 | 21.2 |
| YOLOv5s-pp | 640 | 16 | 200 | 24.1 | 10.5 |
Table 17.
Experimental results of various models on the val subset of the UAVDT dataset.
| Models | F1 (%) | R (%) | [email protected] (%) |
|---|---|---|---|
| YOLOv8s | 45.0 | 61.0 | 41.6 |
| YOLOv8m | 47.0 | 62.0 | 42.8 |
| YOLOv5s | 41.0 | 55.0 | 35.4 |
| YOLOv5m | 44.0 | 58.0 | 37.7 |
| YOLOv5s-pp | 49.0 | 64.0 | 42.1 |
Table 18.
Experimental results of various models on the test subset of the UAVDT dataset.
| Models | F1 (%) | R (%) | [email protected] (%) |
|---|---|---|---|
| YOLOv8s | 40.0 | 58.0 | 33.6 |
| YOLOv8m | 44.0 | 60.0 | 35.9 |
| YOLOv5s | 37.0 | 54.0 | 29.2 |
| YOLOv5m | 41.0 | 57.0 | 31.5 |
| YOLOv5s-pp | 44.0 | 61.0 | 35.7 |
Disclaimer/Publisher’s Note: The statements, opinions and data contained in all publications are solely those of the individual author(s) and contributor(s) and not of MDPI and/or the editor(s). MDPI and/or the editor(s) disclaim responsibility for any injury to people or property resulting from any ideas, methods, instructions or products referred to in the content. |
© 2023 by the authors. Licensee MDPI, Basel, Switzerland. This article is an open access article distributed under the terms and conditions of the Creative Commons Attribution (CC BY) license (https://creativecommons.org/licenses/by/4.0/).
Share and Cite
MDPI and ACS Style
Xu, H.; Zheng, W.; Liu, F.; Li, P.; Wang, R. Unmanned Aerial Vehicle Perspective Small Target Recognition Algorithm Based on Improved YOLOv5. Remote Sens. 2023, 15, 3583. https://0-doi-org.brum.beds.ac.uk/10.3390/rs15143583
AMA Style
Xu H, Zheng W, Liu F, Li P, Wang R. Unmanned Aerial Vehicle Perspective Small Target Recognition Algorithm Based on Improved YOLOv5. Remote Sensing. 2023; 15(14):3583. https://0-doi-org.brum.beds.ac.uk/10.3390/rs15143583
Chicago/Turabian StyleXu, He, Wenlong Zheng, Fengxuan Liu, Peng Li, and Ruchuan Wang. 2023. "Unmanned Aerial Vehicle Perspective Small Target Recognition Algorithm Based on Improved YOLOv5" Remote Sensing 15, no. 14: 3583. https://0-doi-org.brum.beds.ac.uk/10.3390/rs15143583
Note that from the first issue of 2016, this journal uses article numbers instead of page numbers. See further details here.