

UCDnet: Double U-Shaped Segmentation Network Cascade Centroid Map Prediction for Infrared Weak Small Target Detection
Abstract
:
1. Introduction
2. Materials and Methods
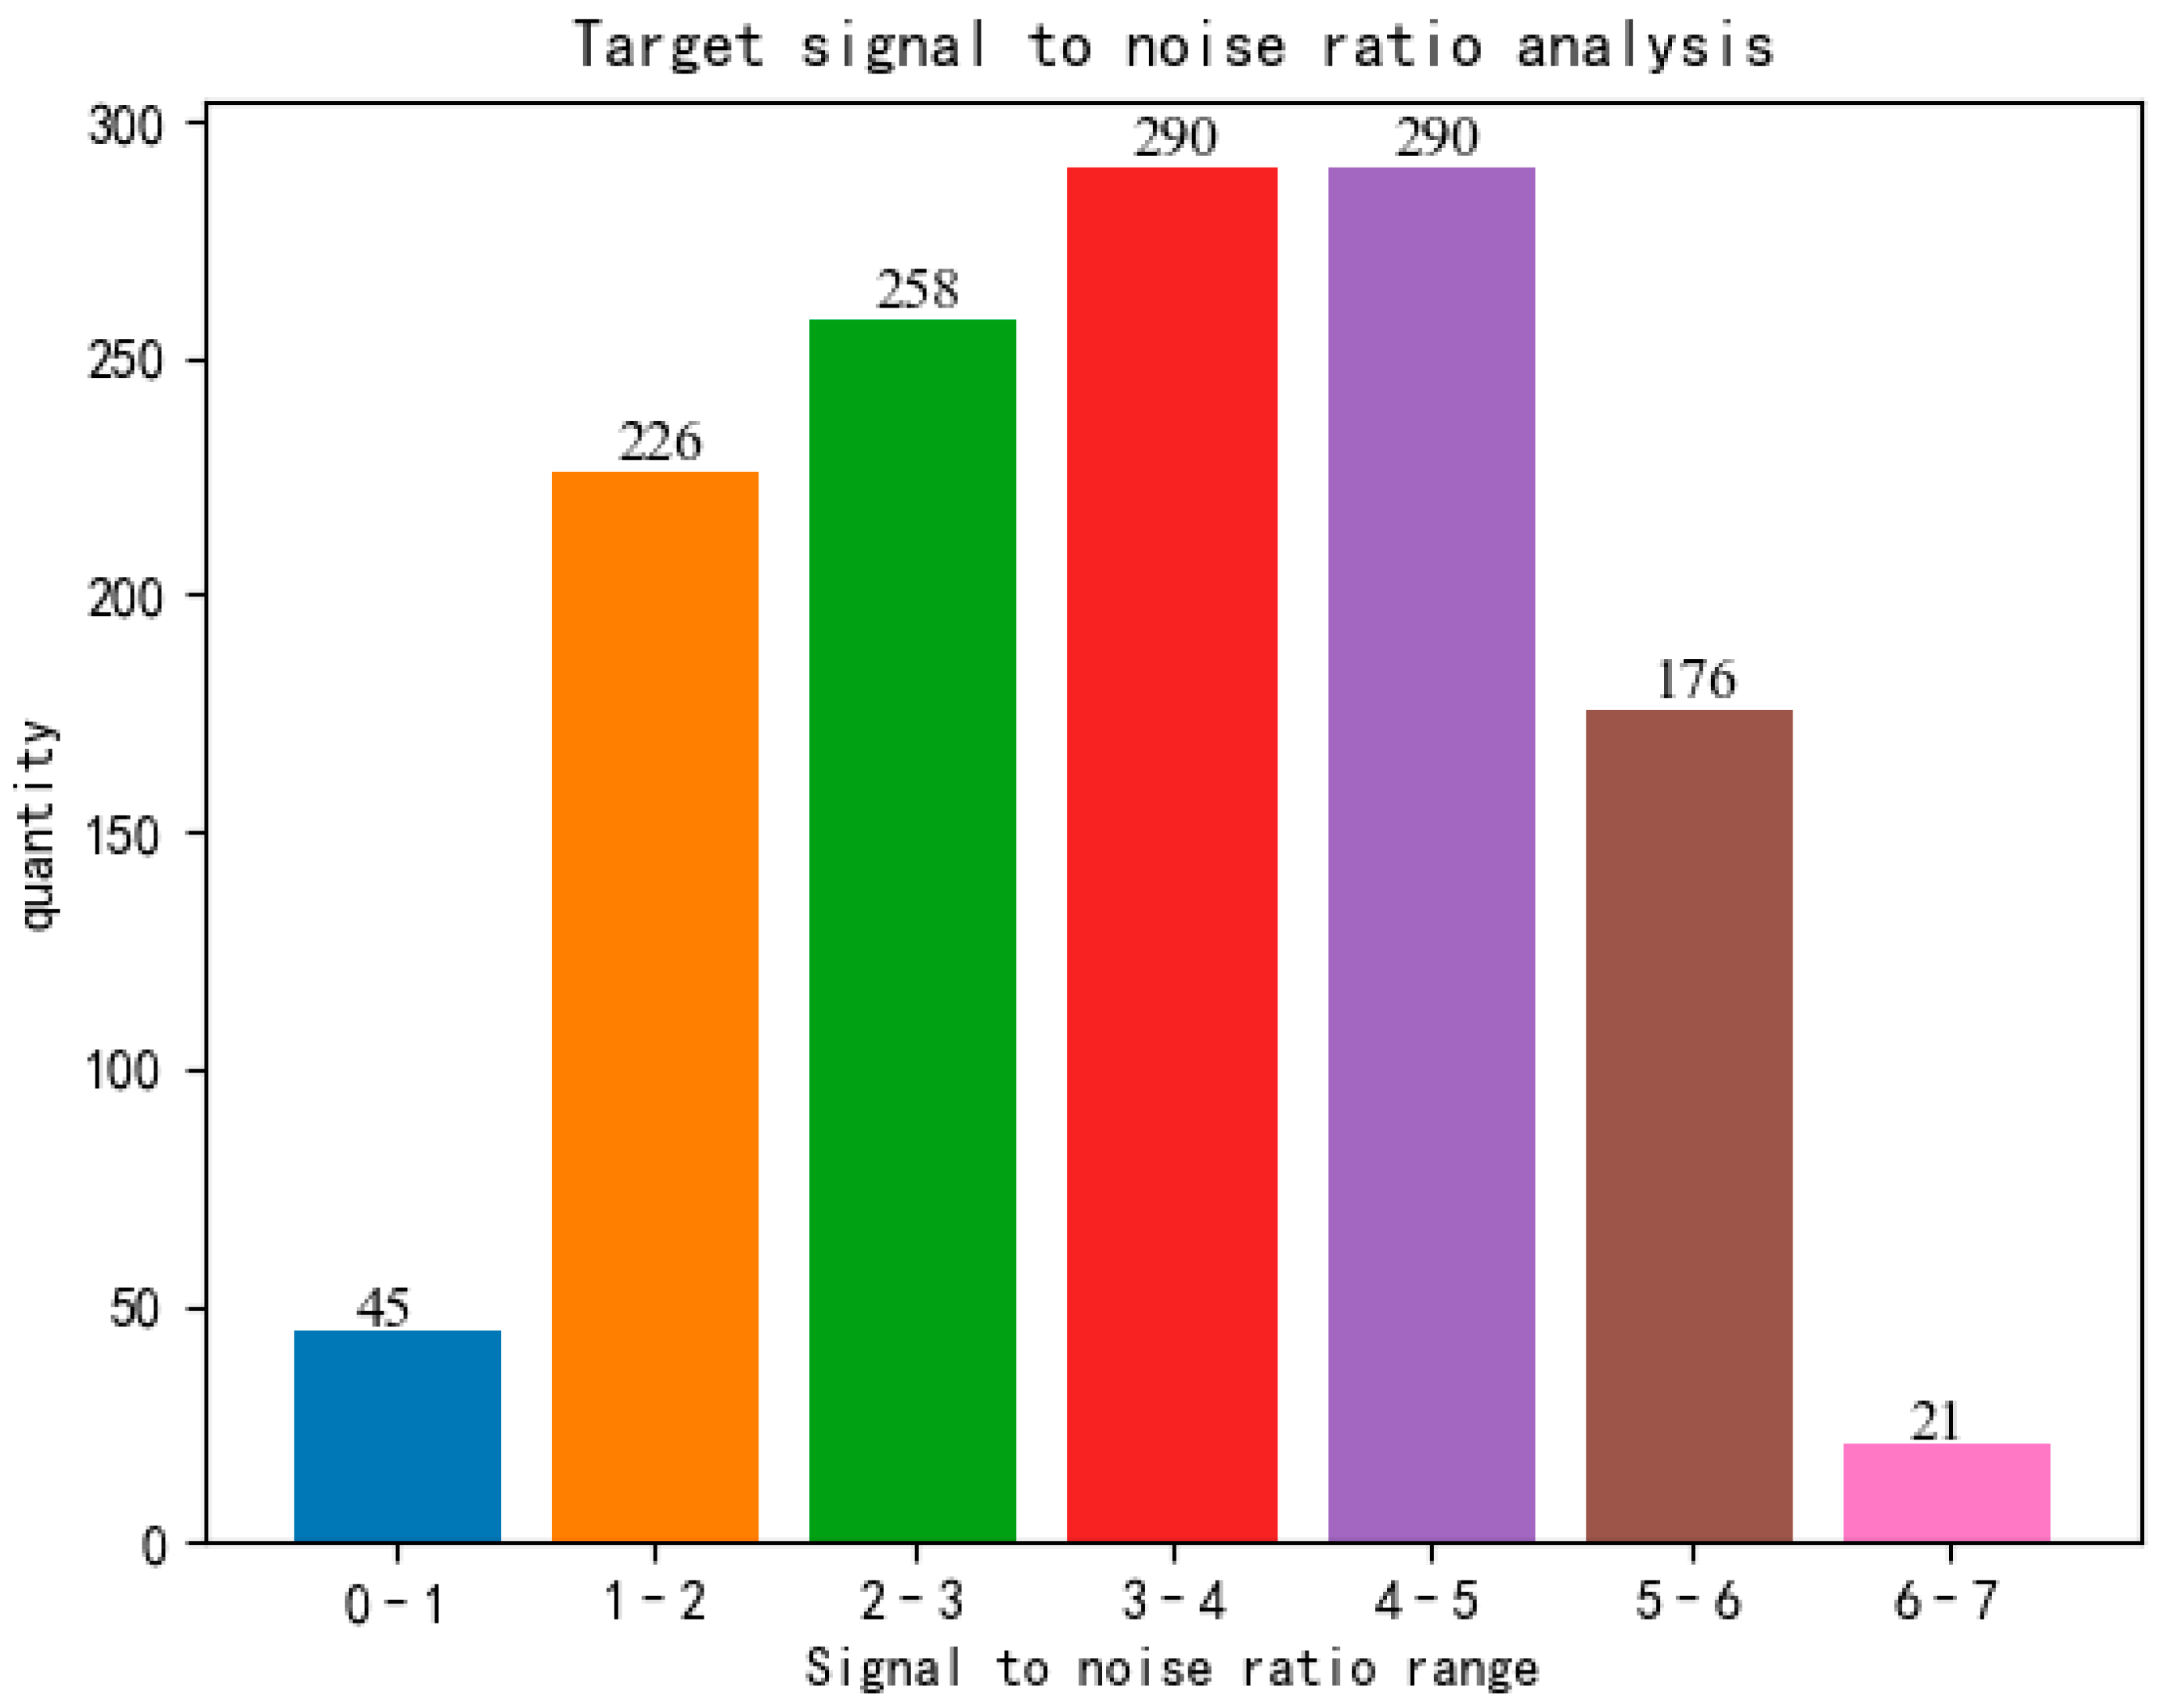
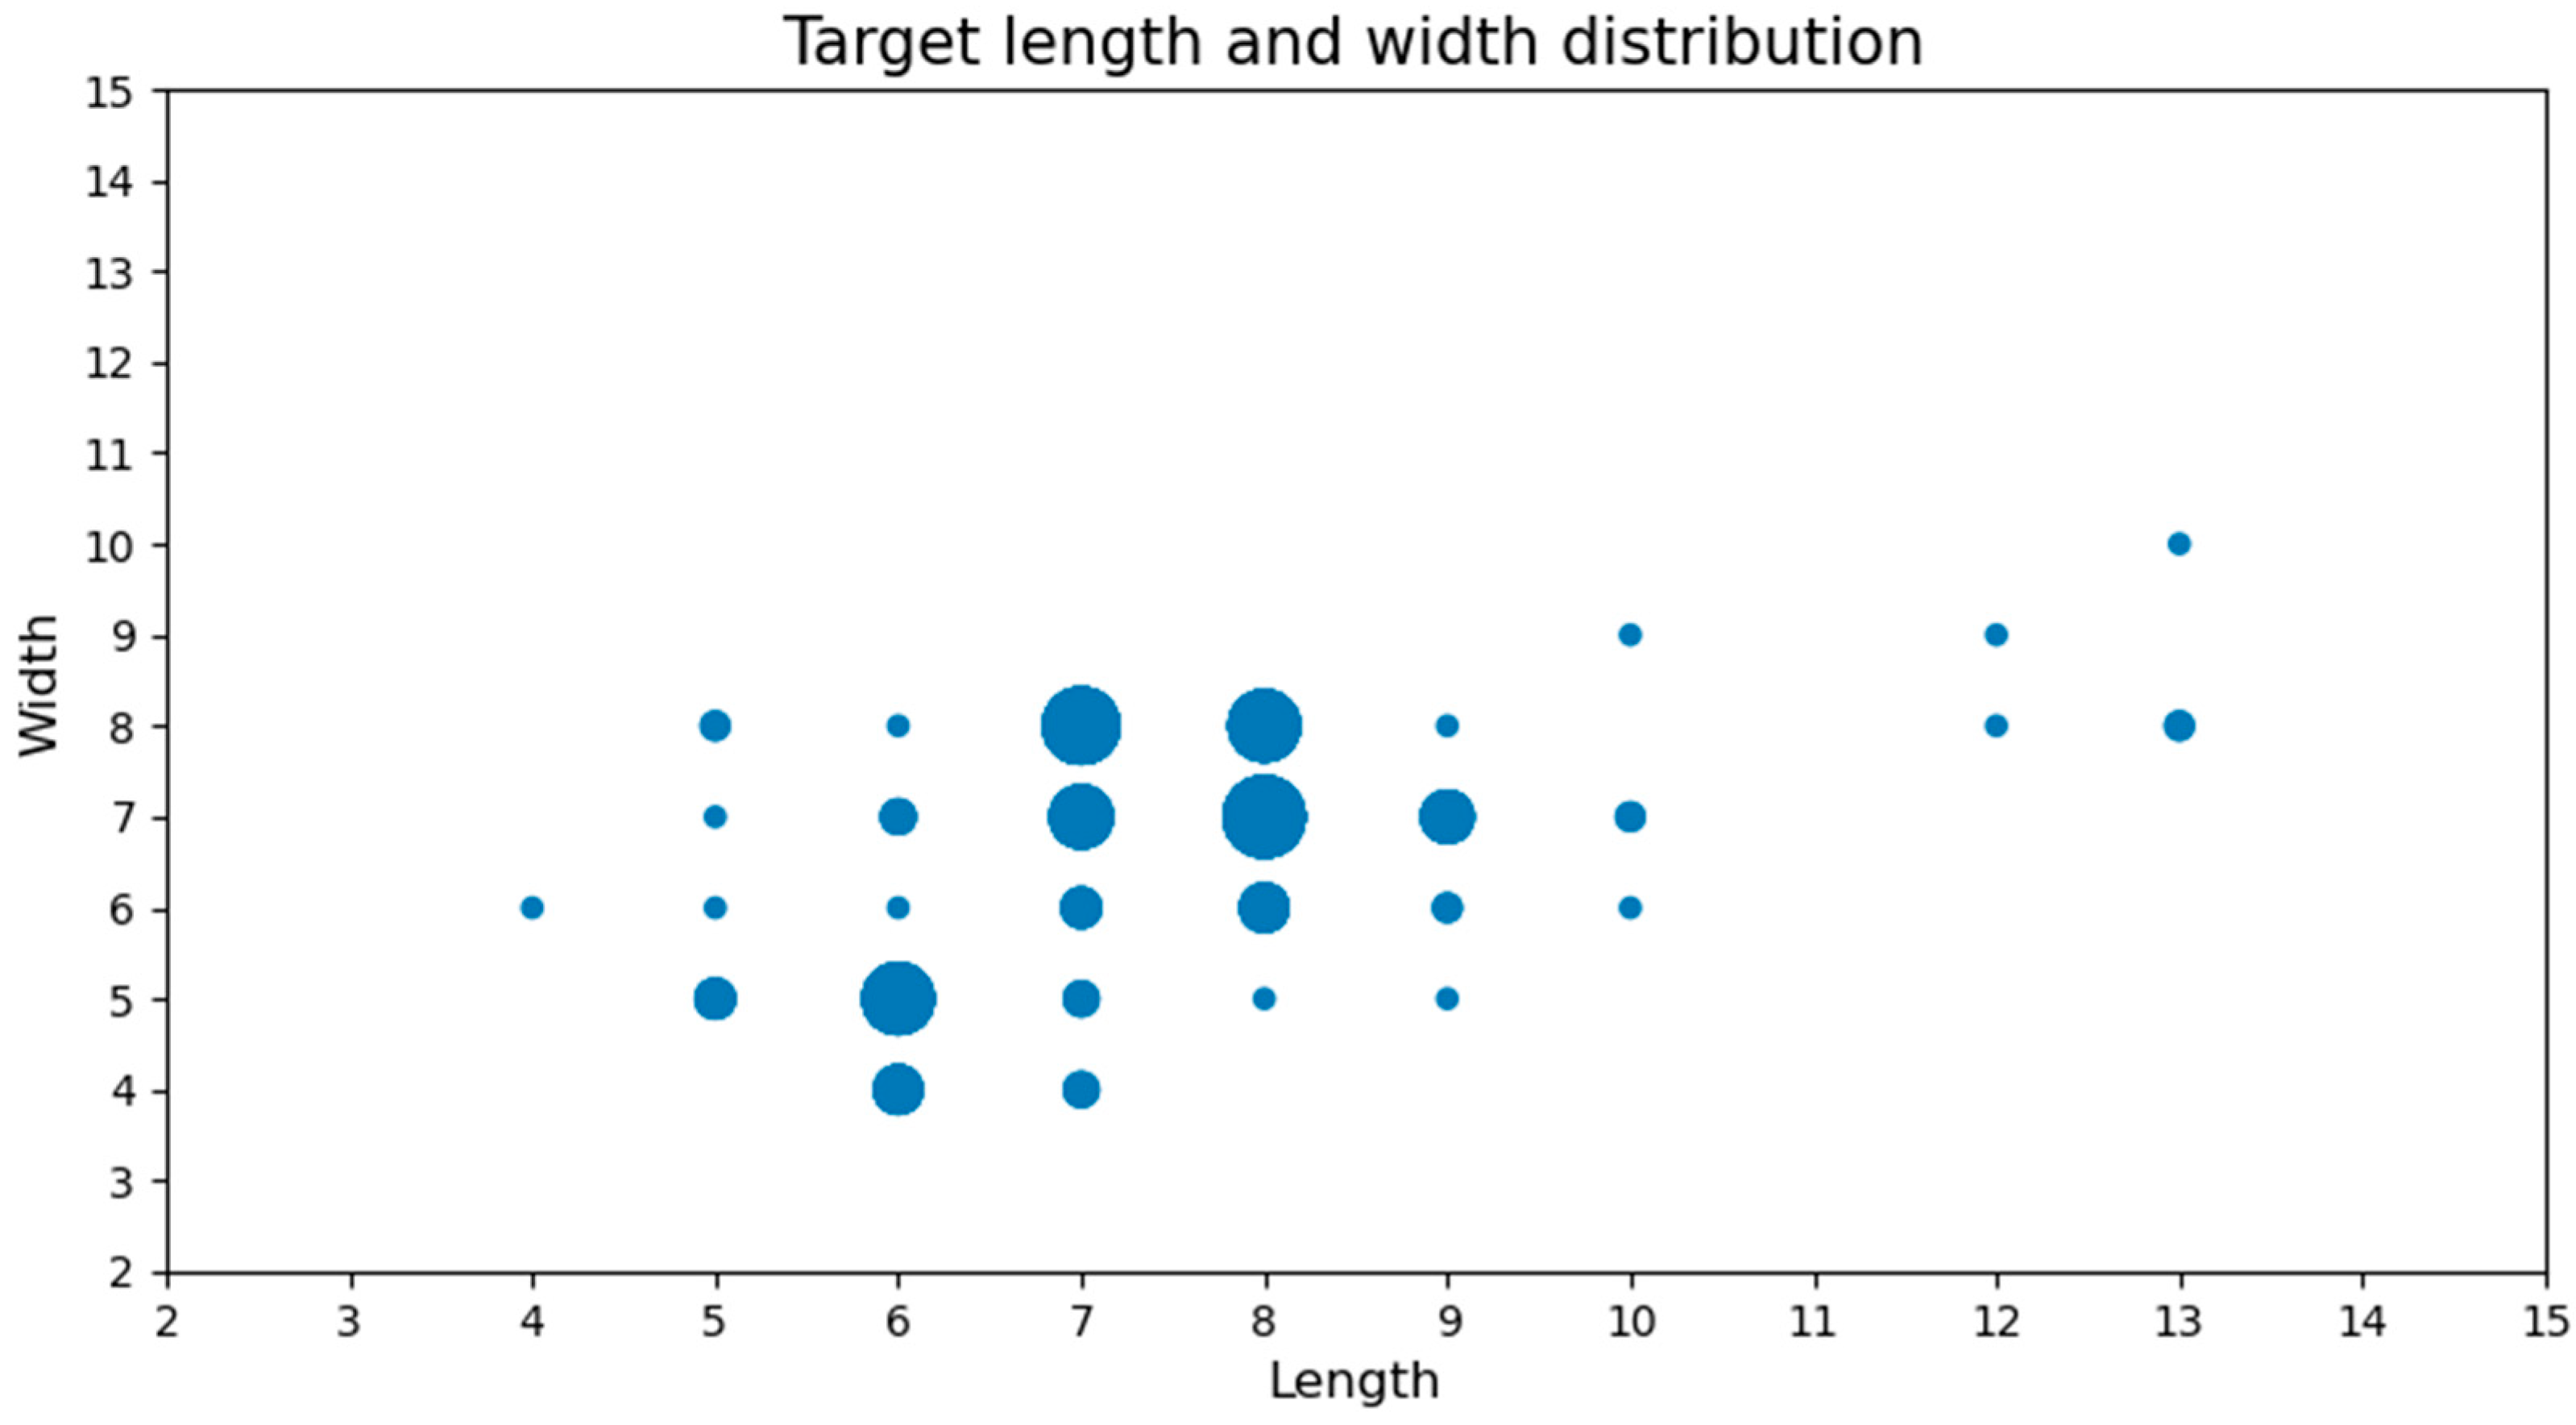
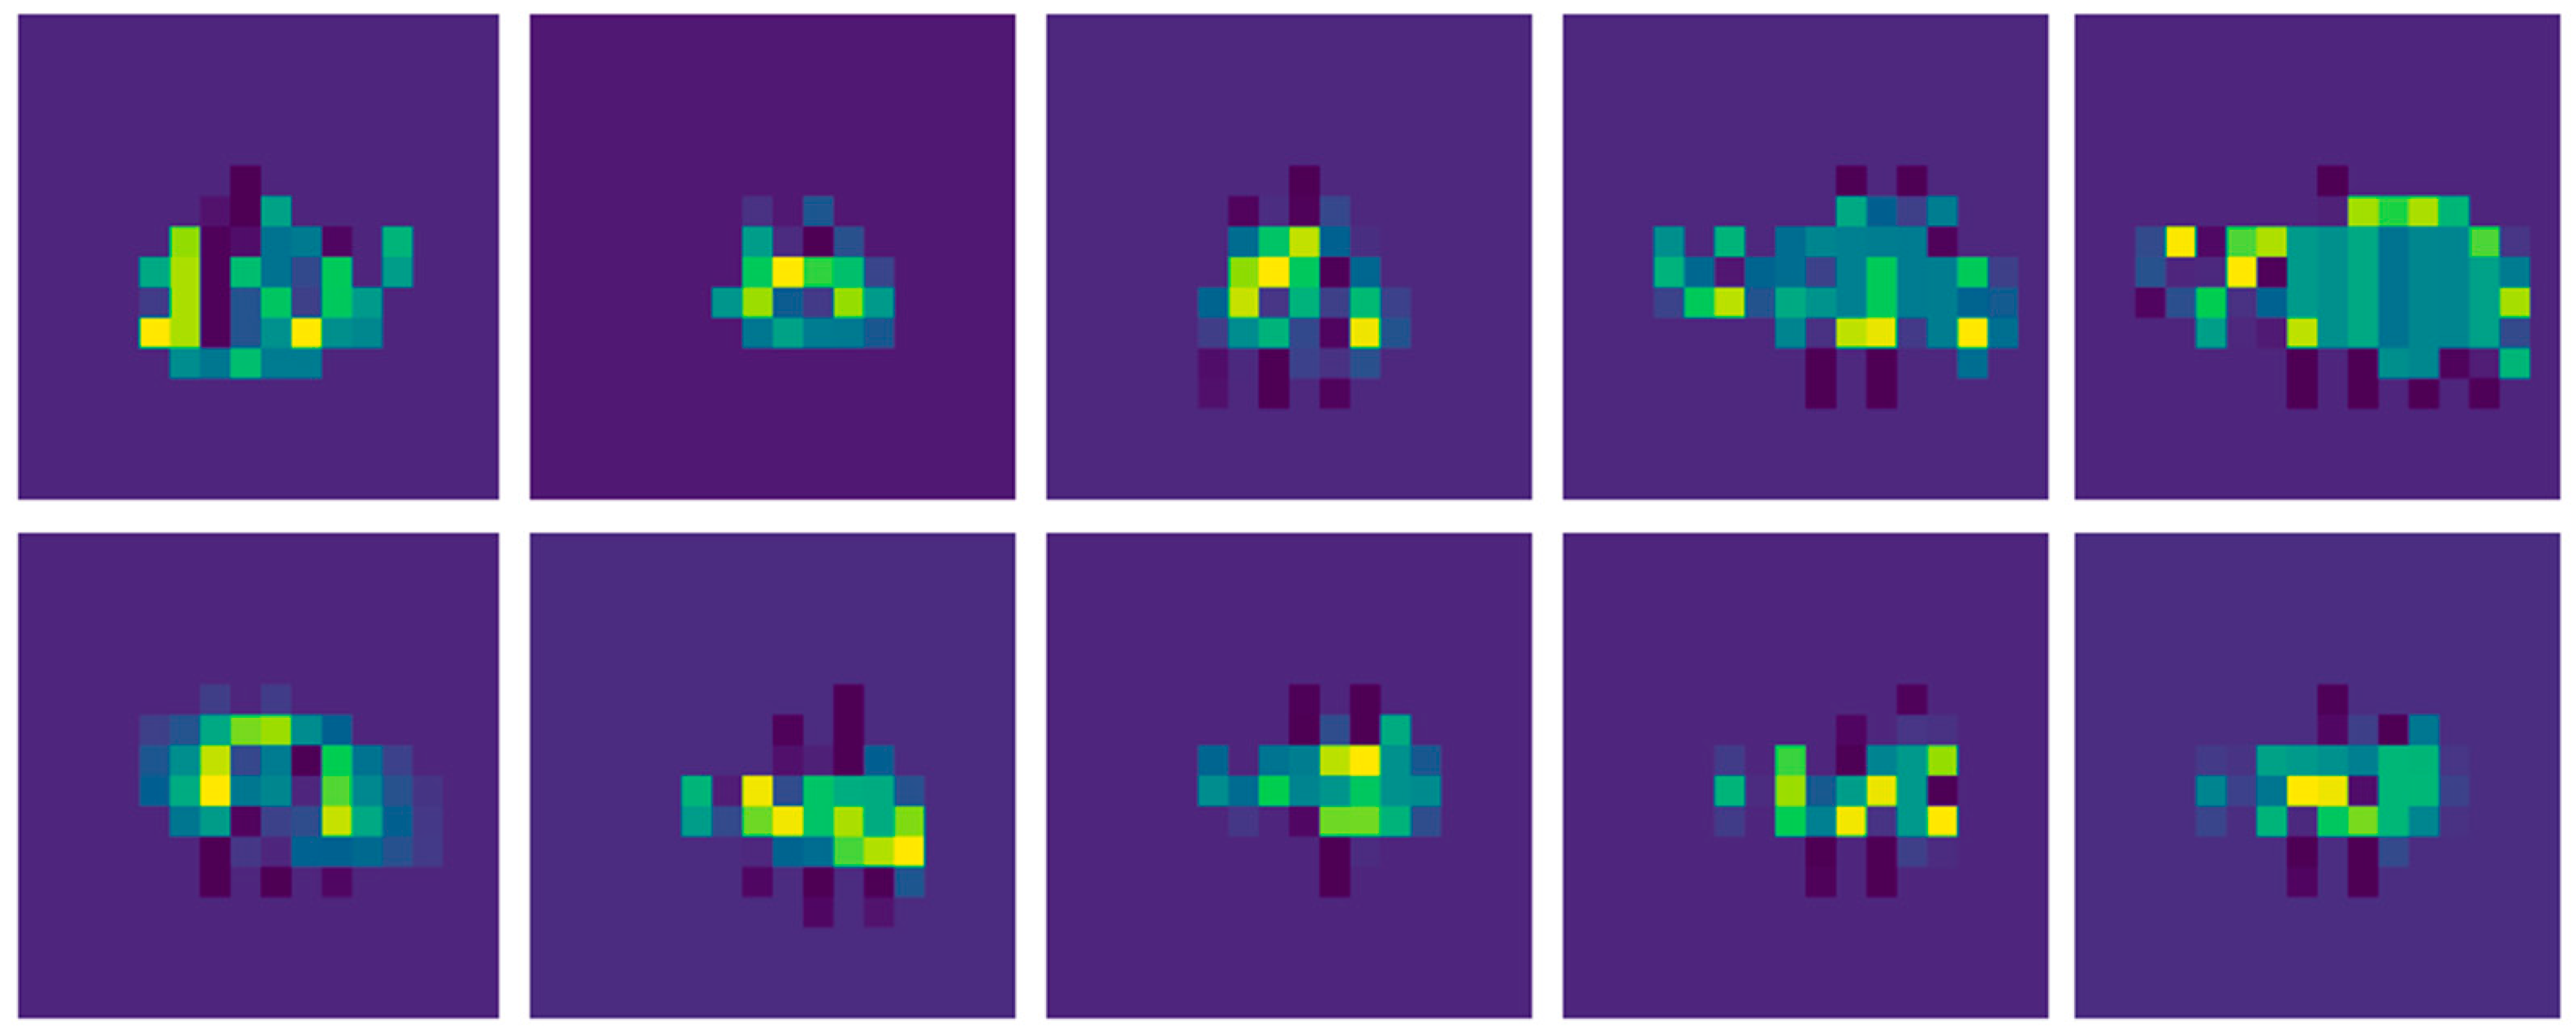
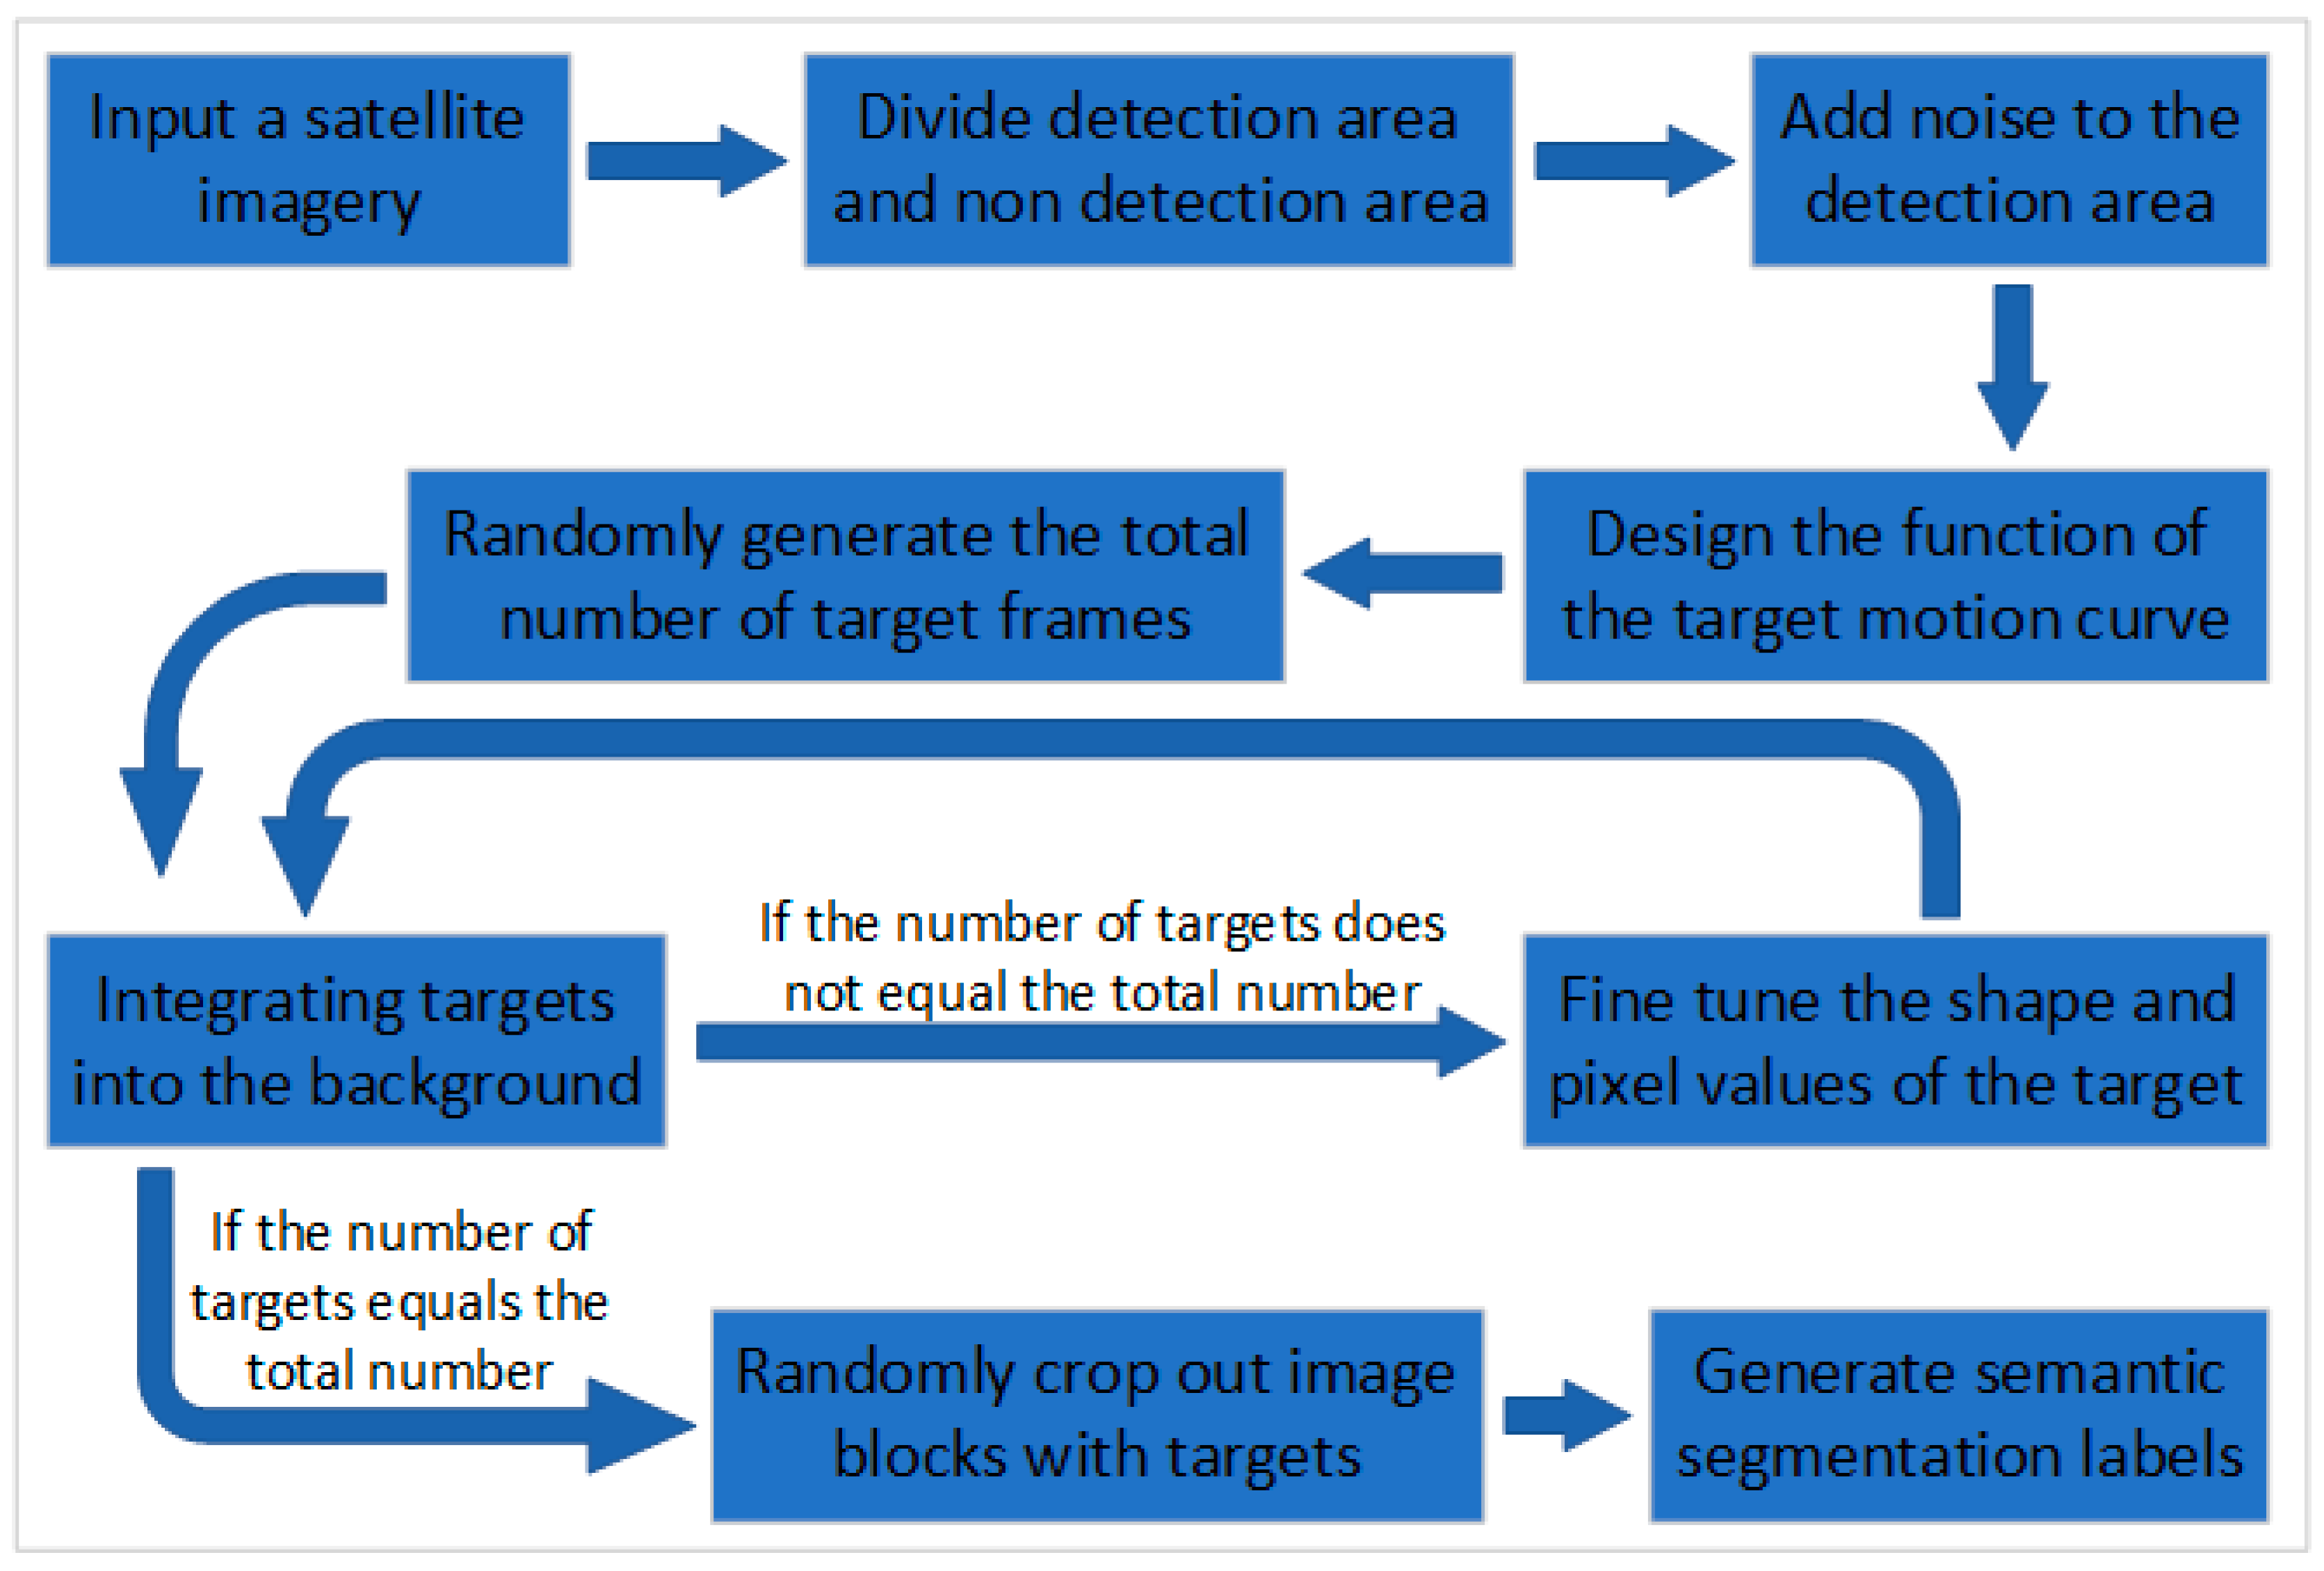
2.1. Dataset Simulation
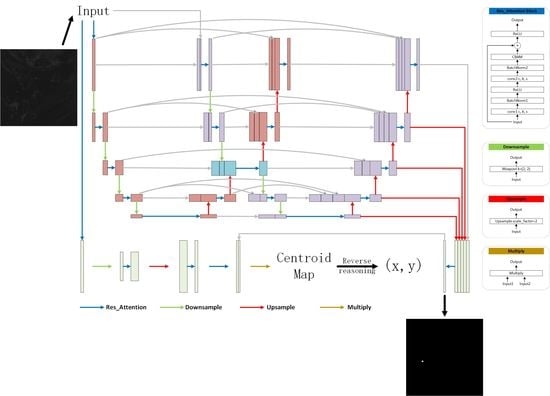
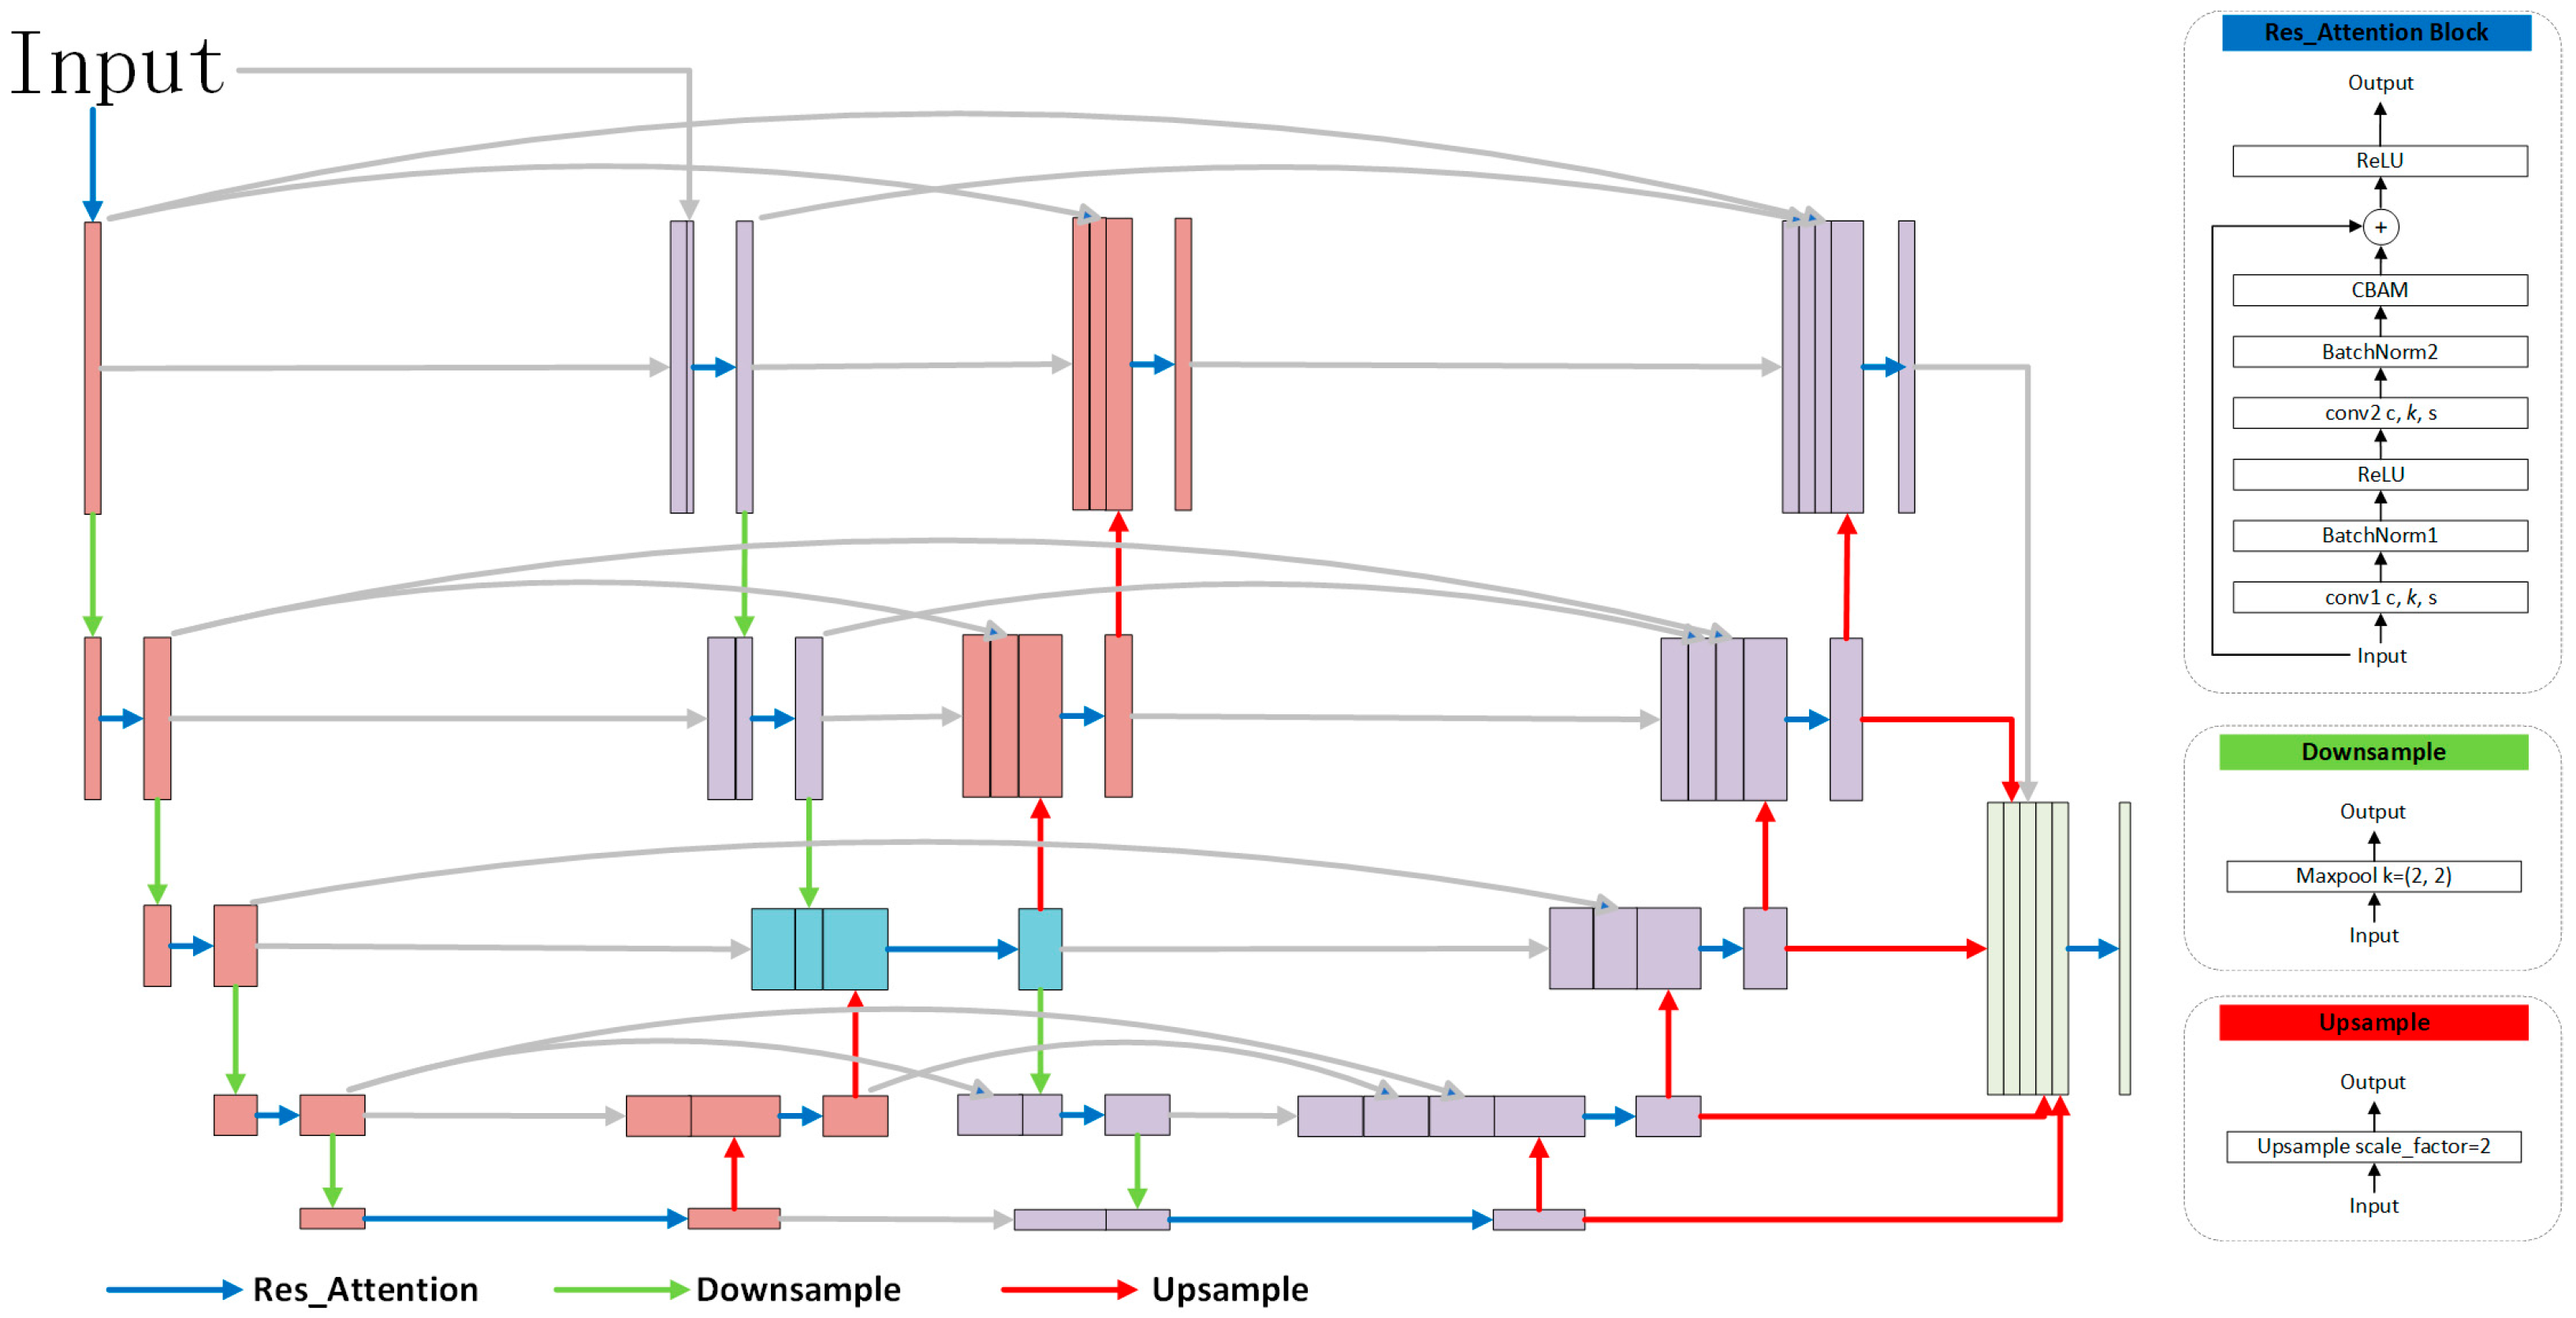
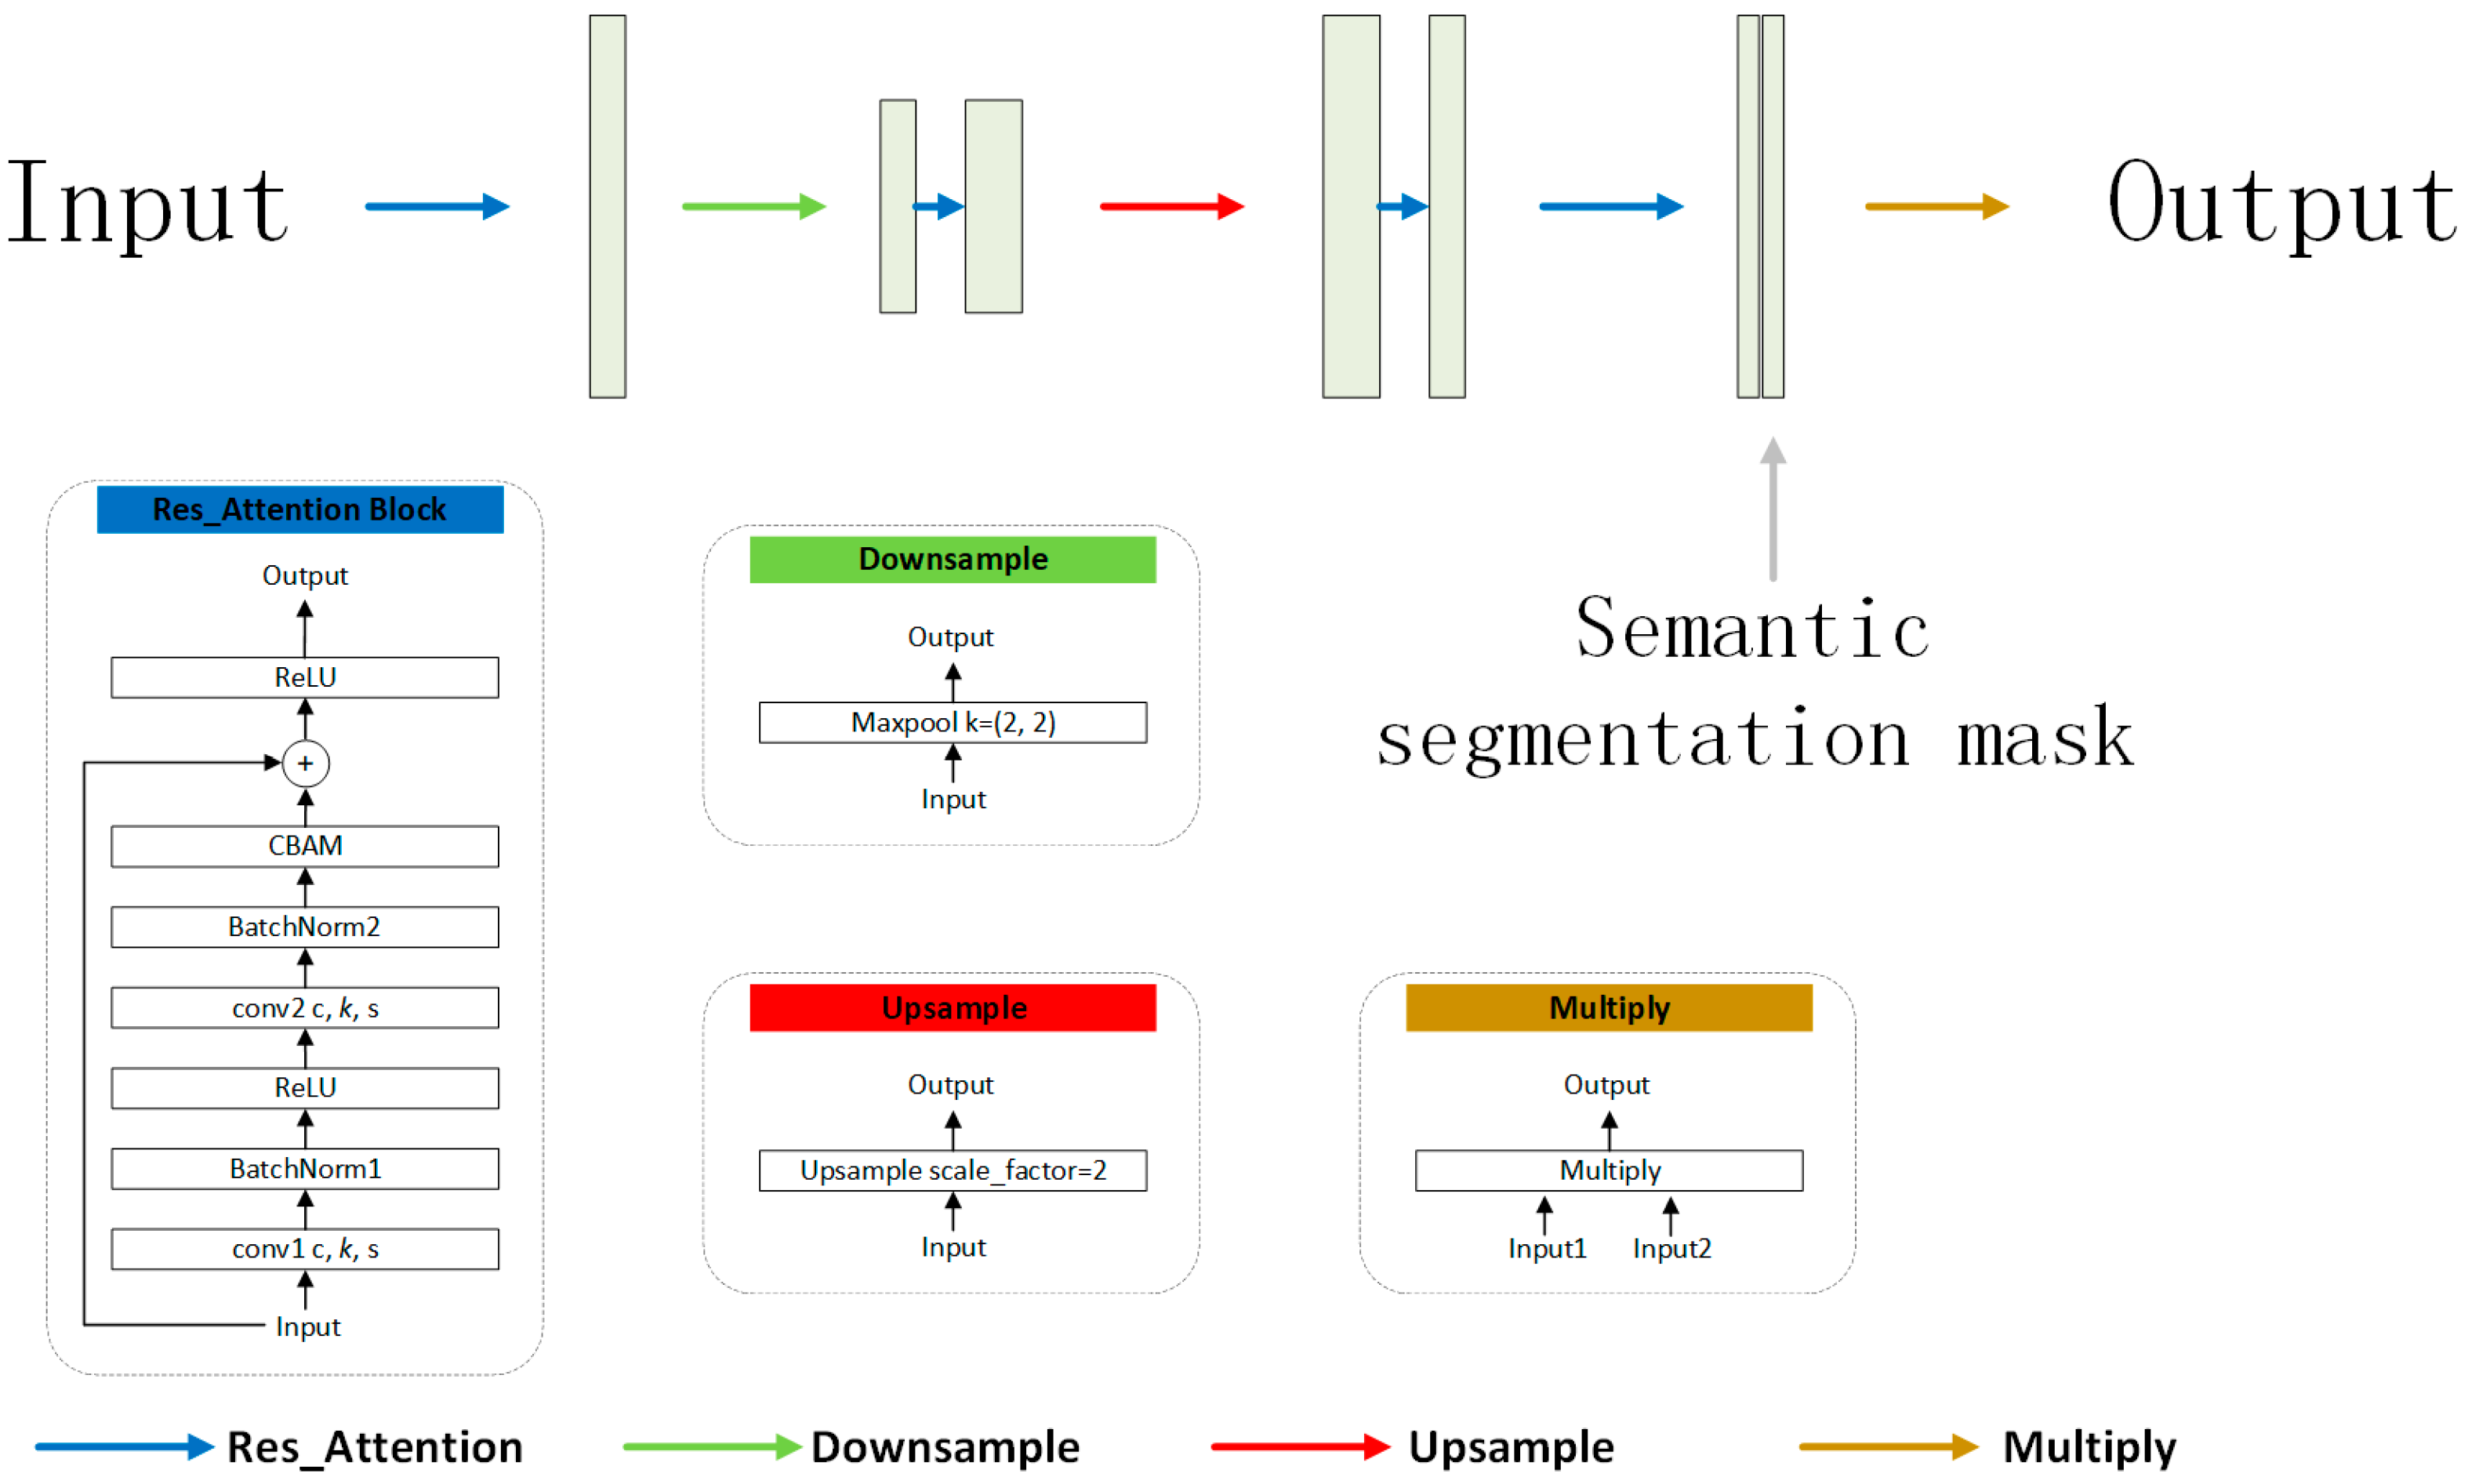
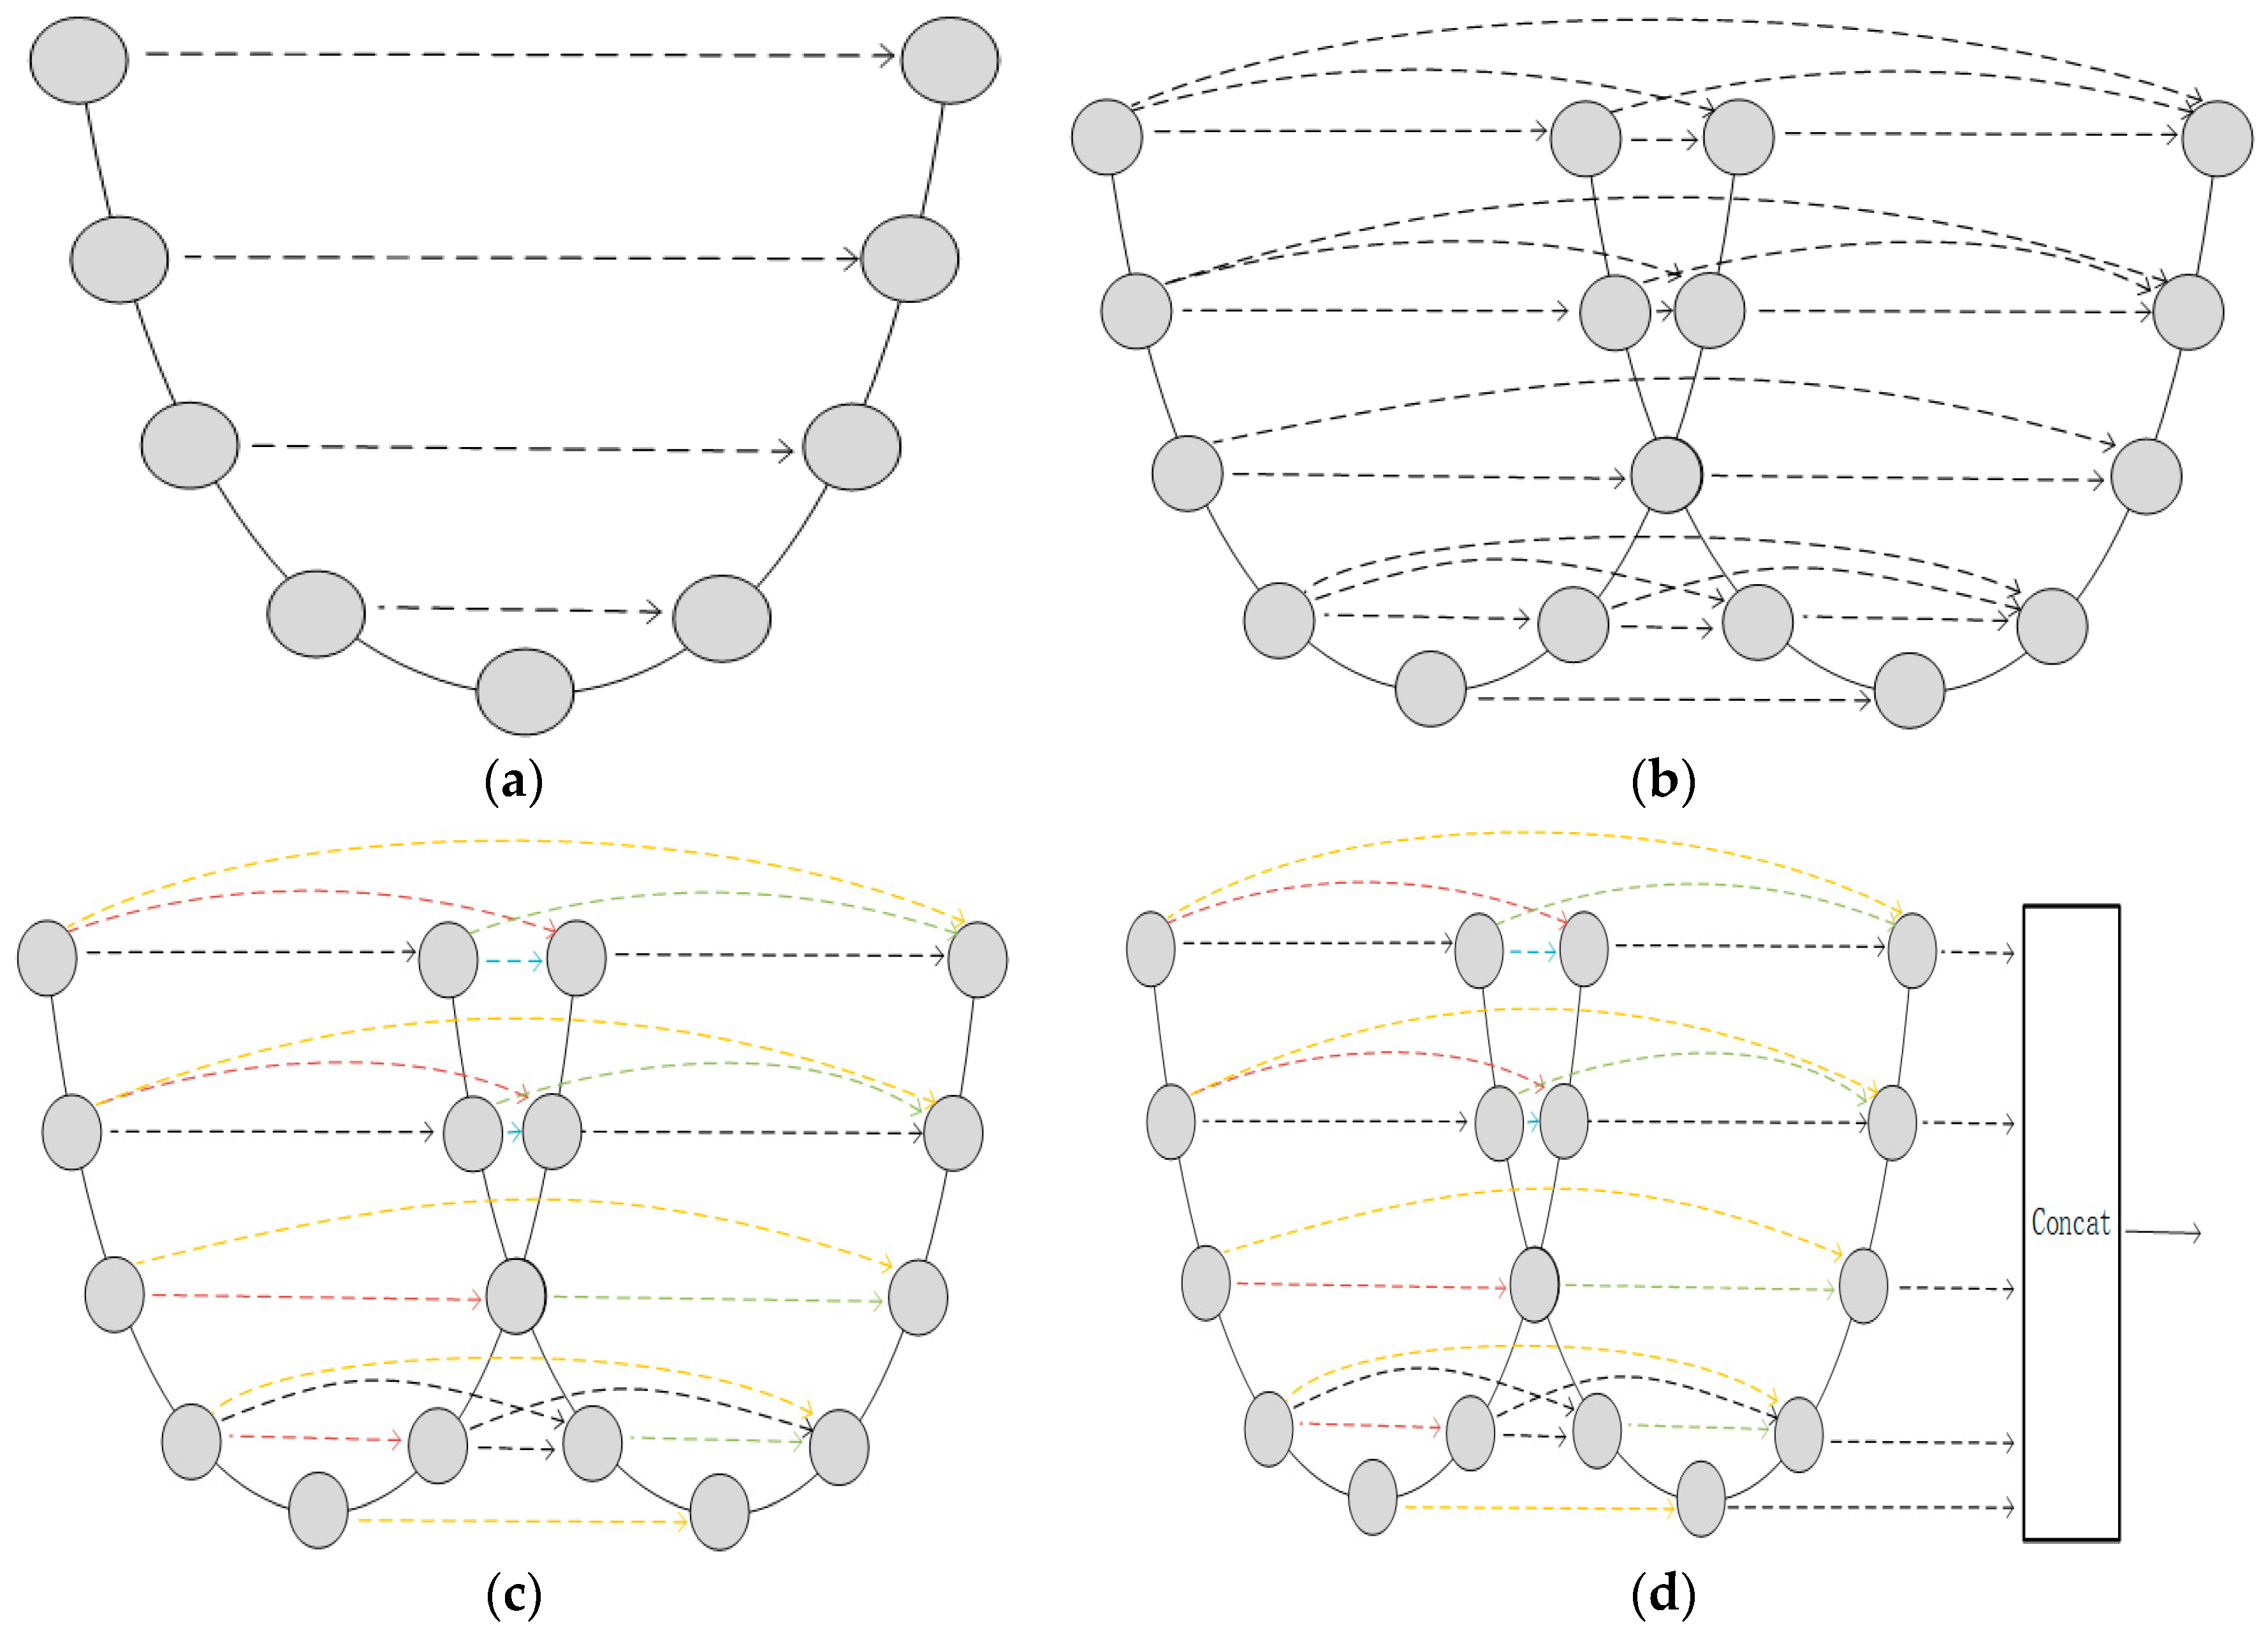
2.2. Semantic Segmentation Subnet
2.3. Centroid Localization Subnet
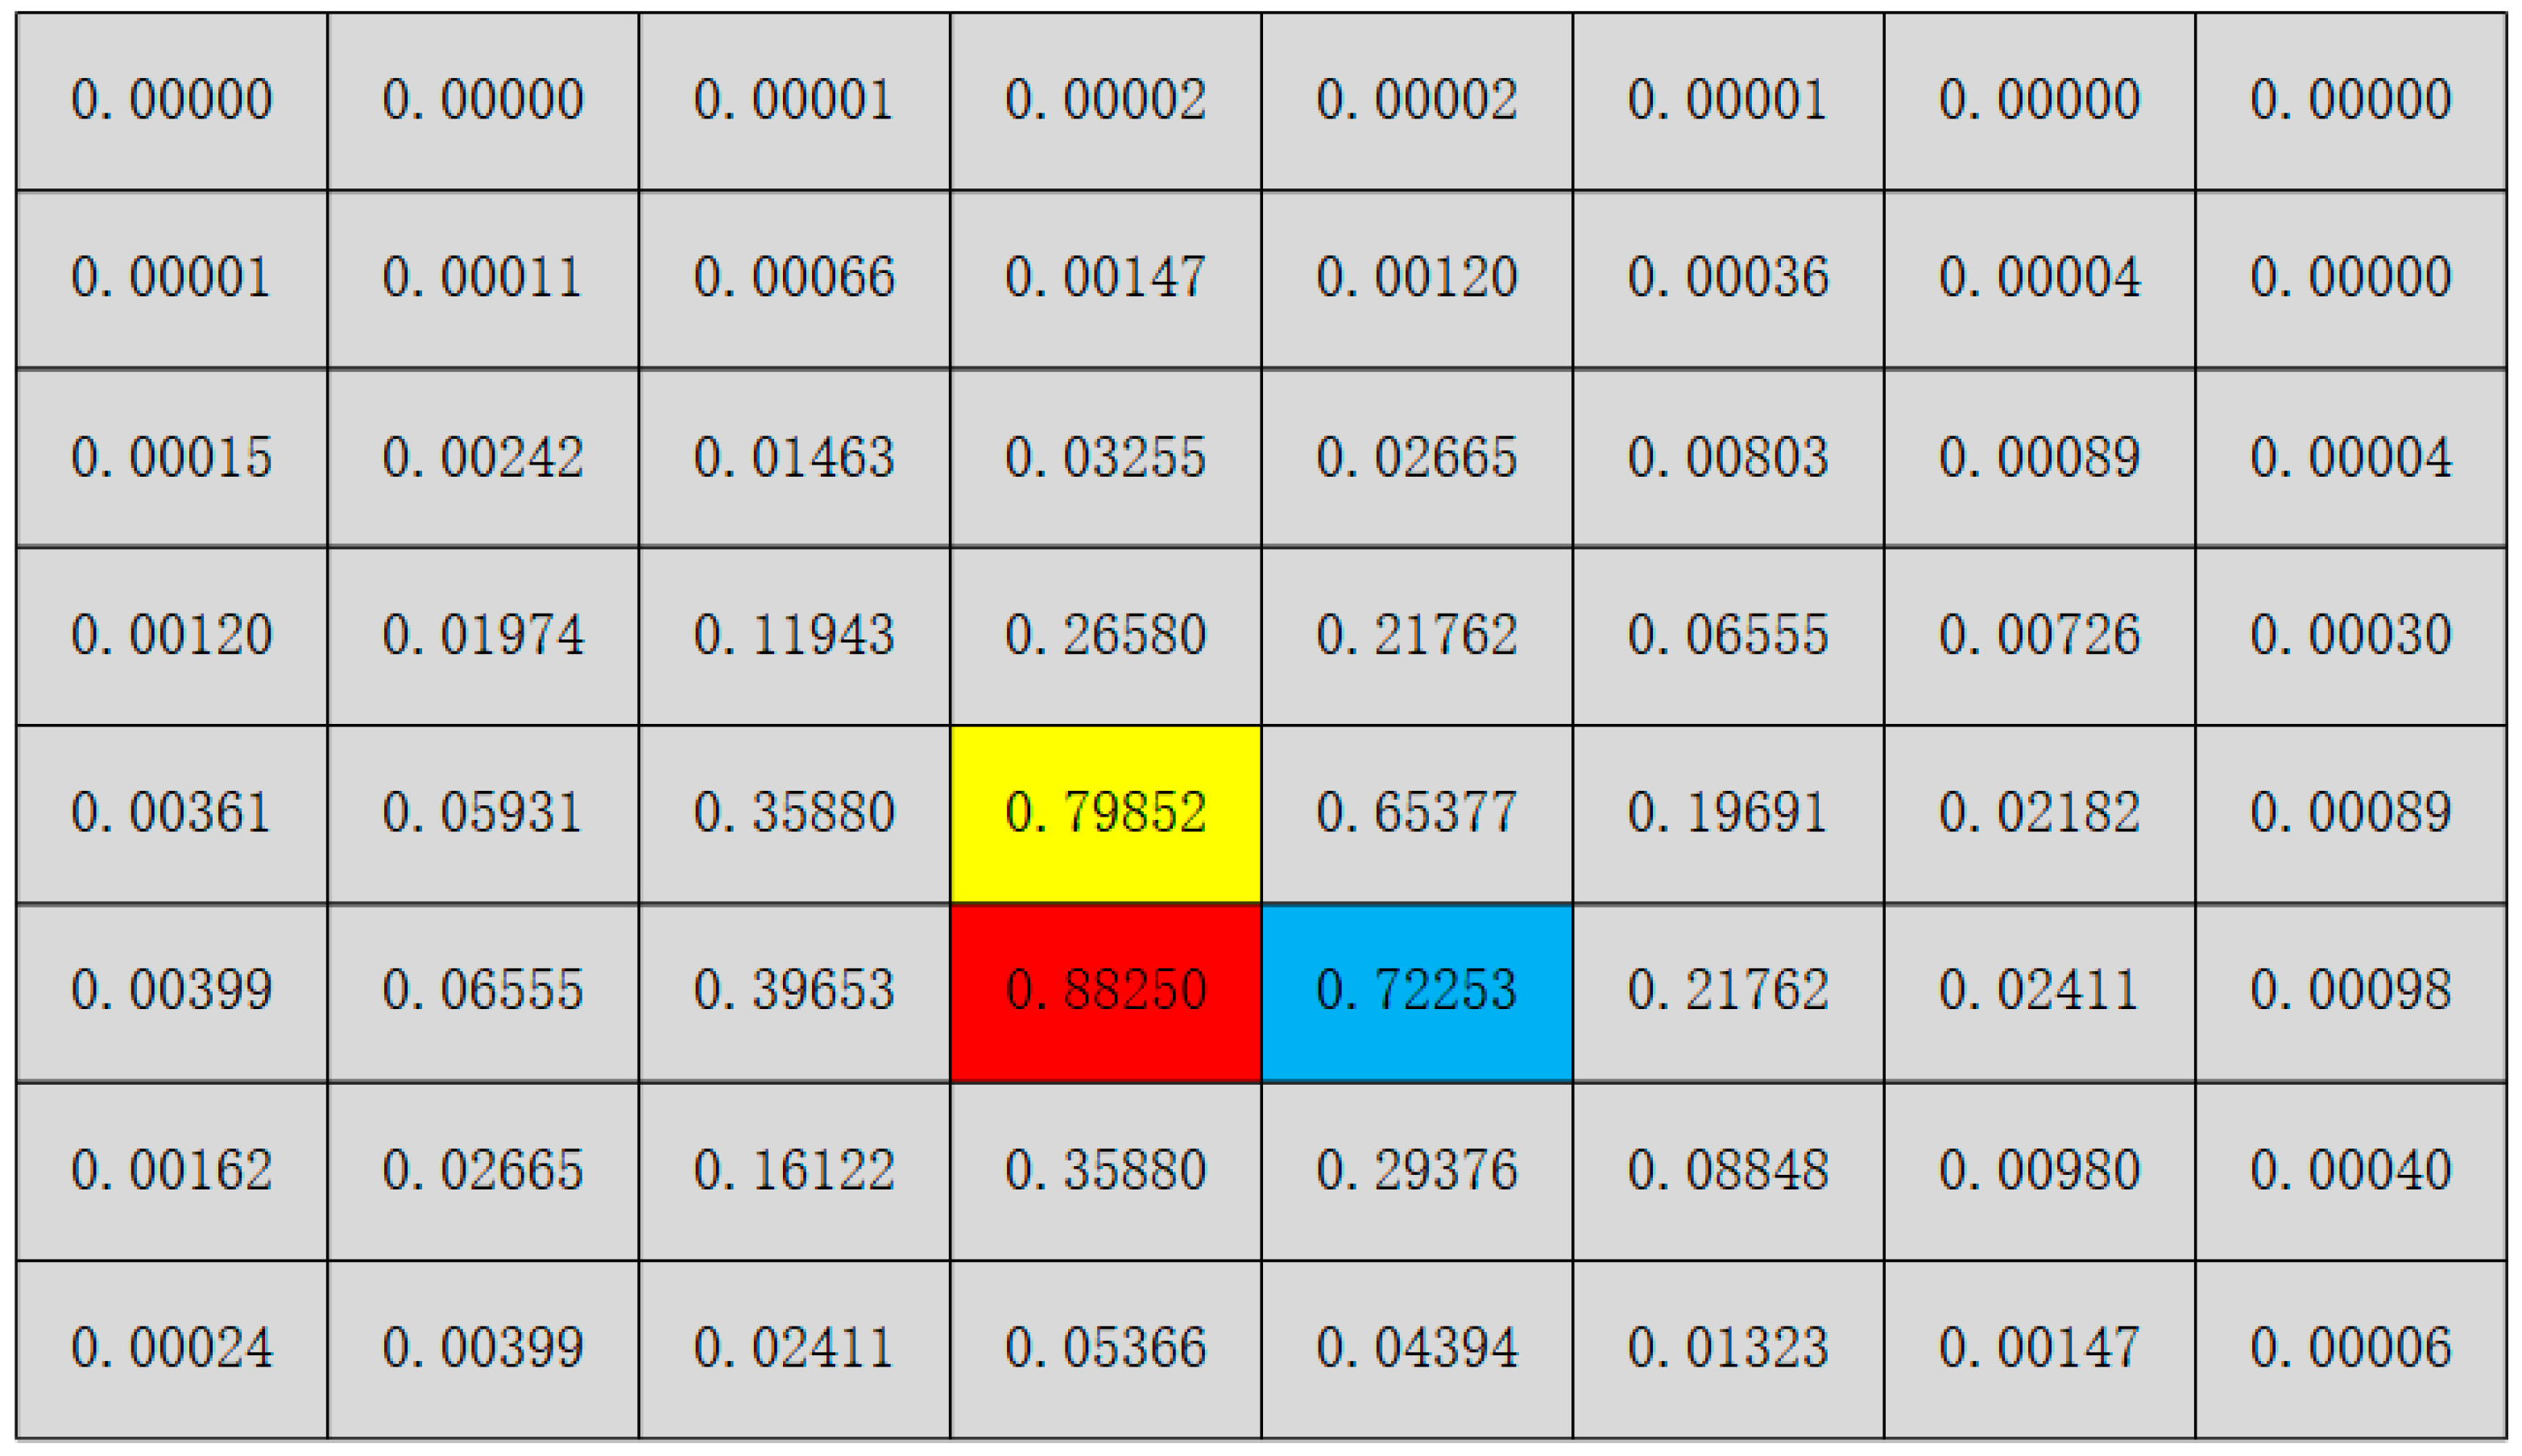
- Firstly, determine the number of targets N in our predicted centroid map, which corresponds to N clusters of pixels.
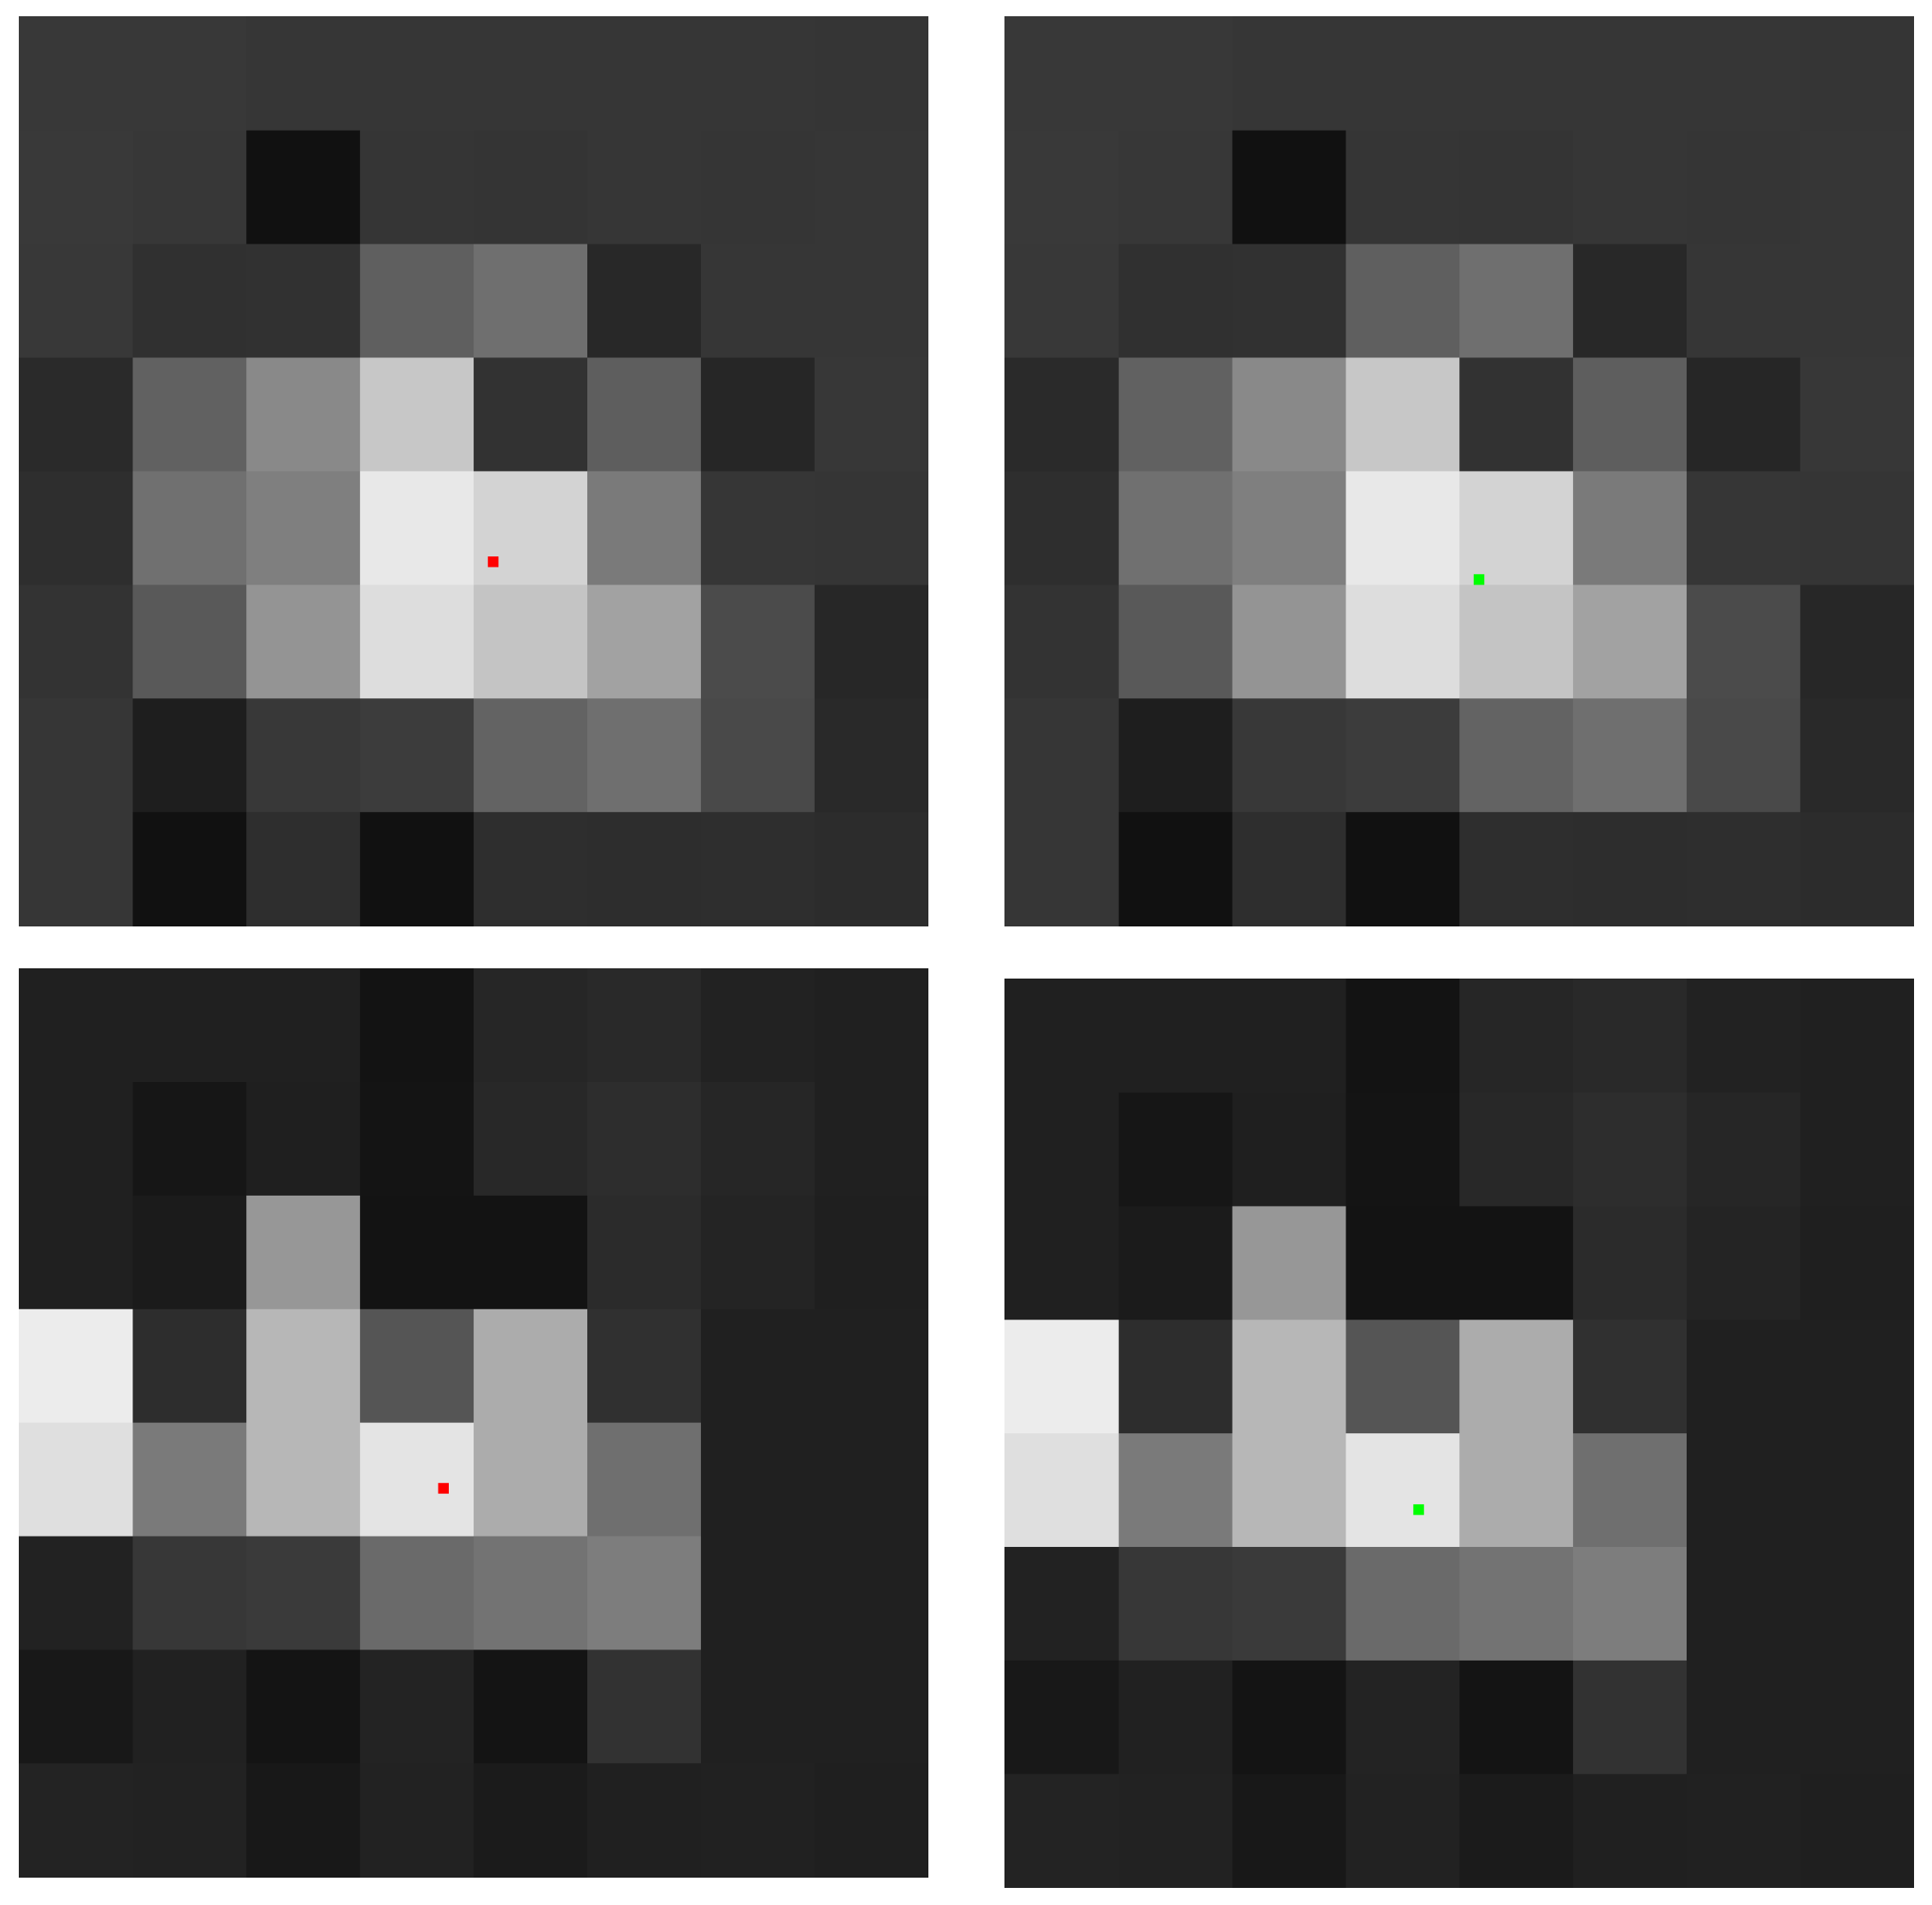
- For each cluster of pixels mentioned above, select the maximum value from our predicted results as the centroid reference point (represented by the red position in Figure 8).
- Take the centroid reference point as the center and find the maximum value within the vertical neighborhood to serve as the centroid vertical correction point (represented by the yellow position in Figure 8).
- Similarly, take the centroid reference point as the center and find the maximum value within the horizontal neighborhood to serve as the centroid horizontal correction point (represented by the blue position in Figure 8).
- Combining the centroid reference point , the vertical correction point , and the horizontal correction point , calculate the sub-pixel-level precise positions x0 and y0 of each centroid using the following equations:where i1 = i3 and j1 = j2, the above three equations can be used to obtain the following:
- Repeat the above steps 2 to 5 until all N predicted targets have been traversed.
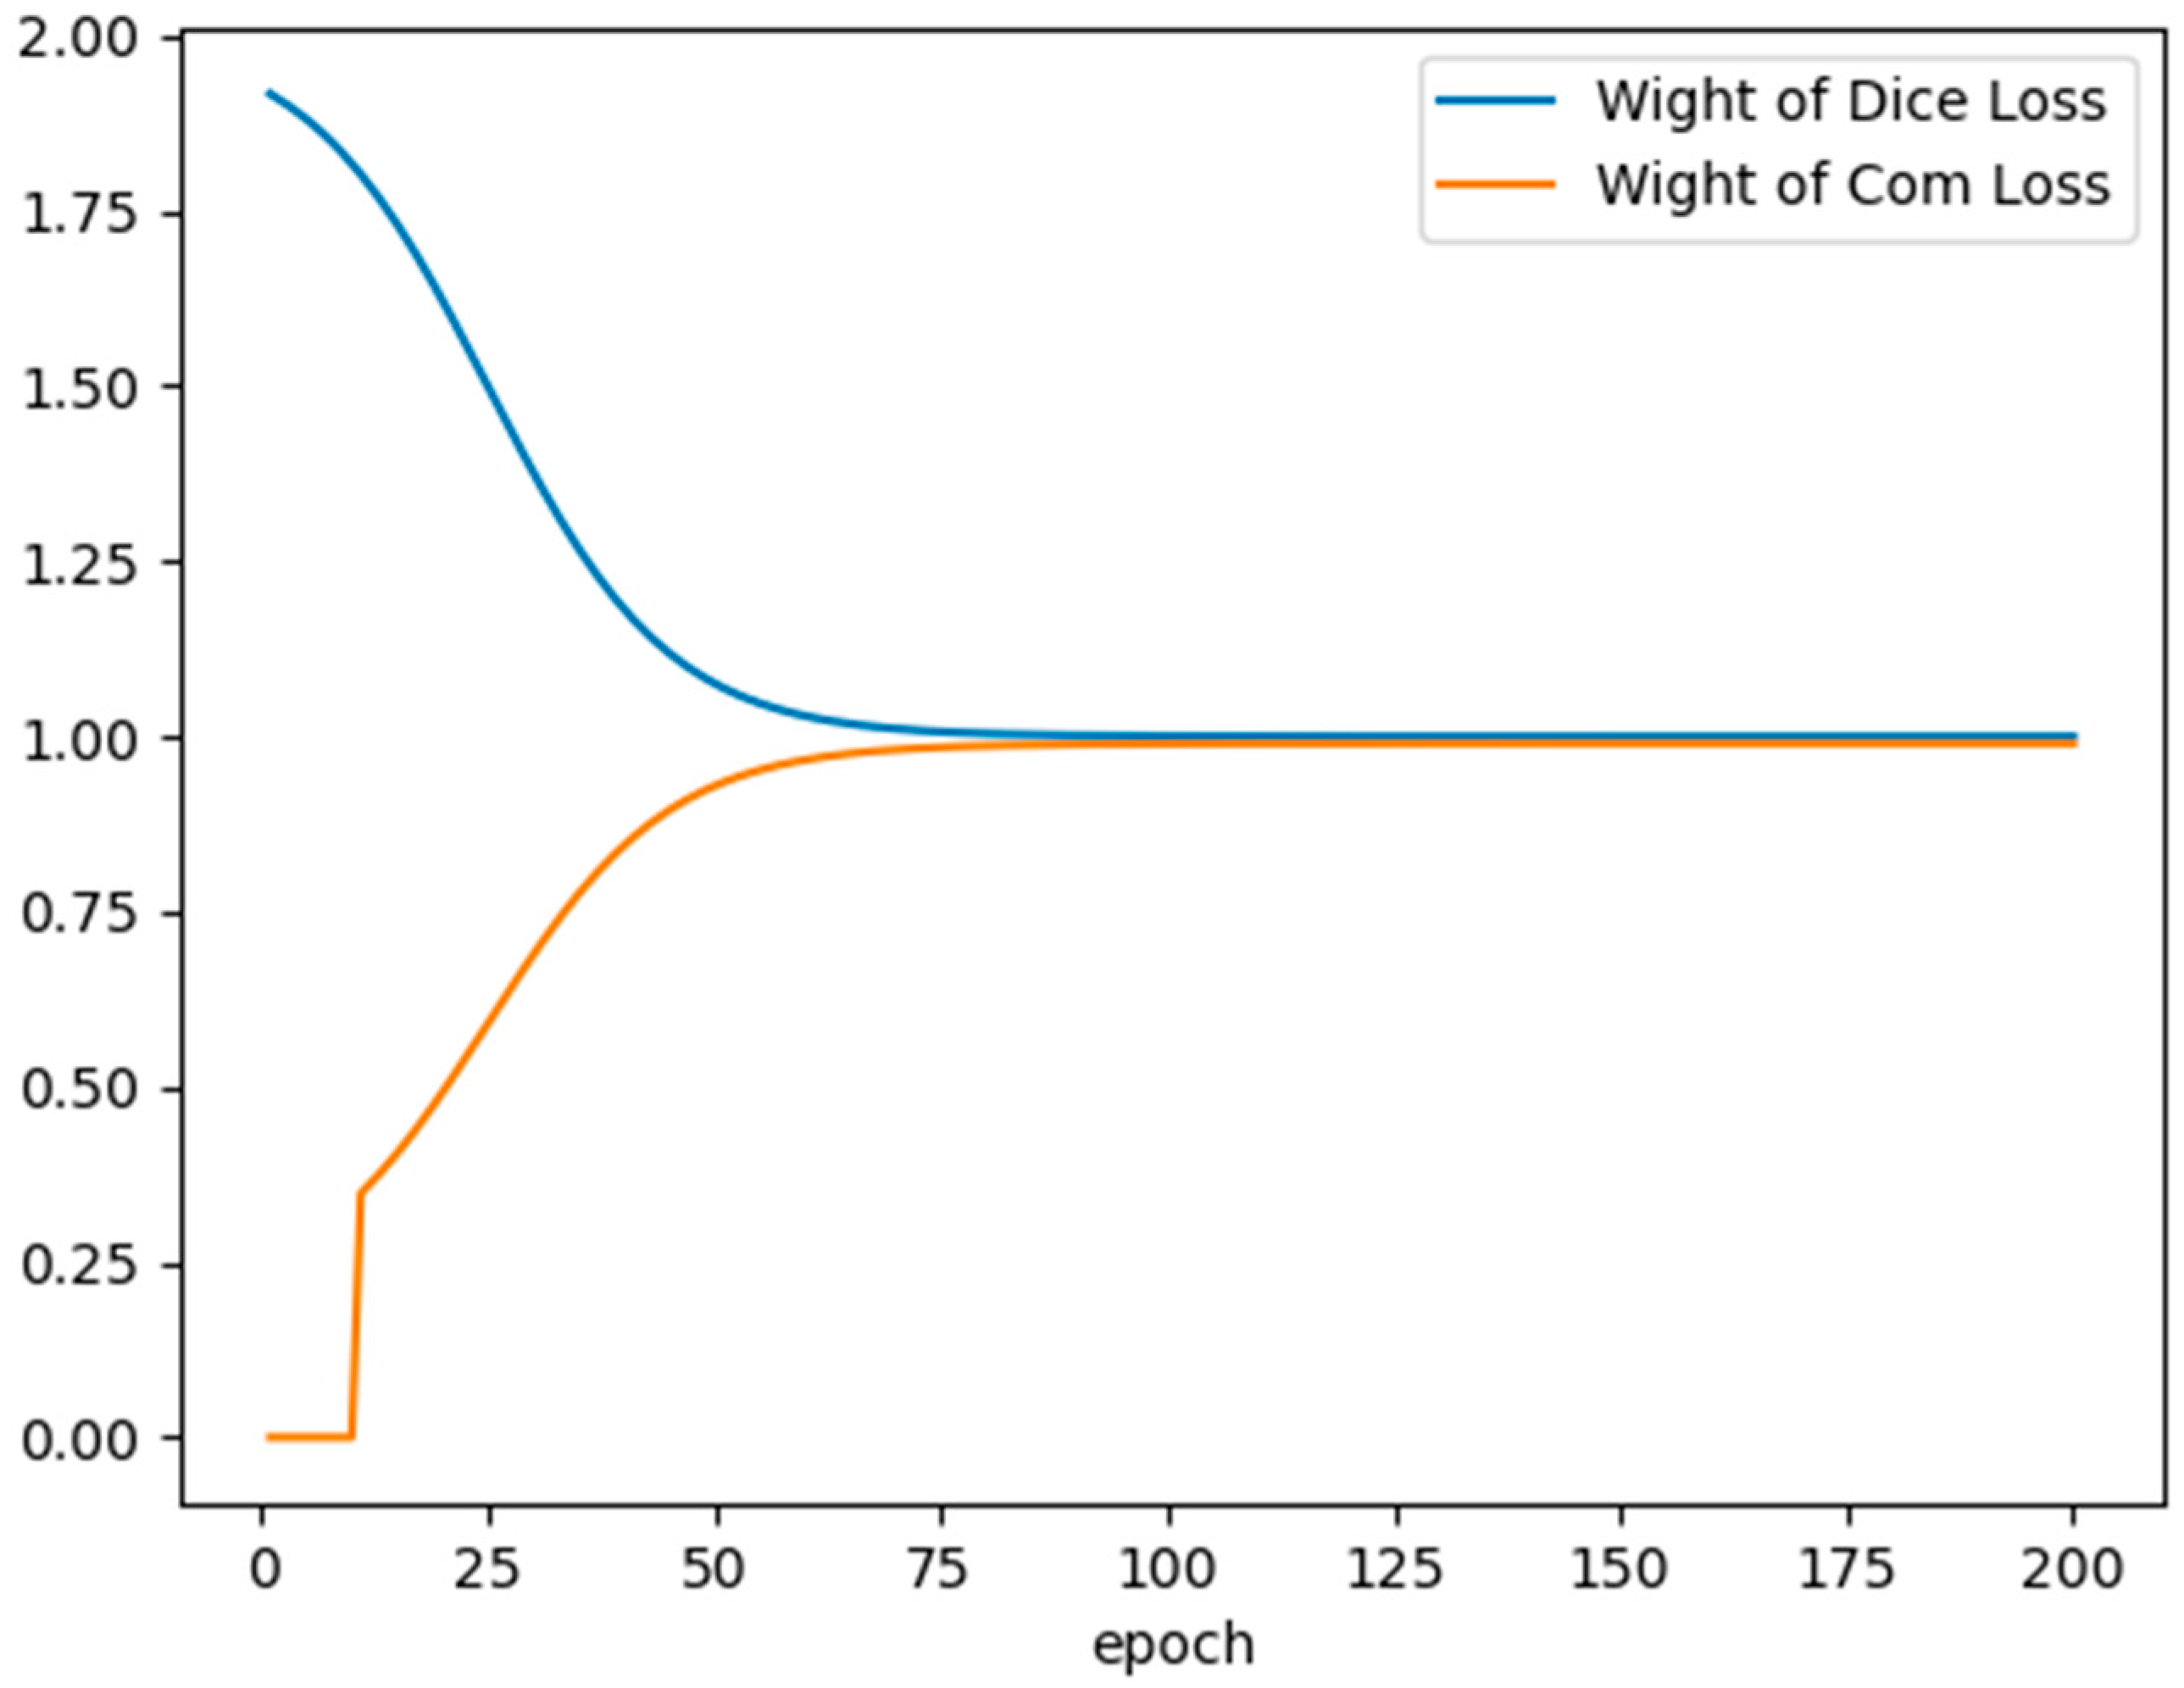
2.4. Loss Function
3. Results
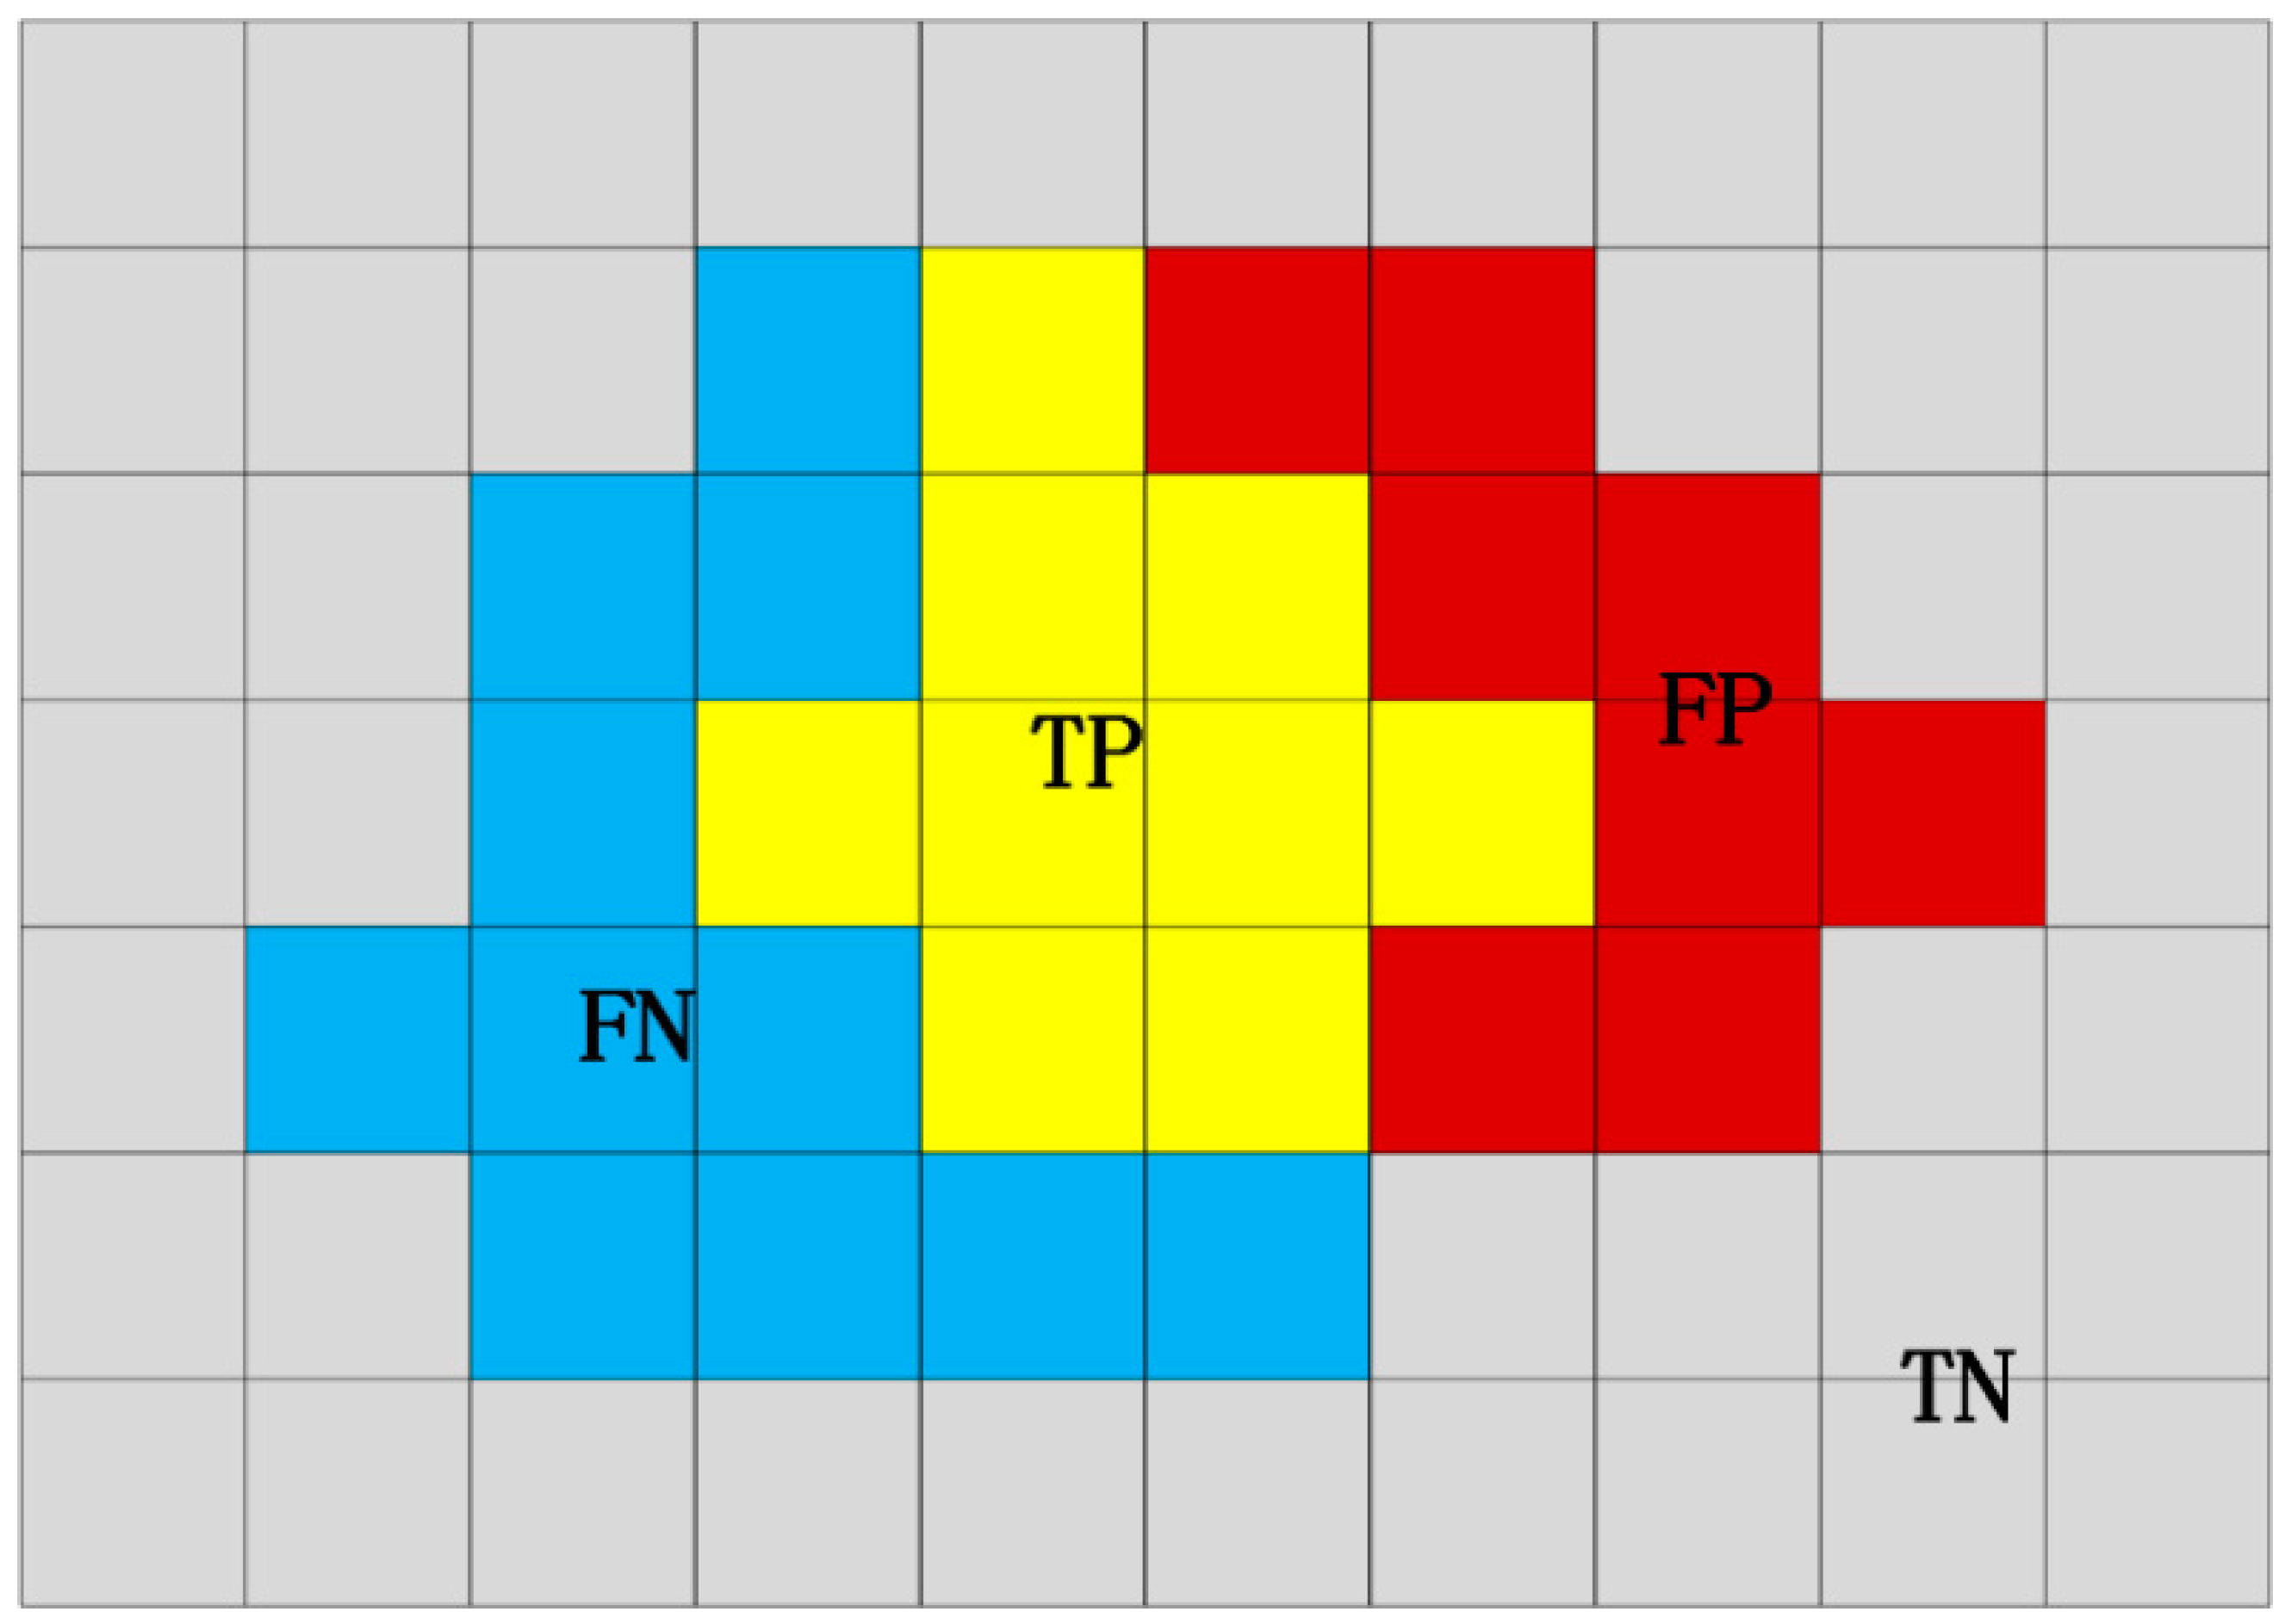
3.1. Evaluation Metrics
3.1.1. Semantic Segmentation Evaluation Metrics
3.1.2. Centroid Localization Evaluation Metrics
3.2. Experimental Results and Analysis
3.2.1. Experimental Setup
3.2.2. Comparison with Other State-of-the-Art Methods
- (1)
- Quantitative Analysis
- (2)
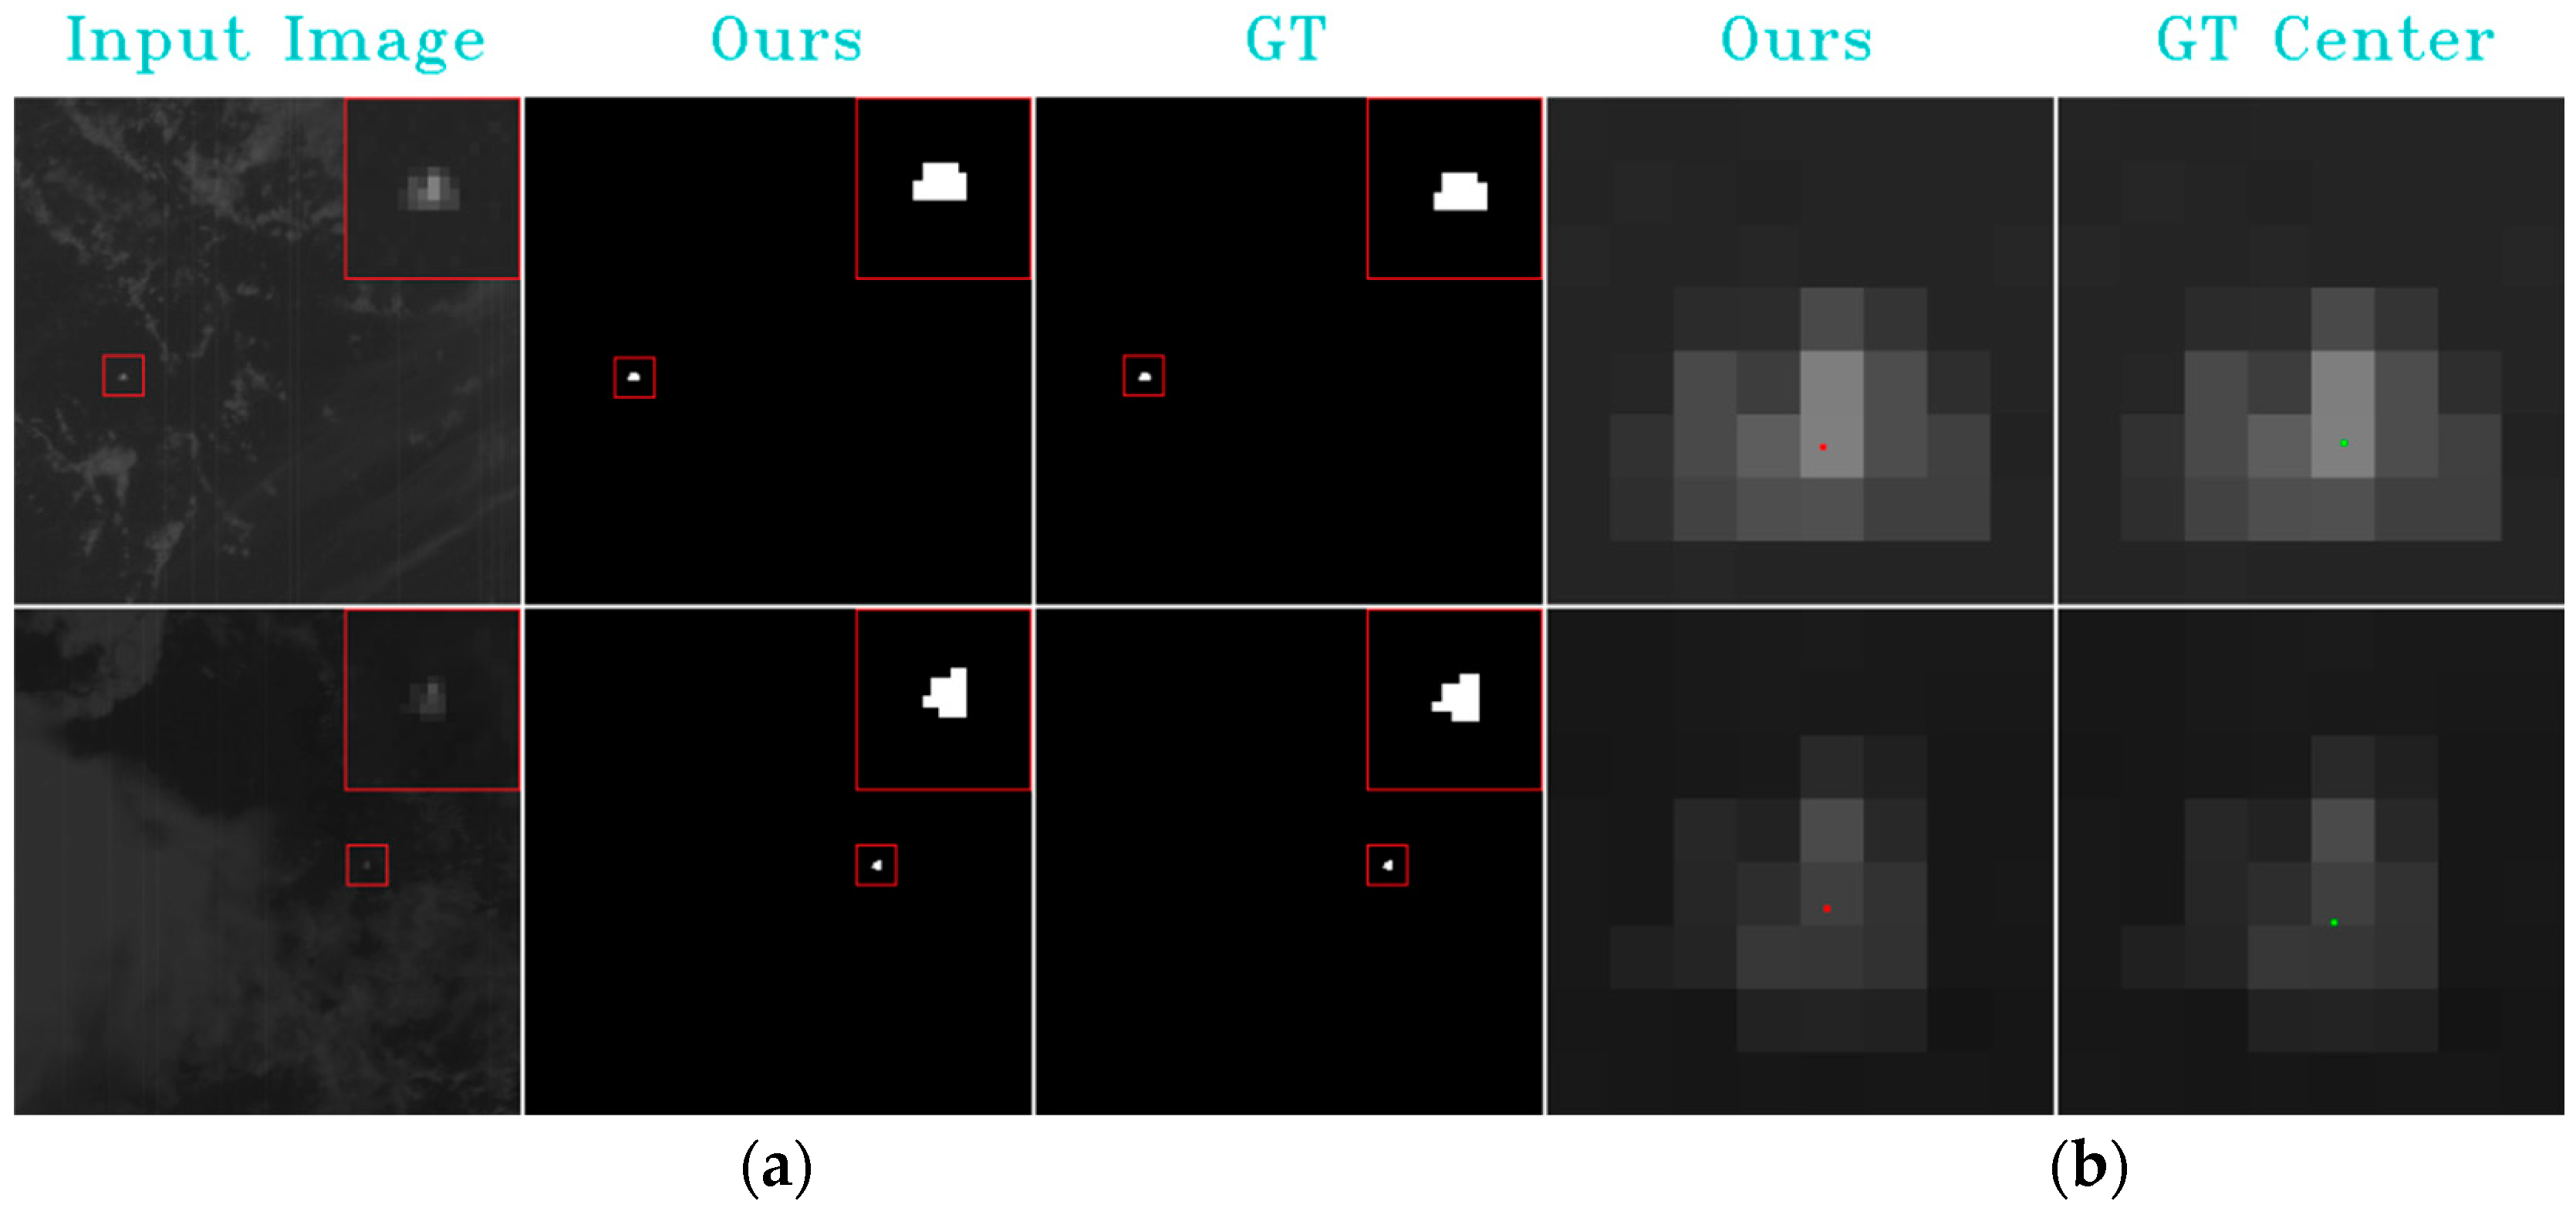
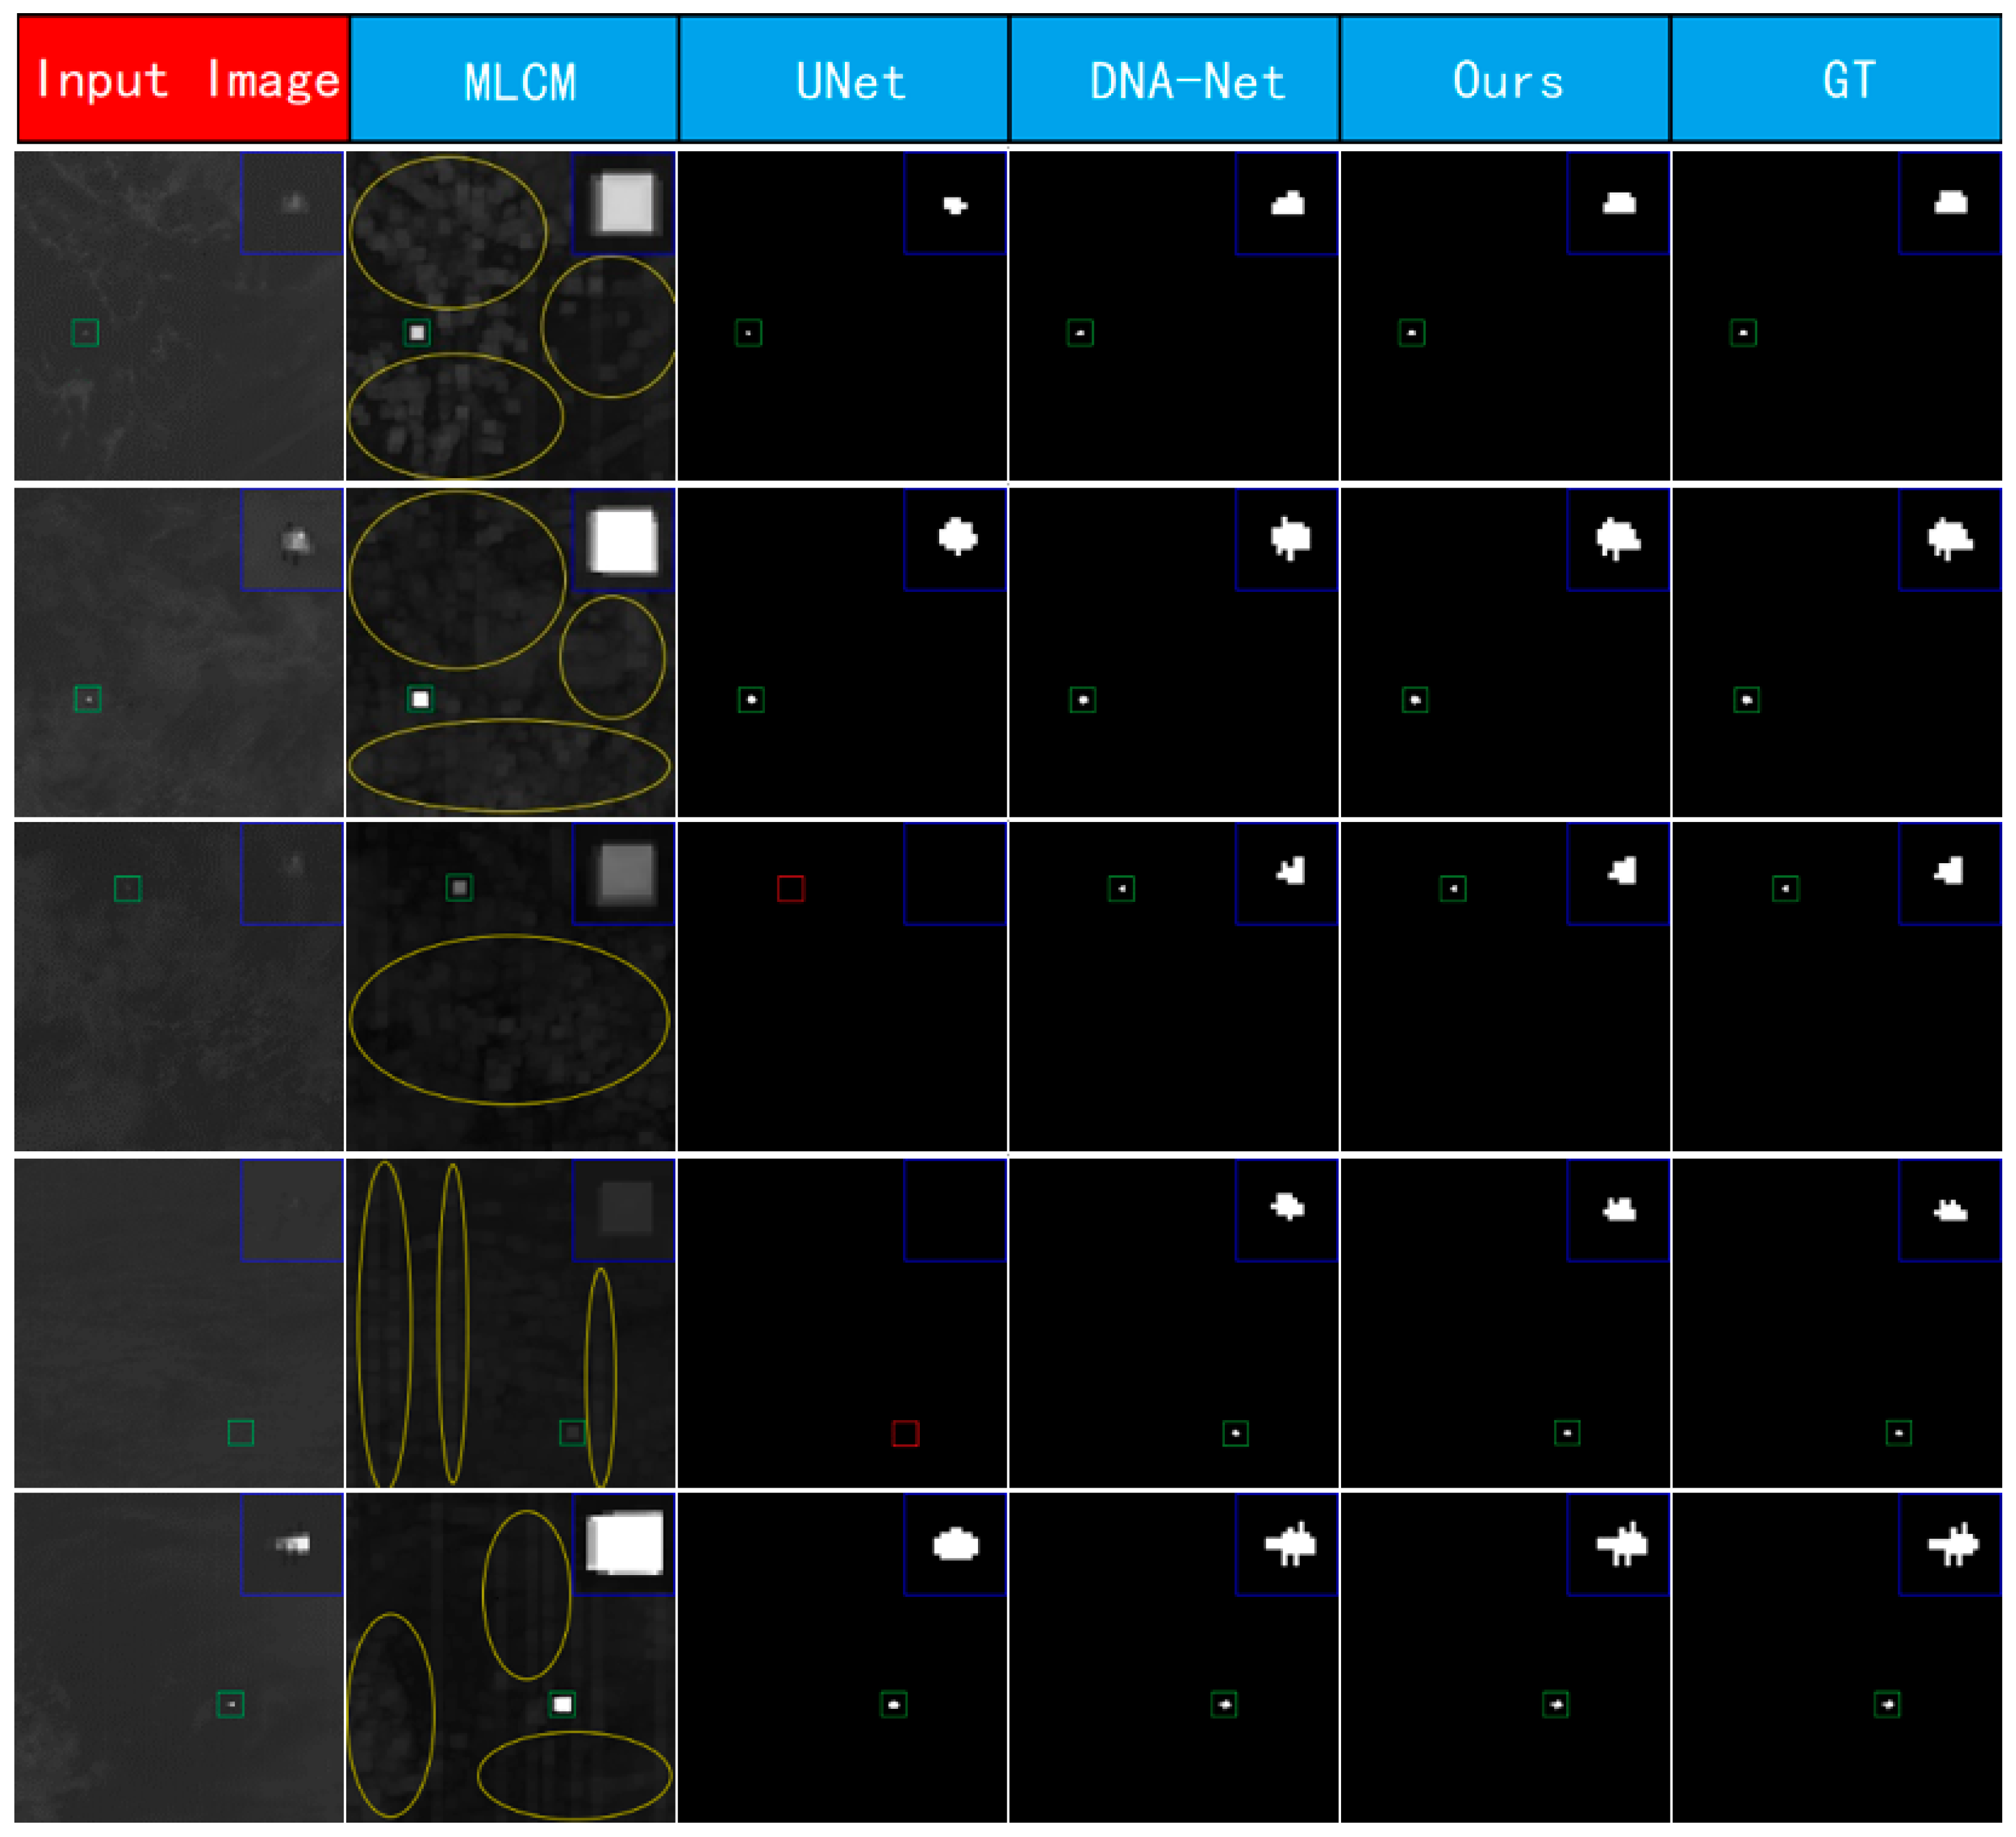
- Qualitative Analysis
3.2.3. Analysis of UCDnet Feature Extraction Network
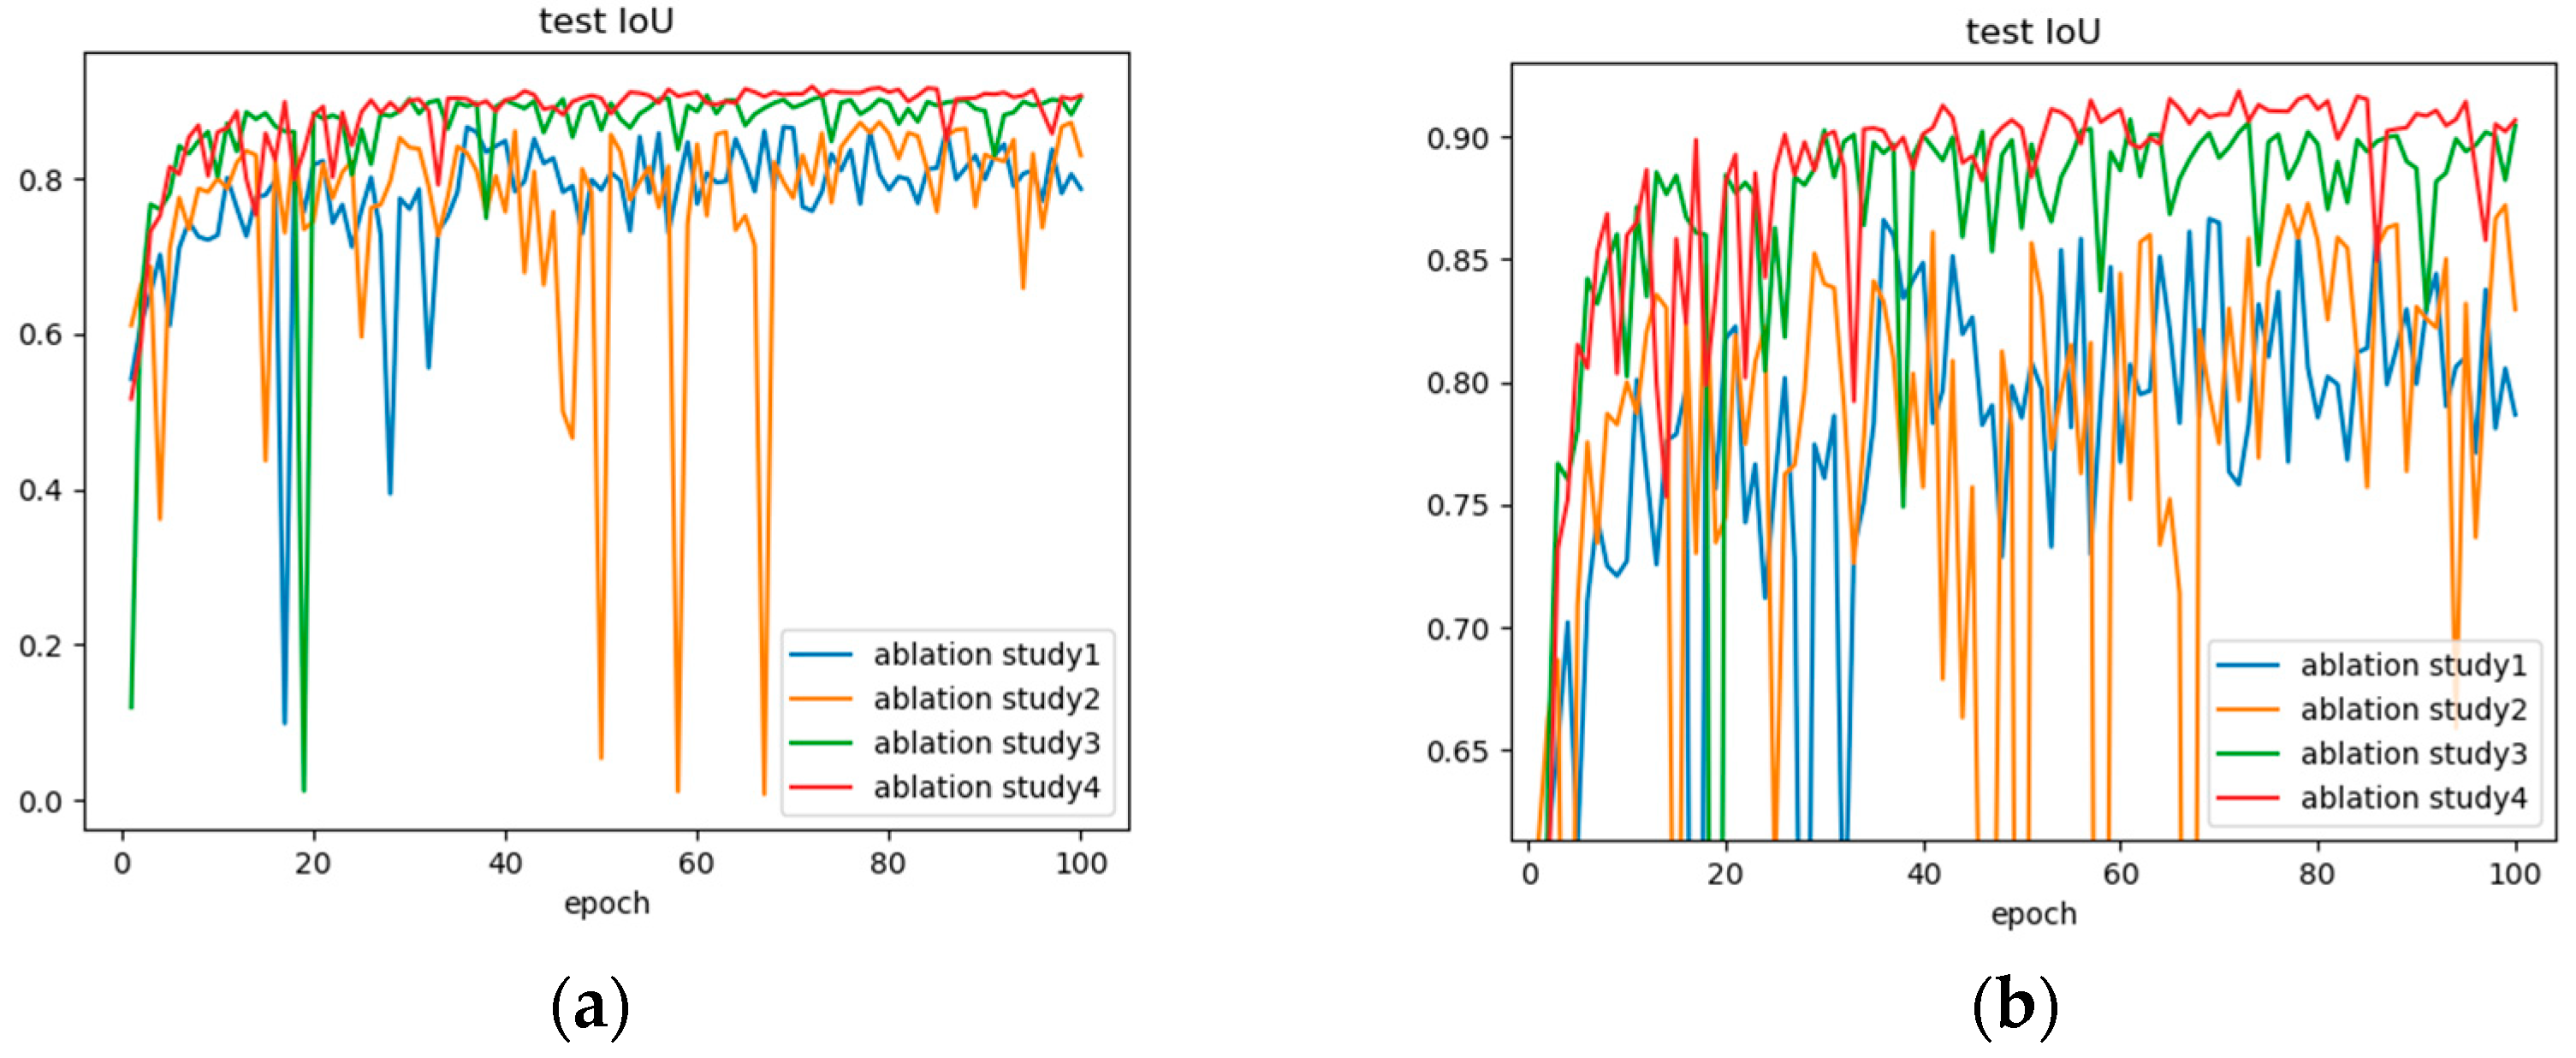
- (1)
- Quantitative Analysis
- (2)
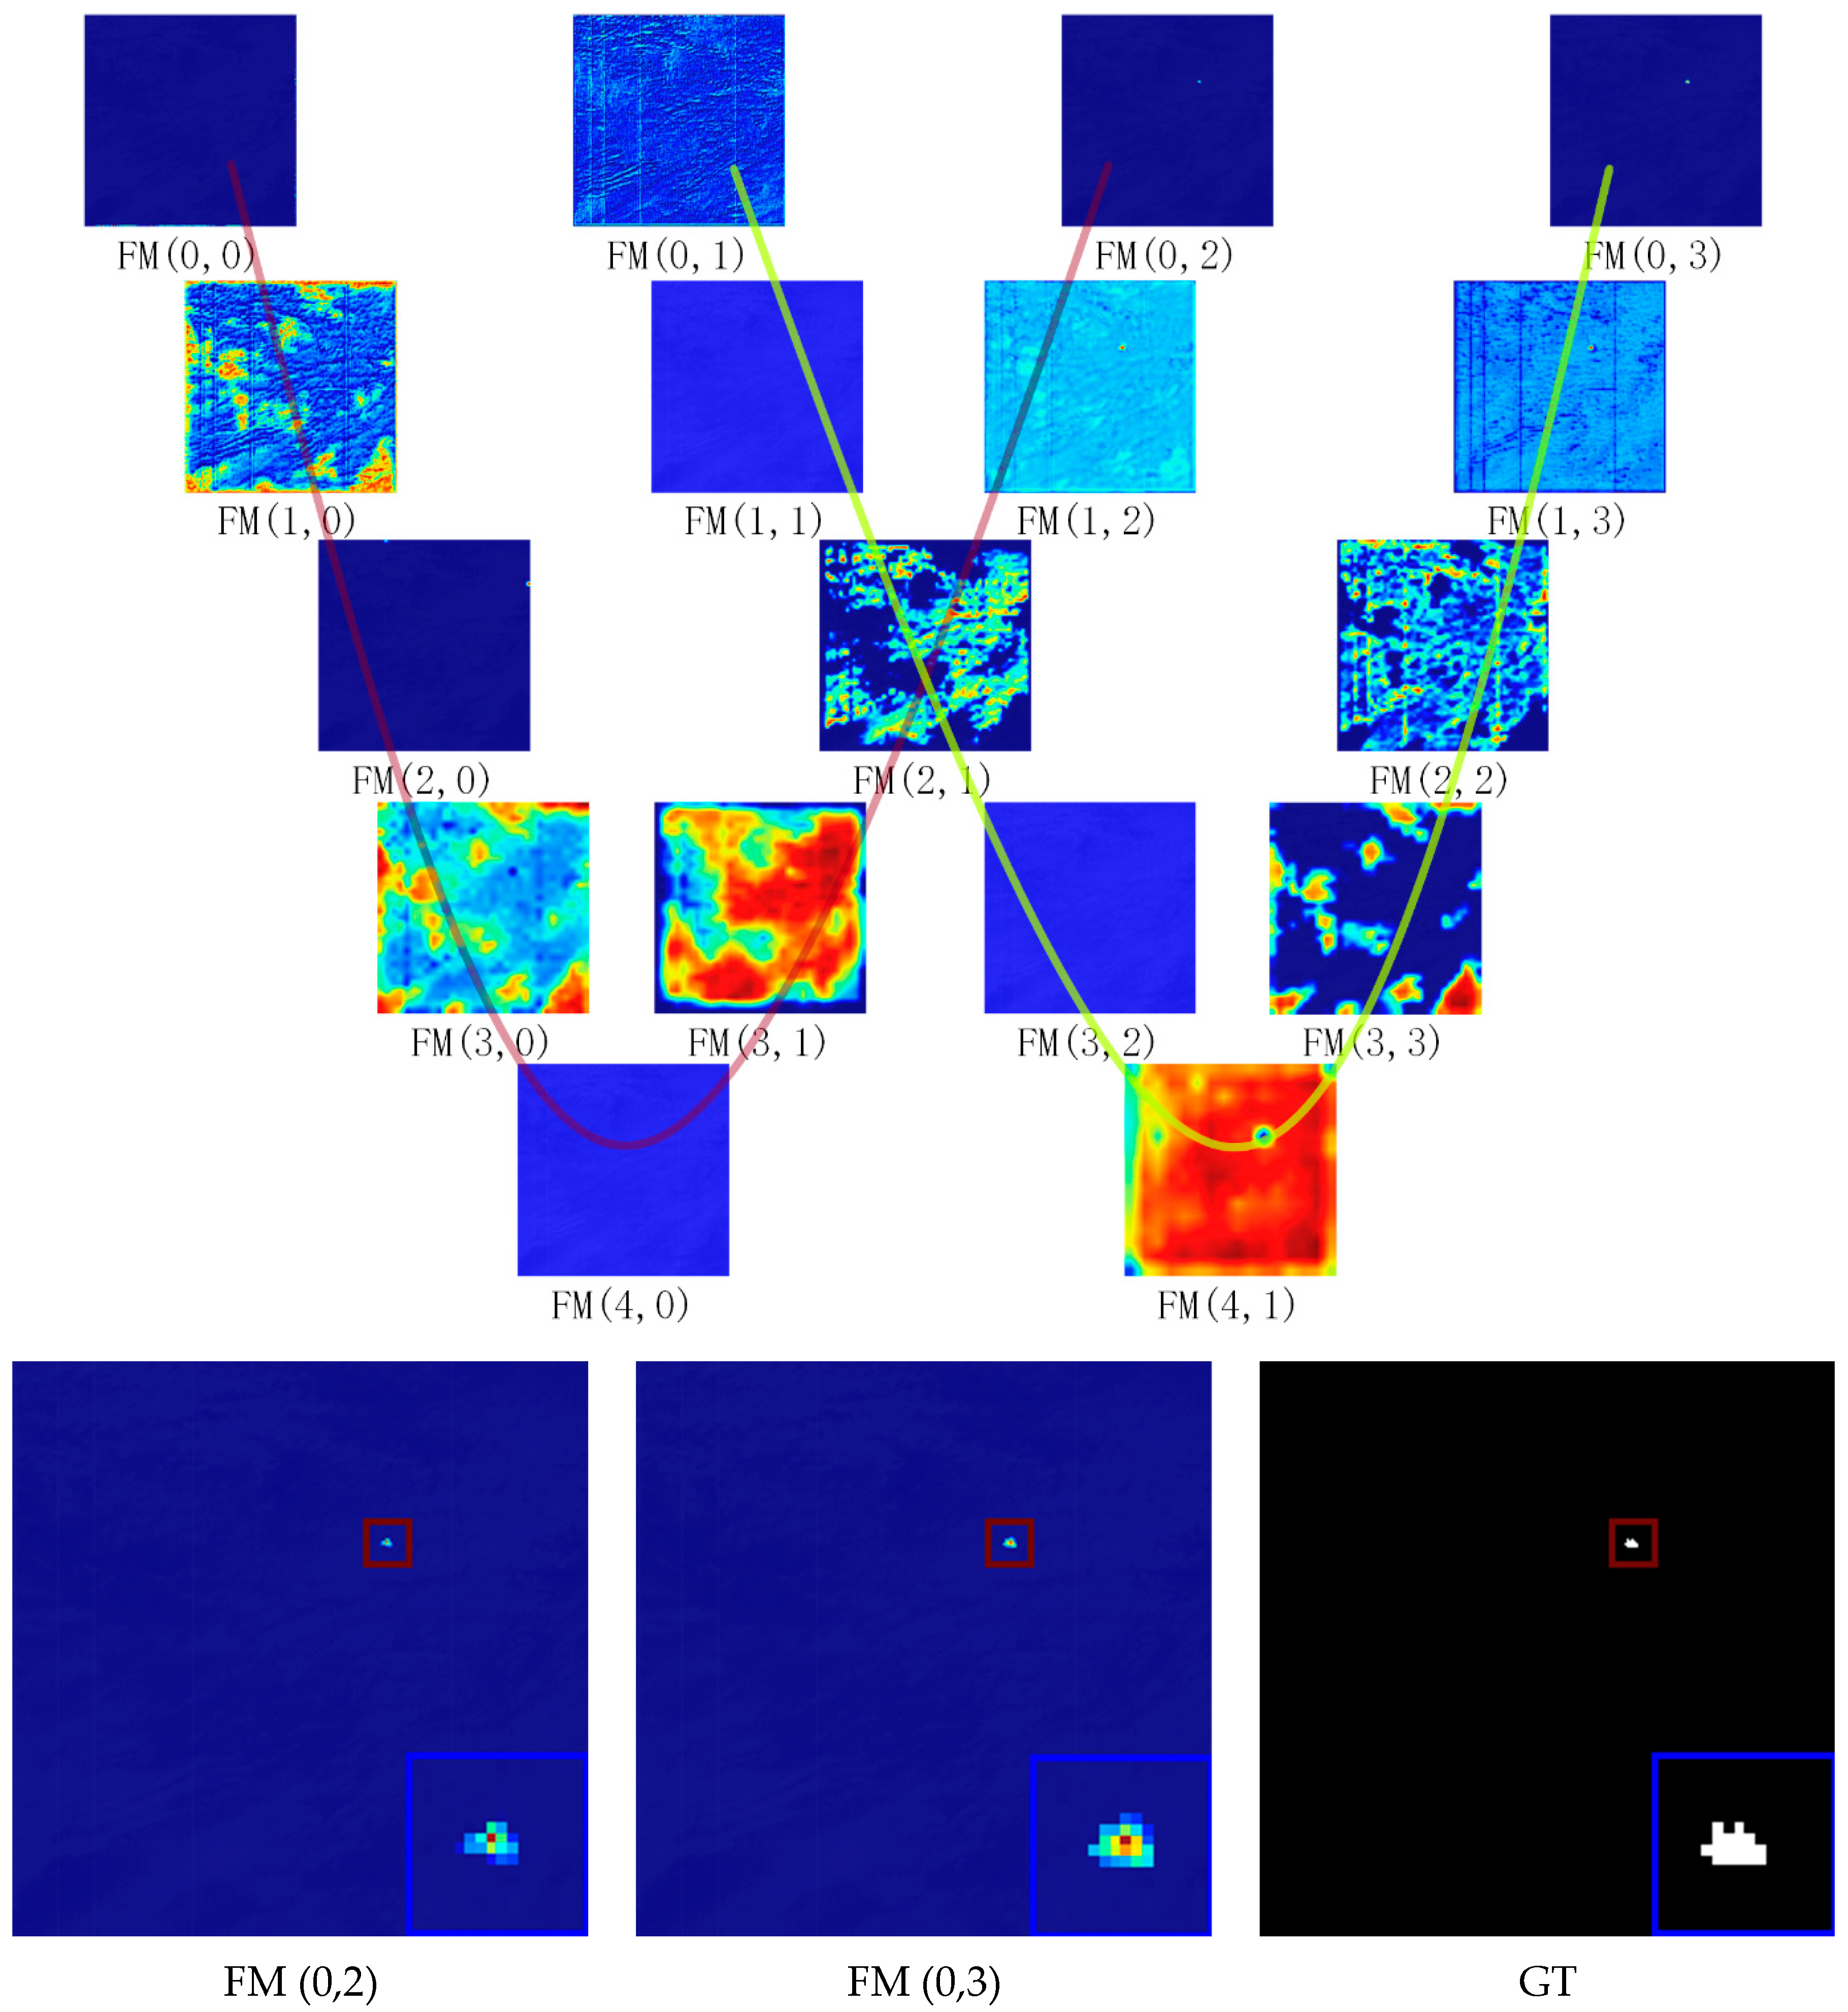
- Qualitative Analysis
3.2.4. Analysis of Centroid Localization Network
- (1)
- Quantitative Analysis
- (2)
- Qualitative Analysis
3.2.5. Discussion
4. Conclusions
Author Contributions
Funding
Conflicts of Interest
Appendix A
Appendix A.1. Simulation Details of Infrared Weak Small Target Dataset

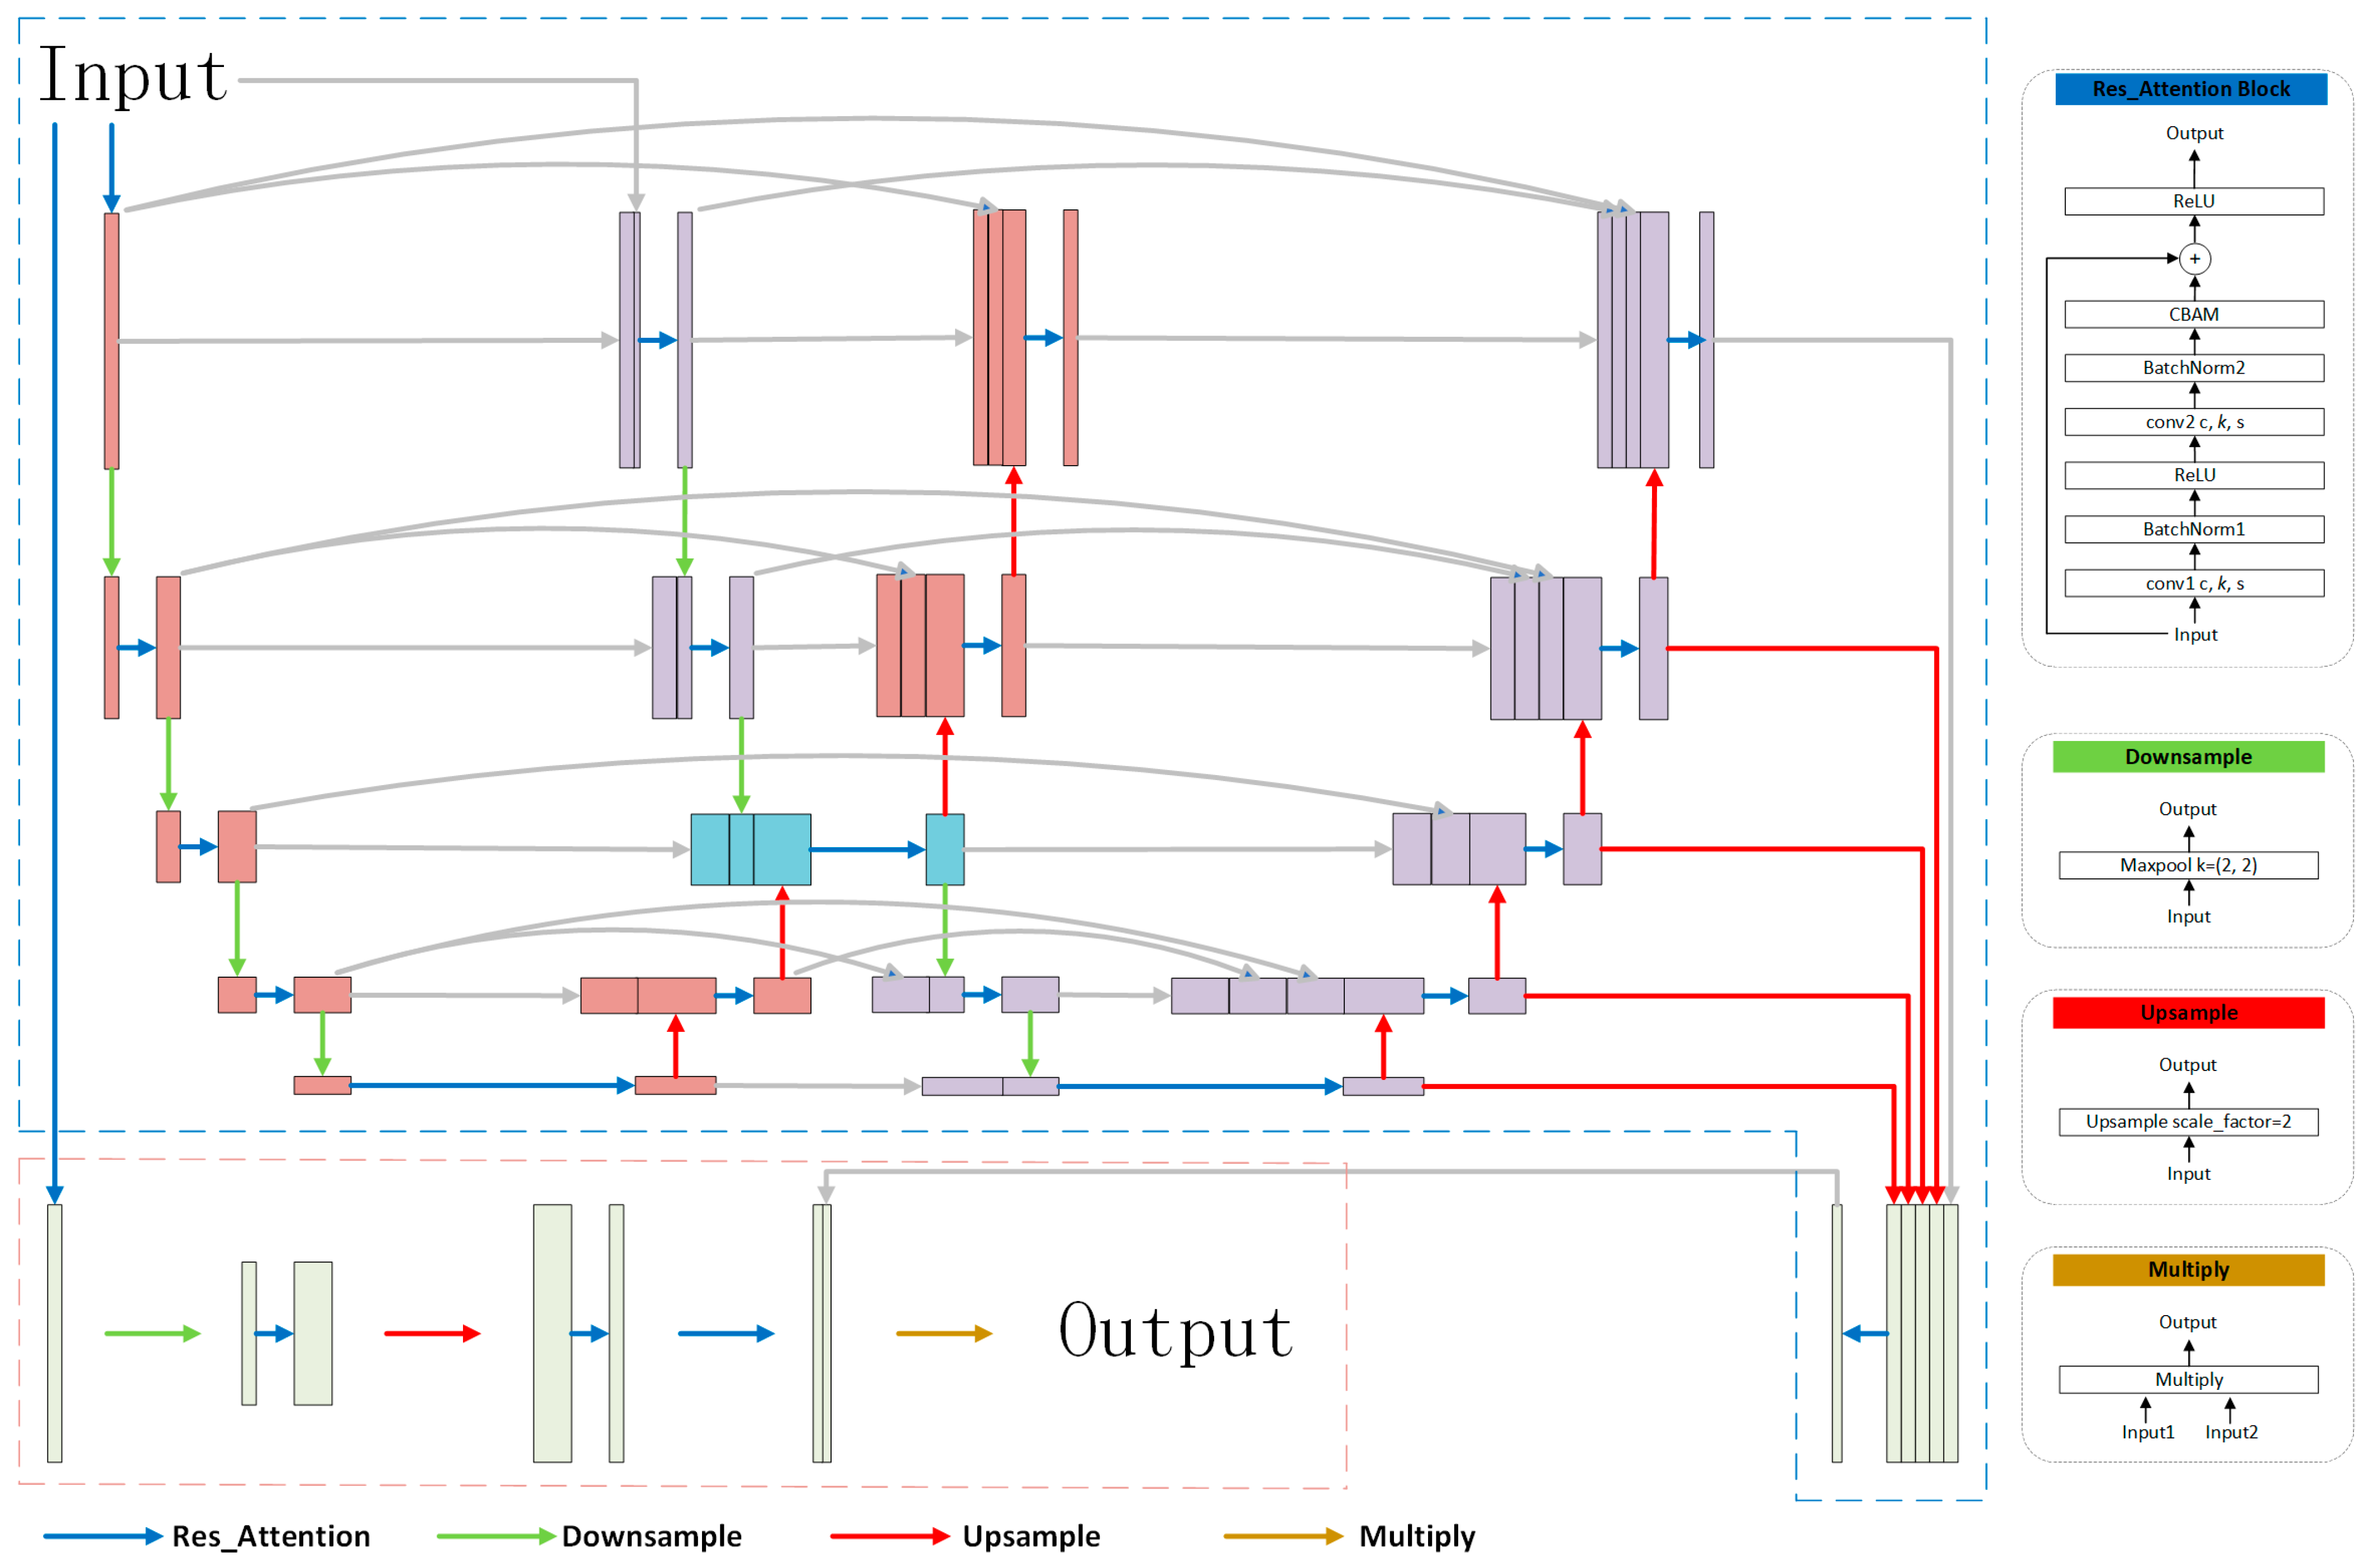
Appendix A.2. Details of Network Architectures

| Block | Layer | Input Channels | Output Channels | Kernel Size | Stride | Padding |
|---|---|---|---|---|---|---|
| Res_Attention | Conv2d | in_channels | out_channels | 3 | 1 | 1 |
| BatchNorm2d | out_channels | out_channels | - | - | - | |
| ReLU | - | - | - | - | - | |
| Conv2d | out_channels | out_channels | 3 | 1 | 1 | |
| BatchNorm2d | out_channels | out_channels | - | - | - | |
| CBAM | out_channels | out_channels | - | - | - | |
| ReLU | - | - | - | - | - | |
| Downsample | MaxPool2d | in_channels | in_channels | 2 | 2 | - |
| Upsample_n | Upsample | in_channels | in_channels | - | n | - |
| Multiply | - | 1, 1 | 1 | - | - | - |
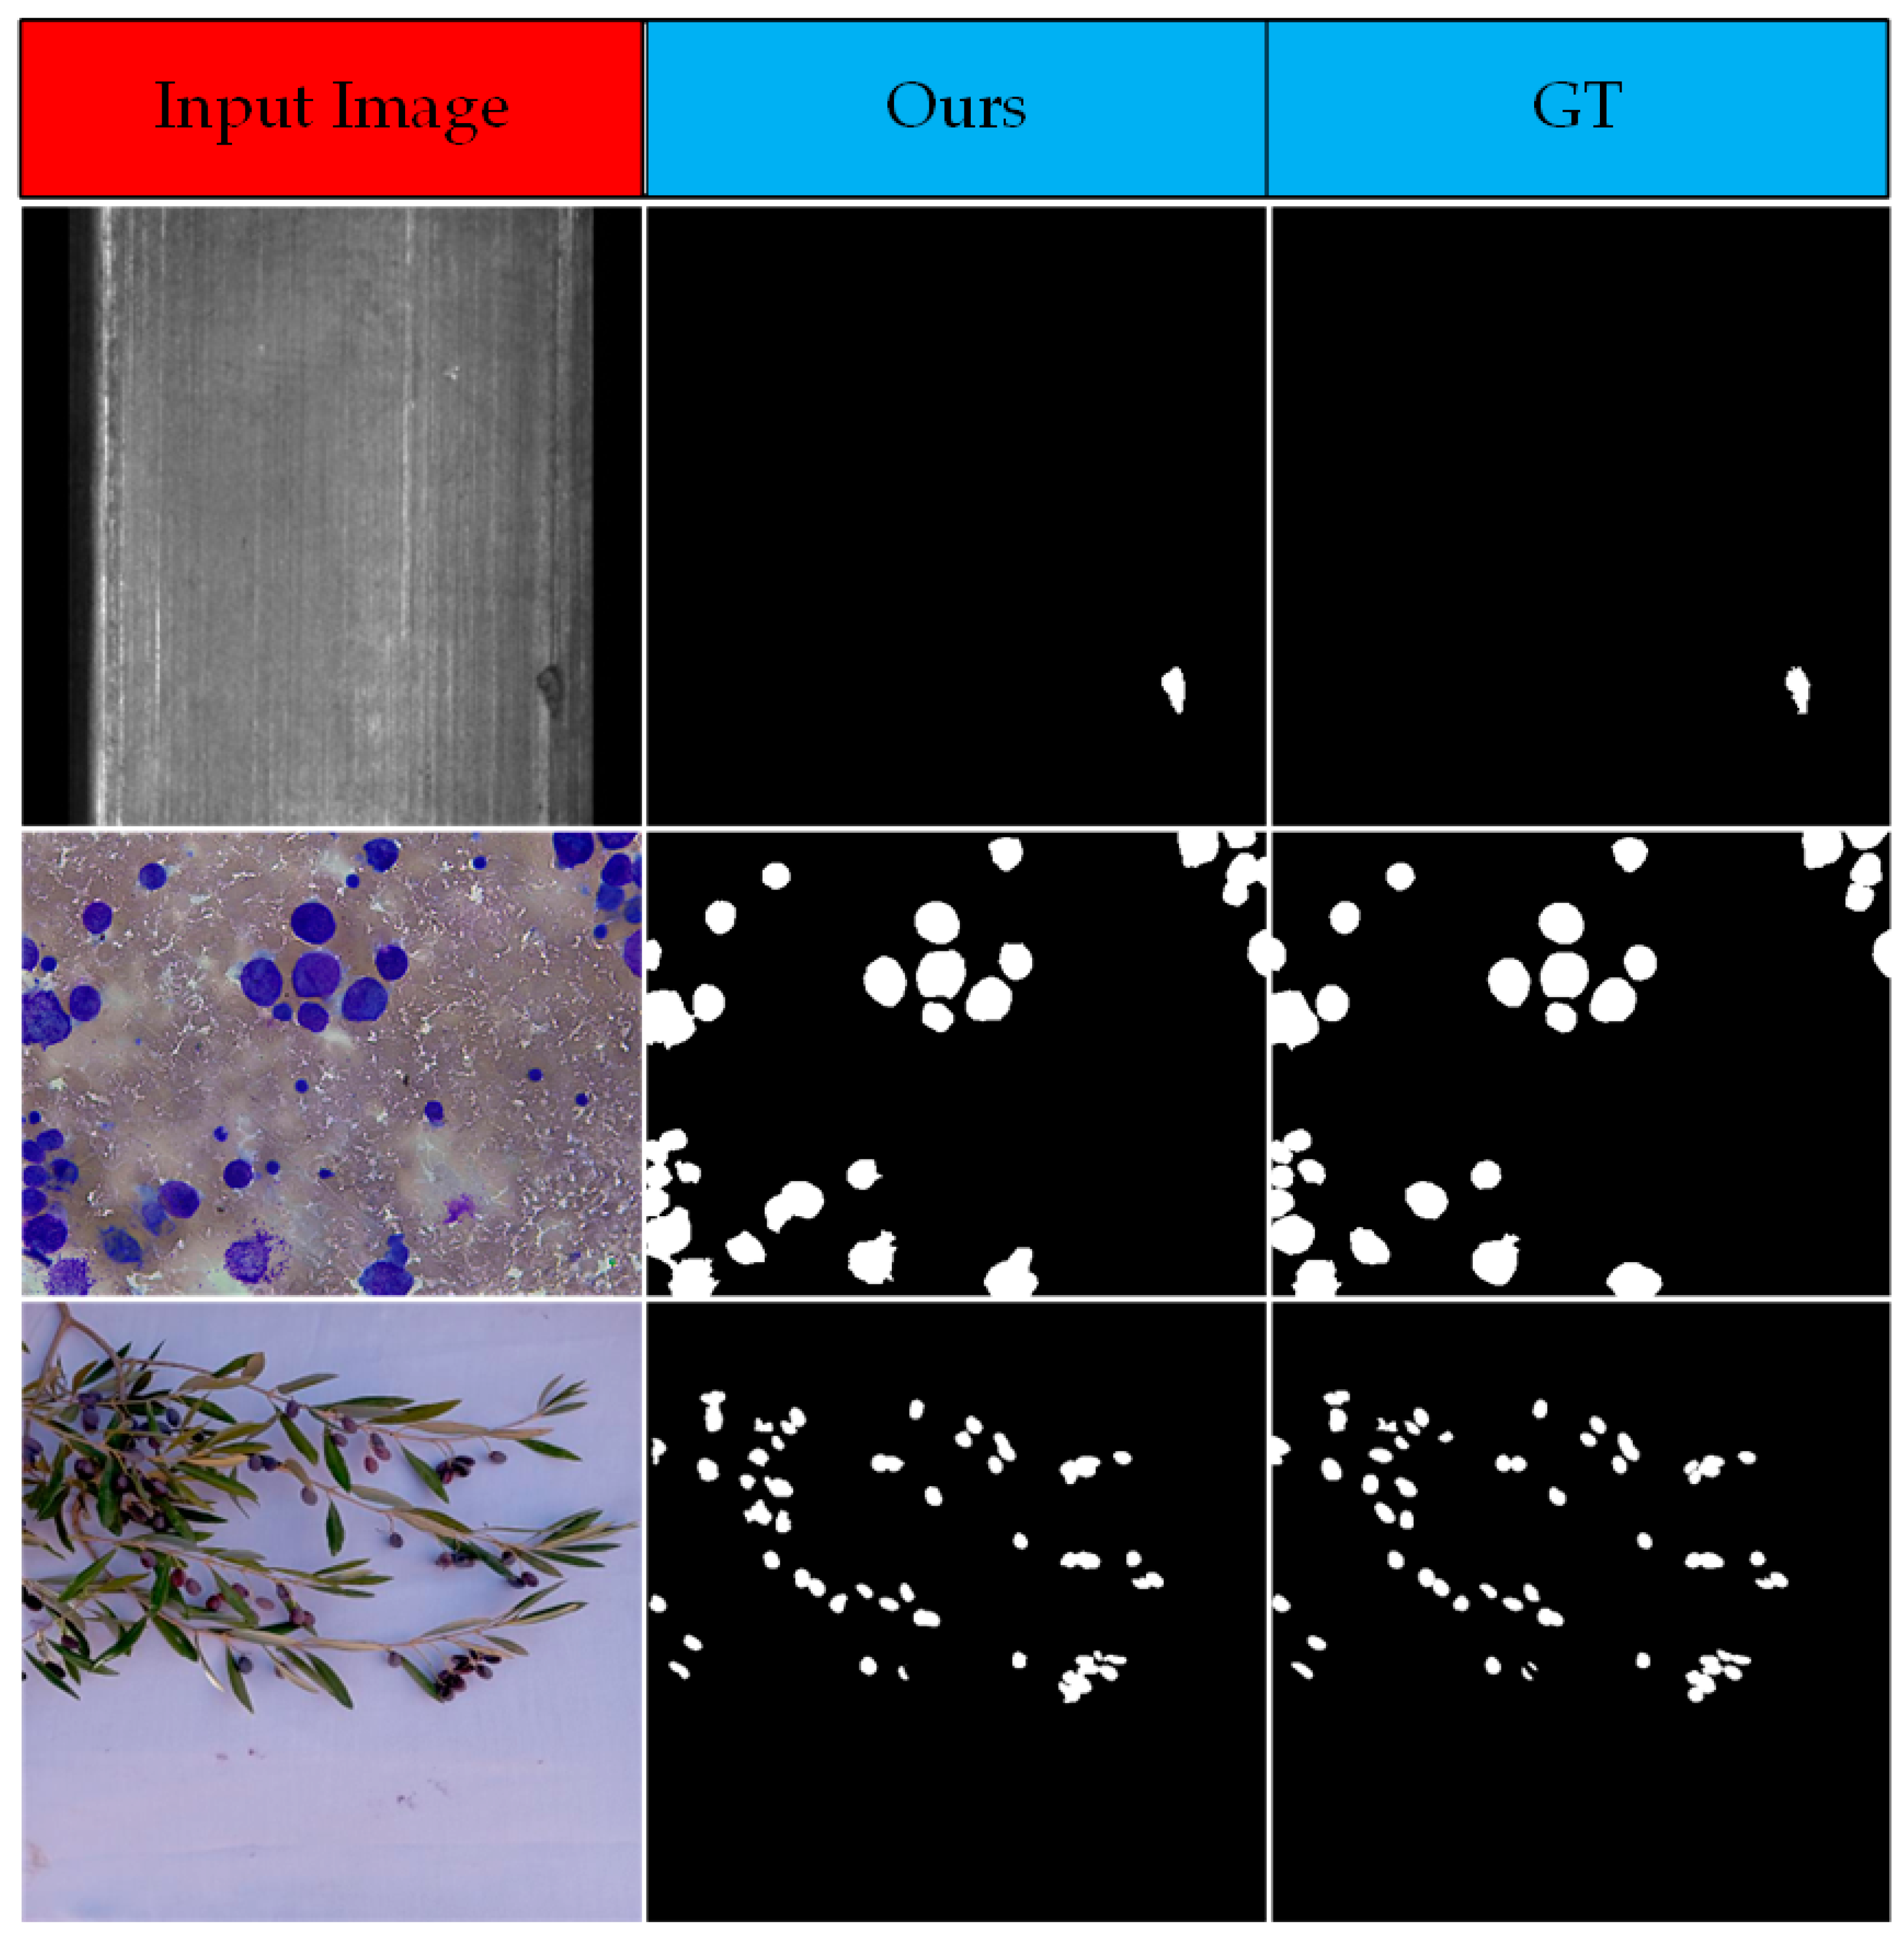
Appendix A.3. Experimental Results in Other Field

References
- Chen, G.; Wang, H.T.; Chen, K.; Li, Z.J.; Song, Z.D.; Liu, Y.L.; Chen, W.K.; Knoll, A. A Survey of the Four Pillars for Small Object Detection: Multiscale Representation, Contextual Information, Super-Resolution, and Region Proposal. IEEE Trans. Syst. Man Cybern.-Syst. 2022, 52, 936–953. [Google Scholar] [CrossRef]
- Sun, X.L.; Guo, L.C.; Zhang, W.L.; Wang, Z.; Yu, Q.F. Small Aerial Target Detection for Airborne Infrared Detection Systems Using LightGBM and Trajectory Constraints. IEEE J. Sel. Top. Appl. Earth Observ. Remote Sens. 2021, 14, 9959–9973. [Google Scholar] [CrossRef]
- Sun, Y.; Yang, J.G.; An, W. Infrared Dim and Small Target Detection via Multiple Subspace Learning and Spatial-Temporal Patch-Tensor Model. IEEE Trans. Geosci. Remote Sens. 2021, 59, 3737–3752. [Google Scholar] [CrossRef]
- Liu, C.; Xie, F.Y.; Dong, X.M.; Gao, H.X.; Zhang, H.P. Small Target Detection From Infrared Remote Sensing Images Using Local Adaptive Thresholding. IEEE J. Sel. Top. Appl. Earth Observ. Remote Sens. 2022, 15, 1941–1952. [Google Scholar] [CrossRef]
- Yu, W.B.; Liu, C.; Yang, H.T.; Wang, G.X. A method for improving the detection accuracy of subpixel edge. In Proceedings of the Chinese Automation Congress (CAC), Hangzhou, China, 22–24 November 2019; pp. 158–162. [Google Scholar]
- Kosari, A.; Sharifi, A.; Ahmadi, A.; Khoshsima, M. Remote sensing satellite’s attitude control system: Rapid performance sizing for passive scan imaging mode. Aircr. Eng. Aerosp. Technol. 2020, 92, 1073–1083. [Google Scholar] [CrossRef]
- Li, Y.S.; Li, Z.Z.; Zhang, C.; Luo, Z.F.; Zhu, Y.; Ding, Z.Q.; Qin, T.Q. Infrared maritime dim small target detection based on spatiotemporal cues and directional morphological filtering. Infrared Phys. Technol. 2021, 115, 19. [Google Scholar] [CrossRef]
- Li, Y.S.; Li, Z.Z.; Shen, Y.; Li, J. Infrared Small Target Detection Based on 1-D Difference of Guided Filtering. IEEE Geosci. Remote Sens. Lett. 2023, 20, 5. [Google Scholar] [CrossRef]
- Zhang, L.; Lin, Z. Infrared Small Target Detection Based on Anisotropic Contrast Filter. In Proceedings of the 2020 IEEE 5th International Conference on Signal and Image Processing (ICSIP), Nanjing, China, 23–25 October 2020. [Google Scholar]
- Han, J.H.; Ma, Y.; Huang, J.; Mei, X.G.; Ma, J.Y. An Infrared Small Target Detecting Algorithm Based on Human Visual System. IEEE Geosci. Remote Sens. Lett. 2016, 13, 452–456. [Google Scholar] [CrossRef]
- Yang, L.N.; Jia, B.; Liu, Q. Adaptive Small Target Detection Based on Least Squares and Human Visual System. In Proceedings of the IEEE 17th International Conference on Communication Technology (ICCT), Chengdu, China, 27–30 October 2017; pp. 1565–1568. [Google Scholar]
- Qiang, W.; Liu, H.K. An Infrared Small Target Fast Detection Algorithm in the Sky Based on Human Visual System. In Proceedings of the 4th Annual International Conference on Network and Information Systems for Computers (ICNISC), Wuhan, China, 20–22 April 2018; pp. 176–181. [Google Scholar]
- Faramarzi, I.; Han, J.H.; Chen, Y.Y. Infrared Dim and Small Targets Detection Based on Multi-scale Local Contrast Measure Utilizing Efficient Spatial Filters. In Proceedings of the 6th International Conference on Signal Processing and Intelligent Systems (ICSPIS), Sadjad Univ, Mashhad, Iran, 23–24 December 2020. [Google Scholar]
- Han, J.H.; Moradi, S.; Faramarzi, I.; Liu, C.Y.; Zhang, H.H.; Zhao, Q. A Local Contrast Method for Infrared Small-Target Detection Utilizing a Tri-Layer Window. IEEE Geosci. Remote Sens. Lett. 2020, 17, 1822–1826. [Google Scholar] [CrossRef]
- He, Y.J.; Li, M.; Zhang, J.L.; An, Q. Small infrared target detection based on low-rank and sparse representation. Infrared Phys. Technol. 2015, 68, 98–109. [Google Scholar] [CrossRef]
- Wei, H.Y.; Tan, Y.H.; Lin, J. Robust Infrared Small Target Detection Via Temporal Low-rank and Sparse Representation. In Proceedings of the 3rd International Conference on Information Science and Control Engineering (ICISCE), Beijing, China, 8–10 July 2016; pp. 583–587. [Google Scholar]
- Liu, M.; Du, H.Y.; Zhao, Y.J.; Dong, L.Q.; Hui, M. Image Small Target Detection based on Deep Learning with SNR Controlled Sample Generation. In Proceedings of the 2nd International Conference on Computer Science and Mechanical Automation (CSMA), Wuhan, China, 10–12 November 2016; pp. 211–220. [Google Scholar]
- Dai, Y.M.; Wu, Y.Q.; Zhou, F.; Barnard, K. Asymmetric Contextual Modulation for Infrared Small Target Detection. In Proceedings of the IEEE Winter Conference on Applications of Computer Vision (WACV), Electr Network, Waikoloa, HI, USA, 5–9 January 2021; pp. 949–958. [Google Scholar]
- Hou, Q.Y.; Wang, Z.P.; Tan, F.J.; Zhao, Y.; Zheng, H.L.; Zhang, W. RISTDnet: Robust Infrared Small Target Detection Network. IEEE Geosci. Remote Sens. Lett. 2022, 19, 5. [Google Scholar] [CrossRef]
- Zhou, X.Y.; Zhang, Y.; Hu, Y. Infrared Small Target Detection Via Learned Infrared Patch-Image Convolutional Network. In Proceedings of the IEEE International Geoscience and Remote Sensing Symposium (IGARSS), Kuala Lumpur, Malaysia, 17–22 July 2022; pp. 867–870. [Google Scholar]
- Zhao, B.; Wang, C.P.; Fu, Q.; Han, Z.S. A Novel Pattern for Infrared Small Target Detection With Generative Adversarial Network. IEEE Trans. Geosci. Remote Sens. 2021, 59, 4481–4492. [Google Scholar] [CrossRef]
- Cao, S.Y.; Lian, R.Y.; Zhang, Y.W.; Wu, F.Y.; Peng, Z.M. Infrared dim target detection via hand-crafted features and deep information combination. In Proceedings of the 17th Conference on Industrial Electronics and Applications (ICIEA), Chengdu, China, 16–19 December 2022; pp. 632–635. [Google Scholar]
- Ronneberger, O.; Fischer, P.; Brox, T. U-Net: Convolutional Networks for Biomedical Image Segmentation. In Proceedings of the 18th International Conference on Medical Image Computing and Computer-Assisted Intervention (MICCAI), Munich, Germany, 5–9 October 2015; pp. 234–241. [Google Scholar]
- Li, B.Y.; Xiao, C.; Wang, L.G.; Wang, Y.Q.; Lin, Z.P.; Li, M.; An, W.; Guo, Y.L. Dense Nested Attention Network for Infrared Small Target Detection. IEEE Trans. Image Process. 2023, 32, 1745–1758. [Google Scholar] [CrossRef] [PubMed]
- Hu, H.G.; Zheng, Y.X.; Zhou, Q.W.; Xiao, J.; Chen, S.Y.; Guan, Q. MC-Unet: Multi-scale Convolution Unet for Bladder Cancer Cell Segmentation in Phase-Contrast Microscopy Images. In Proceedings of the IEEE International Conference on Bioinformatics and Biomedicine (BIBM), San Diego, CA, USA, 18–21 November 2019; pp. 1197–1199. [Google Scholar]
- Zhao, Z.; Chen, K.; Yamane, S. CBAM-Unet++:easier to find the target with the attention module “CBAM”. In Proceedings of the 2021 IEEE 10th Global Conference on Consumer Electronics (GCCE), Las Vegas, NY, USA, 12 October 2021. [Google Scholar]
- Zhou, X.; Wang, D.; Krähenbühl, P. Objects as Points. arXiv 2019, arXiv:1904.07850. [Google Scholar]
- Oakley, J.P. Statistical properties of local extrema in two-dimensional Gaussian random fields. IEEE Trans. Signal Process. 1998, 46, 130–140. [Google Scholar] [CrossRef]
- Fang, J.K.; Fong, C.M.; Yang, P.; Hung, C.K.; Lu, W.L.; Chang, C.W. AdaGrad Gradient Descent Method for AI Image Management. In Proceedings of the 7th IEEE International Conference on Consumer Electronics—Taiwan (ICCE-Taiwan), Taoyuan, Taiwan, 28–30 September 2020. [Google Scholar]
- Heydarian, M.; Doyle, T.E.; Samavi, R. MLCM: Multi-Label Confusion Matrix. IEEE Access 2022, 10, 19083–19095. [Google Scholar] [CrossRef]
- Sun, K.; Xiao, B.; Liu, D.; Wang, J.D.; Soc, I.C. Deep High-Resolution Representation Learning for Human Pose Estimation. In Proceedings of the 32nd IEEE/CVF Conference on Computer Vision and Pattern Recognition (CVPR), Long Beach, CA, USA, 16–20 June 2019; pp. 5686–5696. [Google Scholar]
- Wu, T.H.; Li, B.Y.; Luo, Y.H.; Wang, Y.Q.; Xiao, C.; Liu, T.; Yang, J.G.; An, W.; Guo, Y.L. MTU-Net: Multilevel TransUNet for Space-Based Infrared Tiny Ship Detection. IEEE Trans. Geosci. Remote Sens. 2023, 61, 15. [Google Scholar] [CrossRef]
- Cui, Z.M.; Li, C.J.; Chen, N.L.; Wei, G.D.; Chen, R.N.; Zhou, Y.F.; Shen, D.G.; Wang, W.P. TSegNet: An efficient and accurate tooth segmentation network on 3D dental model. Med. Image Anal. 2021, 69, 12. [Google Scholar] [CrossRef] [PubMed]
- Hossain, M.S. Microc alcification Segmentation Using Modified U-net Segmentation Network from Mammogram Images. J. King Saud Univ.-Comput. Inf. Sci. 2020, 32, 1225–1226. [Google Scholar] [CrossRef]
- Ghaderizadeh, S.; Abbasi-Moghadam, D.; Sharifi, A.; Tariq, A.; Qin, S.J. Multiscale Dual-Branch Residual Spectral-Spatial Network With Attention for Hyperspectral Image Classification. IEEE J. Sel. Top. Appl. Earth Observ. Remote Sens. 2022, 15, 5455–5467. [Google Scholar] [CrossRef]


| Semantic Segmentation Algorithm | IoU | Precision | Recall | F1-Score | GFLOPs |
|---|---|---|---|---|---|
| MLCM [30] | 0.1810 | 0.1810 | 1.0000 | 0.3065 | - |
| U-Net [23] | 0.4905 | 0.6435 | 0.5774 | 0.6087 | 46.02 |
| HRNetv2-w18 [31] | 0.7216 | 0.8307 | 0.8443 | 0.8374 | 4.64 |
| MTU-Net [32] | 0.8712 | 0.9403 | 0.9229 | 0.9315 | 5.48 |
| DNAnet [24] | 0.8862 | 0.9566 | 0.9236 | 0.9398 | 14.05 |
| UCDnet (ours) | 0.9186 | 0.9673 | 0.9480 | 0.9576 | 15.56 |
| Semantic Segmentation Algorithm | IoU | Precision | Recall |
|---|---|---|---|
| single U-shaped structure (ablation study1) | 0.8665 | 0.9419 | 0.9155 |
| double U-shaped structure (ablation study2) | 0.8728 | 0.9600 | 0.9057 |
| double U-shaped structure + attention module (ablation study3) | 0.9070 | 0.9599 | 0.9428 |
| double U-shaped structure + attention module + feature fusion (ours) | 0.9186 | 0.9673 | 0.9480 |
| Centroid Localization Methods | Localization Precision (Pixels) |
|---|---|
| center of bounding box | 0.6096 |
| gray value centroid method | 0.5775 |
| squared weighted centroid method | 0.5380 |
| UCDnet (Ours) | 0.3371 |
Disclaimer/Publisher’s Note: The statements, opinions and data contained in all publications are solely those of the individual author(s) and contributor(s) and not of MDPI and/or the editor(s). MDPI and/or the editor(s) disclaim responsibility for any injury to people or property resulting from any ideas, methods, instructions or products referred to in the content. |
© 2023 by the authors. Licensee MDPI, Basel, Switzerland. This article is an open access article distributed under the terms and conditions of the Creative Commons Attribution (CC BY) license (https://creativecommons.org/licenses/by/4.0/).
Share and Cite
Xu, X.; Wang, J.; Zhu, M.; Sun, H.; Wu, Z.; Wang, Y.; Cao, S.; Liu, S. UCDnet: Double U-Shaped Segmentation Network Cascade Centroid Map Prediction for Infrared Weak Small Target Detection. Remote Sens. 2023, 15, 3736. https://0-doi-org.brum.beds.ac.uk/10.3390/rs15153736
Xu X, Wang J, Zhu M, Sun H, Wu Z, Wang Y, Cao S, Liu S. UCDnet: Double U-Shaped Segmentation Network Cascade Centroid Map Prediction for Infrared Weak Small Target Detection. Remote Sensing. 2023; 15(15):3736. https://0-doi-org.brum.beds.ac.uk/10.3390/rs15153736
Chicago/Turabian StyleXu, Xiangdong, Jiarong Wang, Ming Zhu, Haijiang Sun, Zhenyuan Wu, Yao Wang, Shenyi Cao, and Sanzai Liu. 2023. "UCDnet: Double U-Shaped Segmentation Network Cascade Centroid Map Prediction for Infrared Weak Small Target Detection" Remote Sensing 15, no. 15: 3736. https://0-doi-org.brum.beds.ac.uk/10.3390/rs15153736