

Stereoscopic Monitoring Methods for Flood Disasters Based on ICESat-2 and Sentinel-2 Data
by
 , and
, and
Yongqiang Cao
1,†,
Mengran Wang
1,†,
Jiaqi Yao
1,* ,
,
Fan Mo
2,
Hong Zhu
3,
Liuru Hu
4 and
Haoran Zhai
2 1
Academy of Eco-Civilization Development for Jing-Jin-Ji Megalopolis, Tianjin Normal University, Tianjin 300378, China
2
Land Satellite Remote Sensing Application Center, Ministry of Natural Resources, Beijing 100048, China
3
Institute of Disaster Prevention, College of Ecology and Environment, Langfang 065201, China
4
Departamento de Ingeniería Civil, Escuela Politécnica Superior de Alicante, Universidad de Alicante, P.O. Box 99, E-03080 Alicante, Spain
*
Author to whom correspondence should be addressed.
†
These authors contributed to the work equally and should be regarded as co-first authors.
Remote Sens. 2023, 15(12), 3015; https://0-doi-org.brum.beds.ac.uk/10.3390/rs15123015
Submission received: 6 May 2023
/
Revised: 1 June 2023
/
Accepted: 2 June 2023
/
Published: 9 June 2023
(This article belongs to the Special Issue Monitoring Terrestrial Water Resource Using Multiple Satellite Sensors)
Abstract
:Climate change has led to an increased frequency of extreme precipitation events, resulting in increased damage from rainstorms and floods. Rapid and efficient flood forecasting is crucial. However, traditional hydrological simulation methods that rely on site distribution are limited by the limited availability of data and cannot provide fast and accurate flood monitoring information. Therefore, this study took the flood event in Huoqiu County in 2020 as an example and proposes a three-dimensional flood monitoring method based on active and passive satellites, which provides effective information support for disaster prevention and mitigation. The experimental results indicated the following: (1) the flood-inundated area was 704.1 km2, with the Jiangtang Lake section of the Huaihe River and the southern part of Chengdong Lake being the largest affected areas; (2) water levels in the study area ranged from 15.36 m to 17.11 m, which is 4–6 m higher than the original water level. The highest flood water level areas were the Jiangtang Lake section and the flat area in the south of Chengdong Lake, with Chengdong Lake and the north of Chengxi Lake having the greatest water level increase; (3) the flood water depth was primarily between 4 m and 7 m, with a total flood storage capacity of 2833.47 million m3, with Jiangtang Lake having the largest flood storage capacity; and (4) the rainstorm and flood disaster caused a direct economic loss of approximately CNY 7.5 billion and affected a population of approximately 91 thousand people. Three-dimensional monitoring of floods comprehensively reflects the inundation status of floods and can provide valuable information for flood prediction and management.
1. Introduction
The increasing frequency of extreme precipitation events caused by climate change has brought about significant threats to urban flood control safety, resulting in severe losses to both the social economy and human safety [1]. Therefore, the efficient and extensive monitoring of floods is crucial for assessing and preventing flood disasters. However, traditional flood monitoring methods focus on surface water dynamics, potentially resulting in unreasonable flood control measures. In contrast, flood three-dimensional monitoring provides comprehensive and accurate information about flood spatial distribution and water levels. It enhances the understanding of flood dynamics and helped to improve the flood control strategy and better protect the life and property safety of residents.
Flood stereo monitoring involves monitoring flood inundation ranges and floodwater levels [2,3]. Satellite remote sensing technology has been widely used for flood inundation because of its extensive coverage, short response time, and timeliness. The key to flood-range monitoring is the extraction of water information. Currently, commonly used methods for extracting water information include single-band, water index, and spectral relationships. The single-band method relies primarily on the strong absorption characteristics of remote sensing images in the near-infrared band and extracts water information by setting a threshold. However, this method is only suitable for extracting water information from areas with simple features; for complex areas, the results often contain confusing information with low extraction accuracy [4,5]. Some scholars have discovered that using multiband combinations such as the water index and spectral relationship methods can accurately distinguish water from the background, resulting in better water extraction results [6,7]. Among them, the water index method is highly efficient and precise, making it the most effective method for water extraction [8].
McFeeters [9] introduced the normalized difference water index (NDWI) based on the normalized difference vegetation index (NDVI), which emphasizes water information by contrasting green and near-infrared bands. A threshold of 0 is set; therefore, when the pixel value is greater than 0, it is identified as water. However, because of the varying characteristics of multi-spectral images captured by different sensors in different regions and at different times, using only the zero threshold may not effectively extract water information from many regions. Therefore, it is necessary to set a threshold based on the specific characteristics of each image. The Otsu algorithm is a promising approach for water extraction because it calculates gray-level histograms from remote sensing images. Tan [10] improved the water body extraction accuracy by applying the Otsu algorithm. Shi [11] demonstrated that the Otsu algorithm can quickly and effectively extract water information and has a wide range of applications in dynamic water monitoring.
Traditional model-based designs can simulate flood inundation processes and provide flood-water level information. Peng [12] successfully simulated the rainstorm infiltration–runoff confluence–submergence process in the Maozhou River Basin in Shenzhen by combining the CLUE-S, SCS, and equal volume submergence algorithms. Similarly, Yang [13] and Melkam [14] established a hydrodynamic model to simulate and map flood inundation depths. However, model-based flood measurement methods rely on limited measurement site distribution, and it is difficult to quickly obtain large-scale and high-precision floodwater-level measurement information [15]. Optical satellites can also provide large-scale floodwater-level measurement results, but due to the limitation of weather and water quality conditions, the accuracy is poor. The development of satellite altimetry presents an opportunity to acquire floodwater-level data rapidly. Laser altimeters mounted on satellites emit laser pulses toward a target and estimate the distance by measuring the transit time of the laser pulses, thereby obtaining water level elevation and water depth information [16,17]. Commonly used altimetry satellites include GF-7, CATS, and ICESat-2 [18,19]. Among these, ICESat-2 has been shown to have high accuracy [20,21]. Xi [22] used ICESat-2 ATLAS data to extract offshore water depth and found that the maximum detection depth of ICESat-2 could reach 7.83 m, with a maximum error of approximately 1.69 m and a minimum of approximately 0.001 m. Guo [23] used ICESat-2 laser altimetry data to monitor the water level change in the Yangtze River Three Gorges from October 2018 to July 2021, with an average error of 0.01 m. Based on this, Ma [24] and Xu [25] combined ICESat-2 altimetry data and Sentinel-2 remote sensing images to draw offshore water depth maps, which provided a reference for drawing floodwater-level contour maps. By integrating active and passive satellite technologies, we have effectively addressed the difficulties and challenges of traditional flood monitoring approaches and achieved more accurate floodwater-level measurement results. This innovative method has a promising application prospect in the field of flood monitoring.
Therefore, this study presents a three-dimensional monitoring approach for floods based on ICESat-2 satellite altimetry data and Sentinel-2 remote sensing images. Furthermore, the integration of active and passive satellite technologies in this method allows for the provision of more reliable and trustworthy flood monitoring results. First, the Otsu algorithm, based on spectral index optimization, was used to extract the water-body boundary and analyze the flood inundation range. Next, the height of the floodwater was estimated using ICESat-2 satellite altimetry data, and the degree of flood inundation was analyzed. The flood storage volumes of different lake areas were then analyzed together with the terrain data. Finally, by combining land use and population distribution data, economic losses from flood disasters in the study area were evaluated. The proposed approach provides a rapid and large-scale flood inundation monitoring method that is of great significance for flood disaster monitoring, flood control, and disaster reduction research.
2. Study Sites and Data Sources
2.1. Overview of the Study Area
This study was conducted in Huoqiu County, Lu’an City, Anhui Province, China. The study area measures 6264.4 km2, as shown in Figure 1. Huoqiu County is located in a transitional section of the climate between northern and southern China. The average annual precipitation in the basin is 1100 mm, and the average annual temperature is 14–16 °C. This region is flat, densely populated, and fertile, and it constitutes a vital grain production base in China. The study site has a significant number of rivers, making it susceptible to rainstorms and floods.
During the flood season of 2020, six episodes of heavy rainfall occurred in the study area, and rainfall was twice the size of the same period in the previous year. On 17 July, the water level at Wangjiaba Hydrological Station exceeded the warning water level of 27.5 m at 22:48, exceeding the guaranteed water level, which refers to the highest flood level in history, within 49 h and reaching the flood peak water level within 9 h, with the highest water level reaching 29.76 m. Because of heavy rainfall, severe flooding occurred in the study area, significantly impacting residents’ daily lives and social production.
2.2. Data Introduction
2.2.1. ICESat-2 Lidar Data
The ICESat-2 satellite is equipped with a state-of-the-art terrain laser altimetry system (ATLAS) that uses photon-counting lidar and a satellite attitude and orbit measurement system. The time required for the emitted photons to reach each ground and return to the sensor, as well as the latitude and longitude of those photons and the surface elevation value, can be calculated using an active laser. By emitting a single pulse at a repetition rate of 10 kHz, ATLAS formed a spot on the ground with a diameter of 10 m and an orbital interval of 0.7 m. The three pairs of laser pulses from ATLAS form six ground orbits with a width of 14 m and each ground orbit is numbered according to the laser spot generated by it. The left and right ground orbits of the same pair were approximately 90 m apart in the cross-track direction and approximately 2.5 km apart in the along-track direction. The beam spacing between different orbits was approximately 3.3 km. Figure 2 illustrates the principle of ICESat-2 water level measurement [26].
ICESat-2 provides 21 standard data products divided into four levels: level-1, level-2, level-3A, and level-3B, which are stored in HDF5 files. The data are freely downloadable from NSIDC. This study used the level-2 product, specifically the ALT03 data, which contains initial photon geolocation information such as time, longitude, dimension, ellipsoid height, and flight distance along the orbit of each photon. Additionally, the ATL03 data assigned a confidence level to each photon event ranging from 0 to 4, with higher confidence levels indicating higher credibility. Based on this, 0 was considered the lowest coincidence photon, and 4 was considered the highest coincidence photon. The algorithm used in this study assumes a Poisson distribution for photons and detects signals using Poisson outliers. According to the label, the user can eliminate noise photons automatically; however, identifying water surface photons remains challenging. In this study, histogram statistics were applied to extract water surface photons based on the elevation value of the signal photons, and the water level height information of the water surface was obtained using a Gaussian distribution function.
2.2.2. Sentinel-2 Remote Sensing Image Data
Sentinel-2 is an optical imaging satellite equipped with a multi-spectral imager (MSI) that can be used for land monitoring and provides information on vegetation, soil, coastal areas, and water cover. It is divided into two satellites, 2A and 2B, which can provide remote sensing images with spatial resolutions of 10 m, 20 m, and 60 m, and the different spatial resolutions apply to different bands.
The Sentinel-2 data used in this study can be obtained free of charge through the GEE (Google Earth Engine) platform, a global-scale geospatial data service platform that contains a variety of geographic data types and operators for user download and online analysis. The Sentinel-2 images available on the GEE platform were divided into two levels: level 1C and level 2A. In this study, the level 2A image has been processed for radiative and atmospheric correction to surface reflectance, and geolocation with a projection in UTM coordinates using the WGS84 datum [27]. Based on the cloud removal algorithm provided by the GEE platform, Sentinel-2 images can be used to extract water boundaries and measure water levels following flood disasters.
2.2.3. Auxiliary Data
To further investigate flood storage and losses in the study area, auxiliary information such as DEM, land use, and population distribution data from the same year were utilized. DEM data with a spatial resolution of 12.5 m were obtained from the official NASA website to analyze the submerged water depth for flood storage estimation. To estimate flood loss, land use data were derived from the ESA 2020 World Coverage Product with a spatial resolution of 10 m. Population distribution data were obtained from China’s population spatial distribution km grid dataset with a spatial resolution of 1 km, which was available from the Resource and Environmental Science and Data Center. Among them, combined with DEM and water level measurement results, we can calculate the flood inundation depth and land use data, and population spatial distribution data are mainly used for flood loss assessment. Furthermore, to ensure that the spatial resolution of the data was consistent, we used nearest neighbor interpolation to resample the spatial resolution of the DEM and population distribution data to 10 m. The specific description of the data used in this paper is as Table 1.
3. Methods
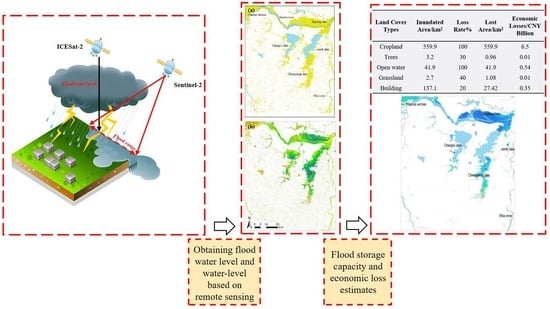
Based on ICESat-2 and Sentinel-2 data, this study conducted three-dimensional monitoring of floods by extracting the flood range and submerged water depth and analyzing the damage after floods. The entire process is shown in Figure 3 and includes several basic steps: (1) data collection, (2) data preprocessing, (3) flood range extraction and submerged depth measurement, and (4) flood loss assessment.
3.1. Automatic Extraction Algorithm of Water Boundary Considering Water Characteristics
The Otsu algorithm is commonly used to determine thresholds for image segmentation. The optimal threshold was determined by calculating the gray-level histogram of the image to separate water from land [31,32]. The basic idea is to perform histogram statistics on the gray values of the pixels in remote sensing images to determine a suitable threshold for image segmentation. The maximum value of interclass variance was used as the separation point between the water and land. However, the traditional Otsu algorithm is suitable only for extracting water from simple backgrounds. For complex terrains, misidentifying high-radiation features or mountain shadows as water is common. Although the water extraction method based on a spectral index (NDWSI) can also be obtained directly from the range of water bodies, there are still many other land cover types misidentified as water bodies. Therefore, in order to obtain more accurate water body boundaries, an automatic water boundary extraction algorithm based on the backscattering characteristics of water is proposed in this study. The algorithm first used the normalized difference water surface index (NDWSI) to distinguish water from land. The NDWSI formula is shown in Equation (1) [9]:
Water body information in the image can be highlighted by calculating the NDWSI using green and near-infrared bands, thus revealing the separation of water from land. The Otsu algorithm was then applied to extract the water bodies. The NDWSI image pixel values range from 0 to L-1, with L being the number of gray values. The interclass variance formula used is as follows:
where and represent the row and column numbers of NDWSI images; and represent the proportion of water and land pixels in the whole NDWSI image, respectively; and represent the average gray value of pixels of the target water body and background, respectively; is the segmentation threshold with the largest inter-class variance, and the optimal segmentation threshold determined by the Otsu algorithm is:
Water body information in the study area after a flood disaster was extracted using the improved Otsu algorithm and compared with the original water body boundary in the land use classification data to determine the flood range.
3.2. Flood Water Level Estimation Method Based on Satellite Laser Altimetry Data
The ATLAS detector can record the three-dimensional coordinates of massive photon signals along the orbit; however, most of this is noise. To reduce the computational complexity of data processing, it is necessary to roughly extract the photon point cloud data to determine the approximate interval of the noise and signal photons. In the ATL03 data, each photon is labeled on the official website, enabling the coarse extraction of point cloud data by deleting questionable photons that have the lowest confidence.
To further extract water surface photon information, the elevation distribution range of the water surface photons was obtained using a histogram of the elevation distribution of the retained photons after rough extraction and Gaussian function fitting. The steps of the algorithm are as follows:
Firstly, the original photon data were segmented, and the histogram statistics of the photons in each segment were used to obtain an elevation distribution histogram. The average number of photons in all the elevation slices was calculated to determine the elevation distribution range of the photons in the area covered with water.
Secondly, histogram statistics were performed on the photon data in the area covered with water to obtain the maximum histogram and its corresponding elevation value, . The maximum position of the histogram is searched from the side with the smaller elevation value until the elevation value corresponding to the position is found [33]. The initial parameters of the Gaussian function fitting were calculated using Formula (4), the Gaussian distribution fitting curve was drawn to fit the histogram, and the mean and standard deviation were obtained. Finally, the photons in the interval were considered as water surface signal photons.
By extracting water surface signal photons pre- and post-flood disaster, water level data in the study area can be obtained to further analyze water level changes and flood water level information. The Stumpf empirical model, which utilizes the difference between the blue and green band reflectance to predict water depth, was used to obtain the water level data. Combined with real water level data, more accurate water level measurement results can be obtained [34,35,36]. This model can be expressed as follows:
The water level height [m] is represented by H, which is derived from the preprocessed Sentinel-2 image. The empirical parameters and are used to convert the calculated results into water level height. and represent the remote sensing reflectance of the water surface in the blue and green bands, respectively. Additionally, a fixed constant ensures that the two logarithmic results are always positive and are generally set to 1000.
3.3. Estimation of Flood Storage Capacity
By integrating the water area extracted using the method described in Section 3.1 with the water level height extracted using the method in Section 3.2, along with the DEM data, the flood storage capacity of the study area was estimated. As the flood area is mainly located in a plains area, the bottom of the flood area is relatively flat, and the flood cross-section is relatively vertical. So, it can be assumed that the volume of a flood is approximately equal to the volume of a prism [37,38]. Therefore, the flood storage in the study area was calculated using the following steps:
Firstly, based on DEM data for a single lake area, the flood inundation depth was calculated as follows:
where, represents the flood inundation depth [m], or the water level height of the flood area, H is the terrain height [m], and represents the change in water level before and after flooding [m].
Secondly, based on the cone model, water accumulation in each flooded area was calculated as:
In the formula, represents the flood storage volume [m3] of different lake areas, is the flood area [m2], and is the flood inundation depth [m] of each lake area.
3.4. Flood Loss Assessment
After obtaining the flood range and water depth, the disaster-bearing body information in the flood range was superimposed to further estimate the flood loss in the flooded range using Equation (8), including human and economic losses. To assess the number of affected people, the population distribution data can be overlaid with the flood inundation range. The value of various types of land use in the flood area can be multiplied by the corresponding loss rate to assess economic losses caused by floods, where the loss rate is determined by the degree of inundation [39]. The following formula can be used for this purpose:
Formula (8) calculates the direct economic loss caused by a flood disaster, where is the direct economic loss value of the land use type j, is the loss rate of the land use type j in the i-th grid under the k-submerged degree, which is a function of the submerged depth h and the flooding time t, and is the value of the j-th land use type in the i-th grid under the k-submerged degree, which is expressed as GDP. The formula considers N as the number of grids in the submerged area, M as the number of land use types, and K as the degree of submergence.
4. Results
4.1. Flood Inundation Range Analysis of Otsu Algorithm Based on Spectral Index Optimization
This study utilized the Otsu algorithm optimized using spectral index optimization to extract water ranges after a flood disaster. This method was applied using the GEE platform. This study focused on extreme precipitation events that occurred in Huoqiu County, with satellite image data from 27 July 2020, to 20 August 2020, selected as the main research data. Using band calculations and histogram statistics, a threshold value of −0.205 was obtained for land and water segmentation. During the classification process, any value greater than the threshold was classified as a water body, whereas any value less than the threshold was considered a land area. The Otsu threshold results and image pixels presented in Figure 4 show a clear bimodal shape, indicating that the algorithm can better identify water and dry pixels in the image; thus, a water boundary with a relatively clear contour can be extracted, as shown in Figure 5. And the red dotted line in Figure 4 corresponds to the optimal segmentation threshold T calculated by the Otsu method.
Figure 6 presents the water details obtained through the Otsu algorithm, which was employed for spectral index optimization. The results are then compared to the WorldCover product from The European Space Agency (ESA). The comparison reveals a similarity exceeding 90%. Consequently, the algorithm demonstrates a considerable ability to accurately identify water boundaries in remote sensing images.
Figure 7 illustrates the changes in water distribution in the study area following the flood disaster. The results show a significant increase in the water body, with the water area expanding from 431.85 km2 to 1121.78 km2, of which the flood area covered 704.1 km2. The distribution of floods was mainly influenced by the topography of the region. Notably, Chengdong and Chengxi Lakes experienced southward expansion. Moreover, the Huaihe River was flooded, and the river channel in most areas widened, with a tendency to expand northward. The Jiangtanghu section of the Huaihe River and the southern part of Chengdong Lake serve as the primary flood storage areas; because of their flat and low terrain, they accumulated a large amount of floodwater and ultimately became the most extensively affected areas.
4.2. Analysis of Flood Level Based on Satellite Altimetry
In this study, we utilized ICESat2 water level height point data and preprocessed Sentinel-2 remote sensing images to train the Stumpf logarithmic conversion ratio model (Equation (5)) to generate water level height maps pre- and post-flood disasters. Figure 8 and Figure 9 depict the laser trajectory and water distribution data of photons in the study area, respectively. Figure 8a and Figure 9a show enlarged satellite images and Figure 8b and Figure 9b display the original photon data given by ATL03. The red line in Figure 8 and Figure 9 represent the distribution of ICESat-2 ATL03 photon orbits. To compare the water level changes pre- and post-flood, photon data from 4 February 2020 and 4 August 2020 were selected for water level inversion. Figure 8 illustrates the distribution of photons before the flood disaster, with the ICESat-2 satellite flying over during the night on 4 February 2020, resulting in a low-intensity photon signal dataset. Figure 9, on the other hand, exhibits the photon distribution after the flood disaster, with the ICESat-2 satellite flying through during the daytime on 4 August 2020, resulting in a high intensity of the photon signal dataset. Figure 10 shows the results of the water surface signal extracted by the photon, indicating that the Gaussian fitting method effectively eliminated noise. Specifically, Figure 10a represents the water surface signal photon extracted on 4 February 2020, Figure 10b,c represent the water surface signal photon extracted on 4 August 2020.
The water level measurement results based on the Stumpf model are shown in Figure 11. Figure 11a,b displays the water level measurement results in the study area pre- and post-flood. The results indicate that the water level height in the study area before the flood was between 10.65 and 12.05 m, and the water level height after the flood was between 15.36 and 17.11 m, an increase of approximately 4–6 m. Moreover, Yuan [40] demonstrated that the mean measurement error of ICESat-2 in water level measurements of lakes and reservoirs in China is 0.02 m. This indicates that flood-level measurement using ICESat-2 in this area is feasible and more reliable results can be obtained. The greatest increase in the water level was observed in Chengdong Lake and the northern part of Chengxi Lake, which are low-lying areas. The floodwater level was between 16.18 and 17.11 m. In particular, because of the narrow river channel in the Tanghu section of the Huaihe River and the southern part of Chengdong Lake, the sudden rise in water level caused by heavy rainfall is likely to cause the river to break its banks and inundate the surrounding areas. Additionally, the low-lying terrain of the region facilitates the accumulation of floodwater, resulting in the highest floodwater levels.
4.3. Flood Storage Estimation
Based on the water level measurement results and DEM data, we estimated the flood depth in the study area (Figure 12). The results indicated that the distribution of the submerged water depth was consistent with the distribution of the flood water level height, implying that flooded areas with higher water level heights experienced greater submerged water depths. This further corroborates the idea that flood accumulation in the study area is strongly correlated with terrain. The overall degree of submergence in the flood area was high, with most of the submerged water depths ranging between 4–7 m. The submerged depth of the area surrounding Jiangtang Lake in the Huaihe River was the highest, while the submerged depth of the area south of Chengdong Lake was relatively low because of the high terrain and flooding into the lake.
To further assess the flood storage area in this study, we divided the flood area into six parts according to the lake area and assessed the water accumulation situation in each part. Table 2 summarizes the flooded areas and the water accumulation in each area. The results show that the total flood storage capacity in the study area is 2833.47 million m3, with the flood storage capacity of each lake area from largest to smallest being Jiangtang Lake, Chengdong Lake, Nanrun section, Chengxi Lake, North Lake, and Pi River. The Jiangtanghu section of the Huaihe River has the largest submerged depth and area and the largest flood storage capacity. The flood discharge areas of the Nanrun section of the Huaihe River and Chengdong Lake were relatively large, and the flood storage capacity was relatively high. North Lake had the smallest flood area and the lowest flood storage capacity. Overall, the Jiangtanghu and Chengdonghu sections of the Huaihe River have strong flood storage capacities, and this region should be considered a key area when making flood control decisions.
4.4. Estimation of Waterlogging Loss
Based on the flood inundation range and depth and land use and population data, a direct economic loss assessment model was used to estimate the flood loss in the study area. Based on the relevant literature [41,42], the loss rate of the affected assets was primarily determined by the submergence depth. The estimated flood loss is shown in Table 3.
The assessment revealed that the flood disaster caused the most severe loss of cultivated land, destroying 559.9 km2 and posing a significant threat to regional rice production. Additionally, 41.9 km2 of water bodies were damaged, resulting in significant losses to the local fishery economy. In urban areas, high submerged water depths not only severely impact the lives of residents but also hinder post-disaster reconstruction. The flood caused major damage, threatening approximately 91,000 people, and direct economic losses were estimated at approximately CNY 7.5 billion.
5. Discussion
5.1. Factors Affecting Floods
Flood formation is a complex process involving multiple factors that influence the distribution of the flood inundation range and depth [43]. While the importance of each factor may vary depending on the local physical and natural characteristics, certain factors have been identified as playing a predominant role.
First, rainfall is a major flood trigger, particularly when natural waterways cannot contain excess water [44]. In this study, the main flood area was located near the rain belt, indicating a strong positive correlation between rainfall and flood distribution in the study area.
Secondly, the topography is a critical factor in flood occurrence, with the slope being a key characteristic of surface areas prone to flooding [45]. Generally, water flows downhill along terrain slopes. Therefore, in areas with complex terrain and high slopes, steep inclines tend to reduce rainwater infiltration, causing excess water on the surface to flow rapidly downstream and into rivers [46]. The main flood area examined in this study is located in a relatively low-terrain area, particularly south of Chengdong Lake, in a valley where water flow can accumulate and is slow to dissipate, leading to the formation of a large flood area.
Finally, the soil plays a crucial role in rainwater infiltration [47]. In practical research, many scholars associate soil characteristics with groundwater depth and level, using them as vital parameters for assessing flood formation [48,49]. It is widely accepted that the larger the gap in the soil, the better the infiltration capacity. However, the ability of the soil to absorb water is also affected by the groundwater level. Higher groundwater levels result in faster land saturation during rainfall, which increases surface runoff and the risk of flood area formation.
The distribution of rainfall, topography, and soil saturation in the study area is shown in Figure 13. In the study area, cultivated land is mainly distributed around rivers and lakes, with large soil pores and a high groundwater level. During heavy rainfall, the soil becomes saturated, impeding surface water infiltration and resulting in flooding of the surrounding areas.
5.2. Flood Disaster Management
Previous studies have proposed various methods to mitigate flood hazards, such as early warning systems [50] and emergency evacuation plans [51], to reduce the possible injuries, fatalities, and economic losses from flood disasters. The identification of flood-prone areas is crucial for flood disaster management.
Combined with the land use data, we can analyze the most damaged areas within the study area and develop flood control measures. the changes in land use types in the most damaged area are shown in Figure 14. Based on the findings of this study, it can be concluded that the areas most severely affected by flooding are the Jiangtang Lake section of the Huaihe River and the southern part of Chengdong Lake, with the largest inundated areas and the highest inundated water depths. Affected areas are mainly used for grain crop cultivation; thus, floods can have a significant impact on local agriculture. Therefore, to effectively manage flood control, it is recommended to increase emergency flood discharge capacity and improve flood control and drainage infrastructure in the Jiangtang Lake section and Chengdong Lake. For example, flood diversion can be guided through the construction of water conservancy facilities or the implementation of flood diversion means to alleviate the pressure of river flood storage or to increase the ground vegetation to improve the soil infiltration rate and reduce the groundwater flow. These measures can help mitigate future flood disasters and minimize their impact on local food production and agricultural development.
5.3. Influence and Limitation
Previous studies have relied on meteorological, hydrological, and geomorphological data to establish hydrological models for flood depth simulations and flood inundation analyses. Although this method can obtain more accurate flood depth information, this hydraulic model is limited in many areas because of the lack of datasets [52], and the establishment of these models requires considerable time, which does not meet the disaster prevention needs of rapid flood monitoring.
To overcome these limitations and conduct more rapid flood monitoring, this study proposes a method for floodwater level measurement based on ICESat-2 data. Because this method does not consider the limitations of terrain conditions, it has strong applicability in any area and can be used for water depth measurement in different types of floods. In addition, because of the high accuracy of ICESat-2 in lake water level measurement, the flood water level measurement results based on ICESat-2 also have high credibility, and the specific accuracy results can be further verified in future research. However, weather conditions such as atmosphere and thick fog may affect the transmission and reflection of the laser, thereby affecting the accuracy of water depth measurement. Therefore, it is best to perform this method under good weather conditions. In short, this study expands the application of LiDAR technology in the field of flood monitoring, offers new insights into the application of ICESat-2, and provides a valuable reference for future research.
In summary, the proposed flood stereoscopic monitoring method using satellite remote sensing technology has significant potential for quickly and effectively providing flood inundation information that can significantly aid flood disaster assessment and management. However, it has some limitations, such as the long revisit period of the ICESat-2 satellite, which makes dynamic flood monitoring difficult. To improve the accuracy and speed of monitoring, future research could explore a combination of other lidar data to shorten the time interval for remote sensing monitoring. The launch of the Surface Water and Ocean Topography (SWOT) task also provides a convenience for three-dimensional flood monitoring, and it has a strong application prospect in subsequent research. Secondly, the Stumpf model is a water depth estimation method based on the analysis of the reflectance ratio of different bands in remote sensing images and water depth. This method has the advantages of simple calculation and a wide application range, but its accuracy is poor when dealing with turbid water bodies. In addition to the Stumpf model, there are other water depth estimation models that can be used for floodwater depth measurements, such as the DBMA model [53], machine learning models [54], and BP neural network models [55]. Compared with the Stumpf model, the DBMA model can also achieve good accuracy performance in measuring water depths in turbid water bodies, while the machine learning models and the BP neural network models are suitable for measuring water depths greater than 15 m. The applicability and accuracy performance of these models can be further evaluated in future studies. Additionally, the lack of high-resolution remote sensing data may result in low precision in identifying small flood areas in urban regions. Therefore, future research should consider using higher-resolution remote sensing data, such as World View or GF-7 data, to achieve a more refined evaluation of urban waterlogging. Finally, because this paper proposes a fast three-dimensional flood detection method, the accuracy of the water boundary extraction results may be lower than that of supervised classification methods. In future research, GPU and CPU collaboration could be used to improve the efficiency of supervised classification models.
6. Conclusions
This paper presents a three-dimensional monitoring method for floods using satellite remote sensing data. Flood distribution, inundation depth, and storage data were analyzed during the disaster, and the affected population and economic losses were quantitatively evaluated. The main contributions of this study are as follows:
- (1)
- Development of an automatic extraction algorithm for flood boundaries that considers water body characteristics. The NDWSI was calculated based on the spectral index to highlight water body data from the remote sensing images. The Otsu algorithm was then applied to extract the water body boundaries. By combining the original water body data, we found that the flood-inundated area was 704.1 km2 and that the most seriously affected locations were relatively flat and low-lying areas around rivers and lakes. The Jiangtang Lake section of the Huaihe River and the southern part of Chengdong Lake were the most affected areas;
- (2)
- Use of ICESat-2 data for water-level inversion in the research area. The results showed that after the rainstorm and flood, the water level in the research area increased to 15.36 m–17.11 m, which was 4–6 m higher than the original water level. The greatest increase in the water level was observed in Chengdong Lake and the northern part of Chengxi Lake. The floodwater level ranged from 16.18 to 17.11 m, with the highest floodwater levels being in the Jiangtang Lake section of the Huaihe River and the flat area in the south of Chengdong Lake. These areas experienced the greatest flood inundation;
- (3)
- Estimation of the flood storage volume by calculating the flood storage capacity of each lake based on water level and flood area data. According to the statistics, we found that the overall degree of inundation of the flood area was high, with most inundation depths ranging from 4 to 7 m. The area around Jiangtang Lake on the Huaihe River had the highest inundation depth. The total flood storage capacity in the study area was 2833.47 million m3, with the largest to smallest flood storage capacity in Jiangtang Lake, Chengdong Lake, Nanrun section, Chengxi Lake, North Lake, and the Pi River;
- (4)
- Estimation of the economic impact of flood disasters using land use and population data combined with the flood inundation range and depth. The assessment showed that the flood disaster caused significant economic losses in the study area, with approximately 91,000 people affected, and direct economic losses of approximately CNY 7.5 billion.
Author Contributions
Y.C. and M.W. proposed the methodology and prepared the manuscript. J.Y. and F.M. contributed to improving the methodology. H.Z. (Hong Zhu) and L.H. edited and improved the manuscript. H.Z. (Haoran Zhai) contributed to the methodological testing. All authors have read and agreed to the published version of the manuscript.
Funding
This work was jointly supported by grants from the National Natural Science Foundation of China (52079060), The Belt and Road Initiative Water and Sustainable Development Science and Technology Key Fund (2021nkzd02), Special Funds for Creative Research (2022C61540), and Independent research program of key Laboratory of Land Satellite Remote Sensing Application, MNR, NO. BN2302-6.
Data Availability Statement
The data are not publicly available due to privacy restrictions.
Conflicts of Interest
The authors declare no conflict of interest.
References
- Xia, J.; Chen, J. A new era of flood control strategies from the perspective of managing the 2020 Yangtze River flood. Sci. China Earth Sci. 2021, 64, 1–9. [Google Scholar] [CrossRef]
- Wu, Y.; Li, X.; Gao, Y. The determination method of flood inundation range based on the coherence of Sentinel data. Bull. Surv. Mapp. 2022, 11, 96. [Google Scholar]
- Jamei, M.; Ali, M.; Malik, A.; Ramendra, P.; Shahab, A.; Zaher, M.Y. Forecasting Daily Flood Water Level Using Hybrid Advanced Machine Learning Based Time-Varying Filtered Empirical Mode Decomposition Approach. Water Resour. Manag. 2022, 36, 4637–4676. [Google Scholar] [CrossRef]
- Lu, Z.; Wang, D.; Deng, Z.; Shi, Y.; Ding, Z.; Ning, H.; Zhao, H.; Zhao, J.; Xu, H.; Zhao, X. Application of red edge band in remote sensing extraction of surface water body: A case study based on GF-6 WFV data in arid area. Hydrol. Res. 2021, 52, 1526–1541. [Google Scholar] [CrossRef]
- Wang, R.J.; Liu, B.K.; Du, Y.E.; Zhang, H.H.; Yu, Z.Y. Study on water area extraction method of typical lakes in Hoh Xil based on GF-6. Bull. Surv. Mapp. 2022, 32–37. [Google Scholar]
- Zhou, Y.; Dong, J.W. Research progress of remote sensing monitoring of land surface water. J. Geo-Inf. Sci. 2019, 21, 1768–1778. [Google Scholar]
- Wang, X.B.; Xie, S.P.; Zhang, X.L.; Chen, C.; Guo, H.; Du, J.K.; Duan, Z. A robust Multi-Band Water Index (MBWI) for automated extraction of surface water from Landsat 8 OLI imagery. Int. J. Appl. Earth Obs. Geoinf. 2018, 68, 73–91. [Google Scholar] [CrossRef]
- Choudhary, S.S.; Ghosh, S.K. Surface Water Area Extraction by Using Water Indices and DFPS Method Applied to Satellites Data. Sens. Imaging 2022, 23, 33. [Google Scholar] [CrossRef]
- McFeeters, S.K. The use of the Normalized Difference Water Index (NDWI) in the delineation of open water features. Int. J. Remote Sens. 1996, 17, 1425–1432. [Google Scholar] [CrossRef]
- Tan, J.; Tang, Y.; Liu, B.; Zhao, G.; Mu, Y.; Sun, M.; Wang, B. A Self-Adaptive Thresholding Approach for Automatic Water Extraction Using Sentinel-1 SAR Imagery Based on OTSU Algorithm and Distance Block. Remote Sens. 2023, 15, 2690. [Google Scholar] [CrossRef]
- Shi, X.; Dong, X.; Yang, J.; Zhang, Y. Study on Water Information Extraction Method Based on Tiangong-2 Interferometric Imaging Radar Altimeter Data. In Proceedings of the Photonics & Electromagnetics Research Symposium—Fall, Xiamen, China, 17–20 December 2019. [Google Scholar]
- Peng, J.; Wei, H.; Wu, W.H.; Liu, Y.X.; Wang, Y.L. Risk assessment of urban rainstorm and flood disaster based on land use change scenarios: A case study of Maozhou River Basin in Shenzhen City. Acta Ecol. Sin. 2018, 38, 3741–3755. [Google Scholar]
- Yang, S.Y.; Chang, C.H.; Hsu, C.T.; Wu, S.J. Variation of uncertainty of drainage density in flood hazard mapping assessment with coupled 1D–2D hydrodynamics model. Nat. Hazards 2022, 111, 2297–2315. [Google Scholar] [CrossRef]
- Melkamu, T.; Bagyaraj, M.; Adimaw, M.; Ngusie, A.; Karuppannan, S. Detecting and mapping flood inundation areas in Fogera-Dera Floodplain, Ethiopia during an extreme wet season using Sentinel-1 data. Phys. Chem. Earth Parts A/B/C 2022, 127, 103189. [Google Scholar] [CrossRef]
- Gabriels, K.; Willems, P.; Van Orshoven, J. A comparative flood damage and risk impact assessment of land use changes. Nat. Hazards Earth Syst. Sci. 2022, 22, 395–410. [Google Scholar] [CrossRef]
- Xie, J.; Li, B.; Jiao, H.; Zhou, Q.; Mei, Y.; Xie, D.; Wu, Y.; Sun, X.; Fu, Y. Water Level Change Monitoring Based on a New Denoising Algorithm Using Data from Landsat and ICESat-2: A Case Study of Miyun Reservoir in Beijing. Remote Sens. 2022, 14, 4344. [Google Scholar] [CrossRef]
- Kersten, T.; Mechelke, K.; Maziull, L. The International Archives of the Photogrammetry, Remote Sensing and Spatial Information Science. Emergence 2018, 4, XL-5. [Google Scholar]
- Li, G.Y.; Yao, J.Q.; Tang, X.M.; Ding, B.S.; Guo, J.Q. Research on automatic extraction method of GF-7 satellite laser elevation control points. In Proceedings of the 8 “China High Resolution Earth Observation Conference CHREOC”, Beijing, China, 5–8 November 2022. [Google Scholar]
- Yao, J.Q.; Qu, H.R.; Liu, R.; Zhu, H.; Hu, L.R.; Tang, X.M. Analysis of atmospheric detection algorithm for photon system laser altimeter satellite. Laser Optoelectron. Prog. 2022, 59, 2228002. [Google Scholar]
- Sun, W.; Jin, J.W.; Li, G.Y.; Yao, J.Q. Accuracy evaluation of laser altimeter satellite ICESat-2 monitoring water level of Taihu Lake. Sci. Surv. Mapp. 2021, 46, 6. [Google Scholar]
- Parrish, C.E.; Magruder, L.A.; Neuenschwander, A.L.; Forfinski-Sarkozi, N.; Alonzo, M.; Jasinski, M. Validation of ICESat-2 ATLAS bathymetry and analysis of ATLAS’s bathymetric mapping performance. Remote Sens. 2019, 11, 1634. [Google Scholar] [CrossRef] [Green Version]
- Xi, X.H.; Wang, Z.J.; Wang, C. Nearshore water depth extraction based on ICESat-2/ATLAS data. J. Tongji Univ. (Nat. Sci.) 2022, 50, 940–946. [Google Scholar]
- Guo, X.Z.; Jin, S.G. ICESat-2 laser altimetry is used to monitor the water level changes in the Three Gorges of the Yangtze River. Sci. Surv. Mapp. 2022, 47, 21–26. [Google Scholar]
- Ma, Y.; Xu, N.; Liu, Z.; Yang, B.; Yang, F.; Wang, X.H.; Li, S. Satellite-derived bathymetry using the ICESat-2 lidar and Sentinel-2 imagery datasets. Remote Sens. Environ. 2020, 250, 112047. [Google Scholar] [CrossRef]
- Xu, N.; Ma, X.; Ma, Y.; Zhao, P.; Yang, J.; Wang, X.H. Deriving highly accurate shallow water bathymetry from Sentinel-2 and ICESat-2 datasets by a multitemporal stacking method. IEEE J. Sel. Top. Appl. Earth Obs. Remote Sens. 2021, 14, 6677–6685. [Google Scholar] [CrossRef]
- Smith, B.; Fricker, H.A.; Holschuh, N.; Gardner, G.A.; Siegfried, M.R. Land ice height-retrieval algorithm for NASA’s ICESat-2 photon-counting laser altimeter. Remote Sens. Environ. 2019, 233, 111352. [Google Scholar] [CrossRef] [Green Version]
- Traganos, D.; Poursanidis, D.; Aggarwal, B.; Chrysoulakis, N.; Reinartz, P. Estimating satellite-derived bathymetry (SDB) with the google earth engine and sentinel-2. Remote Sens. 2018, 10, 859. [Google Scholar] [CrossRef] [Green Version]
- Melkamu, T.; Bagyaraj, M.; Adimaw, M.; Ngusie, A.; Karuppannan, S. Ice, Cloud, and Land Elevation Satellite–2 (ICESat-2) Project: Algorithm Theoretical Basis Document (ATBD) for Global Geolocated Photons (ATL03); National Aeronautics and Space Administration, Goddard Space Flight Center: Boulder, CO, USA, 2019; Volume 1. [Google Scholar]
- Zanaga, D.; Van, D.K.R.; De, K.W.; Souverijns, N.; Brockmann, C.; Quast, R.; Wevers, J.; Grosu, A.; Paccini, A.; Vergnaud, S.; et al. ESA WorldCover 10 m 2020 v100. Available online: https://ceos.org/gst/worldcover.html (accessed on 10 January 2022).
- Xin, L. Chinese Port Spatially Distributed Kilometers Grid Dataset. Resource and Environmental Science Data Registration and Publication System. Available online: https://www.resdc.cn/ (accessed on 10 January 2022).
- Feng, Q.; Wang, Q.; Huang, H.L.; Wang, Z.Q. Improved Otsu algorithm for water extraction based on Sentinel-1 dual-polarized data. Remote Sens. Technol. Appl. 2022, 37, 1003–1011. [Google Scholar]
- Tang, W.; Zhao, C.; Lin, J.; Jiao, C.; Zheng, G.; Zhu, J.; Pan, X.; Han, X. Improved Spectral Water Index Combined with Otsu Algorithm to Extract Muddy Coastline Data. Water 2022, 14, 855. [Google Scholar] [CrossRef]
- An, C.J.; Niu, Z.D.; Li, Z.J.; Chen, Z.P. Otsu threshold comparison and SAR water segmentation result analysis. J. Electron. Inf. Technol. 2010, 32, 2215–2219. [Google Scholar] [CrossRef]
- Stumpf, R.P.; Holderied, K.; Sinclair, M. Determination of water depth with high-resolution satellite imagery over variable bottom types. Limnol. Oceanogr. 2003, 48, 547–556. [Google Scholar] [CrossRef]
- Zhou, Z.B.; Zhou, H.; Ma, Y.; Song, Y.; Li, S. ICESat-2 lidar sea surface signal extraction and wave element calculation. Infrared Laser Eng. 2023, 52, 20220366-1. [Google Scholar]
- Han, Z.H.; Xu, B.S.; Yang, C.L.; Sun, Y.J. Research on water depth inversion of islands and reefs in the South China Sea based on Planet multi-spectral image. Geomat. Spat. Inf. Technol. 2020, 43, 139–142, 146. [Google Scholar]
- Qiao, B.; Zhu, L.; Wang, J.; Ju, J.; Ma, Q.; Liu, C. Estimation of lakes water storage and their changes on the northwestern Tibetan Plateau based on bathymetric and Landsat data and driving force analyses. Quat. Int. 2017, 454, 56–67. [Google Scholar] [CrossRef]
- Zhang, B.; Wu, Y.; Zhu, L.; Wang, J.; Li, J.; Chen, D. Estimation and trend detection of water storage at Nam Co Lake, central Tibetan Plateau. J. Hydrol. 2011, 405, 161–170. [Google Scholar] [CrossRef]
- Shi, R.Q.; Liu, N.; Li, L.; Ye, L.M.; Liu, X.D.; Guo, G.F. Application of rainstorm flood inundation model in flood loss assessment. Torrential Rain Disasters 2013, 32, 379–384. [Google Scholar]
- Yuan, C.; Gong, P.; Bai, Y. Performance assessment of ICESat-2 laser altimeter data for water-level measurement over lakes and reservoirs in China. Remote Sens. 2020, 12, 770. [Google Scholar] [CrossRef] [Green Version]
- Scawthorn, C.; Blais, N.; Seligson, H.; Tate, E.; Mifflin, E.; Thomas, W.; Murphy, J.; Jones, C. HAZUS-MH flood loss estimation methodology. I: Overview and flood hazard characterization. Nat. Hazards Rev. 2006, 7, 60–71. [Google Scholar] [CrossRef]
- Shi, Y. Vulnerability assessment of rainstorm waterlogging in urban residential buildings: A case study of Shanghai. J. Catastrophology 2015, 30, 94–98. [Google Scholar]
- Ouma, Y.O.; Tateishi, R. Urban flood vulnerability and risk mapping using integrated multi-parametric AHP and GIS: Methodological overview and case study assessment. Water 2014, 6, 1515–1545. [Google Scholar] [CrossRef] [Green Version]
- Dung, N.B.; Long, N.Q.; Goyal, R.; An, D.T.; Minh, D.T. The role of factors affecting flood hazard zoning using analytical hierarchy process: A review. Earth Syst. Environ. 2022, 6, 697–713. [Google Scholar] [CrossRef]
- Pradhan, B. Flood susceptible mapping and risk area delineation using logistic regression, GIS and remote sensing. J. Spat. Hydrol. 2010, 9, 4. [Google Scholar]
- Dung, N.B.; Minh, D.T.; Long, N.Q.; Ha, L.T.T. Weights of factors contributing to flood formation in the Lam River Basin, Vietnam. J. Southwest Jiaotong Univ. 2020, 55, 1–10. [Google Scholar] [CrossRef]
- Sepehri, M.; Malekinezhad, H.; Jahanbakhshi, F.; Ildoromi, A.R.; Chezgi, J.; Ghorbanzadeh, O.; Naghipour, E. Integration of interval rough AHP and fuzzy logic for assessment of flood prone areas at the regional scale. Acta Geophys. 2020, 68, 477–493. [Google Scholar] [CrossRef]
- Saini, S.S.; Kaushik, S.P. Risk and vulnerability assessment of flood hazard in part of Ghaggar Basin: A case study of Guhla block, Kaithal, Haryana, India. Int. J. Geomat. Geosci. 2012, 3, 42–54. [Google Scholar]
- Umar, N.K.; Abdullahi, H.S.; Usman, A.K. A multi-criteria decision support system in the analysis of flood risk and vulnerability mapping in Suleja, Niger state, Nigeria. In A Multi-Criteria Decision Support System in the Analysis of Flood Risk and Vulnerability Mapping in Suleja, Niger State, Nigeria, Proceedings of the ICA, Beijing, China, 10 July 2019; Copernicus GmbH: Göttingen, Germany, 2019; Volume 2, p. 137. [Google Scholar]
- Acosta-Coll, M.; Ballester-Merelo, F.; Martinez-Peiró, M.; De la Hoz-Franco, E. Real-time early warning system design for pluvial flash floods—A review. Sensors 2018, 18, 2255. [Google Scholar] [CrossRef] [PubMed] [Green Version]
- Henriksen, H.J.; Roberts, M.J.; van der Keur, P.; Harjanne, A.; Egilson, D.; Alfonso, L. Participatory early warning and monitoring systems: A Nordic framework for web-based flood risk management. Int. J. Disaster Risk Reduct. 2018, 31, 1295–1306. [Google Scholar] [CrossRef]
- Skilodimou, H.D.; Bathrellos, G.D.; Chousianitis, K.; Youssef, A.M.; Pradhan, B. Multi-hazard assessment modeling via multi-criteria analysis and GIS: A case study. Environ. Earth Sci. 2019, 78, 1–21. [Google Scholar] [CrossRef]
- Liu, Y.M.; Zhao, J.; Deng, R.R.; Liang, Y.H.; Gao, Y.K.; Chen, Q.D.; Xiong, L.H.; Liu, Y.F.; Tang, Y.M.; Tang, D.L. A downscaled bathymetric mapping approach combining multitemporal Landsat-8 and high spatial resolution imagery: Demonstrations from clear to turbid waters. ISPRS J. Photogramm. Remote Sens. 2021, 180, 65–81. [Google Scholar] [CrossRef]
- Zhou, W.N.; Tang, Y.M.; Jing, W.L.; Li, Y.; Yang, J.; Deng, Y.B.; Zhang, Y.M. A Comparison of Machine Learning and Empirical Approaches for Deriving Bathymetry from Multispectral Imagery. Remote Sens. 2023, 15, 393. [Google Scholar] [CrossRef]
- Guo, X.Z.; Jin, X.Y.; Jin, S.G. Shallow Water Bathymetry Mapping from ICESat-2 and Sentinel-2 Based on BP Neural Network Model. Water 2022, 14, 3862. [Google Scholar] [CrossRef]
Figure 1.
Location of the study area (a) in China and (b) in Anhui province and (c) the Sentinel-2 imagery representing 10 August 2020, over the study area. The figure was plotted by Arcmap10.4 software (projection: WGS84-based Universal Transverse Mercator Zone 49N).
Figure 1.
Location of the study area (a) in China and (b) in Anhui province and (c) the Sentinel-2 imagery representing 10 August 2020, over the study area. The figure was plotted by Arcmap10.4 software (projection: WGS84-based Universal Transverse Mercator Zone 49N).

Figure 2.
ATLAS beam direction.

Figure 3.
Research framework diagram.

Figure 4.
Study area image pixel histogram.

Figure 5.
The water extraction results of the study area: (a) the sentinel-2 image and (b) the water extraction results.
Figure 5.
The water extraction results of the study area: (a) the sentinel-2 image and (b) the water extraction results.

Figure 6.
Otsu algorithm water extraction details.

Figure 7.
Flood distribution in the study area.

Figure 8.
Photon laser trajectory and water distribution diagram before flood disaster.

Figure 9.
Photon laser trajectory and water distribution diagram after flood disaster.

Figure 10.
Photon extraction results of water surface signal in the sampling area.

Figure 11.
Water level measurement results before and after flood disaster: (a) before the flood and (b) after the flood.
Figure 11.
Water level measurement results before and after flood disaster: (a) before the flood and (b) after the flood.

Figure 12.
Flood submerged water depth.

Figure 13.
(a) The difference between the total precipitation in July and the total precipitation in June in the study area; (b) the terrain of study area; and (c) the soil saturation in the study area.
Figure 13.
(a) The difference between the total precipitation in July and the total precipitation in June in the study area; (b) the terrain of study area; and (c) the soil saturation in the study area.

Figure 14.
Information on land use changes before and after the floods. (a) The pre-disaster land use data; (b) the post-disaster land use data; and (c) the land use changes before and after the flood.
Figure 14.
Information on land use changes before and after the floods. (a) The pre-disaster land use data; (b) the post-disaster land use data; and (c) the land use changes before and after the flood.


Table 1.
Collected data and their source.
| Data Type | Dataset Name | Resolution | Source |
|---|---|---|---|
| Depth measurement data | ICEsat-2 | https://nsidc.org/data/icesat-2/data-sets (accessed on 20 December 2022) [28] | |
| Sentinel-2 | 10 m | Google Earth Engine [27] | |
| Water surface measurement data | Sentinel-2 | 10 m | Google Earth Engine [27] |
| Topographic data | DEM | 12.5 m | NASA |
| Land cover type data | Land use data | 10 m | https://ceos.org/gst/worldcover.html (accessed on 10 January 2022) [29] |
| Population distribution data | China’s population spatial distribution km grid dataset | 1 km | https://www.resdc.cn/ (accessed on 10 January 2022) [30] |
Table 2.
Statistics of water volume in flood area.
| Number | Flood Area | Depth/m | Area/km2 | Volume/Thousand m3 |
|---|---|---|---|---|
| 1 | Jiangtang Lake | 6 | 283.32 | 1,699,920 |
| 2 | Nanrun Section | 3 | 117.79 | 353,370 |
| 3 | Chengxi Lake | 4 | 77.09 | 308,360 |
| 4 | Chengdong Lake | 3 | 152.14 | 456,420 |
| 5 | North Lake | 4 | 3.85 | 15,400 |
Table 3.
Statistics of main land cover disaster.
| Land Cover Types | Inundated Area/km2 | Loss Rate% | Lost Area/km2 | Economic Losses/ CNY Billion |
|---|---|---|---|---|
| Cropland | 559.9 | 100 | 559.9 | 6.5 |
| Trees | 3.2 | 30 | 0.96 | 0.01 |
| Open water | 41.9 | 100 | 41.9 | 0.54 |
| Grassland | 2.7 | 40 | 1.08 | 0.01 |
| Building | 137.1 | 20 | 27.42 | 0.35 |
Disclaimer/Publisher’s Note: The statements, opinions and data contained in all publications are solely those of the individual author(s) and contributor(s) and not of MDPI and/or the editor(s). MDPI and/or the editor(s) disclaim responsibility for any injury to people or property resulting from any ideas, methods, instructions or products referred to in the content. |
© 2023 by the authors. Licensee MDPI, Basel, Switzerland. This article is an open access article distributed under the terms and conditions of the Creative Commons Attribution (CC BY) license (https://creativecommons.org/licenses/by/4.0/).
Share and Cite
MDPI and ACS Style
Cao, Y.; Wang, M.; Yao, J.; Mo, F.; Zhu, H.; Hu, L.; Zhai, H. Stereoscopic Monitoring Methods for Flood Disasters Based on ICESat-2 and Sentinel-2 Data. Remote Sens. 2023, 15, 3015. https://0-doi-org.brum.beds.ac.uk/10.3390/rs15123015
AMA Style
Cao Y, Wang M, Yao J, Mo F, Zhu H, Hu L, Zhai H. Stereoscopic Monitoring Methods for Flood Disasters Based on ICESat-2 and Sentinel-2 Data. Remote Sensing. 2023; 15(12):3015. https://0-doi-org.brum.beds.ac.uk/10.3390/rs15123015
Chicago/Turabian StyleCao, Yongqiang, Mengran Wang, Jiaqi Yao, Fan Mo, Hong Zhu, Liuru Hu, and Haoran Zhai. 2023. "Stereoscopic Monitoring Methods for Flood Disasters Based on ICESat-2 and Sentinel-2 Data" Remote Sensing 15, no. 12: 3015. https://0-doi-org.brum.beds.ac.uk/10.3390/rs15123015
Note that from the first issue of 2016, this journal uses article numbers instead of page numbers. See further details here.