

An Efficient Object Detection Algorithm Based on Improved YOLOv5 for High-Spatial-Resolution Remote Sensing Images
 ,
,
Abstract
: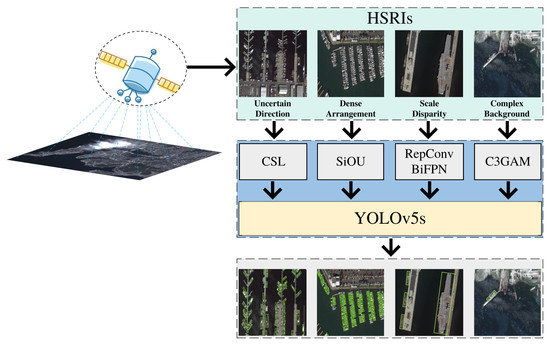
1. Introduction
- Our proposal designs a RepConv module that enhances the detection accuracy of small-scale objects without introducing additional inference time. Additionally, we incorporate a Transformer Encoder structure to capture global contextual information, thereby improving the detection accuracy of large-scale objects. In order to achieve a balance in feature information across various scales and enhance the detection accuracy of multi-scale objects, we substitute the PANet structure in YOLOv5 with BiFPN.
- To address the interference caused by complex background regions in HSRIs, we design a C3GAM module by introducing the GAM attention mechanism, which aids the model in effectively localizing regions that contain the target.
- To enhance the localization accuracy of anchor boxes and improve the precision of boundary recognition in HSRIs with dense object arrangements, we incorporate the SIoU loss function.
- To tackle the issue of uncertain target direction and mitigate the problem of disjointed boundaries caused by angle regression, we suggest the adoption of the circular smooth label method as an effective solution.
2. Network Structure of YOLOv5
2.1. Backbone
2.2. Neck
2.3. Head
3. Our Work
3.1. RepConv Module
3.2. Transformer Encoder Module
3.3. C3GAM Module
3.4. SIoU Loss Function Module
- (1)
- Angle cost
- (2)
- Distance cost
- (3)
- Shape cost
- (4)
- IoU cost
3.5. BiFPN Module
3.6. CSL (Circular Smooth Label) Module
3.7. IDetect Module
4. Experiments
4.1. Dataset
4.2. Experimental Parameter Settings
4.3. Experimental Evaluation Metrics
4.4. Analysis of Experimental Results
4.4.1. Analysis of the Experimental Results on HRSC2016
4.4.2. Analysis of the Experimental Results on UCAS-AOD
4.5. Ablation Experiments
5. Conclusions and Future Works
Author Contributions
Funding
Data Availability Statement
Acknowledgments
Conflicts of Interest
References
- Li, J.; Liu, H.; Du, J.; Cao, B.; Zhang, Y.; Yu, W.; Zhang, W.; Zheng, Z.; Wang, Y.; Sun, Y.; et al. Detection of Smoke from Straw Burning Using Sentinel-2 Satellite Data and an Improved YOLOv5s Algorithm. Remote Sens. 2023, 15, 2641. [Google Scholar] [CrossRef]
- Qu, J.; Tang, Z.; Zhang, L.; Zhang, Y.; Zhang, Z. Remote Sensing Small Object Detection Network Based on Attention Me-chanism and Multi-Scale Feature Fusion. Remote Sens. 2023, 15, 2728. [Google Scholar] [CrossRef]
- Yu, N.; Ren, H.; Deng, T.; Fan, X. A Lightweight Radar Ship Detection Framework with Hybrid Attentions. Remote Sens. 2023, 15, 2743. [Google Scholar] [CrossRef]
- Girshick, R. Fast r-cnn. In Proceedings of the IEEE International Conference on Computer Vision, Santiago, Chile, 7–13 December 2015; pp. 1440–1448. [Google Scholar]
- Girshick, R.; Donahue, J.; Darrell, T.; Malik, J. Rich Feature Hierarchies for Accurate Object Detection and Semantic Segmentation. In Proceedings of the IEEE Conference on Computer Vision and Pattern Recognition, Columbus, OH, USA, 23–28 June 2014; pp. 580–587. [Google Scholar]
- Ren, S.; He, K.; Girshick, R.; Sun, J. Faster R-CNN: Towards Real-time Object Detection with Region Proposal Networks. Adv. Neural Inf. Process. Syst. 2015, 28, 91–99. [Google Scholar] [CrossRef] [PubMed] [Green Version]
- Liu, W.; Anguelov, D.; Erhan, D.; Szegedy, C.; Reed, S.; Fu, C.-Y.; Berg, A.C. Ssd: Single Shot Multiboot Detector. In Proceedings of the European Conference on Computer Vision, Amsterdam, The Netherlands, 11–14 October 2016; pp. 21–37. [Google Scholar]
- Bochkovskiy, A.; Wang, C.-Y.; Liao, H.-Y.M. Yolov4: Optimal Speed and Accuracy of Object Detection. arXiv 2020, arXiv:2004.10934. [Google Scholar]
- Jiang, Y.; Zhu, X.; Wang, X.; Yang, S.; Li, W.; Wang, H.; Fu, P.; Luo, Z. R2CNN: Rotational Region CNN for Orientation Robust Scene Text Detection. arXiv 2017, arXiv:1706.09579. [Google Scholar]
- Ding, J.; Xue, N.; Long, Y.; Xia, G.; Lu, Q. Learning Roi Transformer for Oriented Object Detection in Aerial Images. In Proceedings of the IEEE Conference on Computer Vision and Pattern Recognition, Long Beach, CA, USA, 15–20 June 2019; pp. 2849–2858. [Google Scholar]
- Zhang, Z.; Guo, W.; Zhu, S.; Yu, W. Toward Arbitrary-oriented Ship Detection with Rotated Region Proposal and Discrimination Networks. IEEE Geosci. Remote Sens. 2018, 15, 1745–1749. [Google Scholar] [CrossRef]
- Yang, X.; Sun, H.; Fu, K.; Yang, J.; Sun, X.; Yan, M.; Guo, Z. Automatic Ship Detection in Remote Sensing Images from Google Earth of Complex Scenes based on Multiscale Rotation Dense Feature Pyramid Networks. Remote Sens. 2018, 10, 132. [Google Scholar] [CrossRef] [Green Version]
- Azimi, S.M.; Vig, E.; Bahmanyar, R.; Körner, M.; Reinartz, P. Towards Multi-class Object Detection in Unconstrained Remote Sensing Imagery. In Proceedings of the 14th Asian Conference on Computer Vision, Perth, Australia, 2–6 December 2018; pp. 150–165. [Google Scholar]
- Lin, T.-Y.; Goyal, P.; Girshick, R.; He, K.; Dollár, P. Focal Loss for Dense Object Detection. In Proceedings of the IEEE International Conference on Computer Vision, Venice, Italy, 22–29 October 2017; pp. 2980–2988. [Google Scholar]
- Ming, Q.; Zhou, Z.; Miao, L.; Zhang, H.; Li, L. Dynamic Anchor Learning for Arbitrary-oriented Object Detection. Proc. AAAI Conf. Artif. Intell. 2021, 35, 2355–2363. [Google Scholar] [CrossRef]
- Qian, W.; Yang, X.; Peng, S.; Yan, J.; Guo, Y. Learning Modulated Loss for Rotated Object Detection. Proc. AAAI Conf. Artif. Intell. 2021, 35, 2458–2466. [Google Scholar] [CrossRef]
- Yang, X.; Yan, J.; Feng, Z.; He, T. R3det: Refined Single-stage Detector with Feature Refinement for Rotating Object. Proc. AAAI Conf. Artif. Intell. 2021, 35, 3163–3171. [Google Scholar] [CrossRef]
- Han, J.; Ding, J.; Li, J.; Xia, G.; Sensing, R. Align Deep Features for Oriented Object Detection. IEEE Trans. Geosci Remote Sens. 2021, 60, 1–11. [Google Scholar] [CrossRef]
- Redmon, J.; Divvala, S.; Girshick, R.; Farhadi, A. You Only Look Once: Unified, Real-time Object Detection. In Proceedings of the IEEE Conference on Computer Vision and Pattern Recognition, Las Vegas, NV, USA, 27–30 June 2016; pp. 779–788. [Google Scholar]
- Choi, J.; Chun, D.; Kim, H.; Lee, H.-J. Gaussian Yolov3: An Accurate and Fast Object Detector Using Localization Uncertainty for Autonomous Driving. In Proceedings of the IEEE International Conference on Computer Vision, Seoul, Republic of Korea, 27 October–2 November 2019; pp. 502–511. [Google Scholar]
- Redmon, J.; Farhadi, A. Yolov3: An Incremental Improvement. arXiv 2018, arXiv:1804.02767. [Google Scholar]
- Wang, D.; Liu, Z.; Gu, X.; Wu, W.; Chen, Y.; Wang, L. Automatic Detection of Pothole Distress in Asphalt Pavement Using Improved Convolutional Neural Networks. Remote Sens. 2022, 14, 3892. [Google Scholar] [CrossRef]
- Wu, W.; Liu, H.; Li, L.; Long, Y.; Wang, X.; Wang, Z.; Chang, Y. Application of Local Fully Convolutional Neural Network Combined with YOLOv5 Algorithm in Small Target Detection of Remote Sensing Image. PLoS ONE 2021, 16, e0259283. [Google Scholar] [CrossRef]
- Zhang, Y.; Guo, Z.; Wu, J.; Tian, Y.; Tang, H.; Guo, X. Real-time Vehicle Detection Based on Improved Yolov5. Sustainability 2022, 14, 12274. [Google Scholar] [CrossRef]
- Zhao, Q.; Liu, B.; Lyu, S.; Wang, C.; Zhang, H. TPH-YOLOv5++: Boosting Object Detection on Drone-captured Scenarios with Cross-layer Asymmetric Transformer. Remote Sens. 2023, 15, 1687. [Google Scholar] [CrossRef]
- Li, C.; Li, L.; Geng, Y.; Jiang, H.; Cheng, M.; Zhang, B.; Ke, Z.; Xu, X.; Chu, X. Yolov6 v3.0: A Full-scale Reloading. arXiv 2023, arXiv:2301.05586. [Google Scholar]
- Wang, C.; Bochkovskiy, A.; Liao, H.-Y.M. YOLOv7: Trainable Bag-of-freebies Sets New State-of-the-art for Real-time Object Detectors. In Proceedings of the IEEE/CVF Conference on Computer Vision and Pattern Recognition, Vancouver, Canada, 18–22 June 2023; pp. 7464–7475. [Google Scholar]
- Ding, X.; Zhang, X.; Ma, N.; Han, J.; Ding, G.; Sun, J. Repvgg: Making Vgg-style Convnets Great Again. In Proceedings of the IEEE Conference on Computer Vision and Pattern Recognition, Nashville, TN, USA, 20–25 June 2021; pp. 13733–13742. [Google Scholar]
- Liu, Y.; Shao, Z.; Hoffmann, N. Global Attention Mechanism: Retain Information to Enhance Channel-spatial Interactions. arXiv 2021, arXiv:2112.05561. [Google Scholar]
- Zheng, Z.; Wang, P.; Ren, D.; Liu, W.; Ye, R.; Hu, Q.; Zuo, W. Enhancing Geometric Factors in Model Learning and Inference for Object Detection and Instance Segmentation. IEEE Trans. Cybern. 2021, 52, 8574–8586. [Google Scholar]
- Zheng, Z.; Wang, P.; Liu, W.; Li, J.; Ye, R.; Ren, D. Distance-IoU loss: Faster and Better Learning for Bounding Box Regression. Proc. AAAI Conf. Artif. Intell. 2020, 34, 12993–13000. [Google Scholar] [CrossRef]
- Gevorgyan, Z. SIoU loss: More Powerful Learning for Bounding Box Regression. arXiv 2022, arXiv:2205.12740. [Google Scholar]
- Lin, T.-Y.; Dollár, P.; Girshick, R.; He, K.; Hariharan, B.; Belongie, S. Feature Pyramid Networks for Object Detection. In Proceedings of the IEEE Conference on Computer Vision and Pattern Recognition, Honolulu, HI, USA, 21–26 July 2017; pp. 2117–2125. [Google Scholar]
- Liu, S.; Qi, L.; Qin, H.; Shi, J.; Jia, J. Path Aggregation Network for Instance Segmentation. In Proceedings of the IEEE Conference on Computer Vision and Pattern Recognition, Salt Lake City, UT, USA, 18–23 June 2018; pp. 8759–8768. [Google Scholar]
- Ghiasi, G.; Lin, T.-Y.; Le, Q.V. Nas-fpn: Learning Scalable Feature Pyramid Architecture for Object Detection. In Proceedings of the IEEE Conference on Computer Vision and Pattern Recognition, Long Beach, CA, USA, 15–20 June 2019; pp. 7036–7045. [Google Scholar]
- Tan, M.; Pang, R.; Le, Q.V. Efficientdet: Scalable and Efficient Object Detection. In Proceedings of the IEEE Conference on Computer Vision and Pattern Recognition, Seattle, WA, USA, 13–19 June 2020; pp. 10781–10790. [Google Scholar]
- Yang, X.; Yan, J. Arbitrary-oriented Object Detection with Circular Smooth Label. In Proceedings of the European Conference on Computer Vision, Glasgow, UK, 23–28 August 2020; pp. 677–694. [Google Scholar]
- Liu, Z.; Yuan, L.; Weng, L.; Yang, Y. A High Resolution Optical Satellite Image Dataset for Ship Recognition and Some New Baselines. In Proceedings of the 6th International Conference on Pattern Recognition Applications and Methods, Porto, Portugal, 24–26 February 2017; pp. 324–331. [Google Scholar]
- Ma, J.; Shao, W.; Ye, H.; Wang, L.; Wang, H.; Zheng, Y.; Xue, X. Arbitrary-oriented Scene Text Detection via Rotation Proposals. IEEE Trans. Multimed. 2018, 20, 3111–3122. [Google Scholar] [CrossRef] [Green Version]
- Xu, Y.; Fu, M.; Wang, Q.; Wang, Y.; Chen, K.; Xia, G.; Bai, X. Gliding Vertex on the Horizontal Bounding Box for Multi-Oriented Object Detection. IEEE Trans. Pattern Anal. Mach. Intell. 2020, 43, 1452–1459. [Google Scholar] [CrossRef] [Green Version]
- Liao, M.; Zhu, Z.; Shi, B.; Xia, G.; Bai, X. Rotation-sensitive Regression for Oriented Scene Text Detection. In Proceedings of the IEEE Conference on Computer Vision and Pattern Recognition, Salt Lake City, UT, USA, 18–23 June 2018; pp. 5909–5918. [Google Scholar]
- Chen, Z.; Chen, K.; Lin, W.; See, J.; Yu, H.; Ke, Y.; Yang, C. PIoU Loss: Towards Accurate Oriented Object Detection in Complex Environments. In Proceedings of the European Conference on Computer Vision, Glasgow, UK, 23–28 August 2020; pp. 195–211. [Google Scholar]
- Yang, X.; Hou, L.; Zhou, Y.; Wang, W.; Yan, J. Dense Label Encoding for Boundary Discontinuity Free Rotation Detection. In Proceedings of the IEEE Conference on Computer Vision and Pattern Recognition, Nashville, TN, USA, 20–25 June 2021; pp. 15819–15829. [Google Scholar]
- Yi, J.; Wu, P.; Liu, B.; Huang, Q.; Qu, H.; Metaxas, D. Oriented Object Detection in Aerial Images with Box Boundary-Aware Vectors. In Proceedings of the IEEE Winter Conference on Applications of Computer Vision, Virtual, 5–9 January 2021; pp. 2150–2159. [Google Scholar]


| Algorithms | Backbone | Size | Number of Anchors | mAP (%) |
|---|---|---|---|---|
| Two-stage: | ||||
| R2CNN [9] | ResNet101 | 800 × 800 | 21 | 73.07 |
| RC1 and RC2 [38] | VGG16 | - | - | 75.70 |
| RRPN [39] | ResNet101 | 800 × 800 | 54 | 79.08 |
| R2PN [11] | VGG16 | - | 24 | 79.60 |
| RoITrans [10] | ResNet101 | 512 × 800 | 5 | 86.20 |
| Gliding Vertex [40] | ResNet101 | 512 × 800 | 5 | 88.20 |
| One-stage: | ||||
| RRD [41] | VGG16 | 384 × 384 | 13 | 84.30 |
| R3Det [17] | ResNet101 | 800 × 800 | 21 | 89.26 |
| R-Retinanet [14] | ResNet101 | 800 × 800 | 121 | 89.18 |
| PIOU [42] | DLA-34 | 512 × 512 | - | 89.20 |
| R3Det-DCL [43] | ResNet101 | 800 × 800 | 21 | 89.46 |
| FPN-CSL [37] | ResNet101 | 800 × 800 | 21 | 89.62 |
| DAL [15] | ResNet101 | 800 × 800 | 3 | 89.77 |
| S2A-Net [18] | ResNet101 | 1024 × 1024 | 1 | 90.17 |
| BBAVectors [44] | ResNet101 | 608 × 608 | - | 88.60 |
| YOLOv6 [26] | EfficientRep | 1024 × 1024 | - | 85.42 |
| YOLOv7 [27] | ELAN-Net | 1024 × 1024 | 3 | 86.11 |
| YOLOv8 | CSP-DarkNet | 1024 × 1024 | - | 85.70 |
| Ours | YOLOv5s | 1024 × 1024 | 3 | 90.29 |
| Algorithms | Car (%) | Airplane (%) | mAP (%) |
|---|---|---|---|
| YOLOv3-O [21] | 74.63 | 89.52 | 82.08 |
| RetinaNet-O [14] | 84.64 | 90.51 | 87.57 |
| Faster R-CNN-O [6] | 86.87 | 89.86 | 88.36 |
| RoITrans [10] | 87.99 | 89.90 | 88.95 |
| DAL [15] | 89.25 | 90.49 | 89.87 |
| YOLOv6 [26] | 88.96 | 90.46 | 89.71 |
| YOLOv7 [27] | 89.05 | 90.42 | 89.73 |
| YOLOv8 | 89.28 | 90.45 | 89.87 |
| Ours | 89.60 | 90.53 | 90.06 |
| Different Variants | ||||||
|---|---|---|---|---|---|---|
| SIoU | √ | √ | √ | √ | √ | √ |
| GAM | √ | √ | √ | √ | √ | |
| Transformer Encoder | √ | √ | √ | √ | ||
| BiFPN | √ | √ | √ | |||
| RepConv | √ | √ | ||||
| IDetect | √ | |||||
| mAP(%) | 89.03 | 89.55 | 89.80 | 90.07 | 90.12 | 90.29 |
| Different Variants | ||||||
|---|---|---|---|---|---|---|
| SIoU | √ | √ | √ | √ | √ | √ |
| GAM | √ | √ | √ | √ | √ | |
| Transformer Encoder | √ | √ | √ | √ | ||
| BiFPN | √ | √ | √ | |||
| RepConv | √ | √ | ||||
| IDetect | √ | |||||
| mAP(%) | 87.32 | 87.93 | 88.60 | 89.44 | 89.91 | 90.06 |
Disclaimer/Publisher’s Note: The statements, opinions and data contained in all publications are solely those of the individual author(s) and contributor(s) and not of MDPI and/or the editor(s). MDPI and/or the editor(s) disclaim responsibility for any injury to people or property resulting from any ideas, methods, instructions or products referred to in the content. |
© 2023 by the authors. Licensee MDPI, Basel, Switzerland. This article is an open access article distributed under the terms and conditions of the Creative Commons Attribution (CC BY) license (https://creativecommons.org/licenses/by/4.0/).
Share and Cite
Cao, F.; Xing, B.; Luo, J.; Li, D.; Qian, Y.; Zhang, C.; Bai, H.; Zhang, H. An Efficient Object Detection Algorithm Based on Improved YOLOv5 for High-Spatial-Resolution Remote Sensing Images. Remote Sens. 2023, 15, 3755. https://0-doi-org.brum.beds.ac.uk/10.3390/rs15153755
Cao F, Xing B, Luo J, Li D, Qian Y, Zhang C, Bai H, Zhang H. An Efficient Object Detection Algorithm Based on Improved YOLOv5 for High-Spatial-Resolution Remote Sensing Images. Remote Sensing. 2023; 15(15):3755. https://0-doi-org.brum.beds.ac.uk/10.3390/rs15153755
Chicago/Turabian StyleCao, Feng, Bing Xing, Jiancheng Luo, Deyu Li, Yuhua Qian, Chao Zhang, Hexiang Bai, and Hu Zhang. 2023. "An Efficient Object Detection Algorithm Based on Improved YOLOv5 for High-Spatial-Resolution Remote Sensing Images" Remote Sensing 15, no. 15: 3755. https://0-doi-org.brum.beds.ac.uk/10.3390/rs15153755