Article

An Approach for Monitoring Shallow Surface Outcrop Mining Activities Based on Multisource Satellite Remote Sensing Data

1
School of Geophysics and Geomatics, China University of Geosciences, Wuhan 430074, China
2
Wuhan Center, China Geological Survey (Central South China Innovation Center for Geosciences), Wuhan 430205, China
3
Geological Environmental Center of Hubei Province, Wuhan 430034, China
4
Ningxia Survey and Monitor Institute of Land and Resources, Yinchuan 750002, China
*
Author to whom correspondence should be addressed.
Remote Sens. 2023, 15(16), 4062; https://0-doi-org.brum.beds.ac.uk/10.3390/rs15164062
Submission received: 18 July 2023 / Revised: 14 August 2023 / Accepted: 15 August 2023 / Published: 17 August 2023
(This article belongs to the Special Issue Remote Sensing for Geology and Mapping)

Abstract

:
Monitoring mine activities can help management track the status of mineral resource exploration and mine rehabilitation. It is crucial to the sustainable development of the mining industry and the protection of the geological environment in mining areas. To monitor the mining activities of shallow surface outcrops in the arid and semi-arid regions of northwest China, this paper proposes a remote sensing monitoring approach of mining activities based on deep learning and integrated interferometric synthetic aperture radar technique. This approach uses the DeepLabV3-ResNet model to identify and extract the spatial location of the mine patches and then uses object-oriented analysis and spatial analysis methods to optimize the mine patch boundaries. SBAS-InSAR technique is used to obtain the time-series deformation information of the mine patches and is combined with the multi-temporal optical imagery to analyze the mining activities in the study area. The proposed approach has a recognition accuracy of 95.80% for the identification and extraction of mine patches, with an F1-score of 0.727 at the pixel level, and the average area similarity for all patches is 0.78 at the object-oriented level. The proposed approach possesses the capability to analyze mining activities, indicating promising prospects for engineering applications. It provides a reference for monitoring mining activities using multisource satellite remote sensing.

Graphical Abstract

1. Introduction

Northwest China is abundant in mineral resources, providing a large amount of raw materials for the manufacturing and energy industries. The mining industry has become the backbone of the local economy [1]. However, the geological environment of the region is relatively fragile due to the strong effects of both the endogenic force (e.g., volcanism and crustal movement) and the exogenic force (e.g., weathering, denudation, transportation, and accumulation). Mining activities, especially open-pit mining, further exacerbate the disturbance of the geological environment, destroying surface soils and natural vegetation and disrupting ecosystem service flows [2,3,4]. Monitoring mining activities and the progress of mine rehabilitation is essential to promote sustainability in China’s manufacturing industry’s upstream supply chain and preserve the mining area’s geological environment.
The conventional approach to monitoring the geo-environment of mining involves field investigations, local inspections, and public supervision. However, limited by the topographic conditions of mines and the level of cooperation of the mining companies, these approaches suffer from low efficiency and are problematic in maintaining credibility and impartiality. The obtained mining activities information is often delayed and is susceptible to being omitted. It is not easy to monitor the geological environment of mines promptly and precisely. Remote sensing technology captures large-scale ground surface information and provides long-term dynamic observation, making it an indispensable data source for monitoring the geological environment of mines in recent years.
Optical remote sensing is a well-established technique for monitoring mining areas. Multi-temporal imageries can be utilized to extract mining-related patches, such as open pits, ore heaps, waste rock dumps, and tailings reservoirs, and allow for tracking ongoing mining activities, monitoring mining geo-environment problems, assessing environmental concerns, and evaluating the progress of mine rehabilitation efforts [5,6,7,8,9]. Optical remote sensing monitoring methods can be categorized into two main approaches: knowledge-based and data-driven.
The knowledge-based approach relies on a priori knowledge of the mine patch features. Spectral data of different mine features (e.g., coal, gangue, tailings, etc.) are first collected using the spectrometer. The spectral curves are then analyzed to develop inversion models identifying specific mine patches, such as coal heaps, gangue dumps, and tailing reservoirs [10,11,12,13,14,15]. However, spectral curve collection, analysis, and inversion model construction are time-consuming and labor-intensive when dealing with large spatial extents. Additionally, high-resolution satellite images often have limited spectral bands; for instance, the commonly used SPOT, GeoFen, and ZiYuan series [16,17] offer three or four bands that include only visible and near-infrared wavelengths. The sparse spectral information restricts the implementation of some inversion models.
The data-driven approach does not require prior knowledge but extracts the required information directly from the data. Researchers have already utilized SVM, RF, CNN, FCN, U-Net, etc. [17,18,19,20,21,22,23] to extract open pits tailings reservoirs and classify land use and land cover in mining areas. Over the past few years, deep learning techniques have become increasingly popular in mine environmental monitoring [24,25,26]. Unlike traditional machine learning algorithms that need to construct and select relevant features, deep learning methods can autonomously learn the most representative and separable features without manual feature construction or rules design [27]. The hierarchical end-to-end learning model of deep learning substantially enhances the level of automation and intelligence in remote sensing monitoring of mine environments.
However, the models often cannot produce satisfactory results directly in practical production. Creating a deep learning model for monitoring mining areas requires large and representative training samples. The mining area occupies only a small fraction of the overall surface, and the morphology of mine patches can vary greatly due to factors such as deposit structure, the spatial distribution of underground veins, geographic and geomorphic conditions, mineral type, mining processes, and the duration of mining. In such conditions, collecting sufficient samples and training a robust deep-learning model is difficult. The model will inevitably produce inaccurate mine patch boundaries. The object-based image analysis (OBIA) method can compensate for this shortcoming [28,29]. The OBIA divides the image scene into sub-regions based on the objects’ spectral, geometric, and textural homogeneity or heterogeneity characteristics [30]. The divided boundaries can help to optimize the results generated by the deep learning model.
In this paper, an approach that combines deep learning and OBIA is presented to extract mine patches. Additionally, adverse weather conditions can disrupt the acquisition of optical remote sensing images, making it difficult to obtain uninterrupted data over consecutive months. This paper employs time-series synthetic aperture radar (SAR) images to generate continuous surface deformation. The surface dynamics information combined with optical imagery is used to monitor the activities of mine patches.

2. Method

2.1. Materials

2.1.1. Study Area

The study area is located at the border between Ningxia Hui Autonomous Region and Inner Mongolia Autonomous Region in northwest China, as illustrated in Figure 1. The geographic coordinates of the area span from 105.39°E to 105.64°E in longitude and from 37.59°N to 37.70°N in latitude. The study area covers an area of 272.57 km2 and has an elevation ranging from 1253 to 1638 m.
The area belongs to the Weiningbeishan region, situated in the transitional zone between the Tengger Desert and the Ningxia Plain. The topography of this region primarily comprises medium-low mountains and hills. It experiences a temperate continental arid climate with an average annual precipitation of less than 180 mm. The dominant vegetation type is the steppe desert. The outcropping strata in this region are primarily the Devonian and Carboniferous systems. The stratigraphy of this region represents a suite of clastic-carbonatite construction gypsum-bearing, indicative of a marine-continental interactional sedimentary environment. Magmatic activity in the region is relatively limited, with rare occurrences of magmatic rocks exposed. The quartz diorite porphyrite veins intruded into Upper Devonian and Lower Carboniferous strata during the Indosinian-Yanshanian Orogeny exhibit significant mineralization potential. The Upper Devonian Laojunshan Formation and the Lower Carboniferous Qianheishan Formation are the main ore-bearing strata in this region. The east–west trending faults formed during the Indosinian Orogeny and the secondary faults generated by subsequent tectonic movements are the main ore-controlling structures.
The extended period of uninterrupted mining has led to the emergence of numerous small-scale and dispersed mine patches within the study area. Illicit mining activities also exist in remote mountainous regions and shallow outcrop sites. These activities have resulted in the devastation of land resources, the degradation of delicate natural ecosystems, and the creation of concealed hazards to mine safety.
The mineral species are mainly iron, clay, sandstone, and coal. Except for coal, mined underground, all other minerals are mined in open-pit mining. The main focus of mining activity monitoring in this paper is on open pits and gangue dumps. The detailed description of the interpretation signs in true color remote sensing imagery is as follows (Figure 2):
(a)
Coal gangue dumps: Coal gangue dumps are often distributed in the coal mine area. The color is gray to gray-black. The patches often have an irregular polygon shape with clear demarcation from the surrounding land. The artificial extraction and accumulation traces are obvious in the patches.
(b)
Iron ore open pits: The color is grayish yellow, light red, reddish brown to brown. The texture of the patches is characterized by clumps or strips. The mining and excavation traces left by mechanical mining equipment are obvious.
(c)
Clay open pits: The color is whitish gray to grayish yellow. The texture of the patches is blurred and shows a more homogeneous pattern. There are obvious artificial excavation and extraction traces in the spot, which is different from the surrounding natural mountains.
(d)
Sandstone open pits: The color is gray to light gray, with high brightness. The texture of the patches is obvious and messy. The hillside pit exhibits positive topography. The depressed pit exhibits negative topography with near-circular or stratified terraces.

2.1.2. Data Sources

The datasets used in this study include high-resolution optical satellite imagery, time-series SAR data, and Land Use/Land Cover data products.
The Gaofen-2 (GF-2) satellite was the primary high-resolution optical satellite imagery source. It possesses a spatial resolution of 1 m for visible light bands. In this paper, digital orthophoto maps (DOMs) of the study area were generated for two distinct periods: 2019 and 2021.
The time-series Sentinel-1A Single Look Complex (SLC) SAR data were utilized for detecting mining activities. These data can be downloaded from the ASF Search Vertex platform at https://search.asf.alaska.edu/ (accessed on 17 December 2022). A total of 90 acquisitions in ascending track from 1 January 2019 to 30 December 2021 were collected, and detailed data information is presented in Table 1. Additionally, the POD Precise Orbit Ephemerides (AUX_POEORB) and the 30 m Shuttle Radar Topography Mission (SRTM) digital elevation model (DEM) were utilized to improve the orbit parameters and remove topographic phases. The GACOS (Generic Atmospheric Correction Online Service for InSAR) atmospheric data is also introduced on the same day as the SAR data to assist in atmospheric correction [31,32,33].
Land cover categories were obtained from ESA WorldCover Maps (https://viewer.esa-worldcover.org/worldcover/ (accessed on 7 August 2022)), which contain categories such as shrubland, built-up areas, cropland, bare/sparse vegetation, and a few water bodies in this study area. Those land cover categories were used to assist in identifying the categories of mine patches.

2.2. Methodology

The processing procedure of the mining activities monitoring approach proposed in this paper is summarized in Figure 3. Four key steps are included: (1) interpreting mine patches and sampling the training and testing samples; (2) identifying mine patches using DeepLabV3-ResNet and obtaining the initial spatial information of mine patches from high-resolution images taken in 2019; (3) extracting mine patch boundaries using multiresolution segmentation and spatial analysis; (4) monitoring mining activities from 2019 to 2021 using SBAS-InSAR.

2.2.1. Interpreting and Sampling

A total of 238 mine patches were interpreted manually based on the established signs in Section 2.1, including 114 coal gangue dumps, 80 iron ore open pits, 30 clay ore open pits, and 14 sandstone open pits.
A total of 50% of the mine patches, evenly distributed throughout the study area, are randomly selected to generate training samples. The original image with interpreted mine boundaries is further split into small image patches of 256 × 256 pixels with a 128-pixel step for model training. Additionally, the angular rotation method is employed by rotating the split image patches by 90°, 180°, and 270° to supply more training samples. In addition, these mine patches are used as a reference for multiresolution segmentation and spatial analysis in extracting mine patch boundaries.
The remaining mine patches are used for accuracy assessment. The composition of mining and non-mining areas in this study area is imbalanced, with the ratio of mining to non-mining areas being approximately 0.015. In order to obtain realistic accuracy assessment results, the testing samples used for pixel-based accuracy assessment also adopt a corresponding imbalanced distribution.

2.2.2. Preliminary Extraction of Mine Patches

The deep learning semantic segmentation model is first used to extract the spatial information of mine patches. It can make pixel-wise predictions for a given image without requiring manual feature engineering and provide the spatial location of the mine patches while extracting the spatial extent. In this paper, we adopt Deeplabv3-ResNet [34], a robust and versatile semantic segmentation model that can be easily implemented and fine-tuned for various applications.
The architecture of the DeepLabV3-ResNet model in this paper is shown in Figure 3. ResNet50 is designed as the backbone of DeepLabV3 due to its powerful performance with reasonable computational power and processing time demands. The feature map obtained from block 4 is input into a modified version of the Atrous Spatial Pyramid Pooling (ASPP) module, which comprises five sub-modules. The outputs from each sub-module are concatenated and passed through a 1 × 1 convolutional block. The final prediction is generated by passing the resulting feature map through a 1 × 1 convolutional block and then upsampling it bilinearly. The advantage of this model is the use of the Atrous Convolution module. It can increase the receptive field of the model without reducing the spatial resolution of feature maps and obtain a larger range of contextual information.

2.2.3. Fine-Grained Extraction of Mine Patch Boundaries

  • Multiresolution segmentation
The multiresolution segmentation algorithm consecutively merges pixels with their neighbors based on relative homogeneity criteria, a combination of the color and shape properties [35]. Two parameters, i.e., the shape and the compactness, need to be determined to customize the criterion. The shape determines to what degree shape influences the segmentation compared to color. The compactness gives it a relative weighting against the smoothness of the segmentation. The strategy for optimization of multiresolution segmentation parameters in this paper is as follows:
(1) The scale parameter is pre-set as 50 [20]. The values of the shape and compactness parameters are optimized using a grid search method. Let shape = {0.1, 0.2, …, 0.9}, compactness = {0.1, 0.2, …, 0.9}. Each combination of shape and compactness parameters generates a segmentation result. The manually interpreted mine patches used for model training are employed as reference data to select the optimal parameters. The similarity between these reference patches and the segmentation results is used for determining the optimal parameters; a smaller area difference indicates better segmentation results. Multiple segmentation objects are merged when they correspond to the same reference mine patch. The optimal parameters for segmentation are determined by the average area difference between the reference mine patches and the merged objects. Specifically, the shape and compactness parameters corresponding to the smallest average area difference are considered the best.
(2) After determining the shape and compactness parameters, the optimal value of the scale parameter is estimated using the Estimation of Scale Parameters 2 tool [36,37]. This tool is based on the local variance of object heterogeneity within a scene. It generates the segmentation results corresponding to multiple scale parameters from the bottom up and calculates the local variance at each scale. When the local variance reaches an inflection point and turns to a decreasing trend, the corresponding scale parameter produces results with the maximum heterogeneity between objects. The optimal scale parameter is determined by the number of segmented objects covered within the reference mine patches. The aim is complete segments; thus, it is preferable to have fewer segmented objects. Based on the above strategy, the scale, shape, and compactness parameters determined in this paper are 79, 0.2, and 0.5, respectively.
2.
Spatial Analysis
The preliminary extraction of mine patches is prone to spatial discontinuities, such as the generation of holes, fractional patches, etc. This paper adopts the segmented objects generated by the multiresolution segmentation algorithm to obtain fine-grained mine patch boundaries through spatial analysis. First, the preliminary extraction and segmentation results are superimposed to retain the intersecting objects. Then, a total area control strategy is employed to filter out unimportant objects, and the process is as follows:
(1) Calculate the area of each intersection region between the preliminary extraction and the segmentation, denoted as A intsct , and the area proportion p intsct ;
(2) Calculate the total area of the reference mine patches, denoted as A r e f ;
(3) Select the segmented objects intersected with the reference mine patches, arranging them in descending order of p intsct , and calculating the corresponding cumulative area A intsct ;
(4) Record the p intsct , when the difference between A intsct and A r e f is the smallest;
(5) Remove the object with an area proportion less than p intsct ;
(6) Retain the remaining objects and merge the neighboring objects;
(7) Remove segmented objects that intersect with the known buildings, cultivated land, and water bodies using auxiliary data, and remove the objects with an area of less than 50 m2.
Figure 4 demonstrates an example of filtering out unimportant objects. There are six segmented objects that intersect with the preliminarily extracted patches. The areas of each intersecting region and their proportions within their respective objects—R1 through R6—are initially calculated. Based on these proportions, the objects R1–R6 are subsequently ranked in descending order. For instance, the order established is as follows: R1 (99%), R3 (15%), R6 (12%), R4 (7%), R5 (5%), and R2 (2%). Next, we calculate the cumulative areas of intersecting regions, starting with R1 alone, then adding areas from R1 to R3, and so on, until the full area from R1 to R2 is accounted for. These cumulative areas are then compared with the interpreted area. We record the area ratio when the difference between the cumulative and interpreted areas is smallest. Finally, the area ratios of all intersecting regions within their corresponding segmented objects are calculated, and only the segmented objects with an area ratio greater than the optimal ratio are retained.
Based on the above strategy, the value of Pintsct is 21.5% in this paper.

2.2.4. InSAR-Based Surface Deformation Extraction

The SBAS-InSAR technique divides the SAR dataset into several subsets based on the thresholds of temporal and spatial baselines. The individual SAR datasets constructed have smaller temporal and spatial baselines. The interferometric decorrelation problem caused by long time and spatial baselines is effectively suppressed. Differential interference is processed for each constructed interferometric image pair to obtain the unwrapped phase. To increase the data time sampling of the surface deformation variables and to avoid the possible rank loss problem of solving the set of equations during the least squares solution, the singular value decomposition (SVD) method is used to combine different small baseline sets to obtain the results of the surface time-series deformation for the whole period [38,39].
Let there be N + 1 scene of SAR images covering the study area. Generate a combination of interferometric image pairs according to the spatial and temporal baseline thresholds. The interferometric phase of any pixel in the interferogram obtained by differential interference of the master image and the slave images can be expressed as follows:
φ j = φ T a φ T b     4 π λ [ d T b d T a ] + Δ φ j
The d T a ( d T b ) indicate cumulative deformation in the line-of-sight direction between T b ( T a ) and T 0 ; Δ φ j indicates the sum of the atmospheric delay phase, the residual terrain phase, and other factors.
It is assumed that the surface deformation follows a segmentally linear pattern over time. Then, the phase of the jth differential interferogram can be expressed as follows:
φ j = K = T a , j + 1 T b , j ( T K T K 1 ) V K
φ = ( X 11 X 1 n X m 1 X m n ) V
The variable V K represents the deformation rate at time K. The unwrapped phase can be combined into an Μ × N matrix through the time integral of the master and slave images. The final temporal deformation rate is calculated by the Moore–Penrose pseudoinverse of this matrix.

3. Result

3.1. Accuracy Assessment for Mine Patches Extraction Results

The extracted mine patches are shown in Figure 5. The proposed approach has identified 228 out of 238 manually interpreted patches with an identification accuracy of 95.80%. These patches comprise 112 coal gangue dumps, 74 iron ore open pits, 28 clay ore open pits, and 14 sandstone open pits. Ten small patches, averaging 4136 square meters each, have been omitted.
To further assess accuracy, 340,868 random samples have been extracted, including 5000 mining samples and 334,912 non-mining samples (the sampling method can be found in Section 3.1). However, using only overall accuracy (OA) to evaluate the samples is biased and misleading. It is because the non-mining samples make up a significantly larger portion, approximately 98.25%, of the total area compared to the mining samples. It is essential to contemplate alternative metrics to guarantee a just and precise assessment. A confusion matrix has been established, and the producer’s accuracy, user’s accuracy, kappa coefficient, and F1-score have been employed (as shown in Table 2).
The F1-score for mine patches extraction is 0.727, and the kappa coefficient is 0.723. The producer’s accuracy for mine patches (0.797) is higher than the user’s (0.669), indicating that the proposed approach effectively extracts mine patches from the study area. However, there are some instances of misclassification, such as mountain shadows, wind turbines, and their surroundings being misidentified as mine patches.
To assess the accuracy of the extracted open-pit mine boundaries, this study measured the area similarity between accurately identified patches and manually interpreted boundaries. The area similarity coefficient is utilized. This coefficient measures the similarity between manually interpreted patches and the accurately extracted patches by calculating their area ratio. A ratio closer to 1 indicates a significantly higher degree of similarity.
Figure 6 shows the statistical plot of the similarity results. Over half of the patches (59.22%) have an area similarity greater than 0.80, while the average area similarity for all patches is 0.78. The similarity of different types of patches varies slightly. The extracted patches of coal gangue dumps and iron ore open pits are more similar to the manually interpreted boundaries, respectively, with a similarity of 0.81 and 0.80, respectively; the area similarity of clay ore open pits and sandstone open pits is closed at 0.78 and 0.76, respectively.

3.2. Surface Deformation Information Extraction Results

This research utilized SBAS-InSAR to analyze the ground deformation between June 2019 and December 2021. Figure 7 shows the baseline distribution of Sentinel-1A acquisitions. The super master image was 2020/07/04, with a maximum absolute baseline of 111.46 m, a minimum absolute baseline of 1.97 m, and an average absolute baseline of 48.30 m. The maximum temporal baseline was 60 days, the minimum was 12 days, and the average was 35.96 days. SBAS-InSAR processing was performed on 334 interferometry pairs with an average connection per image of 7.51.
The vertical ground deformation of the study area is shown in Figure 8, with a spatial resolution of 15 m. The deformation rate in the study area ranges from −18.04 mm/year to 14.89 mm/year. Due to the absence of a historical monitoring record or concurrent precise leveling measurements, the surface deformation obtained from InSAR is only used to qualitatively analyze pixel deformation trends. Therefore, InSAR deformation measurements are mainly utilized for qualitative analysis of mine activities in combination with multi-temporal optical images.

4. Discussion

4.1. Result Analysis for Mine Patches Extraction

4.1.1. The Advantages of the Proposed Approach

To further understand the performance of the proposed approach, we compared the results of DeepLabV3 with those in this paper. As shown in Figure 9, the proposed approach has better performance in handling holes (Figure 9a) and fragmented patches (Figure 9b) and can eliminate some small and isolated errors (Figure 9c).
The deep learning approach enables rapid identification and extraction of mine patches with only some manual labeling work. However, the mining area covers only a small part of the surface, but the scene is very complex. It is difficult to extract a complete patch using deep learning methods alone. The object-oriented segmentation algorithm leverages images’ homogeneity and heterogeneity to extract spatially continuous geographic patches. Incorporating object-oriented image segmentation as a post-processing technique addresses the issue of insufficient spatial continuity in deep learning extraction outcomes. Furthermore, in practical applications, the utilization of historical mining patches can help minimize the reliance on manual intervention. The proposed approach has good prospects for engineering applications.

4.1.2. The Omission and Commission Errors

The omission errors of patches are rare, and the omissions mainly occur with very small patches that closely resemble the surrounding features. The commission errors of mine patches are the main source of errors in results. In particular, the wind farm and the mountain shadows are misidentified as mine patches.
The construction process of a wind farm involves mountain excavation, land leveling, installation of wind turbines, and the construction of infrastructure such as roads. It exhibits spectral, geometric, and textural features similar to those of an open-pit mining area. In the preliminary extraction step based on the DeepLabV3-ResNet model, it was identified incorrectly.
The commission errors of mountain shadows are mainly due to spectral similarity. Due to the obstruction of solar radiation reflection pathways, mountain shadows have low values in optical images. Similarly, coal or coal gangue also exhibit relatively small numerical values due to the high absorption rate of visible light. In addition, the spatial location’s consistency is also a cause of errors. Mountain shadows are mainly distributed in the folded areas in the northeastern study area, while the patches of the coal mining area are distributed along the strike of the coal-bearing strata located in the same folded area.

4.1.3. Area Variance Analysis

The difference in patch area mainly stems from the mine patches with larger scales and longer duration of mining. Large-scale open-pit mines contain multi-phase mining surfaces. The early-stage mining exposes rocks to weathering, erosion, accumulation, and wind–sand modification. The spectral and textural information of the mining patches has changed, making them difficult to extract and reducing the size of the extracted patches. Furthermore, several roads and mine patches are segmented into the same object during the multiresolution segmentation step. The subsequent steps recognize them as a whole, slightly increasing the size of the extracted mine patches.

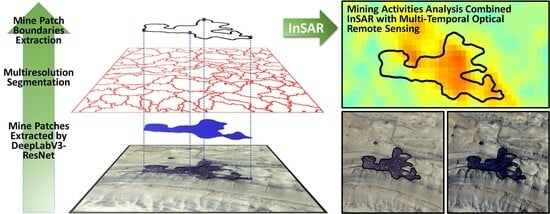
4.2. Mining Activities Analysis Combined InSAR with Multi-Temporal Optical Remote Sensing

Monitoring open-pit mine activity solely with optical remote sensing imagery is challenging. The image quality can be affected by various factors, such as imaging conditions and data processing methodologies. For instance, high-resolution optical remote sensing satellites often incorporate the capability of lens tilt in their onboard cameras to reduce revisit intervals. Different lens angles during image capture can lead to variations in the shadows of objects in the imagery. In the absence of elevation change information, with the use of multi-temporal optical imagery to carry out interpretation processing, the shadow will affect the interpreter to determine the positive and negative terrain. In particular, mining activities that do not significantly change the spatial extent of mining patches, and small-scale illicit mining activities with shallow surface outcrop, are difficult to interpret directly from optical imagery. The time series of surface deformation measurements obtained by InSAR can visually reflect the mining activities around the mine patches.
In this paper, a combination of SBAS-InSAR and multi-temporal high-resolution optical imagery is employed to gather information on mining activities within the mine patches. As open-pit mining leads to the expansion of mining surfaces, any ground surface deformation occurring within a 0.5 km radius of the patches is attributed to the ongoing mining activity at the respective patch. A pixel in the measured image is classified as having no deformation if the annual deformation rate falls within the range of ±5 mm/year. A positive deformation is assigned to an annual deformation rate exceeding 5 mm/year, while a negative deformation is assigned to an annual deformation rate below −5 mm/year.
Statistically, among the mine scenes associated with the 228 extracted mine patches, there are 22 which exhibited positive deformation, 38 showed negative deformation, 4 with interferometric decorrelation, and 164 with no significant change within the scenes. Through a comparison of the 2019 and 2021 optical imagery, the 64 deformations anomalies all reflect related mining activities, including continued mining, land leveling, and construction of other infrastructure.
The mine patches associated with positive deformation are all coal gangue dumps, with no noticeable difference in optical imagery between 2019 and 2021, which shows the surface accumulation process of coal gangue in underground coal mining areas. The mine patches associated with negative deformation are open pits and coal gangue dumps. Continuous mining in open-pit mines is the primary cause of negative deformation, which has also been confirmed in optical imagery. These mining scenes consist of 14 iron ore open pits, 7 clay open pits, and 5 sandstone open pits. In addition to the continuous mining, negative deformations were found in five open-pit iron ore mines that have been ecologically rehabilitated, including four sites of land leveling and one site where a photovoltaic solar power station has been constructed. Negative deformation is also observed at seven coal gangue dumps. Among these, one site undergoes land leveling, while the remaining six sites are associated with the transportation of coal gangue. In addition, the interferometric decorrelation caused by excessive deformation is an important characteristic of mine activities [40,41,42,43,44,45]. It is necessary to utilize optical imagery for the identification of such patches. In this study area, there are four patches with interferometric decorrelation, including one ongoing iron ore open pit, one ongoing sandstone open pit, and two iron ore open pits where land leveling has been conducted.
The boundaries of mine patches and time-series surface deformation can help regulatory authorities identify illicit mining activities. By comparing the gathered data with management records, such as mining rights and permits, such mining activities as mining operations that continue beyond the permitted time frame, encroachments beyond the approved spatial boundaries, and failures to fulfill the obligations for mine site reclamation and restoration can be easily found. For example, the Central Government’s Fourth Ecological Environmental Protection Inspection Group inspected the Ningxia Hui Autonomous Region in December 2021 and found that illicit mining in the northern mountainous areas of Zhongning County, Zhongwei City, was prominent, seriously damaging the ecological environment. We use the proposed approach to retrospectively analyze the mining activities in the reported illicit mining cases from 2019 to 2021, as depicted in Figure 10 (the time phase of the optical image is 2021, while the time phase of the mine patches is 2019). Figure 10a represents Tongtiegou Ceramic Clay Mine, showcasing conspicuous mining activities in its central-eastern and southern regions. The time-series deformation at the ROI #1 point location exhibits an escalated mining intensity since August 2020. Figure 10b represents Pingtanghugou Baitugangzi Sandstone quarry, where substantial mining operations are prevalent in the southwestern part of the mine scene. The time-series deformation at the ROI #2 point location reveals a consistent pattern of illicit mining activities occurring beyond the authorized mining boundaries throughout the monitoring period.

5. Conclusions

In this paper, we propose a deep-learning-based approach for mine monitoring by combining InSAR and multi-temporal high-resolution optical imagery, which is used to monitor mining activities in the Weiningbeishan area of northwestern China. This approach first uses the DeepLabV3-ResNet model to preliminary localize and identify the spatial location of mine patches. On this basis, the multiresolution segmentation algorithm and spatial analysis method are utilized for post-processing to obtain the boundaries of the mine patches. Finally, the time-series deformation information acquired by SBAS-InSAR of mine patches and the multi-temporal optical imagery are combined to analyze mine activities. The proposed approach takes advantage of the fact that deep learning does not require the construction of complex feature engineering and thus reduces the manual involvement in the pre-survey of remote sensing of mines and utilizes the post-processing method of object-oriented analysis to make up for the lack of geospatial continuity of the extraction results of deep learning, and the use of time-series InSAR avoids the limitations of multi-temporal optical remote sensing which is difficult to be observed continuously due to the imaging conditions. The proposed approach provides a new way to comprehensively utilize satellite remote sensing techniques to monitor mining activities in arid and semi-arid areas. The proposed approach capitalizes on the inherent advantage of deep learning, eliminating the need for intricate feature engineering and reducing the manual effort involved in pre-surveying remote sensing of mines.
Additionally, it combines object-oriented analysis as a post-processing method to compensate for the lack of spatial consistency in the extraction results obtained by deep learning. Furthermore, the utilization of time-series InSAR overcomes the limitations of optical remote sensing, which cannot observe continuously due to weather conditions. The proposed approach presents a novel perspective on effectively leveraging satellite remote sensing techniques for monitoring mining activities in arid and semi-arid regions. Future work will explore two aspects. The first aspect involves optimizing the post-processing process to obtain more accurate boundaries of mine patches. The second aspect focuses on studying the surface processes from mining to abandonment to rehabilitation of open-pit mines in arid and semi-arid vegetation-exposed areas and constructing sample libraries of the different processes to improve the recognition accuracy of mine patches.

Author Contributions

Conceptualization, S.L. (Shiyao Li), R.W. and L.W.; methodology, S.L. (Shiyao Li) and R.W.; validation, S.L. (Shaoyu Liu), J.Y. and H.X.; formal analysis, S.L. (Shiyao Li) and R.W.; writing—original draft preparation, S.L. (Shiyao Li); writing—review and editing, S.L. (Shiyao Li) and R.W.; visualization, S.L. (Shiyao Li) and R.W.; supervision, R.N. and L.W.; funding acquisition, S.L. (Shiyao Li), L.W. and S.L. (Shaoyu Liu). All authors have read and agreed to the published version of the manuscript.

Funding

This research was funded by Geological Survey Projects of the China Geological Survey (Grant No. DD20211391), Natural Science Foundation of Ningxia Hui Autonomous Region (Grant No. 2021AAC03431).

Data Availability Statement

Readers who need data for an in-depth study of this paper can contact the corresponding author for access.

Conflicts of Interest

The authors declare no conflict of interest.

References

  1. Yu, L.; Xu, Y.; Xue, Y.; Li, X.; Cheng, Y.; Liu, X.; Porwal, A.; Holden, E.; Yang, J.; Gong, P. Monitoring surface mining belts using multiple remote sensing datasets: A global perspective. Ore Geol. Rev. 2018, 101, 675–687. [Google Scholar] [CrossRef]
  2. Li, C.; Wang, A.; Chen, X.; Chen, Q.; Zhang, Y.; Li, Y. Regional distribution and sustainable development strategy of mineral resources in China. Chin. Geogr. Sci. 2013, 23, 470–481. [Google Scholar] [CrossRef]
  3. Sonter, L.J.; Moran, C.J.; Barrett, D.J.; Soares-Filho, B.S. Processes of land use change in mining regions. J. Clean. Prod. 2014, 84, 494–501. [Google Scholar] [CrossRef]
  4. Gastauer, M.; Silva, J.R.; Junior, C.F.C.; Ramos, S.J.; Filho, P.W.M.S.; Neto, A.E.F.; Siqueira, J.O. Mine land rehabilitation: Modern ecological approaches for more sustainable mining. J. Clean. Prod. 2018, 172, 1409–1422. [Google Scholar] [CrossRef]
  5. Van der Meer, F.D.; Van der Werff, H.M.; Van Ruitenbeek, F.J.; Hecker, C.A.; Bakker, W.H.; Noomen, M.F.; Van der Meijde, M.; Carranza, E.J.M.; De Smeth, J.B.; Woldai, T. Multi-and hyperspectral geologic remote sensing: A review. Int. J. Appl. Earth Obs. Geoinf. 2012, 14, 112–128. [Google Scholar] [CrossRef]
  6. Li, J.; Pei, Y.; Zhao, S.; Xiao, R.; Sang, X.; Zhang, C. A Review of Remote Sensing for Environmental Monitoring in China. Remote Sens. 2020, 12, 1130. [Google Scholar] [CrossRef]
  7. Song, W.; Song, W.; Gu, H.; Li, F. Progress in the Remote Sensing Monitoring of the Ecological Environment in Mining Areas. Int. J. Environ. Res. Public Health 2020, 17, 1846. [Google Scholar] [CrossRef]
  8. Yang, Z.; Li, Z.; Zhu, J.; Wang, Y.; Wu, L. Use of SAR/InSAR in mining deformation monitoring, parameter inversion, and forward predictions: A review. IEEE Geosci. Remote Sens. Mag. 2020, 8, 71–90. [Google Scholar] [CrossRef]
  9. McKenna, P.B.; Lechner, A.M.; Phinn, S.; Erskine, P.D. Remote Sensing of Mine Site Rehabilitation for Ecological Outcomes: A Global Systematic Review. Remote Sens. 2020, 12, 3535. [Google Scholar] [CrossRef]
  10. Notesco, G.; Kopačková, V.; Rojík, P.; Schwartz, G.; Livne, I.; Dor, E.B. Mineral Classification of Land Surface Using Multispectral LWIR and Hyperspectral SWIR Remote-Sensing Data. A Case Study over the Sokolov Lignite Open-Pit Mines, the Czech Republic. Remote Sens. 2014, 6, 7005–7025. [Google Scholar] [CrossRef]
  11. Kirsch, M.; Lorenz, S.; Zimmermann, R.; Tusa, L.; Möckel, R.; Hödl, P.; Booysen, R.; Khodadadzadeh, M.; Gloaguen, R. Integration of Terrestrial and Drone-Borne Hyperspectral and Photogrammetric Sensing Methods for Exploration Mapping and Mining Monitoring. Remote Sens. 2018, 10, 1366. [Google Scholar] [CrossRef]
  12. He, D.; Le, B.T.; Xiao, D.; Mao, Y.; Shan, F.; Ha, T.T.L. Coal mine area monitoring method by machine learning and multispectral remote sensing images. Infrared Phys. Technol. 2019, 103, 103070. [Google Scholar] [CrossRef]
  13. Padró, J.C.; Carabassa, V.; Balagué, J.; Brotons, L.; Alcañiz, J.M.; Pons, X. Monitoring opencast mine restorations using Unmanned Aerial System (UAS) imagery. Sci. Total Environ. 2019, 657, 1602–1614. [Google Scholar] [CrossRef]
  14. Purwadi, I.; van der Werff, H.M.; Lievens, C. Targeting rare earth element bearing mine tailings on Bangka Island, Indonesia, with Sentinel-2 MSI. Int. J. Appl. Earth Obs. Geoinf. 2020, 88, 102055. [Google Scholar] [CrossRef]
  15. Hu, F.; Hu, Y.; Cui, E.; Guan, Y.; Gao, B.; Wang, X.; Wang, K.; Liu, Y.; Yao, X. Recognition method of coal and gangue combined with structural similarity index measure and principal component analysis network under multispectral imaging. Microchem. J. 2023, 186, 108330. [Google Scholar] [CrossRef]
  16. Zhang, Y.; Guindon, B.; Lantz, N.; Shipman, T.; Chao, D.; Raymond, D. Quantification of anthropogenic and natural changes in oil sands mining infrastructure land based on RapidEye and SPOT5. Int. J. Appl. Earth Obs. Geoinf. 2014, 29, 31–43. [Google Scholar] [CrossRef]
  17. Chen, W.; Li, X.; He, H.; Wang, L. A Review of Fine-Scale Land Use and Land Cover Classification in Open-Pit Mining Areas by Remote Sensing Techniques. Remote Sens. 2018, 10, 15. [Google Scholar] [CrossRef]
  18. Chen, W.; Li, X.; Wang, L. Fine Land Cover Classification in an Open Pit Mining Area Using Optimized Support Vector Machine and WorldView-3 Imagery. Remote Sens. 2020, 12, 82. [Google Scholar] [CrossRef]
  19. Chen, W.; Li, X.; He, H.; Wang, L. Assessing Different Feature Sets’ Effects on Land Cover Classification in Complex Surface-Mined Landscapes by ZiYuan-3 Satellite Imagery. Remote Sens. 2018, 10, 23. [Google Scholar] [CrossRef]
  20. Chen, T.; Hu, N.; Niu, R.; Zhen, N.; Plaza, A. Object-Oriented Open-Pit Mine Mapping Using Gaofen-2 Satellite Image and Convolutional Neural Network, for the Yuzhou City, China. Remote Sens. 2020, 12, 3895. [Google Scholar] [CrossRef]
  21. Chen, T.; Zheng, X.; Niu, R.; Plaza, A. Open-pit mine area mapping with Gaofen-2 satellite images using U-Net+. IEEE J. Sel. Top. Appl. Earth Obs. Remote Sens. 2022, 15, 3589–3599. [Google Scholar] [CrossRef]
  22. Li, X.; Chen, W.; Cheng, X.; Wang, L. A Comparison of Machine Learning Algorithms for Mapping of Complex Surface-Mined and Agricultural Landscapes Using ZiYuan-3 Stereo Satellite Imagery. Remote Sens. 2016, 8, 514. [Google Scholar] [CrossRef]
  23. Wang, C.; Chen, T.; Plaza, A. MFE-ResNet: A new extraction framework for land cover characterization in mining areas. Future Gener. Comput. Syst. 2023, 145, 550–562. [Google Scholar] [CrossRef]
  24. Du, S.; Li, W.; Li, J.; Du, S.; Zhang, C.; Sun, Y. Open-pit mine change detection from high resolution remote sensing images using DA-UNet++ and object-based approach. Int. J. Min. Reclam. Environ. 2022, 36, 512–535. [Google Scholar] [CrossRef]
  25. Du, S.; Xing, J.; Li, J.; Du, S.; Zhang, C.; Sun, Y. Open-Pit Mine Extraction from Very High-Resolution Remote Sensing Images Using OM-DeepLab. Nat. Resour. Res. 2022, 31, 3173–3194. [Google Scholar] [CrossRef]
  26. Zhou, G.; Xu, J.; Chen, W.; Li, X.; Li, J.; Wang, L. Deep feature enhancement method for land cover with irregular and sparse spatial distribution features: A case study on open-pit mining. IEEE Trans. Geosci. Remote Sens. 2023, 61, 4401220. [Google Scholar] [CrossRef]
  27. Chen, Y.; Jiang, H.; Li, C.; Jia, X.; Ghamisi, P. Deep feature extraction and classification of hyperspectral images based on convolutional neural networks. IEEE Trans. Geosci. Remote Sens. 2016, 54, 6232–6251. [Google Scholar] [CrossRef]
  28. Blaschke, T. Object based image analysis for remote sensing. ISPRS J. Photogramm. Remote Sens. 2010, 65, 2–16. [Google Scholar] [CrossRef]
  29. Hussain, M.; Chen, D.; Cheng, A.; Wei, H.; Stanley, D. Change detection from remotely sensed images: From pixel-based to object-based approaches. ISPRS J. Photogramm. Remote Sens. 2013, 80, 91–106. [Google Scholar] [CrossRef]
  30. Bruzzone, L.; Carlin, L. A multilevel context-based system for classification of very high spatial resolution images. IEEE Trans. Geosci. Remote Sens. 2006, 44, 2587–2600. [Google Scholar] [CrossRef]
  31. Yu, C.; Li, Z.; Penna, N.T.; Crippa, P. Generic atmospheric correction model for interferometric synthetic aperture radar observations. J. Geophys. Res. Solid Earth. 2018, 123, 9202–9222. [Google Scholar] [CrossRef]
  32. Yu, C.; Li, Z.; Penna, N.T. Interferometric synthetic aperture radar atmospheric correction using a GPS-based iterative tropospheric decomposition model. Remote Sens. Environ. 2018, 204, 109–121. [Google Scholar] [CrossRef]
  33. Yu, C.; Penna, N.T.; Li, Z. Generation of real-time mode high-resolution water vapor fields from GPS observations. J. Geophys. Res. Atmos. 2017, 122, 2008–2025. [Google Scholar] [CrossRef]
  34. Chen, L.C.; Papandreou, G.; Schroff, F.; Adam, H. Rethinking atrous convolution for semantic image segmentation. arXiv 2017, arXiv:1706.05587. [Google Scholar]
  35. Benz, U.C.; Hofmann, P.; Willhauck, G.; Lingenfelder, I.; Heynen, M. Multi-resolution, object-oriented fuzzy analysis of remote sensing data for GIS-ready information. ISPRS J. Photogramm. Remote Sens. 2004, 58, 239–258. [Google Scholar] [CrossRef]
  36. Drǎguţ, L.; Tiede, D.; Levick, S.R. ESP: A tool to estimate scale parameter for multiresolution image segmentation of remotely sensed data. Int. J. Geogr. Inf. Sci. 2010, 24, 859–871. [Google Scholar] [CrossRef]
  37. Drăguţ, L.; Csillik, O.; Eisank, C.; Tiede, D. Automated parameterisation for multi-scale image segmentation on multiple layers. ISPRS J. Photogramm. Remote Sens. 2014, 88, 119–127. [Google Scholar] [CrossRef]
  38. Berardino, P.; Fornaro, G.; Lanari, R.; Sansosti, E. A new algorithm for surface deformation monitoring based on small baseline differential SAR interferograms. IEEE Trans. Geosci. Remote Sens. 2002, 40, 2375–2383. [Google Scholar] [CrossRef]
  39. Li, S.; Xu, W.; Li, Z. Review of the SBAS InSAR Time-series algorithms, applications, and challenges. Geod. Geodyn. 2022, 13, 114–126. [Google Scholar] [CrossRef]
  40. Forkuor, G.; Ullmann, T.; Griesbeck, M. Mapping and Monitoring Small-Scale Mining Activities in Ghana using Sentinel-1 Time Series (2015–2019). Remote Sens. 2020, 12, 911. [Google Scholar] [CrossRef]
  41. Moon, J.; Lee, H. Analysis of Activity in an Open-Pit Mine by Using InSAR Coherence-Based Normalized Difference Activity Index. Remote Sens. 2021, 13, 1861. [Google Scholar] [CrossRef]
  42. Zhao, G.; Wang, L.; Deng, K.; Wang, M.; Xu, Y.; Zheng, M.; Luo, Q. An Adaptive Offset-Tracking Method Based on Deformation Gradients and Image Noises for Mining Deformation Monitoring. Remote Sens. 2021, 13, 2958. [Google Scholar] [CrossRef]
  43. Zhang, Y.; Lian, X.; Ge, L.; Liu, X.; Du, Z.; Yang, W.; Wu, Y.; Hu, H.; Cai, Y. Surface Subsidence Monitoring Induced by Underground Coal Mining by Combining DInSAR and UAV Photogrammetry. Remote Sens. 2022, 14, 4711. [Google Scholar] [CrossRef]
  44. Moomen, A.-W.; Lacroix, P.; Benvenuti, A.; Planque, M.; Piller, T.; Davis, K.; Miranda, M.; Ibrahim, E.; Giuliani, G. Assessing the Applications of Earth Observation Data for Monitoring Artisanal and Small-Scale Gold Mining (ASGM) in Developing Countries. Remote Sens. 2022, 14, 2971. [Google Scholar] [CrossRef]
  45. Alessi, M.A.; Chirico, P.G.; Sunder, S.; O’Pry, K.L. Detection and Monitoring of Small-Scale Diamond and Gold Mining Dredges Using Synthetic Aperture Radar on the Kadéï (Sangha) River, Central African Republic. Remote Sens. 2023, 15, 913. [Google Scholar] [CrossRef]
Figure 1. The location of the study area.
Remotesensing 15 04062 g001
Figure 2. The remote sensing interpretation signs of mine patches in true color. (a) Coal gangue dumps; (b) Iron ore open pits; (c) Clay open pits; (d) Sandstone open pits.
Remotesensing 15 04062 g002
Figure 3. The proposed mining activities monitoring approach.
Remotesensing 15 04062 g003
Figure 4. An example of filtering out unimportant objects. (a) The segmented objects R1–R6 that intersected with the preliminarily extracted patches; (b) The retained object R1.
Remotesensing 15 04062 g004
Figure 5. The mine patches extracted by the proposed scheme.
Remotesensing 15 04062 g005
Figure 7. Baseline distribution of Sentinel-1A acquisitions. Yellow dot: Super-Master acquisition; Green dot: valid acquisitions; Red dot: discarded acquisitions; Numbers: order of acquisitions.
Remotesensing 15 04062 g007
Figure 8. Vertical ground deformation rate (mm/year) from June 2019 to December 2021.
Remotesensing 15 04062 g008
Figure 6. The statistical plot of area similarity for coal gangue dumps (CGD), iron ore open pits (IOP), clay ore open pits (COP), sandstone open pits (SOP).
Remotesensing 15 04062 g006
Figure 9. Mine patches extracted by manual interpretation, DeepLabV3, and the proposed approach in this paper. (a1a3) Patch with holes; (b1b3) Fragmented patches; (c1,c2) Some small and isolated errors.
Remotesensing 15 04062 g009
Figure 10. Examples of mine patches of illicit mining activities. (a) Tongtiegou Ceramic Clay Mine; (b) Pingtanghugou Baitugangzi Sandstone quarry.
Remotesensing 15 04062 g010
Table 1. Detailed information on Sentinel-1A SLC SAR data.
Beam ModeRadar
Wavelength
Spatial
Resolution
Polarization
Mode
Path/Frame
Number
Incidence
Angle
Interferometric Wide Swath mode (IW)5.6 cm5 m × 20 mVV157/11737.28°
Table 2. Error matrices and accuracy assessment for mining area and non-mining area.
Extracted DataReference DataUser’s Acc.
MiningNon-MiningTotal
Mining3985197159560.669
Non-mining1015332,941333,9640.9970.727 (F1-score)
Total5000334,912340,868 0.723 (Kappa)
Producer’s Acc.0.7970.994 99.12% (OA)
Disclaimer/Publisher’s Note: The statements, opinions and data contained in all publications are solely those of the individual author(s) and contributor(s) and not of MDPI and/or the editor(s). MDPI and/or the editor(s) disclaim responsibility for any injury to people or property resulting from any ideas, methods, instructions or products referred to in the content.

