Next Issue
Volume 15, September-2
Previous Issue
Volume 15, August-2
 
 
remotesensing-logo

Journal Browser

Journal Browser

Remote Sens., Volume 15, Issue 17 (September-1 2023) – 244 articles

Cover Story (view full-size image): 
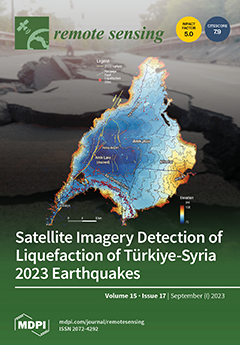
The 6 February 2023, earthquake doublet (Mw 7.7 and Mw 7.6) on the East Anatolian Fault Zone triggered widespread soil liquefaction in SE Türkiye and NW Syria. To address this, we refined a remote sensing method for mapping liquefaction. Using optical and radar satellite imagery, we identified 1850 liquefaction sites. The majority of them were located in river valleys, coastal plains, drained lakes, swamps, and lacustrine basins along the fault zone, revealing the influence of landform and surficial geology on liquefaction distribution. Remarkably, 95% of sites were within 25 km of the fault's surface trace, highlighting proximity to fault rupture as a more reliable predictor than epicenter distance. This desktop-based approach offers rapid and cost-effective earthquake-induced liquefaction mapping, aiding future hazard assessments. View this paper
  • Issues are regarded as officially published after their release is announced to the table of contents alert mailing list.
  • You may sign up for e-mail alerts to receive table of contents of newly released issues.
  • PDF is the official format for papers published in both, html and pdf forms. To view the papers in pdf format, click on the "PDF Full-text" link, and use the free Adobe Reader to open them.
Order results
Result details
Section
Select all
Export citation of selected articles as:
21 pages, 5310 KiB  
Article
Supraglacial Lake Evolution over Northeast Greenland Using Deep Learning Methods
by Katrina Lutz, Zahra Bahrami and Matthias Braun
Remote Sens. 2023, 15(17), 4360; https://0-doi-org.brum.beds.ac.uk/10.3390/rs15174360 - 4 Sep 2023
Cited by 2 | Viewed by 1219
Abstract
Supraglacial lakes in Greenland are highly dynamic hydrological features in which glacial meltwater cumulates, allowing for the loss and transport of freshwater from a glacial surface to the ocean or a nearby waterbody. Standard supraglacial lake monitoring techniques, specifically image segmentation, rely heavily [...] Read more.
Supraglacial lakes in Greenland are highly dynamic hydrological features in which glacial meltwater cumulates, allowing for the loss and transport of freshwater from a glacial surface to the ocean or a nearby waterbody. Standard supraglacial lake monitoring techniques, specifically image segmentation, rely heavily on a series of region-dependent thresholds, limiting the adaptability of the algorithm to different illumination and surface variations, while being susceptible to the inclusion of false positives such as shadows. In this study, a supraglacial lake segmentation algorithm is developed for Sentinel-2 images based on a deep learning architecture (U-Net) to evaluate the suitability of artificial intelligence techniques in this domain. Additionally, a deep learning-based cloud segmentation tool developed specifically for polar regions is implemented in the processing chain to remove cloudy imagery from the analysis. Using this technique, a time series of supraglacial lake development is created for the 2016 to 2022 melt seasons over Nioghalvfjerdsbræ (79°N Glacier) and Zachariæ Isstrøm in Northeast Greenland, an area that covers 26,302 km2 and represents roughly 10% of the Northeast Greenland Ice Stream. The total lake area was found to have a strong interannual variability, with the largest peak lake area of 380 km2 in 2019 and the smallest peak lake area of 67 km2 in 2018. These results were then compared against an algorithm based on a thresholding technique to evaluate the agreement of the methodologies. The deep learning-based time series shows a similar trend to that produced by a previously published thresholding technique, while being smoother and more encompassing of meltwater in higher-melt periods. Additionally, while not completely eliminating them, the deep learning model significantly reduces the inclusion of shadows as false positives. Overall, the use of deep learning on multispectral images for the purpose of supraglacial lake segmentation proves to be advantageous. Full article
Show Figures

Graphical abstract

20 pages, 1265 KiB  
Article
Siamese Multi-Scale Adaptive Search Network for Remote Sensing Single-Object Tracking
by Biao Hou, Yanyu Cui, Zhongle Ren, Zhihao Li, Shuang Wang and Licheng Jiao
Remote Sens. 2023, 15(17), 4359; https://0-doi-org.brum.beds.ac.uk/10.3390/rs15174359 - 4 Sep 2023
Viewed by 813
Abstract
With the development of remote sensing earth observation technology, object tracking has gained attention for its broad application prospects in computer vision. However, object tracking is challenging owing to the background clutter, occlusion, and scale variation that often appear in remote sensing videos. [...] Read more.
With the development of remote sensing earth observation technology, object tracking has gained attention for its broad application prospects in computer vision. However, object tracking is challenging owing to the background clutter, occlusion, and scale variation that often appear in remote sensing videos. Many existing trackers cannot accurately track the object for remote sensing videos with complex backgrounds. Several tracking methods can handle just one situation, such as occlusion. In this article, we propose a Siamese multi-scale adaptive search (SiamMAS) network framework to achieve object tracking for remote sensing videos. First, a multi-scale cross correlation is presented to obtain a more discriminative model and comprehensive feature representation, improving the performance of the model to handle complex backgrounds in remote sensing videos. Second, an adaptive search module is employed that augments the Kalman filter with a partition search strategy for object motion estimation. The Kalman filter is adopted to re-detect the object when the network cannot track the object in the current frame. Moreover, the partition search strategy can help the Kalman filter accomplish a more accurate region-proposal selection. Finally, extensive experiments on remote sensing videos taken from Jilin-1 commercial remote sensing satellites show that the proposed tracking algorithm achieves strong tracking performance with 0.913 precision while running at 37.528 frames per second (FPS), demonstrating its effectiveness and efficiency. Full article
Show Figures

Figure 1

26 pages, 5470 KiB  
Article
LMSD-Net: A Lightweight and High-Performance Ship Detection Network for Optical Remote Sensing Images
by Yang Tian, Xuan Wang, Shengjie Zhu, Fang Xu and Jinghong Liu
Remote Sens. 2023, 15(17), 4358; https://0-doi-org.brum.beds.ac.uk/10.3390/rs15174358 - 4 Sep 2023
Cited by 3 | Viewed by 1073
Abstract
Ship detection technology has achieved significant progress recently. However, for practical applications, lightweight ship detection still remains a very challenging problem since small ships have small relative scales in wide images and are easily missed in the background. To promote the research and [...] Read more.
Ship detection technology has achieved significant progress recently. However, for practical applications, lightweight ship detection still remains a very challenging problem since small ships have small relative scales in wide images and are easily missed in the background. To promote the research and application of small-ship detection, we propose a new remote sensing image dataset (VRS-SD v2) and provide a fog simulation method that reflects the actual background in remote sensing ship detection. The experiment results show that the proposed fog simulation is beneficial in improving the robustness of the model for extreme weather. Further, we propose a lightweight detector (LMSD-Net) for ship detection. Ablation experiments indicate the improved ELA-C3 module can efficiently extract features and improve the detection accuracy, and the proposed WGC-PANet can reduce the model parameters and computation complexity to ensure a lightweight nature. In addition, we add a Contextual Transformer (CoT) block to improve the localization accuracy and propose an improved localization loss specialized for tiny-ship prediction. Finally, the overall performance experiments demonstrate that LMSD-Net is competitive in lightweight ship detection among the SOTA models. The overall performance achieves 81.3% in AP@50 and could meet the lightweight and real-time detection requirements. Full article
(This article belongs to the Special Issue Remote Sensing of Target Object Detection and Identification II)
Show Figures

Figure 1

24 pages, 9484 KiB  
Article
Neural Network-Based Wind Measurements in Rainy Conditions Using the HY-2A Scatterometer
by Jing Wang, Xuetong Xie, Ruru Deng, Mingsen Lin and Xiankun Yang
Remote Sens. 2023, 15(17), 4357; https://0-doi-org.brum.beds.ac.uk/10.3390/rs15174357 - 4 Sep 2023
Viewed by 789
Abstract
Wind measurement using spaceborne scatterometers has been used for various scientific and operational purposes. However, the major problem of such measurements is contamination by rain. To improve the wind measurement using the HY-2A scatterometer under rainy conditions, a neural network-based model was established [...] Read more.
Wind measurement using spaceborne scatterometers has been used for various scientific and operational purposes. However, the major problem of such measurements is contamination by rain. To improve the wind measurement using the HY-2A scatterometer under rainy conditions, a neural network-based model was established in this study. The model is almost autonomous in that it only needs the backscatter coefficient measurement data and the observation geometry information from the HY-2A scatterometer itself. The model can distinguish between rain-contaminated wind pixels and rain-free wind pixels and significantly improve the accuracy of wind speed measurements using HY-2A scatterometer alone. TAO data and linearly calibrated ECMWF data were used in the study to validate the neural network-inverted wind speed. Under no rain conditions, the RMS of the neural network-inverted wind speed and TAO wind speed was 1.06 m/s, with a deviation of −0.21 m/s, which is a small difference from the standard method inverted wind speed. Under rain conditions, the RMS and deviation were 1.94 m/s and 0.66 m/s, respectively, which were better than the statistical results of the conventional maximum likelihood estimation method. The validated results using linearly calibrated data also indicate that the neural network-inverted wind speed is closer to the validation data under rain conditions. Full article
(This article belongs to the Special Issue Modeling, Processing and Analysis of Microwave Remote Sensing Data)
Show Figures

Figure 1

18 pages, 8945 KiB  
Article
Accounting for Non-Stationary Relationships between Precipitation and Environmental Variables for Downscaling Monthly TRMM Precipitation in the Upper Indus Basin
by Yixuan Wang, Yan-Jun Shen, Muhammad Zaman, Ying Guo and Xiaolong Zhang
Remote Sens. 2023, 15(17), 4356; https://0-doi-org.brum.beds.ac.uk/10.3390/rs15174356 - 4 Sep 2023
Viewed by 774
Abstract
Satellite precipitation data downscaling is gaining importance for climatic and hydrological studies at basin scale, especially in the data-scarce mountainous regions, e.g., the Upper Indus Basin (UIB). The relationship between precipitation and environmental variables is frequently utilized to statistically data and enhance spatial [...] Read more.
Satellite precipitation data downscaling is gaining importance for climatic and hydrological studies at basin scale, especially in the data-scarce mountainous regions, e.g., the Upper Indus Basin (UIB). The relationship between precipitation and environmental variables is frequently utilized to statistically data and enhance spatial resolution; the non-stationary relationship between precipitation and environmental variables has not yet been completely explored. The present work is designed to downscale TRMM (Tropical Rainfall Measuring Mission) data from 2000 to 2017 in the UIB, using stepwise regression analysis (SRA) to filter environmental variables first and a geographically weighted regression (GWR) model to downscale the data later. As a result, monthly and annual precipitation data with a high spatial resolution (1 km × 1 km) were obtained. The study’s findings showed that elevation, longitude, the Normalized Difference Vegetation Index (NDVI), and latitude, with the highest correlations with precipitation in the UIB, are the most important variables for downscaling. Environmental variable filtration followed by GWR model downscaling performed better than GWR model downscaling directly when compared with observation data. Generally, the SRA and GWR method are suitable for environmental variable filtration and TRMM data downscaling, respectively, over the complex and heterogeneous topography of the UIB. We conclude that the monthly non-stationary relationships between precipitation and variables exist and have the greatest potential to affect downscaling, which requires the most attention. Full article
(This article belongs to the Section Remote Sensing in Geology, Geomorphology and Hydrology)
Show Figures

Graphical abstract

20 pages, 9468 KiB  
Article
Spatiotemporal Characteristics and Volume Transport of Lagrangian Eddies in the Northwest Pacific
by Quanmu Yuan and Jianyu Hu
Remote Sens. 2023, 15(17), 4355; https://0-doi-org.brum.beds.ac.uk/10.3390/rs15174355 - 4 Sep 2023
Cited by 1 | Viewed by 1231
Abstract
Mesoscale eddies play a crucial role in the transport of mass, heat, salt and nutrients, exerting significant influence on ocean circulation patterns, biogeochemical processes and the global climate system. Based on Lagrangian-Averaged Vorticity Deviation (LAVD) method, this study applies 27 years (1993–2019) of [...] Read more.
Mesoscale eddies play a crucial role in the transport of mass, heat, salt and nutrients, exerting significant influence on ocean circulation patterns, biogeochemical processes and the global climate system. Based on Lagrangian-Averaged Vorticity Deviation (LAVD) method, this study applies 27 years (1993–2019) of geostrophic current velocity data to detect Rotationally Coherent Lagrangian Vortices (RCLVs) in the Northwest Pacific (NWP; 10°N–30°N, 115°E–155°E), with the spatiotemporal characteristics of Eulerian Sea Surface Height Eddies (SSH eddies) and RCLVs being compared. A higher number of SSH eddies and RCLVs can be observed in spring and winter, and their inter-annual variations are similar. SSH eddies show higher generation number and larger radius in the Subtropical Countercurrent region, while RCLVs occur more favorably in the ocean basin. The propagation speed distributions of both eddy types are nearly identical and decrease with increasing latitude. Due to the material coherent transport maintained by RCLVs within a finite time interval, the coherent cores of RCLVs are considerably smaller in scale as compared to those of SSH eddies. The average zonal transports induced by SSH eddies and RCLVs are estimated to be −0.82 Sv and −0.51 Sv (1 Sv = 106 m3/s), respectively. For non-overlapping SSH eddies with RCLVs, approximately 80% of the water within the eddy leaks out during the eddy’s lifespan. In the case of overlapping SSH eddies, the ratio of coherent water inside the eddy decreases with increasing radius, and the leakage rate is around 58%. Finally, an examination of 36 shedding RCLVs events from the Kuroshio near the Luzon Strait, which induce an average zonal transport of −0.14 Sv, reveals that 54% of the water within the shedding RCLVs originates from the Kuroshio. Full article
(This article belongs to the Special Issue Remote Sensing Applications in Ocean Observation II)
Show Figures

Figure 1

17 pages, 2565 KiB  
Article
Vessel Detection with SDGSAT-1 Nighttime Light Images
by Zheng Zhao, Shi Qiu, Fu Chen, Yuwei Chen, Yonggang Qian, Haodong Cui, Yu Zhang, Ehsan Khoramshahi and Yuanyuan Qiu
Remote Sens. 2023, 15(17), 4354; https://0-doi-org.brum.beds.ac.uk/10.3390/rs15174354 - 4 Sep 2023
Cited by 3 | Viewed by 1369
Abstract
The Sustainable Development Goals Science Satellite-1 (SDGSAT-1) Glimmer Imager for Urbanization (GIU) data is very sensitive to low radiation and capable of detecting weak light sources from vessels at night while significantly improving the spatial resolution compared to similar products. Most existing methods [...] Read more.
The Sustainable Development Goals Science Satellite-1 (SDGSAT-1) Glimmer Imager for Urbanization (GIU) data is very sensitive to low radiation and capable of detecting weak light sources from vessels at night while significantly improving the spatial resolution compared to similar products. Most existing methods fail to use the relevant characteristics of vessels effectively, and it is difficult to deal with the complex shape of vessels in high-resolution Nighttime Light (NTL) data, resulting in unsatisfactory detection results. Considering the overall sparse distribution of vessels and the light source diffusion phenomenon, a novel vessel detection method is proposed in this paper, utilizing the high spatial resolution of the SDGSAT-1. More specifically, noise separation is completed based on a local contrast-weighted RPCA. Then, artificial light sources are detected based on a density clustering algorithm, and an inter-cluster merging method is utilized to realize vessel detection further. We selected three research areas, namely, the Bohai Sea, the East China Sea, and the Gulf of Mexico, to establish a vessel dataset and applied the algorithm to the dataset. The results show that the total detection accuracy and the recall rate of the detection algorithm in our dataset are 96.84% and 96.67%, which is significantly better performance than other methods used for comparison in the experiment. The algorithm overcomes the dataset’s complex target shapes and noise conditions and achieves good results, which proves the applicability of the algorithm. Full article
Show Figures

Graphical abstract

20 pages, 6207 KiB  
Article
Analysis of the Matchability of Reference Imagery for Aircraft Based on Regional Scene Perception
by Xin Li, Guo Zhang, Hao Cui, Jinhao Ma and Wei Wang
Remote Sens. 2023, 15(17), 4353; https://0-doi-org.brum.beds.ac.uk/10.3390/rs15174353 - 4 Sep 2023
Cited by 1 | Viewed by 775
Abstract
Scene matching plays a vital role in the visual positioning of aircraft. The position and orientation of aircraft can be determined by comparing acquired real-time imagery with reference imagery. To enhance precise scene matching during flight, it is imperative to conduct a comprehensive [...] Read more.
Scene matching plays a vital role in the visual positioning of aircraft. The position and orientation of aircraft can be determined by comparing acquired real-time imagery with reference imagery. To enhance precise scene matching during flight, it is imperative to conduct a comprehensive analysis of the reference imagery’s matchability beforehand. Conventional approaches to image matchability analysis rely heavily on features that are manually designed. However, these features are inadequate in terms of comprehensiveness, efficiency, and taking into account the scene matching process, ultimately leading to unsatisfactory results. This paper innovatively proposes a core approach to quantifying matchability by utilizing scene information from imagery. The first proposal for generating image matchability samples through a simulation of the matching process has been developed. The RSPNet network architecture is designed to effectively leverage regional scene perception in order to accurately predict the matchability of reference imagery. This network comprises two core modules: saliency analysis and uniqueness analysis. The attention mechanism employed by saliency analysis module extracts features at different levels and scales, guaranteeing an accurate and meticulous quantification of image saliency. The uniqueness analysis module quantifies image uniqueness by comparing neighborhood scene features. The proposed method is compared with traditional and deep learning methods for experiments based on simulated datasets, respectively. The results demonstrate that RSPNet exhibits significant advantages in terms of accuracy and reliability. Full article
(This article belongs to the Special Issue Remote Sensing Satellites Calibration and Validation)
Show Figures

Graphical abstract

13 pages, 4226 KiB  
Article
Estimating Leymus chinensis Loss Caused by Oedaleus decorus asiaticus Using an Unmanned Aerial Vehicle (UAV)
by Bobo Du, Xiaolong Ding, Chao Ji, Kejian Lin, Jing Guo, Longhui Lu, Yingying Dong, Wenjiang Huang and Ning Wang
Remote Sens. 2023, 15(17), 4352; https://0-doi-org.brum.beds.ac.uk/10.3390/rs15174352 - 4 Sep 2023
Viewed by 1020
Abstract
Oedaleus decorus asiaticus is one of the dominant harmful pests in central Inner Mongolia, China. Large-scale outbreaks of this pest create many serious problems in animal husbandry and agriculture. Therefore, understanding the underlying mechanisms between plant losses and Odecorus at different density levels [...] Read more.
Oedaleus decorus asiaticus is one of the dominant harmful pests in central Inner Mongolia, China. Large-scale outbreaks of this pest create many serious problems in animal husbandry and agriculture. Therefore, understanding the underlying mechanisms between plant losses and Odecorus at different density levels and growth stages can guide the development of monitoring and prediction measures to reduce damage. In this study, an unmanned aerial vehicle (UAV) carrying a camera was employed to collect multi-spectral data. Further, nine vegetation indices (VIs) were analyzed to explore the most suitable indices for estimating plant loss caused by O. decorus in different growth stages. The following results were obtained: (1) The second instar nymphs of O. decorus could promote vegetation growth. As the density level in each cage increased, the biomass of each cage increased (nymph density < 30 nymphs/m2) and then decreased (nymph density ≥ 30 nymphs/m2). When nymph density was greater than 60 nymphs/m2, the biomass in those cages decreased significantly. (2) With respect to the control group, large damage began to emerge during the third instar nymphal stage. In particular, the largest vegetation loss was caused by fourth nymphal larvae. (3) The ratio vegetation index (RVI) appeared as the most excellent index for reflecting Leymus chinensis loss caused by O. decorus at different growth stages. Nevertheless, the difference vegetation index (DVI) was better than the RVI in the fifth instar nymphal stage. Full article
Show Figures

Figure 1

25 pages, 41037 KiB  
Article
Single Object Tracking in Satellite Videos Based on Feature Enhancement and Multi-Level Matching Strategy
by Jianwei Yang, Zongxu Pan, Yuhan Liu, Ben Niu and Bin Lei
Remote Sens. 2023, 15(17), 4351; https://0-doi-org.brum.beds.ac.uk/10.3390/rs15174351 - 4 Sep 2023
Cited by 2 | Viewed by 1267
Abstract
Despite significant advancements in remote sensing object tracking (RSOT) in recent years, achieving accurate and continuous tracking of tiny-sized targets remains a challenging task due to similar object interference and other related issues. In this paper, from the perspective of feature enhancement and [...] Read more.
Despite significant advancements in remote sensing object tracking (RSOT) in recent years, achieving accurate and continuous tracking of tiny-sized targets remains a challenging task due to similar object interference and other related issues. In this paper, from the perspective of feature enhancement and a better feature matching strategy, we present a tracker SiamTM specifically designed for RSOT, which is mainly based on a new target information enhancement (TIE) module and a multi-level matching strategy. First, we propose a TIE module to address the challenge of tiny object sizes in satellite videos. The proposed TIE module goes along two spatial directions to capture orientation and position-aware information, respectively, while capturing inter-channel information at the global 2D image level. The TIE module enables the network to extract discriminative features of the targets more effectively from satellite images. Furthermore, we introduce a multi-level matching (MM) module that is better suited for satellite video targets. The MM module firstly embeds the target feature map after ROI Align into each position of the search region feature map to obtain a preliminary response map. Subsequently, the preliminary response map and the template region feature map are subjected to the Depth-wise Cross Correlation operation to get a more refined response map. Through this coarse-to-fine approach, the tracker obtains a response map with a more accurate position, which lays a good foundation for the prediction operation of the subsequent sub-networks. We conducted extensive experiments on two large satellite video single-object tracking datasets: SatSOT and SV248S. Without bells and whistles, the proposed tracker SiamTM achieved competitive results on both datasets while running at real-time speed. Full article
(This article belongs to the Topic AI and Data-Driven Advancements in Industry 4.0)
Show Figures

Figure 1

26 pages, 9564 KiB  
Article
Evaluation and Projection of Precipitation in CMIP6 Models over the Qilian Mountains, China
by Xiaohong Yang, Weijun Sun, Jiake Wu, Jiahang Che, Mengyuan Liu, Qinglin Zhang, Yingshan Wang, Baojuan Huai, Yuzhe Wang and Lei Wang
Remote Sens. 2023, 15(17), 4350; https://0-doi-org.brum.beds.ac.uk/10.3390/rs15174350 - 4 Sep 2023
Cited by 1 | Viewed by 1627
Abstract
The Qilian Mountains (QMs) act as the “water tower” of the Hexi Corridors, playing an important role in the regional ecosystem security and economic development. Therefore, it is of great significance to understand the spatiotemporal characteristics of precipitation in the QMs. This study [...] Read more.
The Qilian Mountains (QMs) act as the “water tower” of the Hexi Corridors, playing an important role in the regional ecosystem security and economic development. Therefore, it is of great significance to understand the spatiotemporal characteristics of precipitation in the QMs. This study evaluated the performance of 21 models of phase 6 of the Coupled Model Intercomparison Project (CMIP6) from 1959 to 1988 based on ERA5 and in situ datasets. In addition, the precipitation changing trend from 2015 to 2100 was projected according to four shared socioeconomic pathways (SSPs): namely, SSP126, SSP245, SSP370, and SSP585. The results have shown the following: (1) all CMIP6 models could reflect the same precipitation changing trend, based on the observed datasets (−2.01 mm·10a−1), which was slightly lower than that of ERA5 (2.82 mm·10a−1). Multi-mode ensemble averaging (MME) showed that the projected precipitation-change trend of the four scenarios was 5.73, 9.15, 12.23, and 16.14 mm·10a−1, respectively. (2) The MME and ERA5 showed the same precipitation spatial pattern. Also, during the period 1959–1988, the MME in spring, summer, autumn and winter was 130.07, 224.62, 95.96, and 29.07 mm, respectively, and that of ERA5 was 98.57, 280.77, 96.85, and 22.64 mm, respectively. The largest precipitation difference in summer was because of strong convection and variable circulation. (3) From 2015 to 2100, the snow-to-rain ratio was between 0.1 and 1.1, and the snow-to-rain ratio climate tendency rate was concentrated in the range of −10~0.1 mm·10a−1. Both of these passed the significance test (p < 0.05). The projected rainfall of all four SSPs all showed an increasing trend with values of 6.20, 11.31, 5.64, and 20.41 mm·10a−1, respectively. The snowfall of the four SSPs all showed a decreasing trend with values of 0.42, 2.18, 3.34, and 4.17 mm·10a−1, respectively. Full article
Show Figures

Graphical abstract

20 pages, 3911 KiB  
Article
Ground-Based Hyperspectral Retrieval of Soil Arsenic Concentration in Pingtan Island, China
by Meiduan Zheng, Haijun Luan, Guangsheng Liu, Jinming Sha, Zheng Duan and Lanhui Wang
Remote Sens. 2023, 15(17), 4349; https://0-doi-org.brum.beds.ac.uk/10.3390/rs15174349 - 4 Sep 2023
Cited by 1 | Viewed by 1079
Abstract
The optimal selection of characteristic bands and retrieval models for the hyperspectral retrieval of soil heavy metal concentrations poses a significant challenge. Additionally, satellite-based hyperspectral retrieval encounters several issues, including atmospheric effects, limitations in temporal and radiometric resolution, and data acquisition, among others. [...] Read more.
The optimal selection of characteristic bands and retrieval models for the hyperspectral retrieval of soil heavy metal concentrations poses a significant challenge. Additionally, satellite-based hyperspectral retrieval encounters several issues, including atmospheric effects, limitations in temporal and radiometric resolution, and data acquisition, among others. Given this, the retrieval performance of the soil arsenic (As) concentration in Pingtan Island, the largest island in Fujian Province and the fifth largest in China, is currently unclear. This study aimed to elucidate this issue by identifying optimal characteristic bands from the full spectrum from both statistical and physical perspectives. We tested three linear models, namely Multiple Linear Regression (MLR), Partial Least Squares Regression (PLSR) and Geographically Weighted Regression (GWR), as well as three nonlinear machine learning models, including Back Propagation Neural Network (BP), Support Vector Machine Regression (SVR) and Random Forest Regression (RFR). We then retrieved soil arsenic content using ground-based soil full spectrum data on Pingtan Island. Our results indicate that the RFR model consistently outperformed all others when using both original and optimal characteristic bands. This superior performance suggests a complex, nonlinear relationship between soil arsenic concentration and spectral variables, influenced by diverse landscape factors. The GWR model, which considers spatial non-stationarity and heterogeneity, outperformed traditional models such as BP and SVR. This finding underscores the potential of incorporating spatial characteristics to enhance traditional machine learning models in geospatial studies. When evaluating retrieval model accuracy based on optimal characteristic bands, the RFR model maintained its top performance, and linear models (MLR, PLSR and GWR) showed notable improvement. Specifically, the GWR model achieved the highest r value for the validation data, indicating that selecting optimal characteristic bands based on high Pearson’s correlation coefficients (e.g., abs(Pearson’s correlation coefficient) ≥0.45) and high sensitivity to soil active materials successfully mitigates uncertainties linked to characteristic band selection solely based on Pearson’s correlation coefficients. Consequently, two effective retrieval models were generated: the best-performing RFR model and the improved GWR model. Our study on Pingtan Island provides theoretical and technical support for monitoring and evaluating soil arsenic concentrations using satellite-based spectroscopy in densely populated, relatively independent island towns in China and worldwide. Full article
Show Figures

Graphical abstract

1 pages, 159 KiB  
Correction
Correction: Zhang et al. Evaluation of the Radiometric Calibration of ZY1-02E Thermal Infrared Data. Remote Sens. 2023, 15, 3905
by Honggeng Zhang, Hongzhao Tang, Xining Liu, Xianhui Dou, Yonggang Qian, Wei Chen and Kun Li
Remote Sens. 2023, 15(17), 4348; https://0-doi-org.brum.beds.ac.uk/10.3390/rs15174348 - 4 Sep 2023
Viewed by 576
Abstract
In the original publication [...] Full article
(This article belongs to the Special Issue Advances in Thermal Infrared Remote Sensing)
17 pages, 7509 KiB  
Article
Spatiotemporal Gravitational Evolution of the Night Land Surface Temperature: An Empirical Study Based on Night Lights
by Qiang Fan, Yue Shi, Bwalya Mutale and Nan Cong
Remote Sens. 2023, 15(17), 4347; https://0-doi-org.brum.beds.ac.uk/10.3390/rs15174347 - 4 Sep 2023
Viewed by 863
Abstract
Land surface temperature (LST) is closely associated with urban and rural development. To study the spatiotemporal evolution of the LST, we used daily night light and LST data as well as the gravity model, coupling coordination model, standard deviation ellipse, and other methods. [...] Read more.
Land surface temperature (LST) is closely associated with urban and rural development. To study the spatiotemporal evolution of the LST, we used daily night light and LST data as well as the gravity model, coupling coordination model, standard deviation ellipse, and other methods. Under the analysis–coordination–gravity framework, we studied the spatiotemporal and gravitational evolution of the nighttime LST in the Henan Province in 2013, 2016, 2019, and 2022. Our research revealed significant differences in the high-brightness values of nighttime lighting between different years and seasons. The maximum offset distance occurred in the winters of 2013–2016 at 20,933.28 m, whereas the minimum offset distance was observed in the autumns of 2019–2022 at 1196.03 m. In addition, the spatiotemporal gravity of the LST exhibits a certain evolution pattern. Although differences in the direction of evolution and the distribution of high gravity density were found, a homogenization trend was observed for the distribution of gravity in the spring of 2016, autumn of 2019, and summer of 2022. LST shows different characteristics over changing space and seasons, and its gravity shows the characteristics of spatial aggregation. The results provide new ideas for LST studies and are of significance for the restoration of ecosystems. Full article
Show Figures

Figure 1

21 pages, 3539 KiB  
Article
Light Absorption by Optically Active Components in the Arctic Region (August 2020) and the Possibility of Application to Satellite Products for Water Quality Assessment
by Tatiana Efimova, Tatiana Churilova, Elena Skorokhod, Vyacheslav Suslin, Anatoly S. Buchelnikov, Dmitry Glukhovets, Aleksandr Khrapko and Natalia Moiseeva
Remote Sens. 2023, 15(17), 4346; https://0-doi-org.brum.beds.ac.uk/10.3390/rs15174346 - 4 Sep 2023
Viewed by 1105
Abstract
In August 2020, during the 80th cruise of the R/V “Akademik Mstislav Keldysh”, the chlorophyll a concentration (Chl-a) and spectral coefficients of light absorption by phytoplankton pigments, non-algal particles (NAP) and colored dissolved organic matter (CDOM) were measured in the Norwegian [...] Read more.
In August 2020, during the 80th cruise of the R/V “Akademik Mstislav Keldysh”, the chlorophyll a concentration (Chl-a) and spectral coefficients of light absorption by phytoplankton pigments, non-algal particles (NAP) and colored dissolved organic matter (CDOM) were measured in the Norwegian Sea, the Barents Sea and the adjacent area of the Arctic Ocean. It was shown that the spatial distribution of the three light-absorbing components in the explored Arctic region was non-homogenous. It was revealed that CDOM contributed largely to the total non-water light absorption (atot(λ) = aph(λ) + aNAP(λ) + aCDOM(λ)) in the blue spectral range in the Arctic Ocean and the Barents Sea. The fraction of NAP in the total non-water absorption was low (less than 20%). The depth of the euphotic zone depended on atot(λ) in the surface water layer, which was described by a power equation. The Arctic Ocean, the Norwegian Sea and the Barents Sea did not differ in the Chl-a-specific light absorption coefficients of phytoplankton. In the blue maximum of phytoplankton absorption spectra, Chl-a-specific light absorption coefficients of phytoplankton in the upper mixed layer (UML) were higher than those below the UML. Relationships between phytoplankton absorption coefficients and Chl-a were derived by least squares fitting to power functions for the whole visible domain with a 1 nm interval. The OCI, OC3 and GIOP algorithms were validated using a database of co-located results (day-to-day) of in situ measurements (n = 63) and the ocean color scanner data: the Moderate Resolution Imaging Spectroradiometer (MODIS) onboard the Terra (EOS AM) and Aqua (EOS PM) satellites, the Visible and Infrared Imager/Radiometer Suite (VIIRS) onboard the Suomi National Polar-orbiting Partnership (S-NPP) and JPSS-1 satellites (also known as NOAA-20), and the Ocean and the Land Color Imager (OLCI) onboard the Sentinel-3A and Sentinel-3B satellites. The comparison showed that despite the technological progress in optical scanners and the algorithms refinement, the considered standard products (chlor_a, chl_ocx, aph_443, adg_443) carried little information about inherent optical properties in Arctic waters. Based on the statistic metrics (Bias, MdAD, MAE and RMSE), it was concluded that refinement of the algorithm for retrieval of water bio-optical properties based on remote sensing data was required for the Arctic region. Full article
Show Figures

Graphical abstract

19 pages, 4505 KiB  
Article
Multi-Source Precipitation Data Merging for High-Resolution Daily Rainfall in Complex Terrain
by Zhi Li, Hao Wang, Tao Zhang, Qiangyu Zeng, Jie Xiang, Zhihao Liu and Rong Yang
Remote Sens. 2023, 15(17), 4345; https://0-doi-org.brum.beds.ac.uk/10.3390/rs15174345 - 3 Sep 2023
Cited by 1 | Viewed by 1148
Abstract
This study developed a satellite, reanalysis, and gauge data merging model for daily-scale analysis using a random forest algorithm in Sichuan province, characterized by complex terrain. A high-precision daily precipitation merging dataset (MSMP) with a spatial resolution of 0.1° was successfully generated. Through [...] Read more.
This study developed a satellite, reanalysis, and gauge data merging model for daily-scale analysis using a random forest algorithm in Sichuan province, characterized by complex terrain. A high-precision daily precipitation merging dataset (MSMP) with a spatial resolution of 0.1° was successfully generated. Through a comprehensive evaluation of the MSMP dataset using various indices across different periods and regions, the following findings were obtained: (1) GPM-IMERG satellite observation data exhibited the highest performance in the region and proved suitable for inclusion as the initial background field in the merging experiment; (2) the merging experiment significantly enhanced dataset accuracy, resulting in a spatiotemporal distribution of precipitation that better aligned with gauge data; (3) topographic factors exerted certain influences on the merging test, with greater accuracy improvements observed in the plain region, while the merging test demonstrated unstable effects in higher elevated areas. The results of this study present a practical approach for merging multi-source precipitation data and provide a novel research perspective to address the challenge of constructing high-precision daily precipitation datasets in regions characterized by complex terrain and limited observational coverage. Full article
Show Figures

Figure 1

15 pages, 1885 KiB  
Communication
Anti-Jamming GNSS Antenna Array Receiver with Reduced Phase Distortions Using a Robust Phase Compensation Technique
by Song Li, Feixue Wang, Xiaomei Tang, Shaojie Ni and Honglei Lin
Remote Sens. 2023, 15(17), 4344; https://0-doi-org.brum.beds.ac.uk/10.3390/rs15174344 - 3 Sep 2023
Cited by 2 | Viewed by 964
Abstract
Antenna arrays with adaptive filtering can protect the integrity and functionality of global navigation satellite system (GNSS) receivers against interference. However, a major problem with existing adaptive array processing algorithms is that they cause phase distortions and introduce bias errors into the carrier [...] Read more.
Antenna arrays with adaptive filtering can protect the integrity and functionality of global navigation satellite system (GNSS) receivers against interference. However, a major problem with existing adaptive array processing algorithms is that they cause phase distortions and introduce bias errors into the carrier phase measurement, limiting high-precision applications. In this paper, a robust phase compensation technique is proposed to reduce the phase distortion. First, a phase bias detection method is developed to trigger the phase compensation technique. Then, the phase bias is estimated using a robust estimation method and compensated for in the GNSS receiver. The proposed technique operates in real time and causes no processing delay, while requiring only a minor modification to existing GNSS receivers. This technique is applied to the power inversion adaptive antenna, and can also be extended to a wide variety of adaptive antennas. The simulation experiments verify the applicability of the proposed technique and also confirm its superiority over existing techniques. Full article
(This article belongs to the Special Issue Advancement of GNSS Signal Processing and Navigation)
Show Figures

Figure 1

15 pages, 9486 KiB  
Technical Note
In-Flight Preliminary Performance of GF-5B/Absorbing Aerosol Sensor
by Yongmei Wang, Zhuo Zhang, Jinghua Mao, Houmao Wang, Entao Shi, Xiaohong Liu, Pengda Li and Jiu Liu
Remote Sens. 2023, 15(17), 4343; https://0-doi-org.brum.beds.ac.uk/10.3390/rs15174343 - 3 Sep 2023
Cited by 1 | Viewed by 739
Abstract
The Absorbing Aerosol Sensor (AAS) is carried on the Gao-Fen 5B (GF-5B) satellite, and it allows for the measurement of solar backscatter radiation by the atmosphere in the UV–Vis bands. The AAS is an imaging spectrometer that employs CCD for capturing both a [...] Read more.
The Absorbing Aerosol Sensor (AAS) is carried on the Gao-Fen 5B (GF-5B) satellite, and it allows for the measurement of solar backscatter radiation by the atmosphere in the UV–Vis bands. The AAS is an imaging spectrometer that employs CCD for capturing both a continuous spectrum and the cross-track orientation with a 114° wide swath. The broad field of view provides daily global envelopment with a 4 km spatial resolution at the nadir. This paper mainly analyzes the initial working status of the instrument in orbit, including wavelength calibration, radiometric calibration, detector performance, and product availability. Preliminary observations indicate the ability of the AAS to monitor absorbing aerosols like dust, biomass burning, volcano ash, and some pollution aerosols and to identify the aerosol events in China and other regions with high spatial resolution. Full article
(This article belongs to the Special Issue Application of Satellite Aerosol Remote Sensing in Air Quality)
Show Figures

Figure 1

18 pages, 6762 KiB  
Article
Analysis of Aerosol Optical Depth and Forward Scattering in an Ultraviolet Band Based on Sky Radiometer Measurements
by Jingjing Liu, Mengping Li, Luyao Zhou, Jinming Ge, Jingtao Liu, Zhuqi Guo, Yangyang Liu, Jun Wang, Qing Yan and Dengxin Hua
Remote Sens. 2023, 15(17), 4342; https://0-doi-org.brum.beds.ac.uk/10.3390/rs15174342 - 3 Sep 2023
Viewed by 1012
Abstract
The sky-radiometer/sun-photometer is the most widely used instrument for obtaining aerosol optical depth (AOD) or aerosol optical properties worldwide. Due to the existence of field of view (FOV, 1°), the radiation received by the sky-radiometer includes the forward scattering in addition to direct [...] Read more.
The sky-radiometer/sun-photometer is the most widely used instrument for obtaining aerosol optical depth (AOD) or aerosol optical properties worldwide. Due to the existence of field of view (FOV, 1°), the radiation received by the sky-radiometer includes the forward scattering in addition to direct solar irradiance. This leads to more diffuse light errors of retrieved AODs, especially for shorter wavelength and heavily polluted weather conditions. Using simulation data of three typical aerosol particles (dust, soot, water-soluble), we first verified the accuracy of the Monte Carlo method for calculating the forward scattering effect. Based on the sky-radiometer data collected in Xi’an (2015–2020) where heavy pollution weather is common, the relative errors and correction factors of the AOD were obtained under different conditions, including various short wavelengths (≤400 nm), solar zenith angles (SZAs) and AODs. Our analysis indicates the close dependence of AOD correction factors on wavelength, SZA, AOD and the optical properties of aerosol particles. The mean relative error in Xi’an increases with the decrease of wavelength (~16.1% at 315 nm) and decreases first and then increases with the increase of the SZA. The relative errors caused by forward scattering can exceed 10% when the AOD is greater than 1 and 25% when the AOD is larger than 2 in the ultraviolet (UV) band. The errors with a wavelength greater than 400 nm and an AOD below 1.0 can be within 5%, which can be ignored. The correlation coefficients of AODs before and after a correction from 315 nm to 400 nm are greater than 0.96, which basically increase with the increase of the wavelength. This indicates that the significance of the forward scattering effect in the Xi’an area with heavy pollution cannot be ignored for short wavelengths. However, such effect is negligible at the longer wavelengths and lower AODs (<1.0) of a sky-radiometer. Full article
Show Figures

Figure 1

18 pages, 112625 KiB  
Article
Insight into the 1 December 2016 Mw 6.2 Juliaca Earthquake, Southern Peru, by InSAR Observations and Field Investigation
by Qingfeng Hu, Weiwei Jia, Jiuyuan Yang and Yanling Zhao
Remote Sens. 2023, 15(17), 4341; https://0-doi-org.brum.beds.ac.uk/10.3390/rs15174341 - 3 Sep 2023
Viewed by 816
Abstract
On 1 December 2016, an Mw 6.2 earthquake characterized by normal faulting occurred in the highlands of the central Andes in southern Peru, marking the region’s largest shallow event. The occurrence of the earthquake provides a significant chance to gain insight into the [...] Read more.
On 1 December 2016, an Mw 6.2 earthquake characterized by normal faulting occurred in the highlands of the central Andes in southern Peru, marking the region’s largest shallow event. The occurrence of the earthquake provides a significant chance to gain insight into the regional tectonic deformation and the seismogenic mechanism of the shallow normal-faulting earthquake, as well as the regional potential seismic risk. Here, we first utilize Sentinel-1A interferometric synthetic aperture radar (InSAR) data to extract the coseismic and postseismic deformation associated with this earthquake and then determine the detailed coseismic slip and postseismic afterslip distribution of this event. Coseismic modeling results indicate that the coseismic rupture is mainly characterized by normal faulting with some dextral strike-slip components. Most coseismic slip is confined to a depth range of 2–12 km, indicating an obvious slip deficit area in the shallow fault part. Further postseismic modeling reveals that the majority of afterslip is concentrated at depths of 0 to 5.4 km. The relatively shallow postseismic afterslip makes up for the coseismic slip deficit area to some extent. Through a joint analysis of the inversions, seismic data, and regional geology and geomorphology, we infer that the occurrence of this 2016 normal-faulting event is a result of regional gravitational collapse. In addition, we investigate the relationship between the 2016 earthquake and great historical earthquakes near the subduction zone of the central Andes and find that the 2016 event is likely promoted in advance by these events through our calculations of the coseismic and postseismic Coulomb stress changes. Finally, we should pay more attention to the nearby Falla Huaytacucho-Condoroma fault and the western segment of the Vilcanota Fault because of their relatively high stress loading. Full article
(This article belongs to the Special Issue Remote Sensing in Earthquake, Tectonics and Seismic Hazards)
Show Figures

Figure 1

34 pages, 10148 KiB  
Article
Research on Soil Moisture Inversion Method for Canal Slope of the Middle Route Project of the South to North Water Transfer Based on GNSS-R and Deep Learning
by Qingfeng Hu, Yifan Li, Wenkai Liu, Weiqiang Lu, Hongxin Hai, Peipei He, Xianlin Liu, Kaifeng Ma, Dantong Zhu, Peng Wang and Yingchao Kou
Remote Sens. 2023, 15(17), 4340; https://0-doi-org.brum.beds.ac.uk/10.3390/rs15174340 - 3 Sep 2023
Viewed by 1026
Abstract
The soil moisture from the South-to-North Water Diversion Middle Route Project is assessed in this study. Complex and variable geological conditions complicate the prediction of soil moisture in the study area. To achieve this aim, we carried out research on soil moisture inversion [...] Read more.
The soil moisture from the South-to-North Water Diversion Middle Route Project is assessed in this study. Complex and variable geological conditions complicate the prediction of soil moisture in the study area. To achieve this aim, we carried out research on soil moisture inversion methods for channel slopes in the study area using massive monitoring data from multiple GNSS observatories on channel slopes, incorporating GNSS-R techniques and deep learning algorithms. To address the issue of low accuracy in linear inversion when using a single satellite, this study proposes a multi-satellite and multi-frequency data fusion technique. Furthermore, three soil moisture inversion models, namely, the linear model, BP neural network model, and GA-BP neural network model, are established by incorporating deep learning techniques. In comparison with single-satellite data inversion, with the data fusion technique proposed in this study, the correlation is improved by 12.7%, the root mean square error is reduced by 0.217, the mean square error is decreased by 0.884, and the mean absolute error is decreased by 0.243 with the linear model. With the BP neural network model, the correlation is increased by 15.4%, the root mean square error is decreased by 0.395, the mean square error is decreased by 0.465, and the mean absolute error is reduced by 0.353. Moreover, with the GA-BP neural network model, the correlation is improved by 6.3%, the root mean square error is decreased by 1.207, the mean square error is decreased by 0.196, and the mean absolute error is reduced by 0.155. The results indicate that performing data fusion by using multiple satellites and multi-frequency bands is a feasible approach for improving the accuracy of soil moisture inversion. These research findings provide new technical means for the risk analysis of deformation disasters in the expansive soil channel slopes of the South-to-North Water Diversion Middle Route Project. Full article
Show Figures

Figure 1

21 pages, 3484 KiB  
Article
Monitoring Agricultural Land and Land Cover Change from 2001–2021 of the Chi River Basin, Thailand Using Multi-Temporal Landsat Data Based on Google Earth Engine
by Savittri Ratanopad Suwanlee, Surasak Keawsomsee, Morakot Pengjunsang, Nudthawud Homtong, Amornchai Prakobya, Enrico Borgogno-Mondino, Filippo Sarvia and Jaturong Som-ard
Remote Sens. 2023, 15(17), 4339; https://0-doi-org.brum.beds.ac.uk/10.3390/rs15174339 - 3 Sep 2023
Viewed by 3298
Abstract
In recent years, climate change has greatly affected agricultural activity, sustainability and production, making it difficult to conduct crop management and food security assessment. As a consequence, significant changes in agricultural land and land cover (LC) have occurred, mostly due to the introduction [...] Read more.
In recent years, climate change has greatly affected agricultural activity, sustainability and production, making it difficult to conduct crop management and food security assessment. As a consequence, significant changes in agricultural land and land cover (LC) have occurred, mostly due to the introduction of new agricultural practices, techniques and crops. Earth Observation (EO) data, cloud-computing platforms and powerful machine learning methods can certainly support analysis within the agricultural context. Therefore, accurate and updated agricultural land and LC maps can be useful to derive valuable information for land change monitoring, trend planning, decision-making and sustainable land management. In this context, this study aims at monitoring temporal and spatial changes between 2001 and 2021 (with a four 5-year periods) within the Chi River Basin (NE–Thailand). Specifically, all available Landsat archives and the random forest (RF) classifier were jointly involved within the Google Earth Engine (GEE) platform in order to: (i) generate five different crop type maps (focusing on rice, cassava, para rubber and sugarcane classes), and (ii) monitoring the agricultural land transitions over time. For each crop map, a confusion matrix and the correspondent accuracy were computed and tested according to a validation dataset. In particular, an overall accuracy > 88% was found in all of the resulting five crop maps (for the years 2001, 2006, 2011, 2016 and 2021). Subsequently the agricultural land transitions were analyzed, and a total of 18,957 km2 were found as changed (54.5% of the area) within the 20 years (2001–2021). In particular, an increase in cassava and para rubber areas were found at the disadvantage of rice fields, probably due to two different key drivers taken over time: the agricultural policy and staple price. Finally, it is worth highlighting that such results turn out to be decisive in a challenging agricultural environment such as the Thai one. In particular, the high accuracy of the five derived crop type maps can be useful to provide spatial consistency and reliable information to support local sustainable agriculture land management, decisions of policymakers and many stakeholders. Full article
Show Figures

Figure 1

20 pages, 13848 KiB  
Article
Learning Contours for Point Cloud Completion
by Jiabo Xu, Zeyun Wan and Jingbo Wei
Remote Sens. 2023, 15(17), 4338; https://0-doi-org.brum.beds.ac.uk/10.3390/rs15174338 - 3 Sep 2023
Cited by 1 | Viewed by 1209
Abstract
The integrity of a point cloud frequently suffers from discontinuous material surfaces or coarse sensor resolutions. Existing methods focus on reconstructing the overall structure, but salient points or small irregular surfaces are difficult to be predicted. Toward this issue, we propose a new [...] Read more.
The integrity of a point cloud frequently suffers from discontinuous material surfaces or coarse sensor resolutions. Existing methods focus on reconstructing the overall structure, but salient points or small irregular surfaces are difficult to be predicted. Toward this issue, we propose a new end-to-end neural network for point cloud completion. To avoid non-uniform point density, the regular voxel centers are selected as reference points. The encoder and decoder are designed with Patchify, transformers, and multilayer perceptrons. An implicit classifier is incorporated in the decoder to mark the valid voxels that are allowed for diffusion after removing vacant grids from completion. With newly designed loss function, the classifier is trained to learn the contours, which helps to identify the grids that are difficult to be judged for diffusion. The effectiveness of the proposed model is validated in the experiments on the indoor ShapeNet dataset, the outdoor KITTI dataset, and the airbone laser dataset by competing with state-of-the-art methods, which show that our method can predict more accurate point coordinates with rich details and uniform point distributions. Full article
Show Figures

Graphical abstract

17 pages, 1045 KiB  
Article
Ship Detection via Multi-Scale Deformation Modeling and Fine Region Highlight-Based Loss Function
by Chao Li, Jianming Hu, Dawei Wang, Hanfu Li and Zhile Wang
Remote Sens. 2023, 15(17), 4337; https://0-doi-org.brum.beds.ac.uk/10.3390/rs15174337 - 3 Sep 2023
Viewed by 1141
Abstract
Ship detection in optical remote sensing images plays a vital role in numerous civil and military applications, encompassing maritime rescue, port management and sea area surveillance. However, the multi-scale and deformation characteristics of ships in remote sensing images, as well as complex scene [...] Read more.
Ship detection in optical remote sensing images plays a vital role in numerous civil and military applications, encompassing maritime rescue, port management and sea area surveillance. However, the multi-scale and deformation characteristics of ships in remote sensing images, as well as complex scene interferences such as varying degrees of clouds, obvious shadows, and complex port facilities, pose challenges for ship detection performance. To address these problems, we propose a novel ship detection method by combining multi-scale deformation modeling and fine region highlight-based loss function. First, a visual saliency extraction network based on multiple receptive field and deformable convolution is proposed, which employs multiple receptive fields to mine the difference between the target and the background, and accurately extracts the complete features of the target through deformable convolution, thus improving the ability to distinguish the target from the complex background. Then, a customized loss function for the fine target region highlight is employed, which comprehensively considers the brightness, contrast and structural characteristics of ship targets, thus improving the classification performance in complex scenes with interferences. The experimental results on a high-quality ship dataset indicate that our method realizes state-of-the-art performance compared to eleven considered detection models. Full article
(This article belongs to the Special Issue Deep Learning Techniques Applied in Remote Sensing)
Show Figures

Figure 1

11 pages, 10897 KiB  
Article
Spectral Characteristics of Beached Sargassum in Response to Drying and Decay over Time
by Chris J. Chandler, Silvia Valery Ávila-Mosqueda, Evelyn Raquel Salas-Acosta, Eden Magaña-Gallegos, Edgar Escalante Mancera, Miguel Angel Gómez Reali, Betsabé de la Barreda-Bautista, Doreen S. Boyd, Sarah E. Metcalfe, Sofie Sjogersten, Brigitta van Tussenbroek, Rodolfo Silva and Giles M. Foody
Remote Sens. 2023, 15(17), 4336; https://0-doi-org.brum.beds.ac.uk/10.3390/rs15174336 - 2 Sep 2023
Cited by 1 | Viewed by 1199
Abstract
The bloom of pelagic Sargassum in the Atlantic Ocean has become increasingly problematic, especially when the algae have beached. A build-up of decaying beached material has damaging effects on coastal ecosystems and tourism industries. While remote sensing offers an effective tool to assess [...] Read more.
The bloom of pelagic Sargassum in the Atlantic Ocean has become increasingly problematic, especially when the algae have beached. A build-up of decaying beached material has damaging effects on coastal ecosystems and tourism industries. While remote sensing offers an effective tool to assess the spatial and temporal patterns of Sargassum over large spatial extents, its use so far has been limited to a broad discrimination of Sargassum species from other macroalgae and floating vegetation. Knowledge on the spatial distribution of decayed material will help to support management strategies and inform targeted removal. In this study, we aim to characterise the spectral response of fresh and decayed Sargassum and identify regions of the spectra that offer the greatest separability for the detection and classification of decayed material. We assessed the spectral response of fresh and decayed Sargassum (1) in situ on the beach and (2) in mesocosm experiments where Sargassum samples were allowed to decay over time. We found a decrease in the magnitude of reflectance, noticeably in the visible region (400–700 nm), for decayed, in contrast to fresh, Sargassum. Separability analyses also showed that most spectral bands with a wavelength > ~540 nm will be capable of discriminating between fresh and decayed material, although the near-infrared region offers the greatest degree of separability. We demonstrate, for the first time, that there are clear differences in the spectral reflectance of fresh and decayed Sargassum with potential application for remote sensing approaches. Full article
(This article belongs to the Section Environmental Remote Sensing)
Show Figures

Figure 1

31 pages, 5783 KiB  
Article
Multi-Granularity Modeling Method for Effectiveness Evaluation of Remote Sensing Satellites
by Ming Lei and Yunfeng Dong
Remote Sens. 2023, 15(17), 4335; https://0-doi-org.brum.beds.ac.uk/10.3390/rs15174335 - 2 Sep 2023
Viewed by 752
Abstract
The effectiveness indicator system of remote sensing satellites includes various satellites capabilities. Effectiveness evaluation is the process of calculating these indicators in the digital world, involving many different physical parameters of multiple subsystems. Model-based simulation statistics method is the mainstream approach of effectiveness [...] Read more.
The effectiveness indicator system of remote sensing satellites includes various satellites capabilities. Effectiveness evaluation is the process of calculating these indicators in the digital world, involving many different physical parameters of multiple subsystems. Model-based simulation statistics method is the mainstream approach of effectiveness evaluation, and digital twin is currently the most advanced modeling method for simulation. The satellite digital twin model has the characteristics of multi-dynamic, multi-spatial scale and multi-physics field coupling, which gives rise to challenges related to the stiff problem of ordinary differential equations and multi-scale problem of partial differential equations to the calculation process of indicators. It is difficult to solve these problems by breakthroughs in numerical solution methods. This paper uses the sparsity of the satellite system to group each indicator of the effectiveness evaluation indicator system according to the change period. The satellite system model is decomposed into multiple modules according to the composition and structure, and a series of models with different simulation fidelity are established for each module. The optimization schemes for selecting model granularity when calculating indicators by group is given. Simulation results show that this approach considers the coupling between systems, grasps the main contradiction of indicator calculation and overcomes the loss of indicator accuracy caused by the separate calculation of each subsystem under the neglect of coupling in the traditional method. Additionally, it avoids the difficulty in numerical calculation caused by coupling, while simultaneously balancing the accuracy and efficiency of the model simulations. Full article
(This article belongs to the Section Engineering Remote Sensing)
Show Figures

Figure 1

17 pages, 5355 KiB  
Article
Fast Variational Bayesian Inference for Space-Time Adaptive Processing
by Xinying Zhang, Tong Wang and Degen Wang
Remote Sens. 2023, 15(17), 4334; https://0-doi-org.brum.beds.ac.uk/10.3390/rs15174334 - 2 Sep 2023
Viewed by 721
Abstract
Space-time adaptive processing (STAP) approaches based on sparse Bayesian learning (SBL) have attracted much attention for the benefit of reducing the training samples requirement and accurately recovering sparse signals. However, it has the problem of a heavy computational burden and slow convergence speed. [...] Read more.
Space-time adaptive processing (STAP) approaches based on sparse Bayesian learning (SBL) have attracted much attention for the benefit of reducing the training samples requirement and accurately recovering sparse signals. However, it has the problem of a heavy computational burden and slow convergence speed. To improve the convergence speed, the variational Bayesian inference (VBI) is introduced to STAP in this paper. Moreover, to improve computing efficiency, a fast iterative algorithm is derived. By constructing a new atoms selection rule, the dimension of the matrix inverse problem can be substantially reduced. Experiments conducted on the simulated data and measured data verify that the proposed algorithm has excellent clutter suppression and target detection performance. Full article
Show Figures

Figure 1

19 pages, 6727 KiB  
Article
Combined Retrievals of Turbidity from Sentinel-2A/B and Landsat-8/9 in the Taihu Lake through Machine Learning
by Zhe Yang, Cailan Gong, Zhihua Lu, Enuo Wu, Hongyan Huai, Yong Hu, Lan Li and Lei Dong
Remote Sens. 2023, 15(17), 4333; https://0-doi-org.brum.beds.ac.uk/10.3390/rs15174333 - 2 Sep 2023
Viewed by 1304
Abstract
Lakes play a crucial role in the earth’s ecosystems and human activities. While turbidity is not a direct biochemical indicator of lake water quality, it is relatively easy to measure and indicates trophic status and lake health. Although ocean color satellites have been [...] Read more.
Lakes play a crucial role in the earth’s ecosystems and human activities. While turbidity is not a direct biochemical indicator of lake water quality, it is relatively easy to measure and indicates trophic status and lake health. Although ocean color satellites have been widely used to monitor water color parameters, their coarse spatial resolution makes it hard to capture the fine spatial variability of turbidity in lakes. The combination of Sentinel-2 and Landsat provides an opportunity to monitor lake turbidity with high spatial and temporal resolution. This study aims to generate consistent turbidity products in Taihu Lake from 2018 to 2022 using the Multispectral Instrument (MSI) on board Sentinel-2A/B and the Operational Land Imager (OLI) on board Landsat-8/9. We first tested the performance of three atmospheric correction methods to retrieve consistent reflectance from MSI and OLI images. We found that the Rayleigh correction and a subtraction of the SWIR band from Rayleigh-corrected reflectance can generate the most consistent reflectance (the coefficient of determination (R2) > 0.84, the mean absolution percentage error (MAPE) < 7%, the median error (ME) < 0.0035, and slope > 0.92). Machine learning models outperformed an existing semi-analytical retrieval algorithm in retrieving turbidity (MSI: R2 = 0.92, MAPE = 18.78%, and OLI: R2 = 0.93, MAPE = 16.20%). The consistency of turbidity from the same-day MSI and OLI images was also satisfactory (N = 3110 and MAPE = 26.48%). The distribution of turbidity exhibited obvious spatial and seasonal variability in Taihu Lake from 2018 to 2022. The results show the potential of MSI and OLI when combined to monitor inland lake water quality. Full article
Show Figures

Figure 1

22 pages, 4637 KiB  
Article
Spatiotemporal Variation in Driving Factors of Vegetation Dynamics in the Yellow River Delta Estuarine Wetlands from 2000 to 2020
by Zhongen Niu, Bingcheng Si, Dong Li, Ying Zhao, Xiyong Hou, Linlin Li, Bin Wang, Bing Song, Mengyu Zhang, Xiyu Li, Na Zeng, Xiaobo Zhu, Yan Lv and Ziqi Mai
Remote Sens. 2023, 15(17), 4332; https://0-doi-org.brum.beds.ac.uk/10.3390/rs15174332 - 2 Sep 2023
Viewed by 998
Abstract
Previous studies of vegetation dynamics in the Yellow River Delta (YRD) predominantly relied on sparse time series or coarse-resolution images, which not only overlooked the rapid and spatially heterogeneous changes, but also limited our understanding of driving mechanisms. Here, employing spatiotemporal data fusion [...] Read more.
Previous studies of vegetation dynamics in the Yellow River Delta (YRD) predominantly relied on sparse time series or coarse-resolution images, which not only overlooked the rapid and spatially heterogeneous changes, but also limited our understanding of driving mechanisms. Here, employing spatiotemporal data fusion methods, we constructed a novel fused enhanced vegetation index (EVI) dataset with a high spatiotemporal resolution (30-meter and 8-day resolution) for the YRD from 2000 to 2020, and we analyzed the vegetation variations and their driving factors within and outside the YRD Nation Natural Reserve (YRDNRR). The fused EVI effectively captured spatiotemporal vegetation dynamics. Notably, within the YRDNRR core area, the fused EVI showed no significant trend before 2010, while a significant increase emerged post-2010, with an annual growth of 7%, the invasion of Spartina alterniflora explained 78% of this EVI increment. In the YRDNRR experimental area, the fused EVI exhibited a distinct interannual trend, which was characterized by an initial increase (2000–2006, p < 0.01), followed by a subsequent decrease (2006–2011, p < 0.01) and, ultimately, a renewed increase (2011–2020, p > 0.05); the dynamics of the fused EVI were mainly affected by the spring runoff (R2 = 0.71), while in years with lower runoff, it was also affected by the spring precipitation (R2 = 0.70). Outside of the protected area, the fused EVI demonstrated a substantial increase from 2000 to 2010 due to agricultural land expansion and human management practices, followed by stabilization post-2010. These findings enhance our comprehension of intricate vegetation dynamics in the YRD, holding significant relevance in terms of wetland preservation and management. Full article
(This article belongs to the Special Issue Remote Sensing for Wetland Restoration)
Show Figures

Figure 1

17 pages, 10462 KiB  
Article
Improved Global Navigation Satellite System–Multipath Reflectometry (GNSS-MR) Tide Variation Monitoring Using Variational Mode Decomposition Enhancement
by Di Yang, Wei Feng, Dingfa Huang and Jianfeng Li
Remote Sens. 2023, 15(17), 4331; https://0-doi-org.brum.beds.ac.uk/10.3390/rs15174331 - 2 Sep 2023
Viewed by 825
Abstract
Accuracy and resolution are the two primary challenges that impose limitations on the practical implementation of classical tide-level remote sensing. To improve the accuracy and applicability and increase the temporal resolution of the inversion point near the shore area, the influence of coastal [...] Read more.
Accuracy and resolution are the two primary challenges that impose limitations on the practical implementation of classical tide-level remote sensing. To improve the accuracy and applicability and increase the temporal resolution of the inversion point near the shore area, the influence of coastal reflection signals in the signal-to-noise ratio (SNR) residual sequence should be weakened significantly. This contribution proposes an anti-interference GNSS Multipath Reflectometry (GNSS-MR) algorithm called VMD_SNR, which is enhanced using variational mode decomposition (VMD). Compared with wavelet decomposition and empirical mode decomposition (EMD) methods, VMD_SNR exhibits superior capabilities in reducing the interference caused by noisy signals. The measurements of ground-based GNSS stations are used to verify the performance improvement in the VMD_SNR algorithm. The results show that the proposed algorithm is better than the wavelet decomposition method and EMD method in terms of accuracy and stability in the shore area, where the effective number is higher than 99% of the total number, and the accuracy is better than 13.80 cm. Moreover, the accuracy improvement is more significant in the high-elevation range, which is 30.16% higher than the wavelet decomposition method and 38.34% higher than the EMD method. Full article
Show Figures

Figure 1

Previous Issue
Back to TopTop