
A Cartographic Perspective on the Planetary Geologic Mapping Investigation of Ceres

1
German Aerospace Center (DLR), Institute for Planetary Research (PF), Rutherfordstr. 2, 12489 Berlin, Germany
2
Geomatics Group, Department of Land Economics, National Chengchi University (NCCU), Taipei City 11605, Taiwan
*
Author to whom correspondence should be addressed.
†
Current address: Vulcan Energy Subsurface Solutions GmbH, 76227 Karlsruhe, Germany.
Remote Sens. 2023, 15(17), 4209; https://0-doi-org.brum.beds.ac.uk/10.3390/rs15174209
Submission received: 18 July 2023
/
Revised: 19 August 2023
/
Accepted: 24 August 2023
/
Published: 27 August 2023
(This article belongs to the Special Issue Planetary Geologic Mapping and Remote Sensing)
Abstract
:The NASA Dawn spacecraft visited asteroid 4 Vesta between 2011 and 2012 and dwarf planet 1 Ceres between 2015 and 2018 to investigate their surfaces through optical and hyperspectral imaging and their composition through gamma-ray and neutron spectroscopy. For the global mapping investigation of both proto-planets, geologic mappers employed Geographic Information System (GIS) software to map 15 quadrangles using optical and hyperspectral data and to produce views of the geologic evolution through individual maps and research papers. While geologic mapping was the core motivation of the mapping investigation, the project never aimed to produce homogeneous and consistent map representations. The chosen mapping approach and its implementation led to a number of inconsistencies regarding cartographic representation, including differential generalization through varying mapping scales, topologic inconsistencies, lack of semantic integrity, and scale consistency, and ultimately, to the management of reusable research data. Ongoing data acquisition during the mapping phase created additional challenges for the homogenization of mapping results and a potential derivation of a global map. This contribution reviews cartographic and data perspectives on the mapping investigation of Ceres and highlights (a) data sources, (b) the cartographic concept, (c) mapping conduct, and (d) dissemination as well as research-data management arrangements. It furthermore discusses decisions and experiences made during mapping and finishes with a set of recommendations from the viewpoint of the cartographic sciences.
1. Introduction and Background
1.1. Background
The planetary geologic exploration of Solar System bodies is a fundamental part of planetary sciences and targets the development of an understanding of planetary evolution under exogenic and endogenic forces. Over recent decades, hundreds of geologic investigations and maps have been published, starting with mapping investigations at small map scales for the Geologic Atlas of the Moon in the early 1960s based on orbital and in situ data [1,2]. Beyond fundamental scientific questions and landing-site characterizations, geologic mapping has become of major importance when analyzing the potential for future mineral exploitation and extraction, e.g., through resource mining [3]. In its most general form, planetary geologic mapping describes an investigation method in which planetary surfaces are classified and mapped according to homogeneous material units that have been formed through a distinct process during a distinct time in geologic history. The aim of such investigations is to understand the geologic formation history of planets, moons, and other small planetary bodies. Map products derived from such investigations thus combine information about surface materials (units), formation processes, as well as relative and absolute timing along with the unit’s spatial distribution in its explicitly mapped lateral as well as implicitly displayed vertical directions [4]. Geological maps, therefore, depict the spatio-temporal relationships of planetary surface materials and processes. As such, mapping is one of the most important tools of planetary geology, in which Earth-based principles are applied to other planetary objects in order to break down complex settings and to gain in-depth insights about the origins of units [2,5,6].
As of today, planetary geologic mapping is based on orbital data, mainly as in situ exploration by rovers cannot cover significant areal extents. The majority of planetary geological maps are based on the comparative analysis of optical images, multi- and hyperspectral images, high-energy data, radar data, as well as derivative products developed at ground facilities, such as digital terrain models (DTM). A comprehensive summary of the building blocks of mapping as foundational data products is discussed in Ref. [7]. With the increase in scientific and technological developments since the beginning of sensor-based planetary exploration around the 1960s, the quality and quantity of planetary data increased and mapping could be conducted at much larger map scales and smaller spatial extents.
Planetary geologic maps are commonly created during investigations that are regionally confined to a specific research area, and they are published as image subsets or supplements to research papers [8]. They follow no particular convention, and their layout, contents, and quality differ largely from publication to publication. In a few cases, large map sheets are published as dedicated mapping investigations although outlets are relatively sparse [9]. The majority of planetary geologic maps, however, have been published through coordinated programs headed by the United States Geological Survey (USGS) and funded by NASA or through support from dedicated national funding programs. Those maps and associated reports remain in the public domain and may be downloaded or ordered as analog copies from the survey’s data warehouse in which a metadata catalog is maintained. In addition to the USGS mapping program [10,11] and the traditional data archives such as the Planetary Data System [12] and the Planetary Science Archive [13], a number of institutional and community efforts exist to coordinate the collection of spatial information and maps, such as the International Planetary Data Alliance (IPDA) [14], NASA/USGS Mapping and Planetary Spatial Infrastructure Team (MAPSIT) [15], or Planmap [16,17,18]. Recent efforts have been looking beyond the traditional pipeline, leading to the archival of data and maps, and focusing on investigating topics such as the implementation of data infrastructures with associated research data management in the planetary domain [7,19,20,21,22,23,24].
Until today, the initial geologic mapping investigations of the proto-planets Vesta and Ceres are the only modern large-scale efforts that have not been led by the USGS but were part of an investigation that was carried out alongside the ongoing data acquisition in orbit around Vesta and Ceres [25,26,27]. The geologic mapping campaign was developed to provide a systematic and initial characterization of the global and regional geology of both planetary bodies. This investigation aimed to provide context for
- Other instrument teams onboard Dawn, aiming to determine their geochemistry and mineralogy using a hyperspectral imager and a gamma-ray and neutron detector;
The major aim of the geologic mapping investigation of Ceres was to develop an understanding of the global geology and chronostratigraphy of Ceres through iterative geologic mapping at low and high spatial resolution during the mission’s lifetime [29] and depending on the data return from low- and high-altitude orbits. More specifically, the mapping investigation includes the identification of the origin of various surface features and their spatial distribution, the identification and mapping of geologic units, and the identification and characterization of stratigraphic relationships. The mapping approach was different from other mapping investigations as data kept arriving when mapping already started using survey, high-altitude, and lower-resolution data [29].
1.2. Objectives
The background described above provides the motivation for reviewing the mapping investigation at Ceres from a cartographic viewpoint and from the viewpoint of contemporary research-data management needs and to investigate the chosen approach and the potential reuse value. More specifically, this contribution tries to
- Review and discuss the cartographic object model under the project’s boundary constraints, including availability and use of cartographic base data and definition of map sheets;
- Review mapping conduct and mapping support;
- Review the approach to disseminate and make the research results available.
The first author of this contribution (A.N.) was involved in the geologic mapping investigation at Ceres to provide support in GIS, cartographic, and data modeling matters.
A discussion for this mapping investigation is timely as it complements the retrospective from the scientific point of view as provided by Refs. [28,29] and might help to discuss or even improve future collaborative mapping investigations. Furthermore, by identifying relevant cartographic requirements and by discussing potentials, a set of recommendations can be developed, which might guide not only human mappers but also machine-based mapping performed through AI-based methods in the near future. As autonomous impact-crater mapping and landform detection and classification have seen new impulses through machine-learning algorithms [31,32,33,34,35,36], new research on unit delineation, segmentation, and classification is likely soon to spawn also in the planetary domain. Those machine-based methods, however, need to withstand the same criticism when it comes to object models and cartographic realization. And, while past publications have shown the efficiency of such tools, they are usually not validated against manually measured data, which would qualify as the closest we reach a ground truth. This contribution aimed to provide a few first impulses in this direction.
While quadrangle-based mapping has always been conducted in the past (e.g., the USGS Geologic Atlas of the Moon), the steps and the requirements from quadrangle-based mapping to producing a coherent and consistent global cartographic product as an additional product have never been exploited in any detail thus far. This contribution, therefore, aims to identify cartographic and data management aspects that help close this gap. However, for the geologic mapping investigation of Ceres, compilation (or unification [37]) has never been an objective.
Another point of motivation is that there has been an evolving need to make results accessible to the public and peer research by introducing strategies for research data management and data reuse. This investigation attempts to discuss this topic to highlight aspects related to more efficient planning for future reuse of research data. It aims to improve the contextualization of research products in order to derive new findings by linking spatial information more efficiently with each other. A development of this type would also support initiatives such as GoFair [38]; the Committee on Data for Science and Technology [39]; Research Data Alliance [40]; and finally, the FAIR-principles [41].
The concrete objectives of this investigation can be summarized as follows:
- Creating a higher-level cartographic abstraction of the geological mapping investigation of Ceres to highlight and discuss major cartographic tasks associated with the mapping investigation;
- Discussing relevant constituents of the cartographic concept and their implementation and potential, ranging from data sources and conducting over-mapping to dissemination and research data management;
- Providing recommendations based on the lessons learned in this mapping investigation.
1.3. Structure
In the first part of this contribution, the investigation is contextualized by first introducing the motivation and requirements for the mapping investigation in general and by emphasizing the need to review and discuss the cartographic viewpoint. Also here, the main objectives related to this research and the potential impact beyond the limited boundaries of this research paper are highlighted. The methodology (Section 2) describes and discusses the cartographic components within the geologic mapping investigation and how they were integrated into the overall process and within each project phase. This section describes the underlying approach for how the geologic mapping investigation was cartographically conceptualized under given project constraints and how it was logically designed and implemented. The focus here is put on four core elements: (1) cartographic base data, (2) the cartographic design concept (sensu stricto), (3) mapping conduct, and (4) research data and dissemination.
As highlighted in the subsequent section, design freedom for the mapping investigation was limited due to overarching project definitions. Consequently, the results (cf. Section 3) will focus on the presentation and discussion of the actual mapping results, i.e., maps and data products, and the potentials rather than on the mapping management and coordination itself. In addition, a discussion about the future reuse of mapping results is given due to the growing relevance of efficient research data management. More importantly, this section will discuss the potential of reaching additional goals and discuss the required effort and feasibility. This may provide a benchmark for future collaborative mapping investigations that might be time-constrained. In the conclusions (Section 4), a synthesis and major recommendations based on this investigation are presented.
2. Data and Methods
2.1. Base Data and Data Management
Dwarf planet Ceres has a dimension of (964.4 km × 964.2 km × 891.8 km) ± 0.2 km and is best represented as a triaxial ellipsoid. For cartographic and mapping purposes, its shape is reduced to a sphere with a radius of 470 km. Its longitude domain is traditionally 180° in the positive east direction with impact crater Kait located at 0.2°S, marking the central meridian [42].
Cartographic base data for mapping consist exclusively of data from the instruments onboard the Dawn spacecraft as no prior orbital observations exist. As the mission was still ongoing during the time of the geologic mapping investigation, lower-resolution base data had to be updated to high-resolution data during the mapping phase, which ultimately required a more iterative mapping conduct. The main basis for the geologic mapping investigation was optical data from the dual framing camera instruments (FC), which consisted of a 1024 × 1024 pixel charge-coupled device (CCD) sensor and a 150 mm focal-length telescope. During Dawn’s mapping phase, the spacecraft imaged Ceres from three different orbital altitudes: a 4425 km survey orbit, a 1475 km high-altitude mapping orbit (HAMO), and a 375 km to 410 km low-altitude mapping orbit (LAMO) [43].
In HAMO, the framing camera took about 2490 clear-filter images with a resolution of about 140 m/pixel. The individual frames were selected according to homogeneous illumination conditions and a subset was processed by the FC team to generate a panchromatic near-global image mosaic [44]. Based on this dataset, 15 map sheets using a traditional quadrangle schema were created at a map scale of 1:750,000 [44]. During LAMO, the camera took about 31,300 clear-filter images with an image scale of 35 m/px from which a global image mosaic was created [45]. Again, based on a subset of that data, a Ceres LAMO atlas consisting of 62 map tiles with a map scale of 1:250,000 was compiled and published [46].
Based on the HAMO clear-filter image collection, a global digital terrain model (DTM) was photogrammetrically derived at a scale of 135 m/px (60 pixels per degree) and with a vertical accuracy of about 10 m [46,47]. The heights are calculated as ellipsoidal heights and refer to an oblate spheroid (two-axial ellipsoid) with a semi-major axis of 482 km and a semi-minor axis of 446 km [47]. The digital terrain model not only serves in height and relief estimates but also is used for photogrammetric control for the HAMO mosaic. For the mapping investigation, a global DTM was provided in an equidistant cylindrical projection. Hemispheric DTMs were provided for both polar regions in polar-stereographic projections. DTMs for GIS integration are formatted as 16-bit raster images with raster values representing the height above the reference spheroid with a 1 m binning [47].
While for the geologic mapping investigation, data sources were limited, the decision was made to not systematically include additional single frames with varying illumination conditions in order to balance the limited expected information gain and the expected complexity when adding new data sources. Accordingly, by using the pre-compiled image mosaic, only a small subset of images has effectively been used for mapping [29,44,45].
Hyperspectral information was also not systematically added to the database (Figure 1) but was provided for individual mappers if required in order to limit the complexity of the mapping investigation.
In addition to this base data, feature datasets (FD) were created within ESRI’s ArcGIS 10 File-Geodatabase (FGDB) container to host individual feature classes (FC) containing the actual mapping information (see Figure 1). The FD concepts allowed us to maintain a consistent map projection throughout the project for all data that were added into the FD container. Individual feature classes for geologic mapping contained point, line, and surface geometries for geological contacts and unit representation. The image data mosaic, digital terrain mode data, and nomenclature information were added from external sources to form a consistent dataset.
The map layout and database design were kept minimal to not limit mappers through too many constraints which could have led to abandoning the data model due to frustration or conceived technical issues [48]. The original motivation was the implementation of a data model as presented in Ref. [49] which would put more constraints on mappers.
2.2. Cartographic Concept
While not universally defined, a cartographic concept addresses the way data and objects are modeled and put into relationship to each other, and defines how they are cartographically visualized considering the needs of the target audience. With modern cartography being a wide field, a cartographic concept might be implemented in different ways for different purposes. The cartographic concept will, here, in its most general form, be understood as a combination of aspects targeted at managing input data and converting a topic into a comprehensible form using cartographic techniques. The concept, therefore, comprises aspects such as base-data selection, as well as cartographic objects and their relationships, i.e., the digital object model and the cartographic (visualization) model. Due to the limited variety of source data in this project and due to a number of pre-defined project constraints, the cartographic concept could not be developed from bottom up but rather represented a simplified informal top-down approach loosely related to concepts established at the USGS [50]. The target audience as defined in Ref. [29] were instrument teams of the DAWN mission as well as planetary researchers that will be working on geologic topics, i.e., the same community that performs the actual geologic mapping. Consequently, no adaptation regarding the topic’s complexity had to be introduced as the target audience would expect to see and work with the same style of research papers and maps that they have been used to.
The following paragraphs therefore concentrate on the cartographic representation and some of the reasoning behind it. This includes specifically the (1) definition of map sheets including subdivision of the surface into smaller sections in order to carry out this project globally within the given project time and (2) specification of map products and map formats, including final map scale, mapping scale, and map projection parameters to provide a scientifically sound and useful basis for mappers. While being part of the cartographic concept, a description of the actual mapping conduct and compilation follows in the next section (Section 2.3). Topics related to the dissemination of mapping results, including support for data homogenization and archiving for future reuse, are covered thereafter (Section 2.4).
The underlying framework for this mapping investigation were losely defined through the approach taken by individuals in USGS-coordinated mapping programs. While certain aspects were implemented for the actual mapping, it did not include the compilation of map sheets, neither in digital nor in analog form.
As base data for the geologic mapping investigation of Ceres, quadrangle maps from the HAMO (1:750,000) and LAMO (1:250,000) observations have been used. They conform to the quadrangle scheme presented in Greeley and Batson [51] for medium-sized bodies as outlined in Roatsch et al. [44], Roatsch et al. [45], and they represent dedicated definitions for printed map sheets. The map scale for the geologic mapping investigation was defined to be 1:500,000 using the LAMO, and to some extent HAMO input data [29]. For polar areas, a map scale of 1:1,000,000 was defined.
All mapping bases used the pre-defined projection for each quadrangle mosaic. For the polar areas between 65° and 90°, an azimuthal stereographic projection was employed; for mid-latitudes, a Lambert conformal conic projection between 21° and 66° was employed with standard parallels at 30° and 58°; and for equatorial latitudes between 225°S and 22°N, a secant normal form of the Mercator projection was employed with standard parallels at 13°S and 13°N (Figure 2). In the latitudinal direction, each tile overlaps by 1°, and this representation was adopted for the geologic mapping investigation as well. All three map projections are conformal and thus maintain true shapes, which renders all impact craters as circular features despite having distortions in lengths and areas with increasing distance from standard parallels and the projection centers. Due to the ellipsoidal shape of Ceres and its simplified representation through a sphere, however, the true shape cannot effectively be maintained.
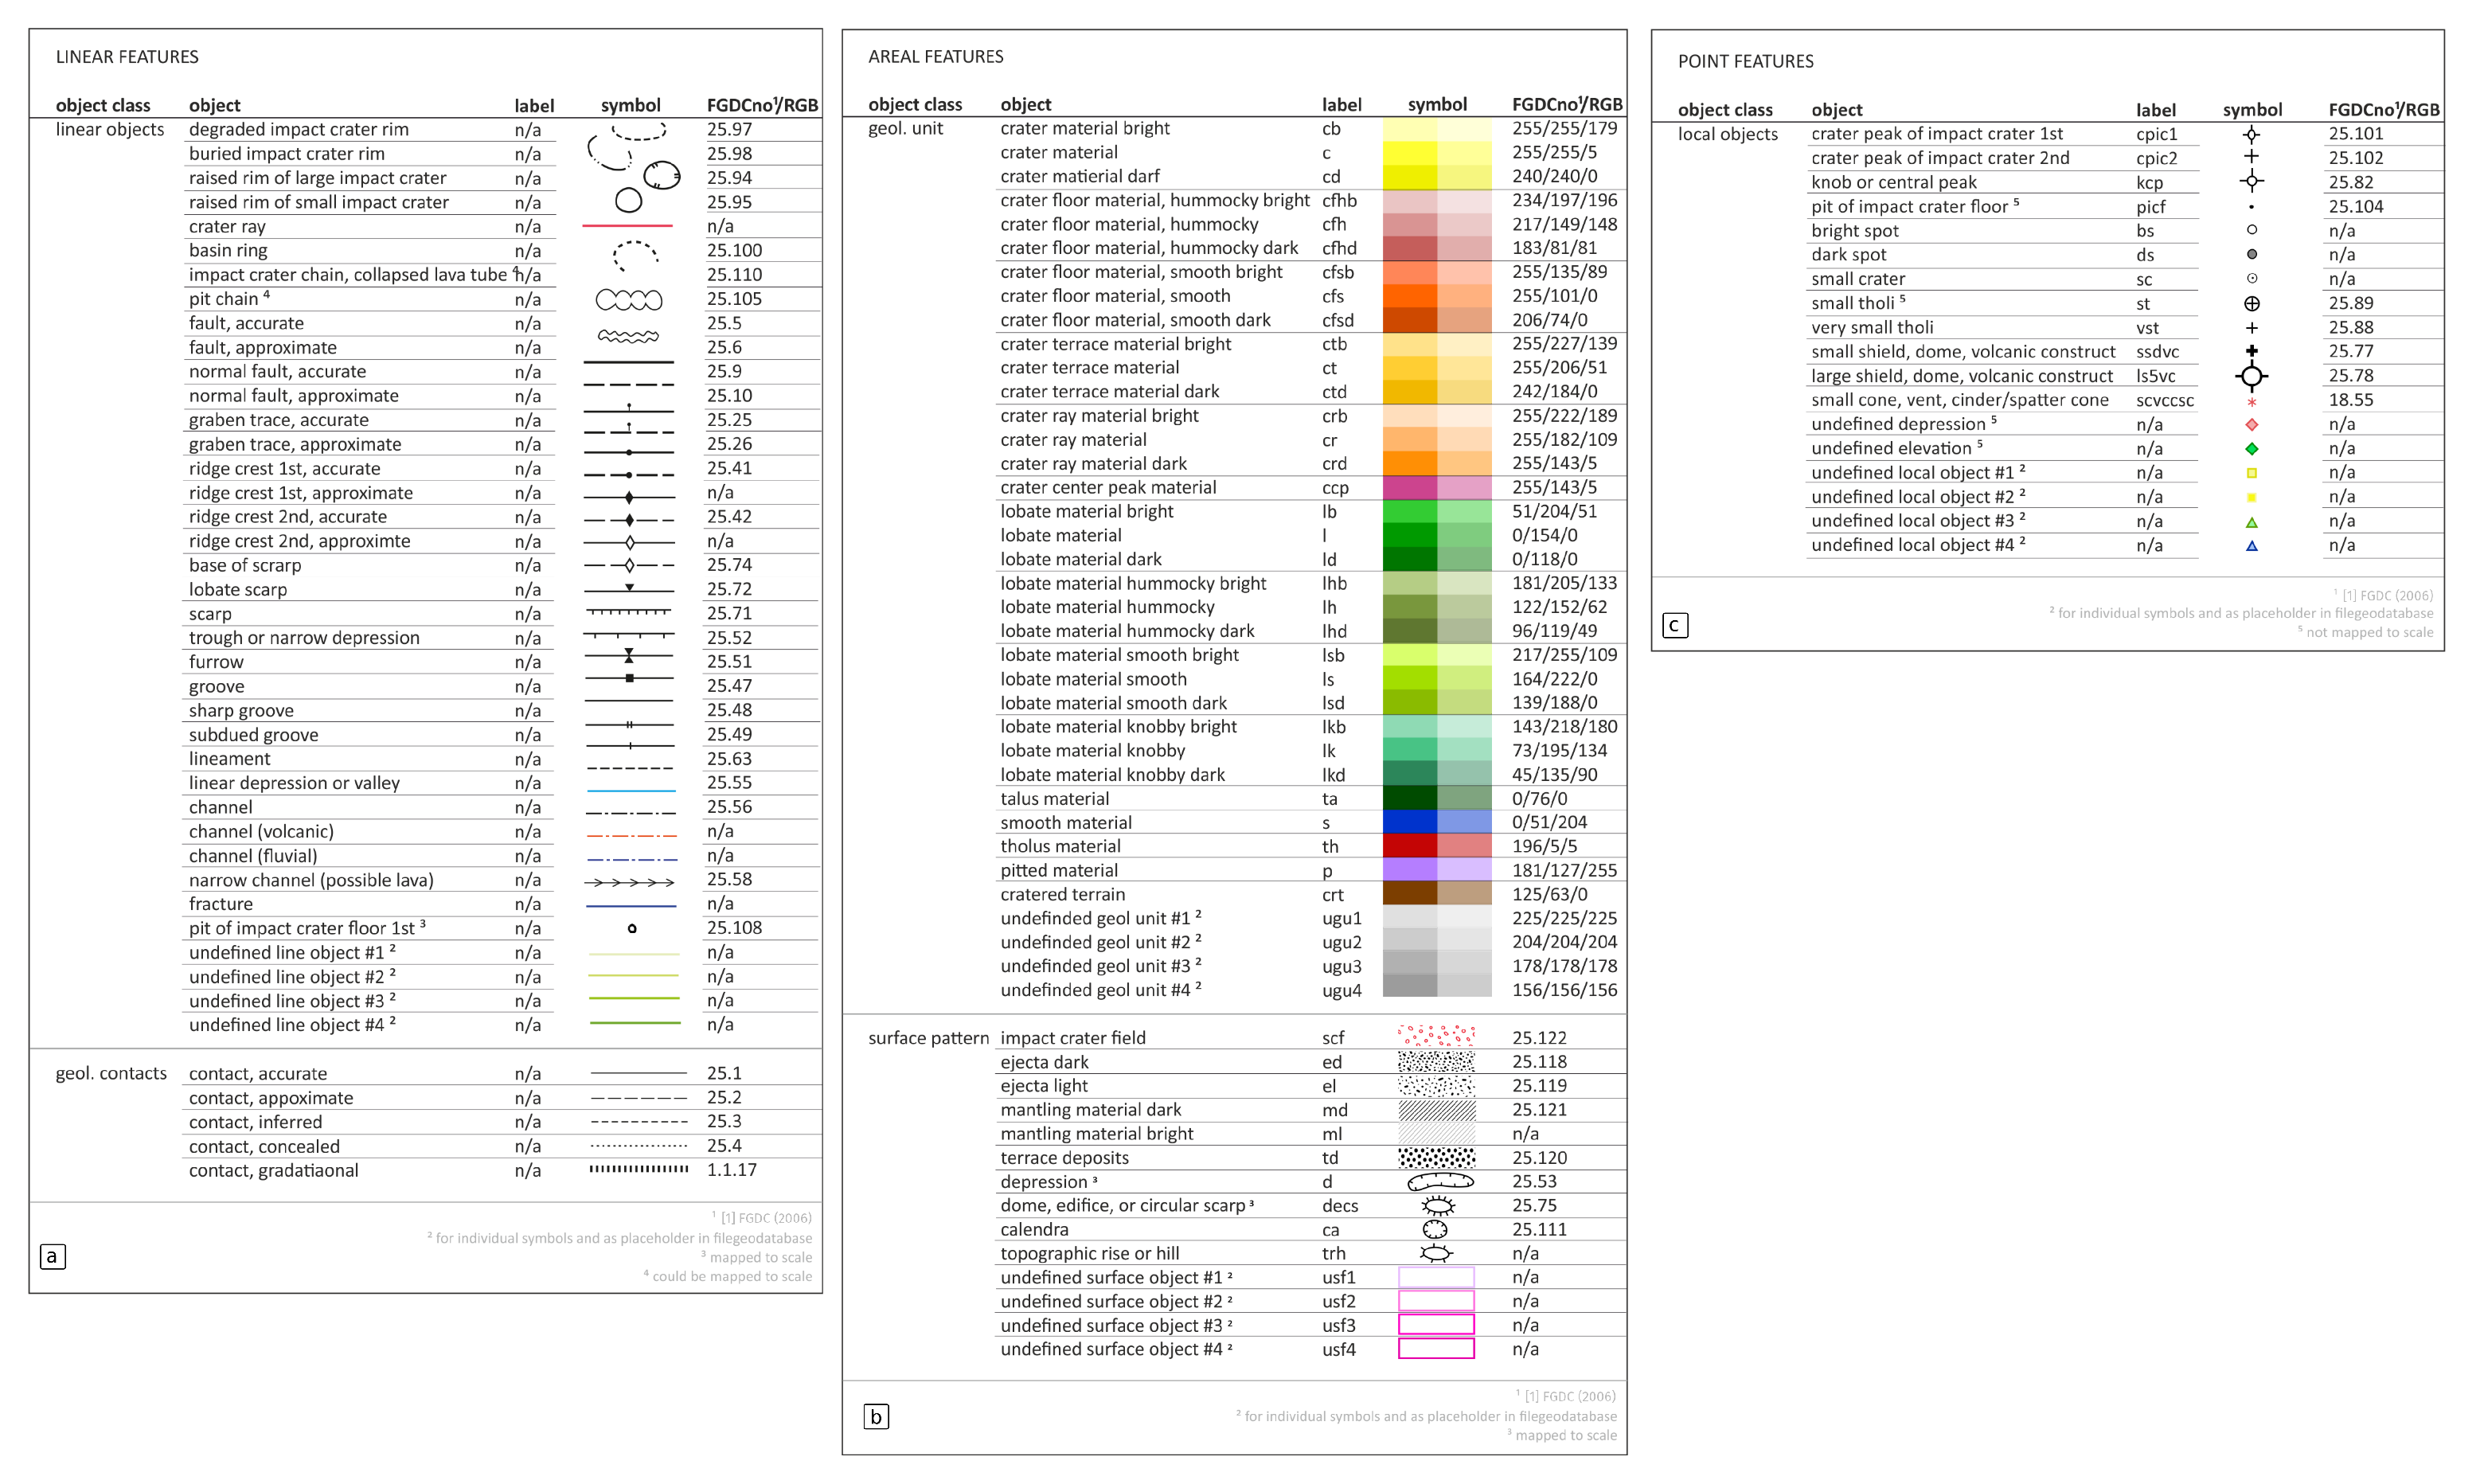
The mapping database was complemented by a layer for geologic symbols, according to the planetary geologic symbol set as published by the Federal Geographic Data Committee (FGDC), as well as metadata information (Figure 1) [52]. Color definitions for units followed, to a larger degree, the stratigraphic color assignments known from the Moon and also Mars (cf. Figure 3 and Figure 4). Due to the associative character of color hue as a cartographic variable, it is straightforward to immediately detect and spatially correlate similar material units across the map and across map sheets. Material deposited during similar time periods show variations in visually variable color saturation and color intensity and thus allows for direct association of various materials formed during the same time period. Due to the lack of geologic complexity, as mapped in the investigation, unit and color variations are, however, limited.
The map-sheet layer along with symbol configuration contained map-frame definitions and the standard map graticule for print reproduction. For potential printing of map sheets, a map template was created (see Figure 5).
2.3. Mapping Conduct
Geologic mapping is based on differences in materials indicative of different formation mechanisms and times. Compositional characteristics are challenging to distinguish in planetary mapping unless hyperspectral information is used to differentiate units. Differences are marked by traditional geologic criteria, such as lateral discontinuities, texture variations, different reflectances or different erosional levels [6]. Thus, terrain and relief information as well as lighting conditions play a crucial role in the mapping process to distinguish individual units.
Due to the lack of knowledge about a number of material units, a hybrid mapping approach has been taken, which also comprises descriptive terms related to texture properties or other characteristics. This approach is taken frequently for geologic mapping, in particular for historic maps due to lack of better information.
Geologic mapping was conducted on the panchromatic map-projected image as a primary dataset for each quadrangle extent (Figure 6). Depending on the mappers’ preferences, units were either defined using geological contacts (contact method) or through geologically homogeneous areas (area method). The intention was to perform a refinement mapping based on the global surveying map by Ref. [54] and to iterate further down from HAMO to LAMO resolution, while the image mosaics were still being produced.
Mapping scales are commonly set to 3–4 times higher than the map scale in order to create smooth contact lines that account for the actual map scale. It needs to be kept in mind at this point that mapping was performed on screen, which translates to a reduction in effective resolution by a factor of about three due to the difference of screen (about 100 dpi) to paper-print resolution (about 300 dpi). Mappers were expected to communicate with each other for homogenizing quadrangle boundaries in terms of geometry and contents [29].
2.4. Research Data and Dissemination
For this mapping investigation, no concrete dissemination plan has been designed nor was it implemented other than through the production of research papers. While collaborative geologic mapping represented the core of the main investigation, the project did not intend to produce ready-to-print maps for display or as a working basis. Instead, the aims, as stated in Williams et al. [29] and also previously in Williams et al. [28], were primarily to provide a geologic context for other instrument teams and for the community at large to conduct future research. This, accordingly, puts a major constraint on the mapping investigation itself, which requires the mapping to be completed in the shortest amount of time in order to serve as a useful basis for decision-making during the mission’s lifetime. Consequently, the reuse of mapping data and detailed map compilations could not be prioritized and any post-processing related to map and research-data generation was not part of the original investigation. In order to provide some degree of reusable data, however, the mapping coordinators agreed on a basic set of metadata that would allow archiving all data products and mapping products along with the most basic pieces of information (see Figure 7).
Geologic mapping results were planned to be published in a Special Issue where each quadrangle-based investigation is represented by a research paper and accompanied by the associated geologic mapping.
3. Discussion of Results
The geologic mapping investigation of Ceres led to a global geologic image with a scale of 1:10,000,000, HAMO maps at 1:1,000,000 scale, and 15 maps based on LAMO observations with a scale of 1:500,000, as well as research papers for 13 quadrangle investigations [29,55,56,57,58,59,60,61,62,63,64,65]. The global map has not been officially published and is available upon request only [66]. Individual HAMO/LAMO maps have been included as higher-resolution figures in each of the cited research papers; however, no maps have been published as separate map sheets thus far.
After the mapping investigation’s termination, data have been made available via the data archive zenodo [67] by the first author. This archive also contains a non-unified version of the global map alongside GIS data packages available for download (Figure 8).
In Section 3.1–Section 3.3, we highlight three issues in particular: (1) completeness of foundational data, (2) originality of the cartographic concept, and (3) mapping results and reuse.
3.1. Completeness of Foundational Data
The employed data basis (see Section 2.1) consists of a subset of available images that were selected according to homogeneous illumination characteristics within a preceding project [44,45]. For the HAMO FC observations at Ceres, a total number of 2490 images and, for LAMO, a total number of 31,300 images were sent back by the DAWN spacecraft. For the panchromatic image atlas, a total number of 386 images for HAMO—largely from one single observation cycle—and about 11,550 images for LAMO have been processed [44,45], translating to roughly 16% of all HAMO and 37% of all LAMO images that have been included into the Ceres image mosaics and map sheets. As geologic mapping largely relies on relief and illumination variations for geologic contact tracing, the decision to not include all available data might raise some concern. In fact, the majority of the available data basis has not been incorporated for mapping in any systematic way.
The effects of varying illumination conditions are known, in particular when it comes to morphometric measurements and to tracing the superposition of units so that views under varying illumination geometries are crucial for detailed mapping. This holds even more as there is no validation available. It is therefore likely, that the selection of a foundational data product that has been created with a different target audience in mind (see the discussion in the next section) has introduced considerable bias and ambiguities that limit the potential of the final product. It has been shown in van Gasselt and Nass [68] that geologic mapping based on remote sensing data introduces a number of uncertainties, and thus by reducing these uncertainties, the integrity of the final product could be improved. Given the lack of geologic complexity in the mapping area, additional datasets might not change the overall picture considerably.
However, since data are readily available, small in size, and straightforward to process, the systematic inclusion of additional data might not have impacted the overall mapping timeline and would have increased the value of the outcome by making the best use of the available data.
3.2. Originality of a Cartographic Concept
As outlined in the methodology section, a working cartographic concept requires information about recipients, i.e., the map readers, in order to tailor the cartographic products to the needs of the target audience. By reviewing data products from this project, we do not intend to criticize decisions that are ultimately controlled by other project constraints, overarching boundary conditions, or future plans. Rather, the authors attempt to discuss and highlight the potential that different approaches might have or which could be discussed for future mapping projects. While the projects provide ample material to discuss decisions and take approaches on even the lowest levels, with chosen map scales being one of them, the authors want to focus here on the more overarching issue of borrowing a cartographic concept designed for different target audiences and the consequences.
For the geologic mapping investigation of Ceres, the decision was made to follow the quadrangle definition as proposed by Greeley and Batson [51] and as employed for the so-called atlasses of Vesta and Ceres. The original proposition by Greeley and Batson [51] was published at a time that digital cartography was perceived in a traditional map-making way and before the introduction of GIS technology in the planetary sciences. At that time, physical print maps were the only means of communication of cartographic results. And, print maps have also been a major focus when the collection of image map sheets was published for Vesta and Ceres, as discussed in Refs. [44,45,69,70], in particular when it comes to the discussion about map scales and map sheet sizes.
For both Vesta and Ceres, all quadrangle image maps were published and archived in the Asteroid/Dust Subnode of PDS’s Small Bodies Node. These include
- Map sheets in the portable document format (PDF)l
- Global and quadrangle-based digital raster image mosaics in the PDS IMG format;
- Raster images in GeoTIFF format ready to use for further processing or analysis.
These main datasets were stored alongside extensive metadata and other data derivatives, such as color products [46,71].
While the image map sheets represent valuable and interesting cartographic products in themselves, it remains to be seen who the target audience will be as it has not been mentioned in any of the associated publications. If the target audience is future researchers, it would be interesting to see how these map sheets are being actually used for investigations, measurements, or future context studies. Until then, the map products must be seen as serving a more intrinsic purpose. On the other hand, the foundational global image mosaics for Vesta and Ceres will likely be used for subsequent studies as they were uploaded to a central archive and are well described through metadata. Diversity of file formats will certainly ensure that future reuse and integration into projects are possible. It would have been exciting to see a publication of these maps within a modern webGIS platform using dynamic zoom functionality and a data layer with contours that are filtered and generalized according to each visualization scale rather than being statically generalized for a single print resolution. Formats and dissemination platforms reflect that conceptual core idea of generating print maps in addition to GIS-ready image products for future reuse.
As the geologic mapping investigation of Ceres (and Vesta) copy the quadrangle scheme into its very own cartographic concept, it would be sensible to assume that the outcome consists of ready-to-use geologic map sheets as well as digital products which are eventually published in a public archive. The target audiences are clearly defined in Williams et al. [28], Williams et al. [29]; however, a compilation of print map sheets has not been the aim of that investigation despite forming the core of the cartographic framework by design. Also, the introduction of a GIS workflow along with a GIS data model to help maintain data integrity could not help to create a unified, homogeneous, and consistent output across all quadrangle boundaries.
After all, there is a significant loss of potential as by using the GIS data model in its intended and potentially more constraining form, individual quadrangle mappings could become geometrically, topologically, and semantically consistent, which would have allowed for a unified map compilation and the creation of rich data layers alongside their metadata. Also, the derivation of a unified geologic map as a side product would have been possible. With the combination of digital contours, such geologic maps could become rich in information and they could be integrated into a webGIS platform with dynamic zoom functionality and the potential for overlaying additional information.
3.3. Mapping Results and Reuse
The scientific investigation reports along with individual geologic mappings have been published in the Special Issue “The Geologic Mapping of Ceres“ [29]. A compilation of maps and reports has been completed by individual quadrangle mappers. Adjustments of geologic contacts and symbols to homogenize map sheets transitions were encouraged and have been realized between some quadrangles by the mappers themselves. A final geometric and topological adjustment of contacts across quadrangle boundaries and homogenization of results to compile a unified map has not been carried out as no post-processing time was allocated for this project. The mapping project was technically completed within its scheduled time as it was considered complete after all papers were submitted. Individual quadrangle maps have not been submitted to research data repositories in a consistent format thus far, and basic post-processing was conducted outside of the project’s timeframe by the first author (see Figure 8 and Figure 9). A number of mappers decided to provide maps as higher-resolution figures associated with their publication.
A dataset comprising a compilation of all individual quadrangle mappings has been uploaded to the archive platform zenodo (zenodo.org, European Organization For Nuclear Research and OpenAIRE [72]). This includes supporting GIS files and a global dataset that, however, are not unified as it would have required discussions with individual mappers about geometric and semantic aspects, which was not achievable after the project’s scheduled termination [67].
Given the amount of effort that usually goes into joint discussions, mapping definitions, and the development of data models, a higher level of constraints for achieving a higher consistency and integrity of research data products could have extremely positive effects on data value by only imposing minor limitations. A more restrictive data model with more constraints on geometry and topology, including mechanisms for validation, and a higher degree of consistent generalization, either by enforcing consistent mapping scales or by extensive post-processing, would undoubtedly have reduced the problem of inconsistencies along individual map boundaries. This problem is even more pronounced as mapping quadrangles have overlaps in the latitude direction by design. These problems are not purely geometrical as each geometry relates directly to the mapping contents. Thus, the lack of synchronized contacts among most map boundaries causes non-trivial challenges for post-processing as this is only reasonable in discussion with individual mappers. While the decision was made to give individual mappers the maximum amount of freedom and to not impose any constraints that would limit mappers in their approach, it also causes non-resolvable challenges when it comes to unifying geometric and semantic transitions after a project is terminated. The relevance of this, ultimately, will vary from mapping project to mapping project; however, the imbalance between mapping integrity, efficiency, and freedom might be hard to justify at the end. When considering the intended target audience, i.e., mission instrument teams and future researchers, one has to accept that other instrument teams are likely the group who are least able to resolve such semantic inconsistencies.
As it was not designed for the mapping investigation, and due to inconsistencies and integrity problems as outlined above, no targeted research data management could be realized. All adjustments and corrections have taken place outside the project’s time frame.
4. Summary and Conclusions
4.1. Summary
This geologic mapping investigation focused on a multi-user quadrangle-based mapping approach with individual quadrangles being defined using a map sheet tiling scheme designed for print maps [51]. Mappers were provided with map and mapping templates, and the finalized map contents could optionally be incorporated into individual map-sheet layouts for exporting. The results were published in research papers with maps being simplified and transferred to figures. While map-sheet compilations for print and display take up resources to create, compile, review, and revise, it could have been a secondary aim of such an investigation for which, however, additional time had to be allocated. Furthermore, within the boundaries of the geologic mapping investigation, no resources were committed to producing an archivable and reusable research data product that would provide a transparent and consistent dataset to be exploited by future researchers.
While the aims of this mapping investigation, as stated in Williams et al. [29], have been met with respect to the publication of individual geologic investigations, it could be shown that, by using a more targeted cartographic concept,
- A global set of HAMO-based geologic quadrangle maps at more conservative map scales could have been produced as digital datasets as well as analog map sheets;
- A global geologic map at HAMO resolution could have been compiled with consistent geometry, topology, and map semantics by making use of the data model;
- A consistent research data product could have been designed and archived that would be reusable for future research, in particular for subsequent larger-scale mappings.
Subsequent mapping investigations would then build on these findings and create a more refined mapping investigation using LAMO data (as currently planned to be carried out by the USGS). There are plans currently to remap and compile a global map based on HAMO data and a higher-resolution global geologic map based on LAMO data [73,74,75]. The LAMO geologic map is planned to be published as a USGS Special Investigation Map (SIM) at a map scale of 1:3,000,000 for the equatorial region (±60°N and S) and 1:1,500,000 scale for the polar regions (>60°N and S) following the standards from the USGS SIM.
4.2. Recommendations
Research Data Management. The awareness of targeted research data management and the need for making research results available for future reuse have been growing significantly over the last decades. Apart from reducing the amount of redundant work, the strategy would also allow for more indirect reviews among peers and for obtaining additional insights through the recombination and derivation of research results. In order to achieve this, not only direct project aims but also strategies for dissemination need to be developed, as it is already requested by various funding agencies. For a mapping investigation similar to the use case reported here, dissemination strategies, data integrity checks, as well as metadata specifications would constitute important points of discussion during the conceptual phase. Furthermore, dissemination strategies would also allow for technical constraints to be adjusted and consistency checks to be enforced, which otherwise would not be implemented. These would be summarized as technical tools for quality control.
Metadata. Targeted metadata are required to make sure not only can data be found in the archives but also that a dataset’s lineage and associated researchers are communicated in a transparent and standardized way. Considerable potential has been lost within this geologic mapping investigation although common metadata attributes have been agreed upon. For communication of producers, versions, and other lineage information, it is of utmost importance to attach at least basic metadata information to each map/dataset (cf. Figure 7).
Mapping Constraints. One important tool for quality control is the implementation of targeted mapping constraints. Upon working towards the primary project results, a balance needs to be found between addressing the needs for targeted research data management and leaving wide-open research freedom. While this could lead to a discussion about the role of mapping as a research tool [68], a more pragmatic approach would be to find a balance discussed within the team and constrained through a mapping data model and topology rule checks on contacts and units.
Cartographic Support. Geologic mapping investigations, in particular collaborative ones with an increased level of complexity, depend highly on support from the cartographic and data management domain. This is important not only for the provision of data, templates, and data-support tools but also to increase the level of awareness of the need for such management.
Print Maps vs. webGIS. It feels timely to start discussing how usable as an asset cartographic print maps, i.e., traditional map sheets for display and as a work product, can be assets in the future as efficient tools for exploration. Analog working maps, i.e., charts and plans, might be of limited use nowadays in the planetary domain, in particular as new types of information such as more spatial context cannot be added due to their static character. Printable map sheets certainly remain beautiful products and demonstrate the meticulous work and experience that have gone into the creation of such maps. If the cartographic concept has been well designed, a map sheet compilation is probably a minor additional step to be taken to complete the investigation. It, therefore, seems even more important to discuss the implementation of efficient webGIS solutions which allow for hosting not only the map sheet in digital format but also all cartographic objects along with their semantic value for querying, measuring, and investigations. The provision of data layers served over the internet (e.g., OGC/Web Feature Service (WFS) and OGC/Web Map Services (WMS)) would in addition allow users to access maps using web interfaces or their own systems and start working with such products. In such a way, these maps could become new foundational map products to be used as the basis for future investigation.
Iterative Development. While the geologic mapping investigation consists of distinct phases, the overall conduct is iterative in nature due to new data arriving during the mapping phases and due to changing mapping foci. The project has shown that constant communication between mappers and with data management support would have been needed to arrive at consistent products during the mapping phase.
Planning for Derivative Products. The reviewed investigation has shown that the compilation of mapping quadrangles could have led to a consistent derivative product on the global geology of Ceres compiled at a smaller map scale. Consistent mapping scales, synchronization of unit boundaries at map quadrangle boundaries, and a priori agreement on the terrain descriptors and their exact delineation would have provided a more consistent image. An internal iterative review for each quadrangle with its 4–8 adjacent quadrangles could have effortlessly created a highly consistent set of products, which could then be generalized and simplified systematically to provide input for a global map. This opportunity has been missed as a wider definition of freedom and lack of constraints (including reviews) led to geometric and topologic inconsistencies, which cannot be solved by a cartographer or GIS expert due to a lack of detailed topical knowledge of the mapper’s view on the local geology and geomorphology.
Joint Concepts. A joint conceptual understanding and common baseline are needed, not only for the general direction of the mapping investigation but also with respect to the level of detail and the exact criteria for delineation. Varying topical expertise among different mappers can easily lead to different mapping foci, and while similar geologic features might appear across quadrangles, not all mappers have mapped such features. This further begs the question of how far topical mapping rather than quadrangle mapping would constitute an additional step for guaranteeing consistent mapping results.
Author Contributions
Conceptualization, A.N.; methodology, A.N.; writing—original draft preparation, A.N. and S.v.G.; writing—review and editing, A.N. and S.v.G.; visualization, A.N. All authors have read and agreed to the published version of the manuscript.
Funding
This research received no external funding.
Data Availability Statement
The compiled database for the mapping investigation can be found as Geologic Map of Ceres [Dawn Mission]—Global dataset based on the 15 individual quadrangle maps at https://zenodo.org/record/7989803.
Acknowledgments
The authors thank the three anonymous reviewers who have provided comments and suggestions to improve the manuscript.
Conflicts of Interest
The authors declare no conflict of interest.
References
- USGS. Geological Atlas of the Moon; USGS: Reston, VA, USA, 2023. Available online: https://www.lpi.usra.edu/resources/mapcatalog/usgs/ (accessed on 23 August 2023).
- Wilhelms, D. Geologic Mapping. In Planetary Mapping; Greeley, R., Batson, R.M., Eds.; Cambridge Planetary Science Series; Cambridge University Press: Cambridge, UK, 1990; pp. 208–259. [Google Scholar]
- Abbud-Madrid, A. Space and Planetary Resources. In Planetary Geology; Rossi, A.P., van Gasselt, S., Eds.; Springer Praxis Books; Springer: Cham, Switzerland, 2018; pp. 369–394. [Google Scholar] [CrossRef]
- van Gasselt, S.; Neukum, G. Chronostratigraphy. In Encyclopedia of Astrobiology; Gargaud, M., Irvine, W.M., Amils, R., Cleaves, H., Pinti, D.L., Quintanilla, J.C., Rouan, D., Spohn, T., Tirard, S., Viso, M., Eds.; Springer: Berlin/Heidelberg, Germany, 2015; pp. 454–466. [Google Scholar] [CrossRef]
- Guest, J.; Butterworth, P. Planetary Geology; John Wiley and Sons: Hoboken, NJ, USA, 1979; pp. 15–31. [Google Scholar]
- Pondrelli, M.; Baker, V.R.; Hauber, E. Geologic Tools. In Planetary Geology; Rossi, A.P., van Gasselt, S., Eds.; Springer Praxis Books; Springer: Cham, Switzerland, 2018; pp. 15–31. [Google Scholar] [CrossRef]
- Laura, J.R.; Beyer, R.A. Knowledge Inventory of Foundational Data Products in Planetary Science. Planet. Sci. J. 2021, 2, 18. [Google Scholar] [CrossRef]
- Tognon, G.; Pozzobon, R.; Massironi, M.; Ferrari, S. Geologic Mapping and Age Determinations of Tsiolkovskiy Crater. Remote Sens. 2021, 13, 3619. [Google Scholar] [CrossRef]
- Debniak, K.; Mege, D.; Gurgurewicz, J. Geomorphology of Ius Chasma, Valles Marineris, Mars. J. Maps 2017, 13, 260–269. [Google Scholar] [CrossRef]
- Skinner, J.A.; Huff, A.E.; Fortezzo, C.M.; Gaither, T.; Hare, T.M.; Hunter, M.A.; Buban, H. Planetary Geologic Mapping—Program Status and Future Needs; Technical Report U.S. Geological Survey Open-File Report 2019–1012; United States Geological Survey: Reston, VA, USA, 2019. [Google Scholar] [CrossRef]
- Williams, D. NASA’s Planetary Geologic Mapping Program: Overview. ISPRS—Int. Arch. Photogramm. Remote. Sens. Spat. Inf. Sci. 2016, XLI-B4, 519–520. [Google Scholar] [CrossRef]
- PDS. Planetary Data System. 2023. Available online: https://pds.nasa.gov/ (accessed on 4 January 2023).
- PSA. Planetary Science Archive (ESA). 2023. Available online: https://www.cosmos.esa.int/web/psa/psa-introduction (accessed on 4 January 2023).
- The International Planetary Data Alliance (IPDA). Available online: https://ipda.jpl.nasa.gov/ (accessed on 23 August 2023).
- Radebaugh, J.; Thomson, B.J.; Archinal, B.; Beyer, R.; DellaGuistina, D.; Fassett, C.; Gaddis, L.; Hagerty, J.; Hare, T.; Laura, J.; et al. A roadmap for planetary spatial data infrastructure. In Proceedings of the Lunar and Planetary Science Conference, Woodlands, TX, USA, 18–22 March 2019; p. 1667. [Google Scholar]
- Rossi, A.; Massironi, M.; Altieri, F.; van der Bogert, C.; Hiesinger, H.; Mangold, N.; Rothery, D.; Balme, M.; Carli, C.; Pozzobon, R.; et al. PLANMAP: Geological mapping supporting the exploration of the Moon, Mars and Mercury. In Proceedings of the 69th International Astronautical Congress, Bremen, Germany, 1–5 October 2018; p. 47635. [Google Scholar]
- Massironi, M.; Altieri, F.; Hiesinger, H.; Mangold, N.; Rothery, D.; Rossi, A.P.; Balme, M.; Carli, C.; Capaccioni, F.; Cremonese, G.; et al. Towards integrated geological maps and 3D geo-models of planetary surfaces: The H2020 PLANetary MAPping project. In Proceedings of the EGU General Assembly Conference Abstracts, Vienna, Austria, 8–13 April 2018; European Geosciences Union (EGU): Munich, Germany, 2018; p. 18106. [Google Scholar]
- Semenzato, A.; Massironi, M.; Ferrari, S.; Galluzzi, V.; Rothery, D.A.; Pegg, D.L.; Pozzobon, R.; Marchi, S. An Integrated Geologic Map of the Rembrandt Basin, on Mercury, as a Starting Point for Stratigraphic Analysis. Remote Sens. 2020, 12, 3213. [Google Scholar] [CrossRef]
- Crichton, D.; Padams, J.; Hollins, G.; Hughes, J.S.; Joyner, R.; Law, E.; Cayanan, M. PDS data services initiative: Evolving towards data-driven capabilities to enable planetary science research. In Lunar and Planetary Science Conference; LPI Contribution; Lunar and Planetary Institute: Houston, TX, USA, 2020; p. 2754. [Google Scholar]
- Erard, S.; Cecconi, B.; Le Sidaner, P.; Chauvin, C.; Rossi, A.P.; Minin, M.; Capria, T.; Ivanovski, S.; Schmitt, B.; Génot, V.; et al. Virtual European Solar and Planetary Access (VESPA): A Planetary Science Virtual Observatory Cornerstone. Data Sci. J. 2020, 19, 5334. [Google Scholar] [CrossRef]
- Law, E.; Cayanan, M.; Crichton, D.; Hollins, G.; Hughes, S.; Padams, J. Planetary Data System (PDS) Tools and Tool Registry, Proceedings of the EPSC DPS Joint Meeting, Geneva, Switzerland, 15–20 September 2019; Europlanet/American Astronomical Society: Strasbourg, France, 2019; p. EPSC–DPS2019–170. [Google Scholar]
- Baratoux, D.; Chennaoui Aoudjehane, H.; Gibson, R.; Lamali, A.; Reimold, W.; Sapah, M.; Chabou, M.; Habarulema, J.; Jessell, M.; Mogessie, A.; et al. Africa Initiative for Planetary and Space Sciences. Eos 2017. [Google Scholar] [CrossRef]
- Europlanet Society. Europlanet Diversity Working Group. 2023. Available online: https://www.europlanet-society.org/diversity-working-group/ (accessed on 18 February 2023).
- Nass, A.; Asch, K.; van Gasselt, S.; Rossi, A.P.; Besse, S.; Cecconi, B.; Frigeri, A.; Hare, T.; Hargitai, H.; Manaud, N. Facilitating reuse of planetary spatial research data—Conceptualizing an open map repository as part of a Planetary Research Data Infrastructure. Planet. Space Sci. 2021, 204, 105269. [Google Scholar] [CrossRef]
- Sierks, H.; Keller, H.U.; Jaumann, R.; Michalik, H.; Behnke, T.; Bubenhagen, F.; Buettner, I.; Carsenty, U.; Christensen, U.; Enge, R.; et al. The Dawn Framing Camera. Space Sci. Rev. 2011, 163, 263–327. [Google Scholar] [CrossRef]
- De Sanctis, M.C.; Coradini, A.; Ammannito, E.; Filacchione, G.; Capria, M.T.; Fonte, S.; Magni, G.; Barbis, A.; Bini, A.; Dami, M.; et al. The VIR Spectrometer. Space Sci. Rev. 2011, 163, 329–369. [Google Scholar] [CrossRef]
- Prettyman, T.; Feldman, W.; McSween, H.; Dingler, R.; Enemark, D.; Patrick, D.; Storms, S.; Hendricks, J.; Morgenthaler, J.; Pitman, K.; et al. Dawn’s Gamma Ray and Neutron Detector. Space Sci. Rev. 2011, 163, 371–459. [Google Scholar] [CrossRef]
- Williams, D.A.; Yingst, R.A.; Garry, W.B. Introduction: The geologic mapping of Vesta. Icarus 2014, 244, 1–12. [Google Scholar] [CrossRef]
- Williams, D.A.; Buczkowski, D.L.; Mest, S.C.; Scully, J.E.C.; Platz, T.; Kneissl, T. Introduction: The geologic mapping of Ceres. Icarus 2018, 316, 1–13. [Google Scholar] [CrossRef]
- Williams, D.A.; Jaumann, R.; McSween, H.Y.; Marchi, S.; Schmedemann, N.; Raymond, C.A.; Russell, C.T. The chronostratigraphy of protoplanet Vesta. Icarus 2014, 244, 158–165. [Google Scholar] [CrossRef]
- Sawabe, Y.; Matsunaga, T.; Rokugawa, S. Automated detection and classification of lunar craters using multiple approaches. Adv. Space Res. 2006, 37, 21–27. [Google Scholar] [CrossRef]
- Stepinski, T.; Vilalta, R.; Ghosh, S. Machine Learning Tools for Automatic Mapping of Martian Landforms. IEEE Intell. Syst. 2007, 22, 100–106. [Google Scholar] [CrossRef]
- Urbach, E.R.; Stepinski, T.F. Automatic detection of sub-km craters in high resolution planetary images. Planet. Space Sci. 2009, 57, 880–887. [Google Scholar] [CrossRef]
- Jin, S.; Zhang, T. Automatic detection of impact craters on Mars using a modified adaboosting method. Planet. Space Sci. 2014, 99, 112–117. [Google Scholar] [CrossRef]
- Li, W.; Di, K.; Yue, Z.; Liu, Y.; Sun, S. Automated Detection of Martian Gullies from HiRISE Imagery. Photogramm. Eng. Remote Sens. 2015, 81, 913–920. [Google Scholar] [CrossRef]
- Jiang, S.; Lian, Z.; Yung, K.L.; Ip, W.H.; Gao, M. Automated Detection of Multitype Landforms on Mars Using a Light-Weight Deep Learning-Based Detector. IEEE Trans. Aerosp. Electron. Syst. 2022, 58, 5015–5029. [Google Scholar] [CrossRef]
- Fortezzo, C.; Spudis, P.D.; Harrel, S.L. Release of the Digital Unified Global Geologic Map of the Moon at 1:5,000,000-Scale. In Proceedings of the 51st Lunar and Planetary Science Conference, Lunar and Planetary Institute, Houston, TX, USA, 15–18 August 2020; p. 2760. [Google Scholar]
- GO FAIR. GO FAIR Initiative: Make Your Data & Services FAIR. 2023. Available online: https://www.go-fair.org (accessed on 2 January 2023).
- CODATA. The Committee on Data for Science and Technology. 2023. Available online: https://codata.org (accessed on 2 January 2023).
- RDA. Research Data Sharing without Barriers. 2023. Available online: https://www.rd-alliance.org (accessed on 15 February 2023).
- Wilkinson, M.D.; Dumontier, M.; Aalbersberg, I.J.; Appleton, G.; Axton, M.; Baak, A.; Blomberg, N.; Boiten, J.; Da Silva Santos, L.B.; Bourne, P.E.; et al. The FAIR Guiding Principles for scientific data management and stewardship. Sci. Data 2016, 3, 160018. [Google Scholar] [CrossRef] [PubMed]
- Roatsch, T.; Kersten, E.; Matz, K.; Preusker, F.; Scholten, F.; Jaumann, R.; Raymond, C.A.; Russell, C.T. Ceres Survey Atlas derived from Dawn Framing Camera images. Planet. Space Sci. 2016, 121, 115–120. [Google Scholar] [CrossRef]
- Russell, C.T.; Raymond, C.A. The Dawn Mission to Vesta and Ceres. Space Sci. Rev. 2011, 163, 3–23. [Google Scholar] [CrossRef]
- Roatsch, T.; Kersten, E.; Matz, K.; Preusker, F.; Scholten, F.; Jaumann, R.; Raymond, C.A.; Russell, C.T. High-resolution Ceres High Altitude Mapping Orbit atlas derived from Dawn Framing Camera images. Planet. Space Sci. 2016, 129, 103–107. [Google Scholar] [CrossRef]
- Roatsch, T.; Kersten, E.; Matz, K.; Preusker, F.; Scholten, F.; Jaumann, R.; Raymond, C.A.; Russell, C.T. High-resolution Ceres Low Altitude Mapping Orbit Atlas derived from Dawn Framing Camera images. Planet. Space Sci. 2017, 140, 74–79. [Google Scholar] [CrossRef]
- Roatsch, T.; Kersten, E.; Matz, K.D.; Preusker, F.; Scholten, F.; Elgner, S.; Schroeder, S.; Jaumann, R.; Raymond, C.; Russell, C.T. DAWN Framing Camera Derived Ceres Global Mosaics V1.0 (DAWN-A-FC2-5-CERESMOSAIC-V1.0); NASA Planetary Data System, Asteroid/Dust Subnode; NASA/Planetary Science Institute: Tucon, AZ, USA, 2016. [Google Scholar]
- Preusker, F.; Scholten, F.; Matz, K.; Roatsch, T.; Elgner, S.; Jaumann, R.; Joy, S.; Raymond, C.; Russell, C. Shape model and rotational state of dwarf planet Ceres from Dawn FC stereo images. In Proceedings of the European Planetary Science Congress, Nantes, France, 27 September–3 November 2015; p. EPSC2015–186. [Google Scholar]
- Nass, A.; The DAWN Mapping Team. One GIS-based Data Structure for Geological Mapping using 15 Map Sheets—Dawn at Ceres. In Abstracts of the Lunar and Planetary Science Conference XLVIII; Lunar and Planetary Institute: Houston, TX, USA, 2017; p. 1892. [Google Scholar]
- van Gasselt, S.; Nass, A. Planetary mapping—The datamodel’s perspective and GIS framework. Planet. Space Sci. 2011, 59, 1231–1242. [Google Scholar] [CrossRef]
- Skinner, J.A.; Huff, A.; Black, S.; Buban, H.; Fortezzo, C.; Gaither, T.; Hare, T.; Hunter, M. Planetary Geologic Mapping Protocol—2022; U.S. Geological Survey Standards, Techniques and Methods 11–B13; U.S. Geological Survey: Reston, VI, USA, 2022. [Google Scholar] [CrossRef]
- Greeley, R.; Batson, R.M. Planetary Mapping; Cambridge University Press: New York, NY, USA, 1990. [Google Scholar]
- Nass, A.; van Gasselt, S.; Jaumann, R.; Asche, H. Implementation of cartographic symbols for planetary mapping in geographic information systems. Planet. Space Sci. 2011, 59, 1255–1264. [Google Scholar] [CrossRef]
- Federal Geographic Data Committee FGDC Digital Cartographic Standard for Geologic Map Symbolization. GDC Document Number FGDC-STD-013-2006. Available online: https://ngmdb.usgs.gov/fgdc_gds/geolsymstd.php (accessed on 23 August 2023).
- Buczkowski, D.L.; Schmidt, B.E.; Williams, D.A.; Mest, S.C.; Scully, J.E.C.; Ermakov, A.I.; Preusker, F.; Schenk, P.; Otto, K.A.; Hiesinger, H.; et al. The geomorphology of Ceres. Science 2016, 353, aaf4332. [Google Scholar] [CrossRef]
- Ruesch, O.; McFadden, L.A.; Williams, D.A.; Hughson, K.H.; Pasckert, J.H.; Scully, J.; Kneissl, T.; Roatsch, T.; Naß, A.; Preusker, F.; et al. Geology of Ceres’ North Pole quadrangle with Dawn FC imaging data. Icarus 2018, 316, 14–27. [Google Scholar] [CrossRef]
- Pasckert, J.; Hiesinger, H.; Ruesch, O.; Williams, D.; Nass, A.; Kneissl, T.; Mest, S.; Buczkowski, D.; Scully, J.; Schmedemann, N.; et al. Geologic mapping of the Ac-2 Coniraya quadrangle of Ceres from NASA’s Dawn mission: Implications for a heterogeneously composed crust. Icarus 2018, 316, 28–45. [Google Scholar] [CrossRef]
- Scully, J.E.; Buczkowski, D.; Neesemann, A.; Williams, D.; Mest, S.; Raymond, C.; Nass, A.; Hughson, K.; Kneissl, T.; Pasckert, J.; et al. Ceres’ Ezinu quadrangle: A heavily cratered region with evidence for localized subsurface water ice and the context of Occator crater. Icarus 2018, 316, 46–62. [Google Scholar] [CrossRef]
- Hughson, K.H.; Russell, C.; Williams, D.; Buczkowski, D.; Mest, S.; Pasckert, J.; Scully, J.; Combe, J.P.; Platz, T.; Ruesch, O.; et al. The Ac-5 (Fejokoo) quadrangle of Ceres: Geologic map and geomorphological evidence for ground ice mediated surface processes. Icarus 2018, 316, 63–83. [Google Scholar] [CrossRef]
- Krohn, K.; Jaumann, R.; Otto, K.; Schulzeck, F.; Neesemann, A.; Nass, A.; Stephan, K.; Tosi, F.; Wagner, R.; Zambon, F.; et al. The unique geomorphology and structural geology of the Haulani crater of dwarf planet Ceres as revealed by geological mapping of equatorial quadrangle Ac-6 Haulani. Icarus 2018, 316, 84–98. [Google Scholar] [CrossRef]
- Williams, D.A.; Kneissl, T.; Neesemann, A.; Mest, S.; Palomba, E.; Platz, T.; Nathues, A.; Longobardo, A.; Scully, J.; Ermakov, A.; et al. The geology of the Kerwan quadrangle of dwarf planet Ceres: Investigating Ceres’ oldest, largest impact basin. Icarus 2018, 316, 99–113. [Google Scholar] [CrossRef]
- Frigeri, A.; Schmedemann, N.; Williams, D.; Chemin, Y.; Mirino, M.; Nass, A.; Carrozzo, F.G.; Castillo-Rogez, J.; Buczkowski, D.L.; Scully, J.E.; et al. The geology of the Nawish quadrangle of Ceres: The rim of an ancient basin. Icarus 2018, 316, 114–127. [Google Scholar] [CrossRef]
- Buczkowski, D.; Williams, D.; Scully, J.; Mest, S.; Crown, D.; Schenk, P.; Jaumann, R.; Roatsch, T.; Preusker, F.; Nathues, A.; et al. The geology of the occator quadrangle of dwarf planet Ceres: Floor-fractured craters and other geomorphic evidence of cryomagmatism. Icarus 2018, 316, 128–139. [Google Scholar] [CrossRef]
- Platz, T.; Nathues, A.; Sizemore, H.; Crown, D.; Hoffmann, M.; Schäfer, M.; Schmedemann, N.; Kneissl, T.; Neesemann, A.; Mest, S.; et al. Geological mapping of the Ac-10 Rongo Quadrangle of Ceres. Icarus 2018, 316, 140–153. [Google Scholar] [CrossRef]
- Schulzeck, F.; Krohn, K.; v.d. Gathen, I.; Schmedemann, N.; Stephan, K.; Jaumann, R.; Williams, D.; Wagner, R.; Buczkowski, D.; Mest, S.; et al. Geologic mapping of the Ac-11 Sintana quadrangle: Assessing diverse crater morphologies. Icarus 2018, 316, 154–166. [Google Scholar] [CrossRef]
- Crown, D.A.; Sizemore, H.G.; Yingst, R.A.; Mest, S.C.; Platz, T.; Berman, D.C.; Schmedemann, N.; Buczkowski, D.L.; Williams, D.A.; Roatsch, T.; et al. Geologic mapping of the Urvara and Yalode Quadrangles of Ceres. Icarus 2018, 316, 167–190. [Google Scholar] [CrossRef]
- Williams, D.; Buczkoswki, D.; Crown, D.; Frigeri, A.; Hughson, K.; Kneissl, T.; Krohn, K.; Mest, S.; Pasckert, J.; Platz, T.; et al. DAWN mission final high resolution global geolgic map of Ceres. In Proceedings of the Planetary Geologic Mappers Workshop, London, UK, 1–6 January 2019; LPI Contrib. No. 2154. p. 7003. [Google Scholar]
- Nass, A. Geologic Map of Ceres [Dawn Mission]—Global Dataset Based on the 15 Individual Quadrangle Maps [Data Set]; Zenodo, CERN: Geneva, Switzerland, 2023. [Google Scholar] [CrossRef]
- van Gasselt, S.; Nass, A. A Semantic View on Planetary Mapping—Investigating Limitations and Knowledge Modeling through Contextualization and Composition. Remote Sens. 2023, 15, 1616. [Google Scholar] [CrossRef]
- Roatsch, T.; Kersten, E.; Matz, K.; Preusker, F.; Scholten, F.; Jaumann, R.; Raymond, C. High resolution Vesta High Altitude Mapping Orbit (HAMO) Atlas derived from Dawn framing camera images. Planet. Space Sci. 2012, 73, 283–286. [Google Scholar] [CrossRef]
- Roatsch, T.; Kersten, E.; Matz, K.; Preusker, F.; Scholten, F.; Elgner, S.; Jaumann, R.; Raymond, C.A.; Russell, C.T. High-resolution Vesta Low Altitude Mapping Orbit Atlas derived from Dawn Framing Camera images. Planet. Space Sci. 2013, 85, 293–298. [Google Scholar] [CrossRef]
- Roatsch, T.; Kersten, E.; Matz, K.D.; Preusker, F.; Scholten, F.; Elgner, S.; Schroeder, S.; Jaumann, R.; Raymond, C.; Russell, C.T. DAWN Framing Camera Derived Vesta Global Mosaics V1.0, DAWN-A-FC2-5-MOSAIC-V1.0; NASA Planetary Data System, Asteroid/Dust Subnode; NASA/Planetary Science Institute: Tucon, AZ, USA, 2015. [Google Scholar]
- European Organization For Nuclear Research. OpenAIRE; CERN: Geneva, Switzerland, 2013. [Google Scholar] [CrossRef]
- Mest, S.C.; Crown, D.A.; Yingst, R.A.; Berman, D.C.; Williams, D.A.; Buczkowski, D.L.; Scully, J.E.C.; Platz, T.; Hiesinger, H.; Pasckert, J.H.; et al. The HAMO-Based Global Geologic Map and Chronostratigraphy of Ceres. In Proceedings of the 49th Annual Lunar and Planetary Science Conference, Woodlands, TX, USA, 19–23 March 2018; p. 2730. [Google Scholar]
- Mest, S.C.; Berman, D.C.; Buczkowski, D.L.; Crown, D.A.; Scully, J.E.C.; Williams, D.A.; Yingst, R.A.; Frigeri, A.; Nass, A.; Neesemann, A.; et al. The Global LAMO-Based Geologic Map of Ceres. In Proceedings of the 2021 Annual Meeting of Planetary Geologic Mappers, Online, 14–15 June 2021; Volume 2610, p. 7035. [Google Scholar]
- Mest, S.C.; Crown, D.A.; Williams, D.A.; Buczkowski, D.L.; Scully, J.E.C.; Yingst, R.A.; Berman, D.C.; Frigieri, A.; Nass, A.; Neesemann, A.; et al. The Global Geologic Mapping of Ceres. In Proceedings of the 2022 Annual Meeting of Planetary Geologic Mappers, Online, 20–22 June 2022; Volume 2684, p. 7035. [Google Scholar]
Figure 1.
Data model as implemented in ESRI’s ArcGIS File-Geodatabase format.

Figure 2.
Mapping schema as implemented and applied for the geologic mapping investigation of Ceres (140 m/pixel, 1:1 M scale [45]). Latitude and longitude are adapted from the Kait coordinate system, approved by the IAU.
Figure 2.
Mapping schema as implemented and applied for the geologic mapping investigation of Ceres (140 m/pixel, 1:1 M scale [45]). Latitude and longitude are adapted from the Kait coordinate system, approved by the IAU.

Figure 3.
GIS interface with predefined attributes and related symbology.

Figure 4.
Symbology as used in the geologic mapping investigation. (a) Linear features, (b) areal features, and (c) point features. See also Ref. [53].
Figure 4.
Symbology as used in the geologic mapping investigation. (a) Linear features, (b) areal features, and (c) point features. See also Ref. [53].

Figure 5.
Mapping templates and principle layouts as distributed for the mapping investigation: (a) map sheet layout for higher-latitude mapping in the Southern hemisphere in Lambert conformal conic projection, (b) map sheet layout for mapping polar latitudes in polar stereographic projection, (c) map sheet layout for mapping in equatorial latitudes in Mercator projection, (d) map sheet layout for mapping in the Northern hemisphere in Lambert conformal conic projection.

Figure 6.
Interface of the GIS-based mapping template.

Figure 7.
Metadata allocation for users in order to describe a GIS-based mapping product ([1] = PDS keyword, [2] = FGDC keyword, [3] = so far not standardized keyword), [4] = so far optional).
Figure 7.
Metadata allocation for users in order to describe a GIS-based mapping product ([1] = PDS keyword, [2] = FGDC keyword, [3] = so far not standardized keyword), [4] = so far optional).

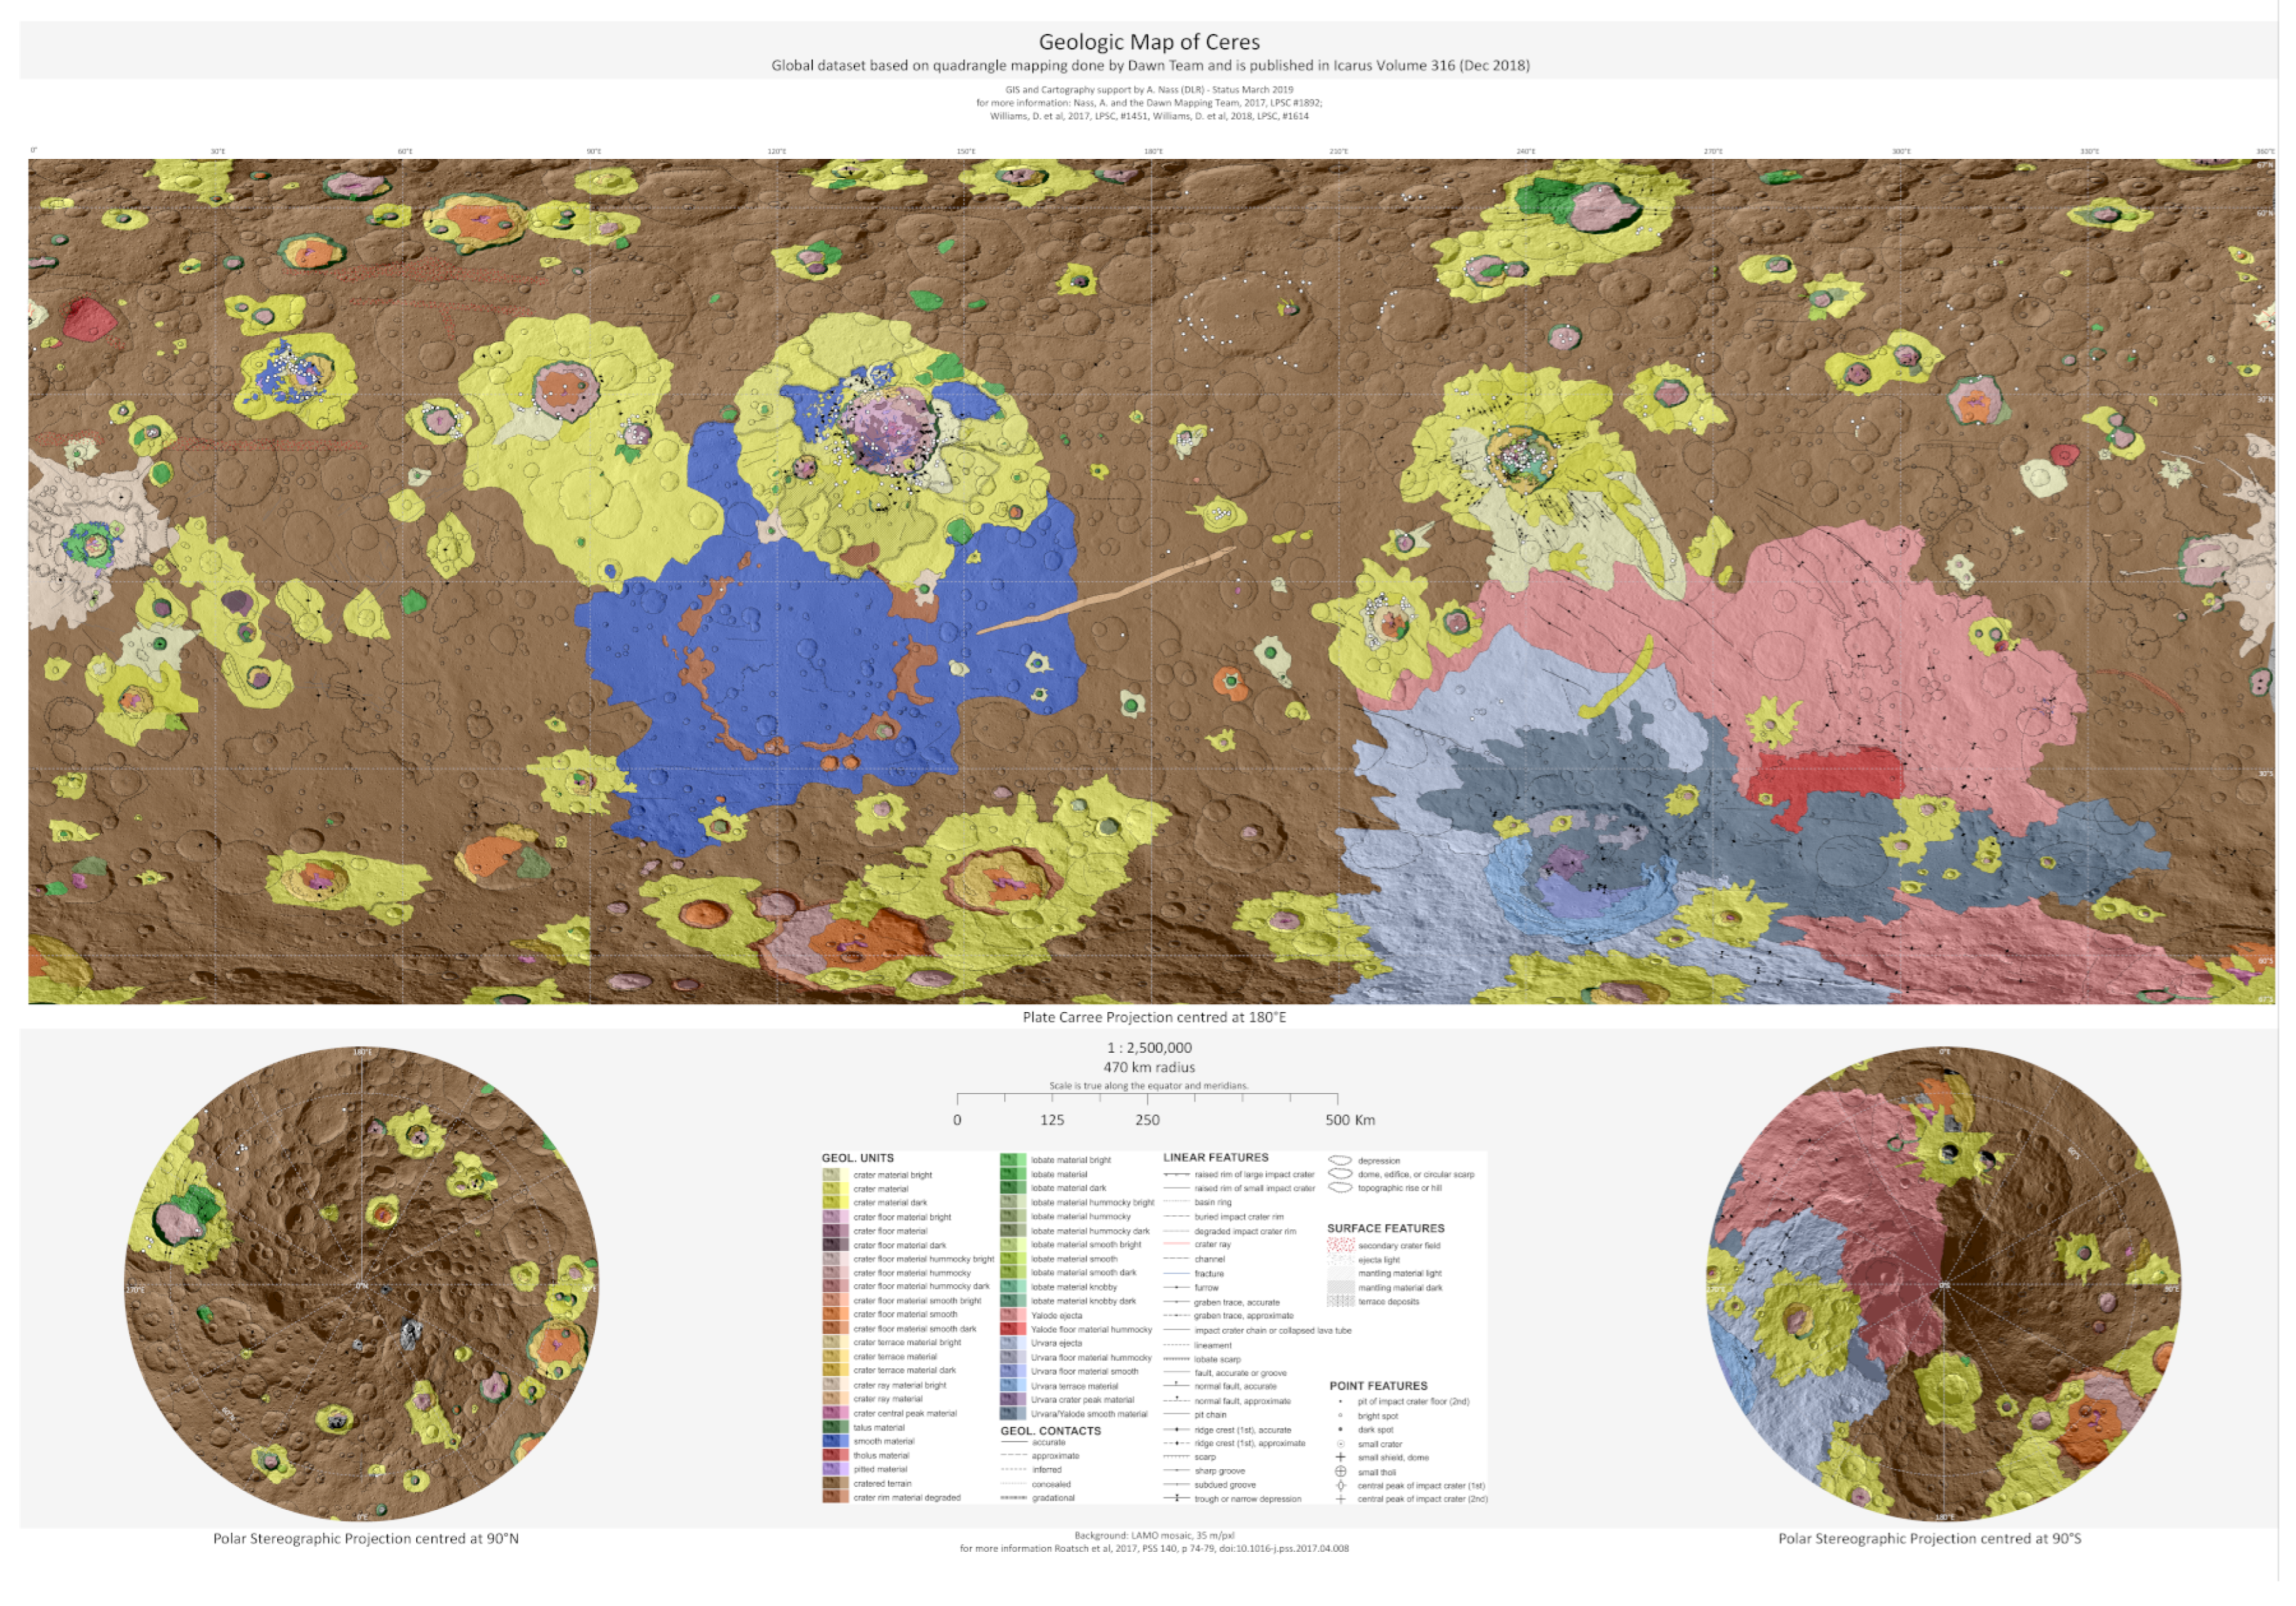
Figure 8.
Map sheet of the global geology of Ceres at 1:2,500,000 as compiled from individual quadrangle maps in equidistant cylindrical and polar stereographic map projections [45]. The original data are available at Nass [67]. Note, this is a map sheet merge that was created after the termination of the geologic mapping investigation. This map and the geologic map image derived within the project at a scale 1:10,000,000 are different visualizations.

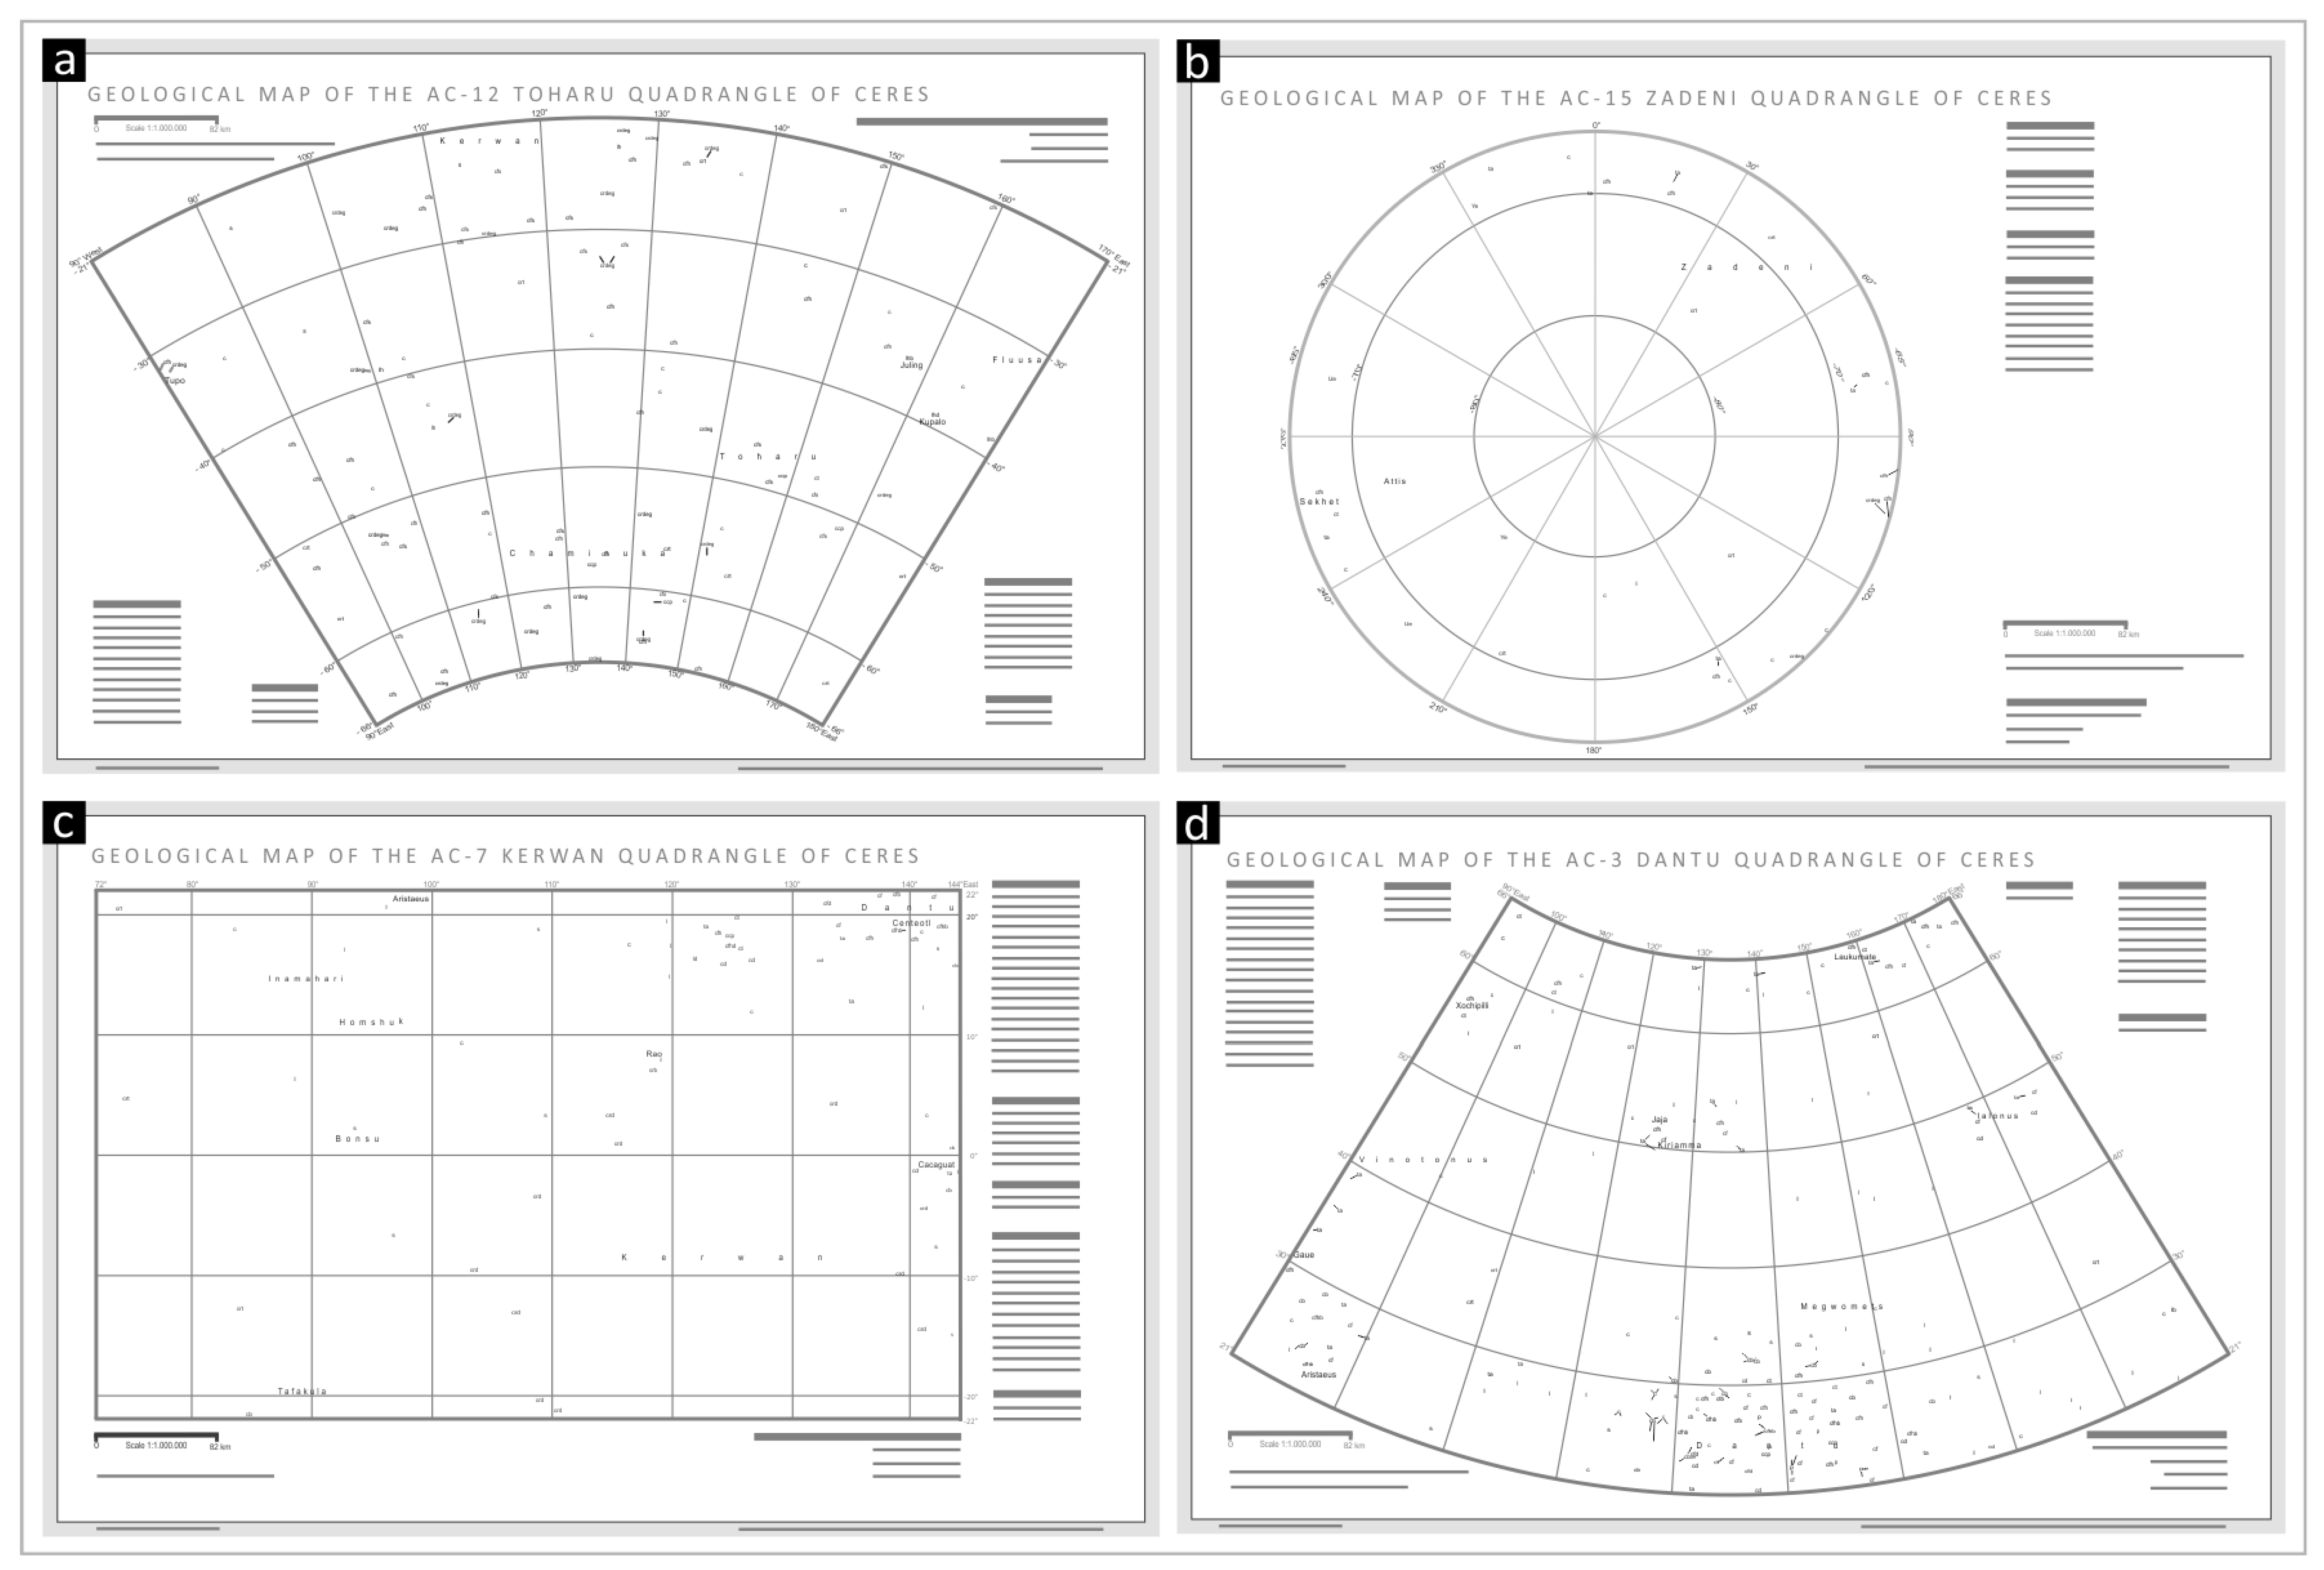
Figure 9.
Compilation of the 15 map sheets of the mapping investigation of Ceres as overview figure. For details regarding mapping criteria and map keys refer to the original publications introduced in the Special Issue “The Geologic Mapping of Ceres” [29].
Figure 9.
Compilation of the 15 map sheets of the mapping investigation of Ceres as overview figure. For details regarding mapping criteria and map keys refer to the original publications introduced in the Special Issue “The Geologic Mapping of Ceres” [29].

Disclaimer/Publisher’s Note: The statements, opinions and data contained in all publications are solely those of the individual author(s) and contributor(s) and not of MDPI and/or the editor(s). MDPI and/or the editor(s) disclaim responsibility for any injury to people or property resulting from any ideas, methods, instructions or products referred to in the content. |
© 2023 by the authors. Licensee MDPI, Basel, Switzerland. This article is an open access article distributed under the terms and conditions of the Creative Commons Attribution (CC BY) license (https://creativecommons.org/licenses/by/4.0/).
Share and Cite
MDPI and ACS Style
Naß, A.; van Gasselt, S. A Cartographic Perspective on the Planetary Geologic Mapping Investigation of Ceres. Remote Sens. 2023, 15, 4209. https://0-doi-org.brum.beds.ac.uk/10.3390/rs15174209
AMA Style
Naß A, van Gasselt S. A Cartographic Perspective on the Planetary Geologic Mapping Investigation of Ceres. Remote Sensing. 2023; 15(17):4209. https://0-doi-org.brum.beds.ac.uk/10.3390/rs15174209
Chicago/Turabian StyleNaß, Andrea, and Stephan van Gasselt. 2023. "A Cartographic Perspective on the Planetary Geologic Mapping Investigation of Ceres" Remote Sensing 15, no. 17: 4209. https://0-doi-org.brum.beds.ac.uk/10.3390/rs15174209
Note that from the first issue of 2016, this journal uses article numbers instead of page numbers. See further details here.