

Air Temperature Variations in Multiple Layers of the Indonesia Earthquake Based on the Tidal Forces
China Earthquake Networks Center, Beijing 100045, China
*
Author to whom correspondence should be addressed.
Remote Sens. 2023, 15(19), 4852; https://0-doi-org.brum.beds.ac.uk/10.3390/rs15194852
Submission received: 26 July 2023
/
Revised: 30 September 2023
/
Accepted: 2 October 2023
/
Published: 7 October 2023
(This article belongs to the Special Issue Earthquake Ground Motion Observation and Modelling)
Abstract
:The air temperature changes in the Palu MW7.5 earthquake in Indonesia on 28 September 2018 were analyzed, based on the additive tectonic stress caused by celestial tidal-generating forces (ATSCTF) and air temperature data from the National Center for Environmental Prediction (NCEP). This paper explored the variation characteristics of three-dimensional stratified of air temperature caused by seismic activity and the coupling relationship between air temperature changes and the tidal force. The background information for air temperature calculation was obtained from the tidal force changes, and the air temperature increment method was used to study the temperature evolution process of different periods in the study area. The results found that the tidal force acting on the critical state earthquake faults may be an important external factor inducing earthquakes, and there was indeed a significant air temperature increase anomaly during the Palu MW7.5 earthquake. The paper also summarized the abnormal characteristics of air temperature caused by seismic activity: the air temperature closer to the land’s surface has greater anomaly amplitude and a wider anomaly area than that of the upper air.
1. Introduction
The relationship between thermal anomaly distribution on the land’s surface and the seismicity was explored from multiple physical parameters (Long wave radiation, Brightness temperature, and Microwave) and multiple satellite data sources (TIR, NOAA, FY, MODIS, and MR) [1,2,3,4,5,6,7,8,9,10,11]. In addition to these physical parameters, good research results have been achieved on the relationship between land surface temperature (LST), atmospheric temperature, and earthquakes. Among them, research on the relationship between land surface temperature and earthquakes has been carried out earlier in China, such as the 1969 Bohai earthquake, the 1975 Haicheng earthquake, the 1976 Tangshan earthquake, the 1990 Qinghai Gonghe earthquake, and the 2008 Wenchuan earthquake [12,13,14,15], and found that there was indeed a significant warming of land surface temperature before these major earthquakes. In recent years, a series of wireless geothermal telemetry networks have been established near the Xianshuihe fault zone. The 2013 Lushan strong earthquake has a good correspondence with the geothermal changes in surrounding stations [16], which the high-frequency components of the LST of three bedrock LST observation networks near the Xianshuihe fault zone changed synchronously 80 days before the Lushan earthquake. Scholars used MODIS (Moderate Resolution Imaging Spectroradiometer) satellite remote sensing data to calculate the land surface temperature change before the Algiers earthquake in Algeria on 21 May 2003, and the calculation results were analyzed in combination with the data of three neighboring Algerian national meteorological stations. The result showed that there were indeed anomalies of temperature before the earthquake and the reliability of the RST (Robust Satellite Technique) algorithm [17,18,19] as an anomaly extraction and recognition technique [20]. In the study of the relationship between air temperature and earthquakes, Pulinets revealed the specific repetitive patterns of humidity and air temperature changes before strong earthquakes by analyzing meteorological data of several strong earthquakes around the world [21]. In addition, through the calculation of air temperature data from National Center for Environmental Prediction (NCEP) [22,23], the results showed that earthquakes may be the source of air temperature changes rather than a simple weather change [24,25]. And, the descriptive statistic of air temperature showed significant changes prior to earthquakes [26,27]. Recently, some Machine Learning techniques were used for detecting earthquake anomalies to support the Lithosphere–Atmosphere-Ionosphere (LAIC) mechanism [28,29].
There are many reasons for thermal anomalies, but the essence of thermal anomalies is mainly due to the LAIC mechanism [30,31,32]. There are many important parameters related to thermal in LAIC that can indicate that the lithosphere is the initial reason of the LAIC process. Similar to before earthquakes, rock pressure mainly triggers a temperature increase on the land’s surface, then thermal infrared waves are emitted due to the stress accumulation arising from this rock pressure [33]. In addition, some gases are also released during the compression movement of the lithosphere. The radon released is an important source of ionization in the surface area. The new ions condense with water molecules to form the ion hydration process, which enhances ion clusters and reduces relative humidity. This process leads to an increase in air temperature and changes in air conductivity while also changing ionospheric potential and resulting in vertical thermal convection.
At present, some ionospheric, Surface Latent Heat Flux (SLHF), Longwave Radiation (OLR), and other anomalies have been detected before earthquakes [34,35,36,37,38,39]. The perturbations in ionosphere do exist, especially related to earthquakes when M ≥ 5, and generally appear several days or a few hours before the earthquake [40,41,42,43,44,45,46]. The spatiotemporal variations in SLHF of the earthquakes in Kathmandu, Nepal, Kumamoto, and Japan were studied, and significant enhancements of SLHF anomalies occurred near the epicenters before the earthquakes [33]. A significant amount of terminator time shifts were observed during the earthquake in Nepal in 2015, and, furthermore, the electron density decreased before the earthquake [47]. In addition, data recorded from Global Navigation Satellite System (GNSS) receivers have been used to observe ionospheric total electron content (TEC) disturbances triggered by seismic waves [48,49,50,51,52]. The TEC derived from records of five ground-based GNSS receivers was employed to detect tsunami travelling ionospheric disturbances [30]. The TEC research of the 2018 Palu earthquake also confirmed the scaling law with the relationship between normalized TEC and earthquake moment magnitude [53].
Previous studies on air temperature changes before and after earthquakes have mostly focused on the onshore earthquakes, whereas this study conducted an analysis of an earthquake in a sea area based on a change in celestial tidal force. In addition, although tidal force is relatively small compared to tectonic stress, which is not sufficient to cause a rupture of the oceanic crust, this mechanical difference may lead to differences in the effectiveness of tectonic movement. Especially, it may trigger and induce an earthquake when tectonic stress reaches a critical state. This is a worthwhile research direction. Numerous studies concluded that there was a correlation between earthquake events and tides [54,55]. The results of the earthquake–tidal potential relation in the region of Palu, Indonesia, showed a correlation between the earthquake and tidal force, and the aftershock sequence of 2018 Palu earthquake was highly correlated with tidal components [56]. In order to identify the changes in air temperature before and after earthquakes more accurately, this article used the ATSCTF model to calculate the Mw7.5 Palu earthquake in Indonesia on 28 September 2018. The period of celestial tidal force change was used as the time background for the air temperature calculation, and the temperature change characteristics before and after the Palu earthquake were analyzed using air temperature data at different heights from NCEP.
2. Material and Methods
2.1. Earthquake and NCEP Data
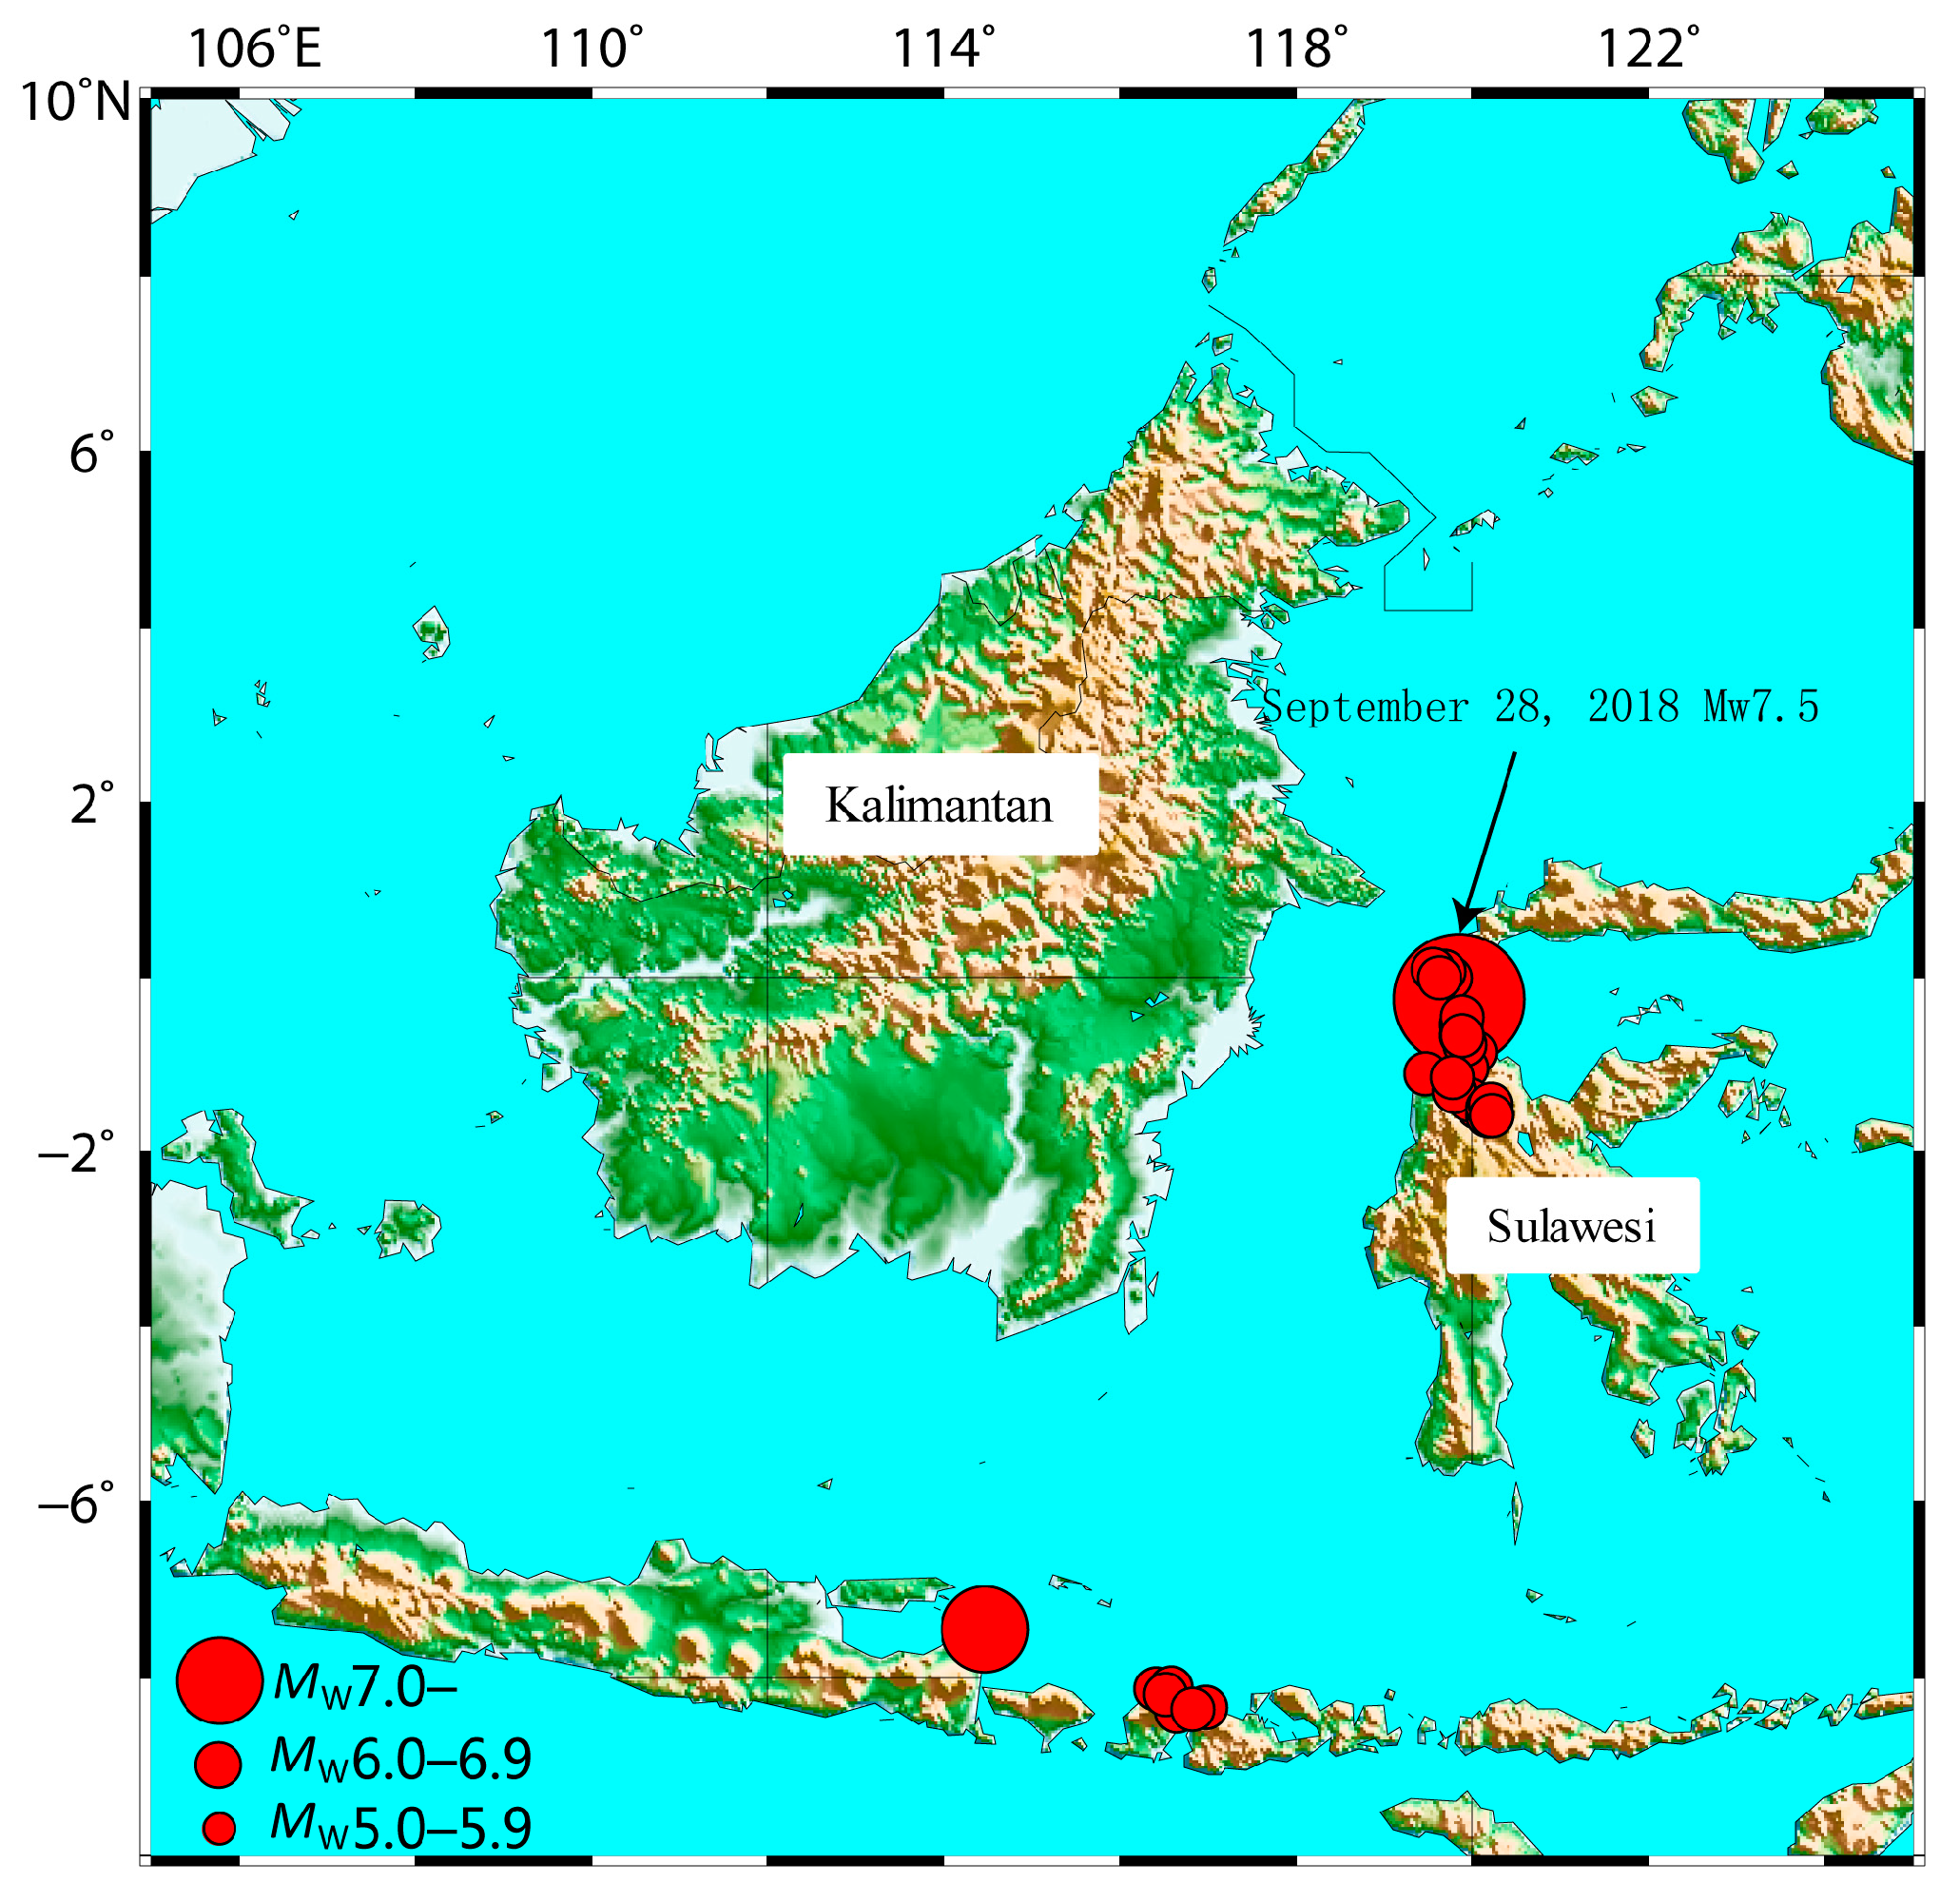
On 28 September 2018 at 10:02 am (UTC), an Mw7.5 earthquake occurred in the northern of Palu City in the western part of Sulawesi Island, one of the five major islands in Indonesia. The epicenter was located at 0.26°S, 119.85°E, and the focal depth was 20 km (http://earthquake.usgs.gov/earthquakes, accessed on 10 July 2023). The earthquake occurred at the intersection of the Australian Plate, Sunda Plate, and Philippine Plate. According to the report by the China News Agency on 11 October 2018, 2072 people died, 10,679 people were injured, and 680 people were missing in the Palu earthquake (China Radio International. http://news.cri.cn/2018-10-11/e07f7bf2-99e1-91ca-1ff4-7674c43ac20d.html, accessed on 30 September 2023). The main cause of death was the huge tsunami caused by the earthquake. From 1 September to 15 October, a total of 39 earthquakes with Mw ≥ 5.0 occurred in the study area (Figure 1). Among them, 20 earthquakes occurred on 28 and 29 September, indicating that the underground tectonic activity was very strong at that time.
The air temperature data were from NCEP in this paper, which were the reanalysis data assimilated and synthesized from all observable data of land, ocean, and sky and were a cooperative product of the National Center for Environmental Prediction (NCEP) and the National Center for Atmospheric Research (NCAR) in the United States [22]. Various observational data (from land surface, ships, sounding instruments, balloons, aircraft, satellites, etc.) were assimilated and stored on 1° × 1° grid points in standard binary format (GRIB), providing data four times a day. The advantages of NCEP data were spatiotemporal continuity and standardization, and air temperature data at different altitudes could analyze the spatiotemporal evolution of temperature before and after earthquakes more accurately. In this study, we chose the NCEP data from 1 September to 16 October 2018, and the study area was selected as 105°E–125°E, 10°S–10°N.
2.2. The Tidal Force and Air Temperature Calculation
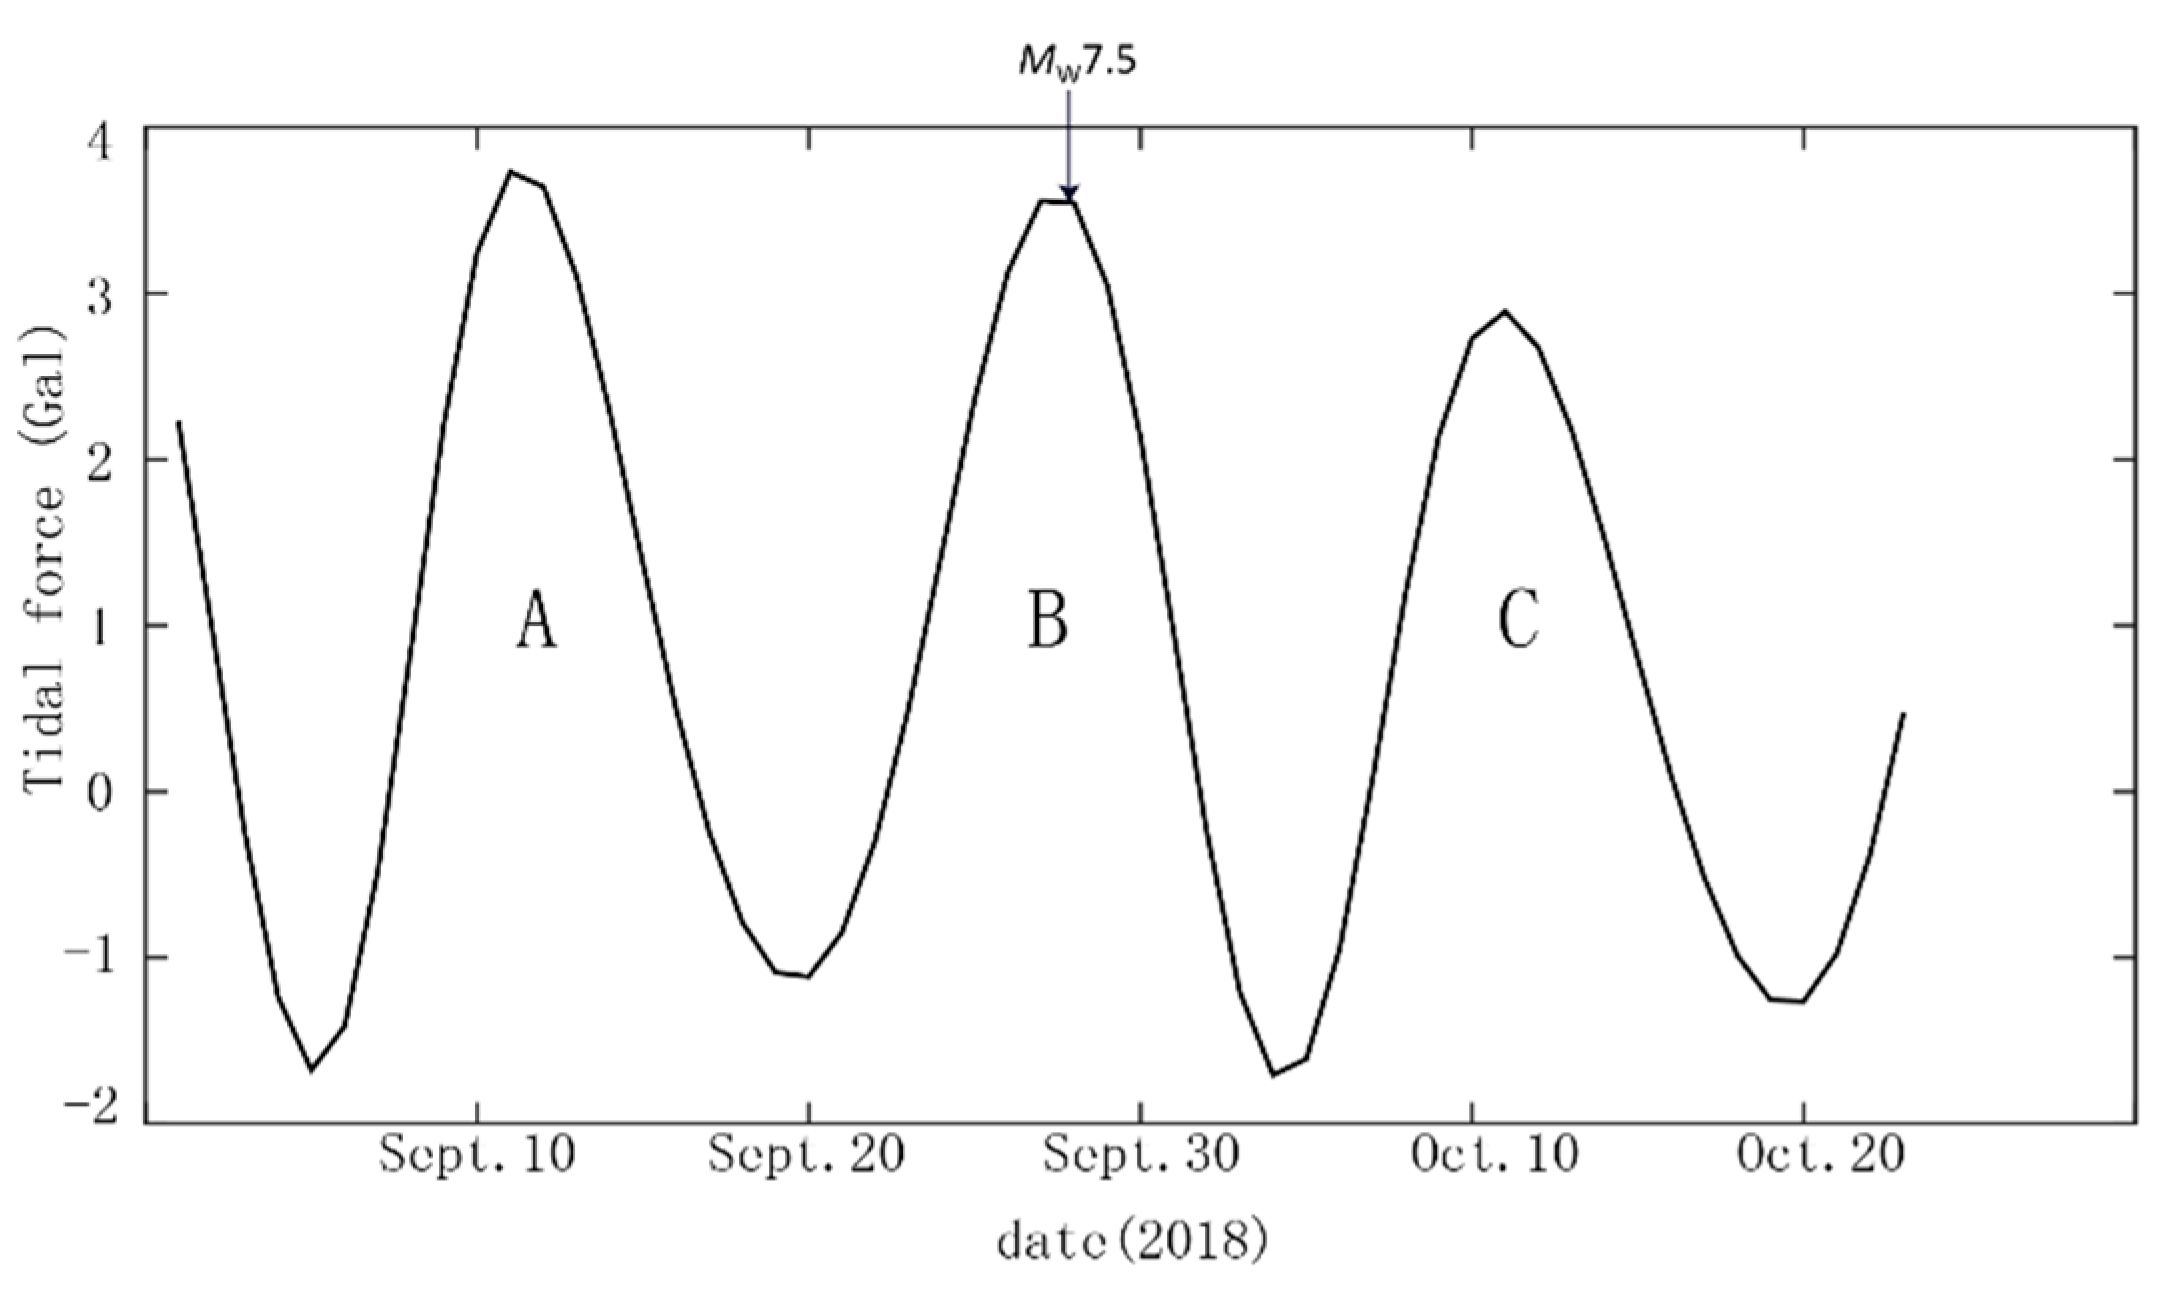
The change in tidal force was a continuous process with evident periodicity, usually a wave crest and a wave trough formed a cycle. This periodic change could also reflect the influence of tidal force on tectonics: enhancement–attenuation–enhancement–attenuation. The earliest discovery was that there was a certain correlation between lunar earthquakes and Earth’s position [57], and then studies were conducted on the relationship between tides and earthquakes. The relationship between the change rate in tidal stress and the tectonic stress was studied by Heaton [58], and there was a possibility of triggering earthquakes by adding the tidal force when tectonic stress was in a critical state from a mechanical perspective. Many large earthquakes have significant correlations with the times and orientations of daily/semi-daily tidal stresses, whereas the lunar for nightly term is associated with the ocean tides along the southern Californian coast [54]. Furthermore, earthquakes also have a certain clustering and regionality at a certain phase of the tide [59]. In all, large earthquakes are more likely to be triggered than small ones [60,61]. Through our experimental studies on a large number of earthquakes, the tidal forces of celestial bodies have relatively good triggering effects on earthquakes with magnitudes of 7 or above. According to the Kelvin calculation method, daily and monthly tidal forces were calculated, and the variations in tidal forces of the Palu earthquake in Indonesia from 1 September to 23 October were calculated by the focal mechanism solution (provided by the USGS in the United States) (Figure 2) [62]. In addition, according to the focal mechanism solution from the GCMT (Global Centroid Moment Tensors), it is known that the Palu earthquake was mainly characterized by strike slip rupture [63].
The tidal force generated by any celestial body at any point inside the Earth was [64]:
k is the constant of universal gravitation; M is the mass of the sun or moon; represents the distance between the centroid of a star and the center of the earth; represents the radial vector of the position of point within the Earth’s interior; was the Legendre polynomial of ; and represents the zenith distance of a star.
In order to study the air temperature changes in the Mw7.5 earthquake in Indonesia on 28 September 2018, the study area was selected as 105°E–125°E, 10°S–10°N. The method of temperature calculation, which subtracted the background value to obtain the air temperature results on the specific data, was used to obtain the numerical field distribution of grid points in the radiation enhancement area. This process could reduce the “anomaly” of static temperature caused by the difference of terrain and ground object emissivity.
In Formula (2), represents the air temperature increment of each grid point; represents the air temperature value of each grid point; was the background value of air temperature; represents latitude; represents longitude; and represents the grid coordinate.
3. Results and Analysis
The celestial tidal force that triggers earthquakes is mainly the gravitational pull of the sun and moon tides. Not only the gravity of the moon but also the gravity of the sun, so it is not possible to classify the period of tidal force solely based on lunar phases of the moon. According to previous studies, the starting stage of each period was the previous turning point of the seismic stage, and the phase of the tidal force was related to the type of earthquake generally. The normal fault and strike-slip type earthquake mostly occurred near the peak of the tidal force position. Usually, the first low-value phase moment before them was selected as the background moment, and then the moment was subtracted daily [65,66,67]. The Palu earthquake was a strike-slip earthquake with a normal fault. So, we selected the low points of tidal force as the beginning of the periods.
The celestial tidal force underwent three consecutive periods of changes from trough to peak to trough (A, B, and C) since 1 September 2018; Period A represented 7–19 September, Period B represented 20 September–3 October, and Period C represented 4–18 October. In the results of the tidal force, the Palu earthquake (as shown by the arrow in Figure 2) did not occur in Period A but in the peak stage of the tidal force in Period B, indicating that the accelerate action of the additive tectonic stress may successively promote the fault sliding, and the instantaneous change in the additive tectonic stress did not trigger violent shock at once but when the tectonic stress reached its critical broken point [68]. However, it was not that the additional tectonic stress in Period A had no effect on the earthquake, but rather had also played a cumulative role. In all, the tidal force might be one of the effects to trigger the earthquake, and it could provide background information for air temperature change research.
The Palu earthquake occurred during Period B, taking the air temperature data of 20 September (the low turning point of the tidal force in the figure) as the background of Period B. As celestial tidal force is the largest known periodic force acting on the Earth, it was considered possible to trigger an earthquake when the tectonic stress generated by the earthquake reached the critical stage [24,69]. In addition, Period A and Period C, respectively, selected 7 September and 4 October, which were adjacent to the trough as the background. The air temperature values at the same time each day were subtracted from the background air temperature values to obtain continuous daily changes.
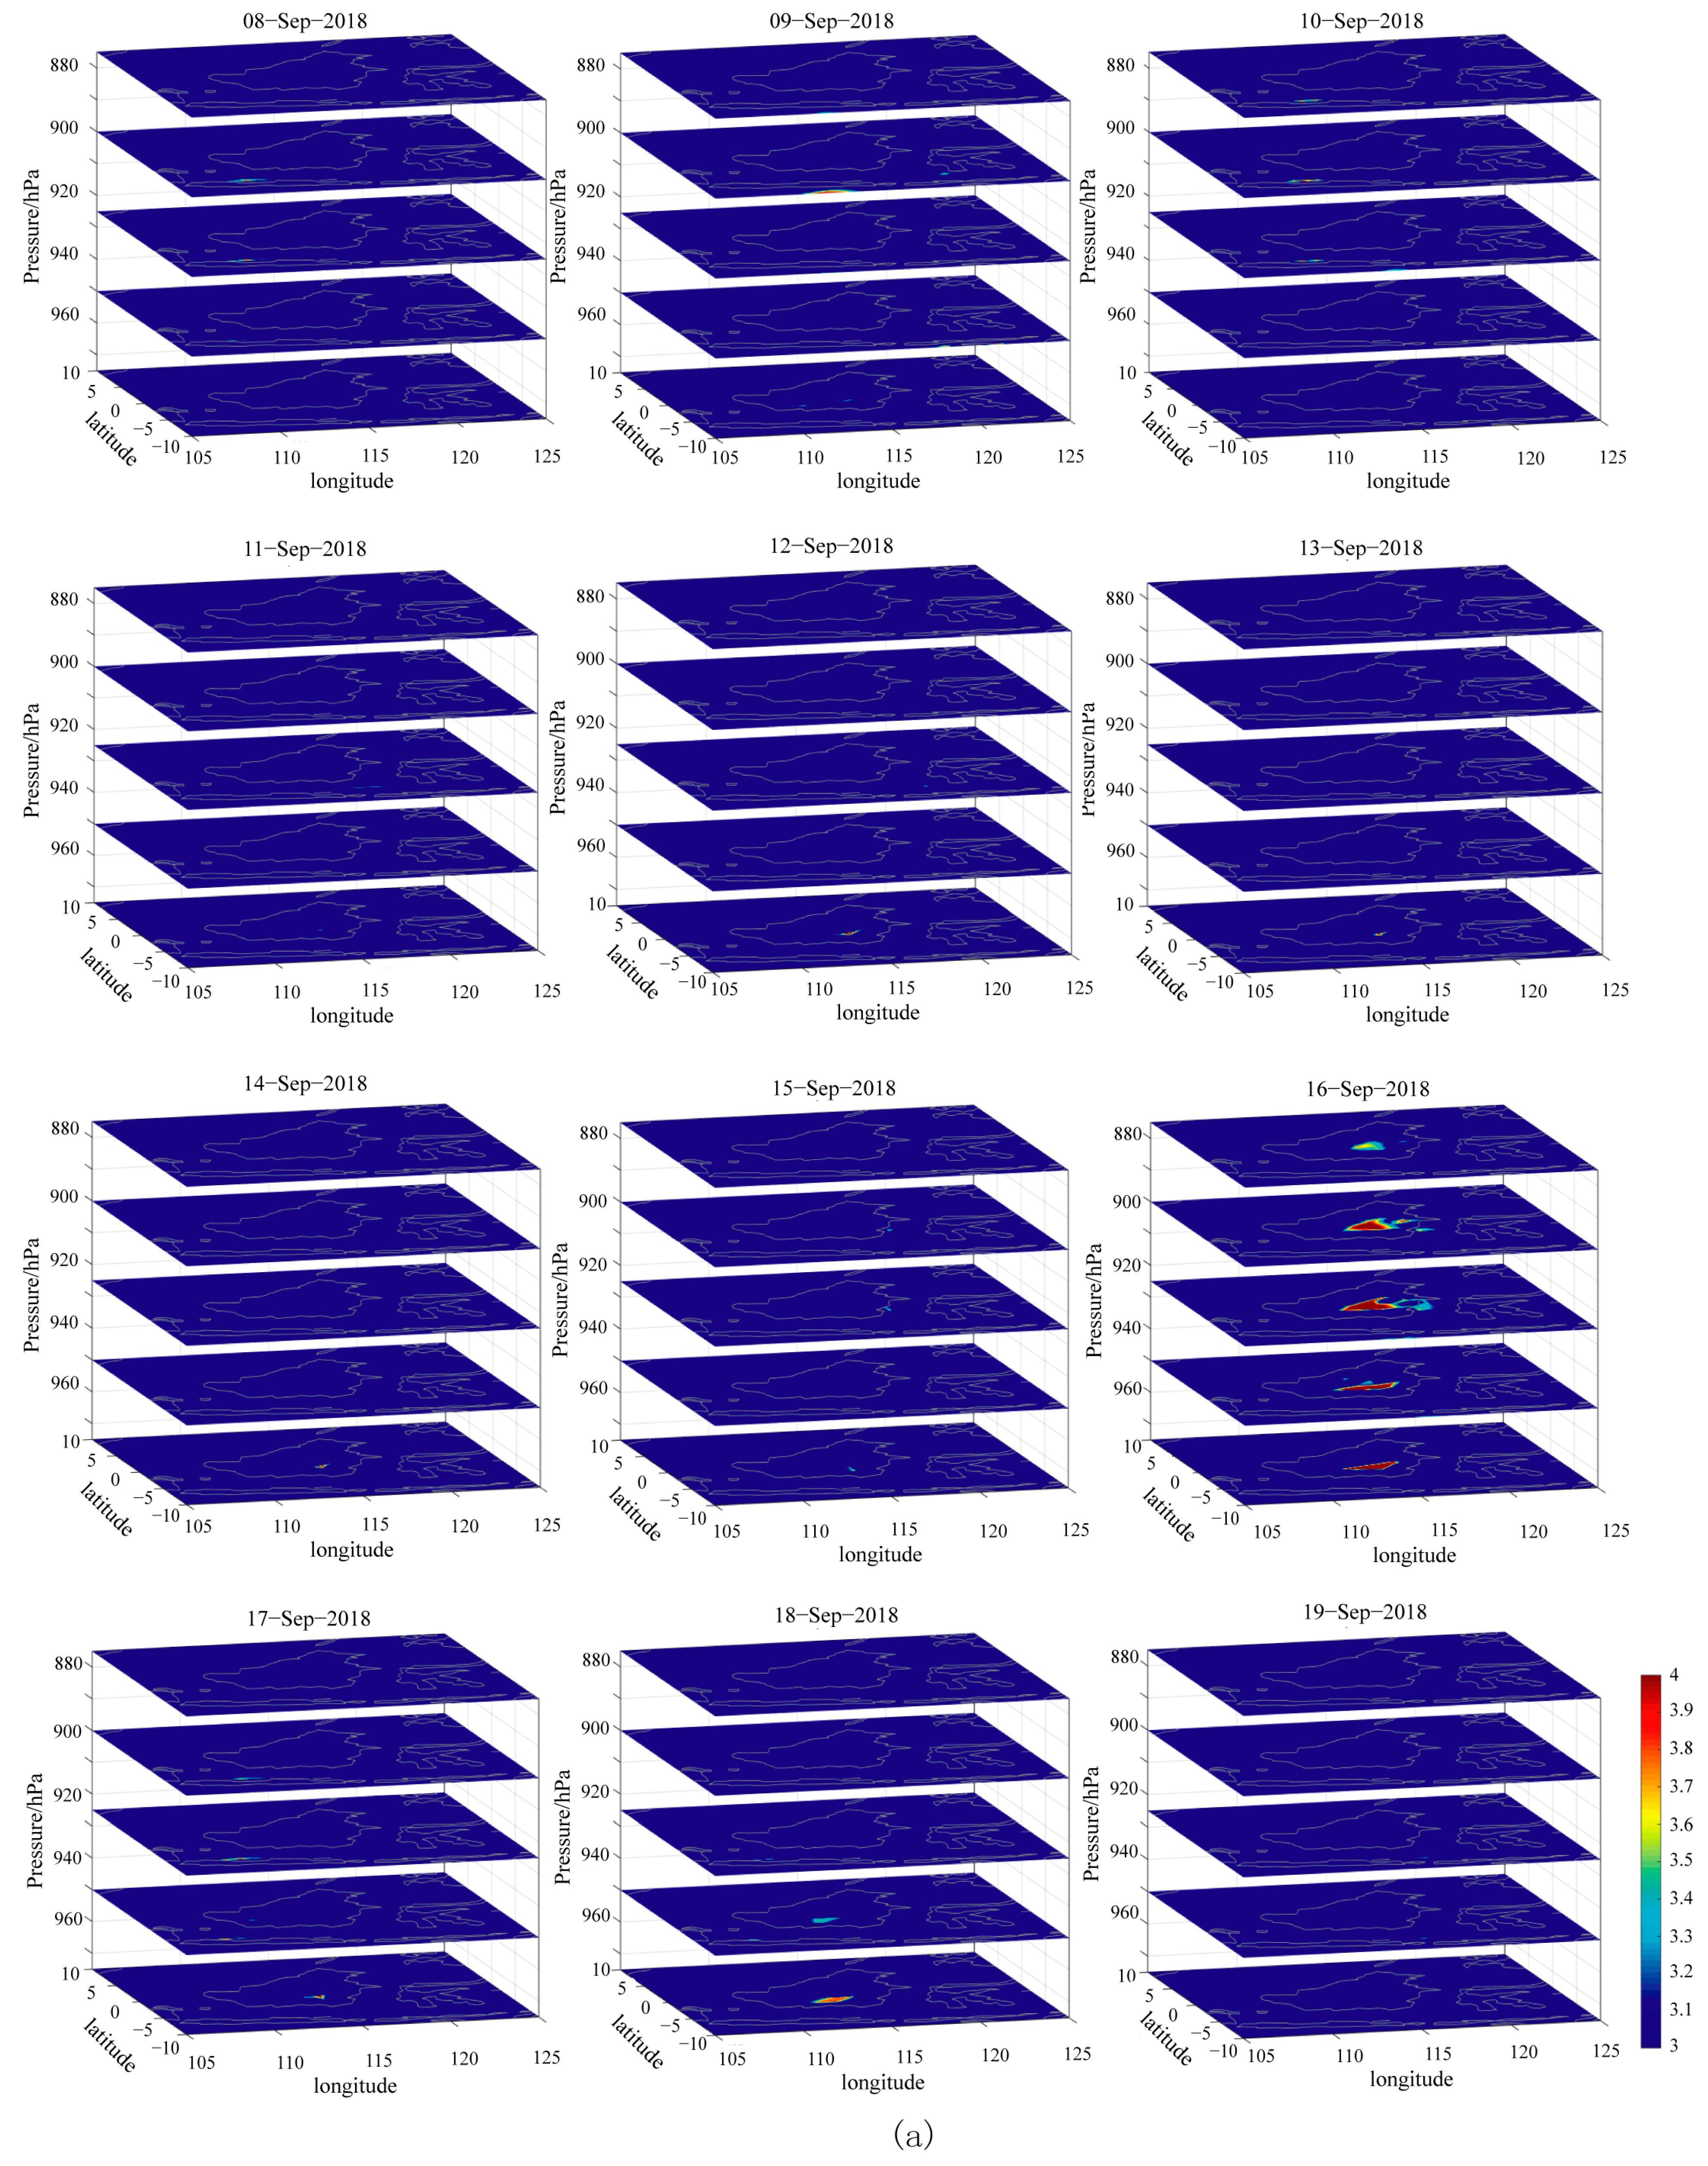
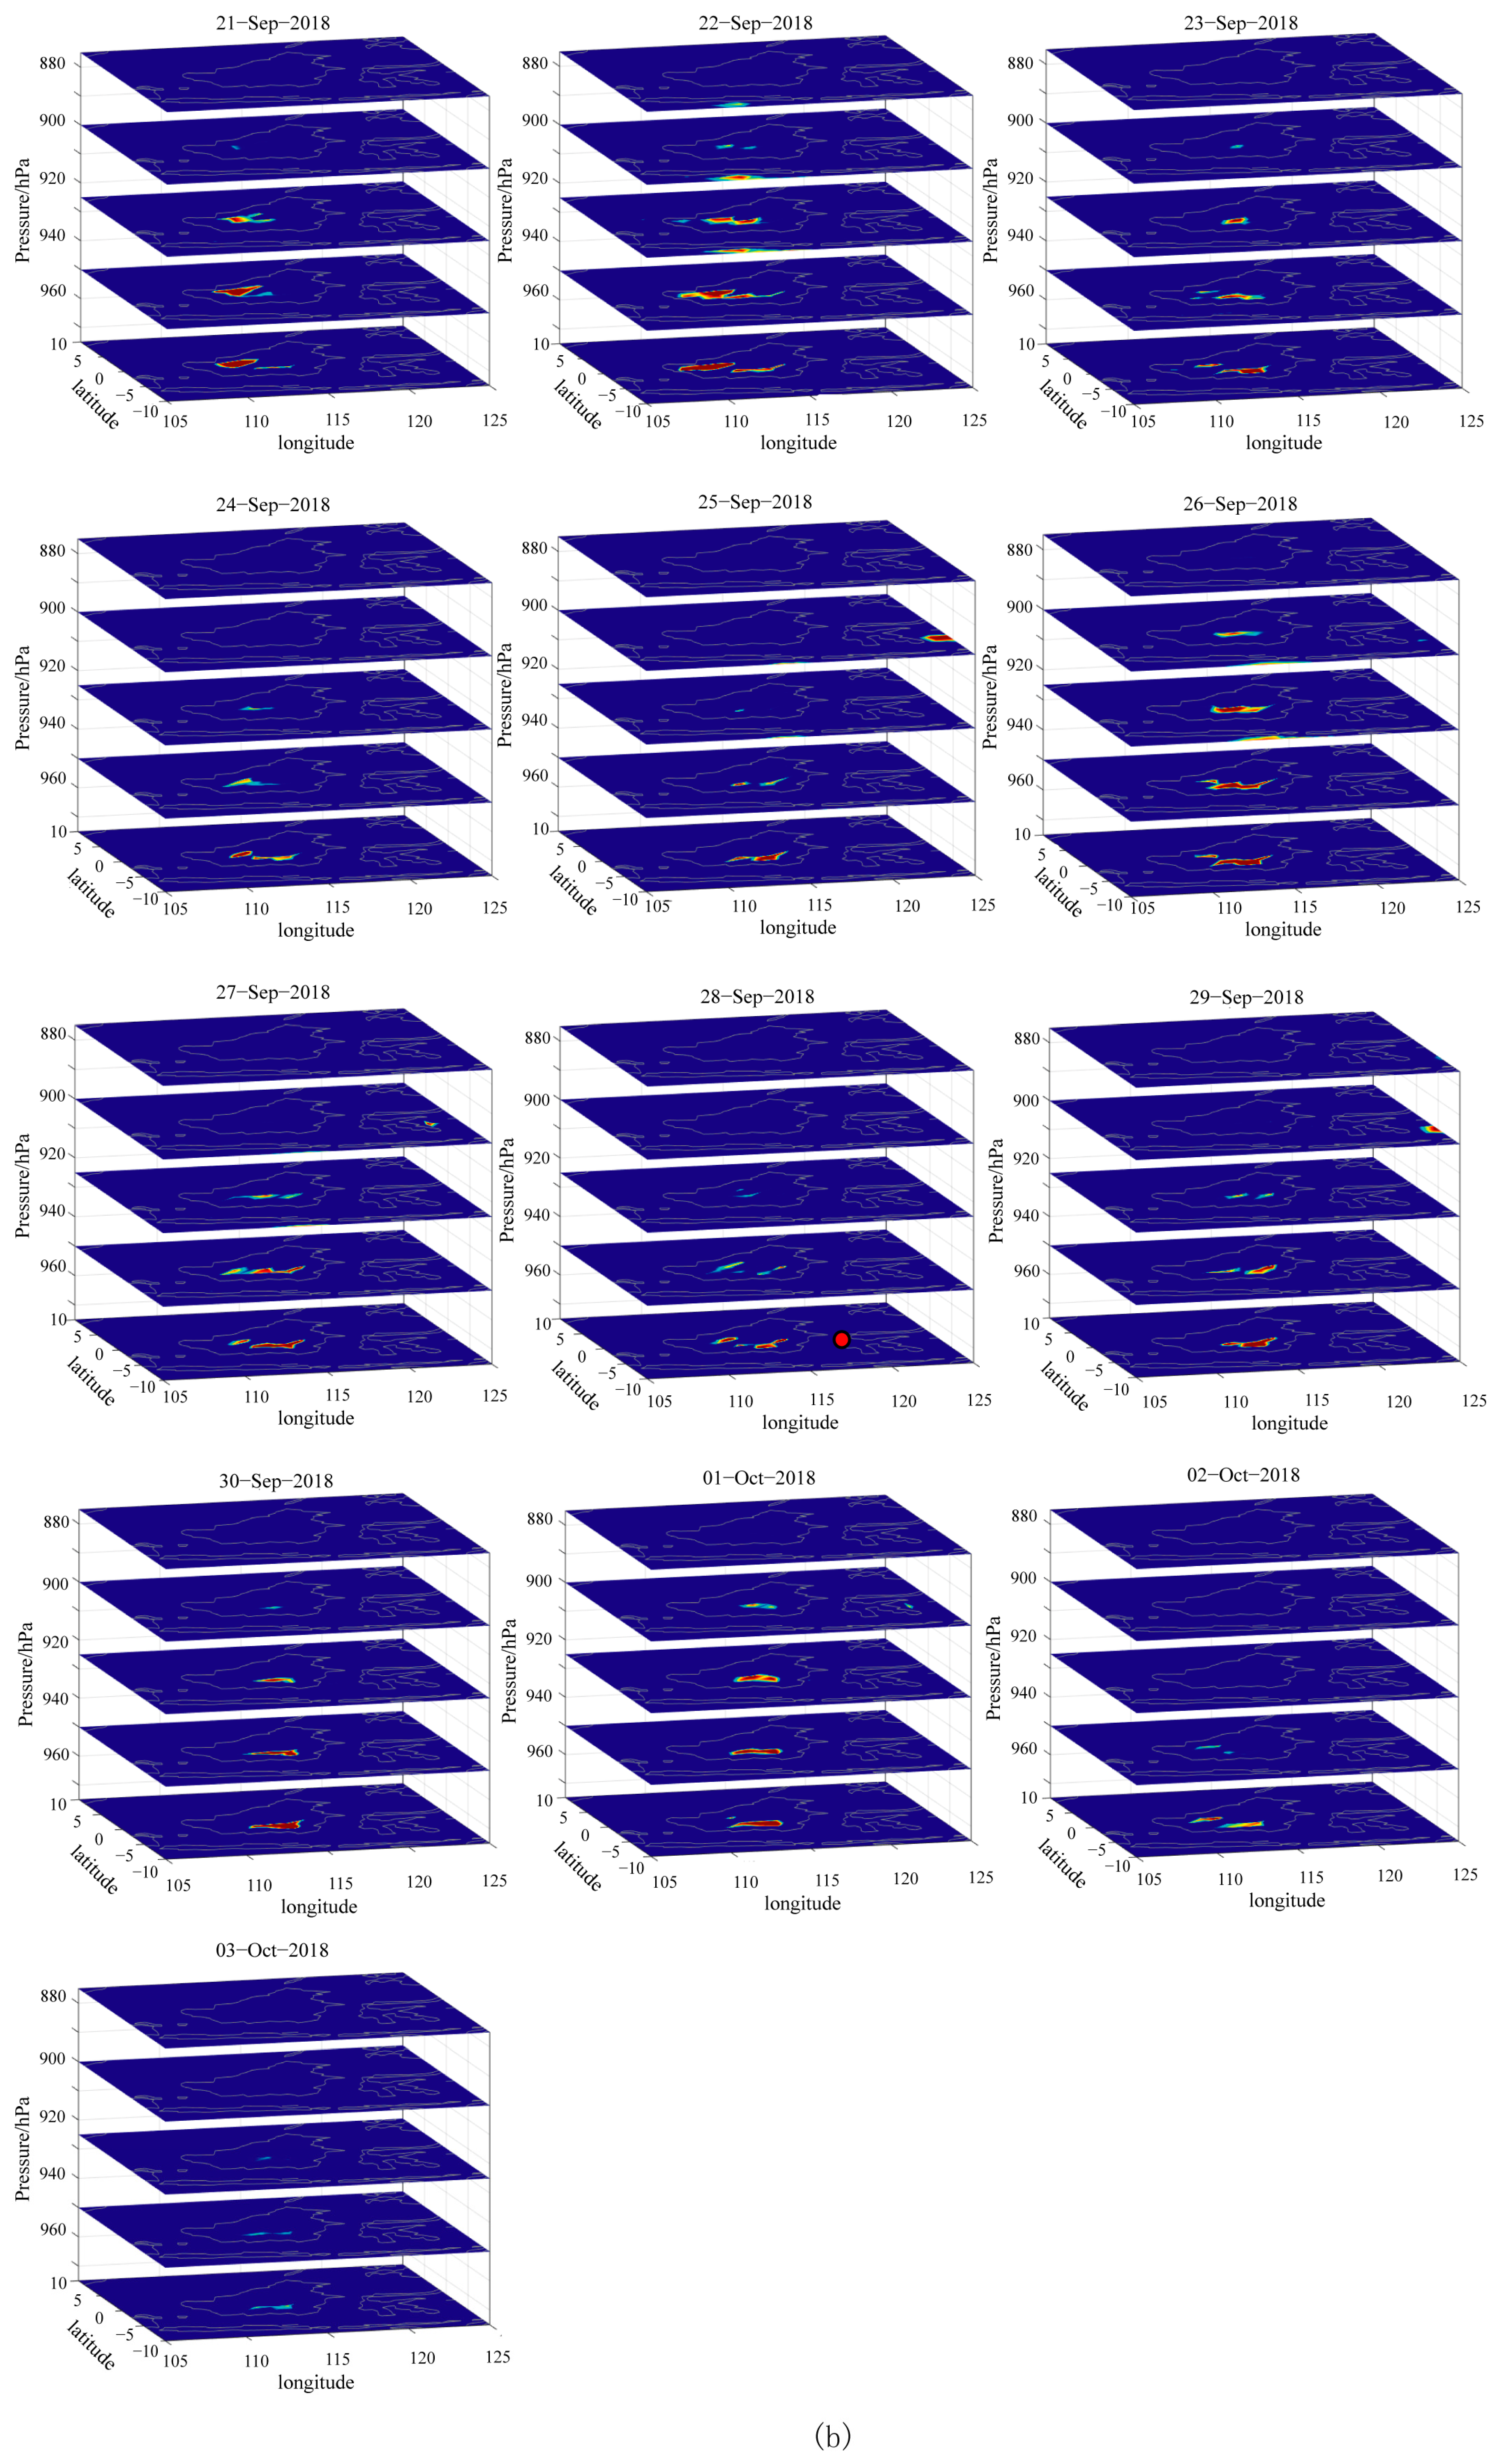
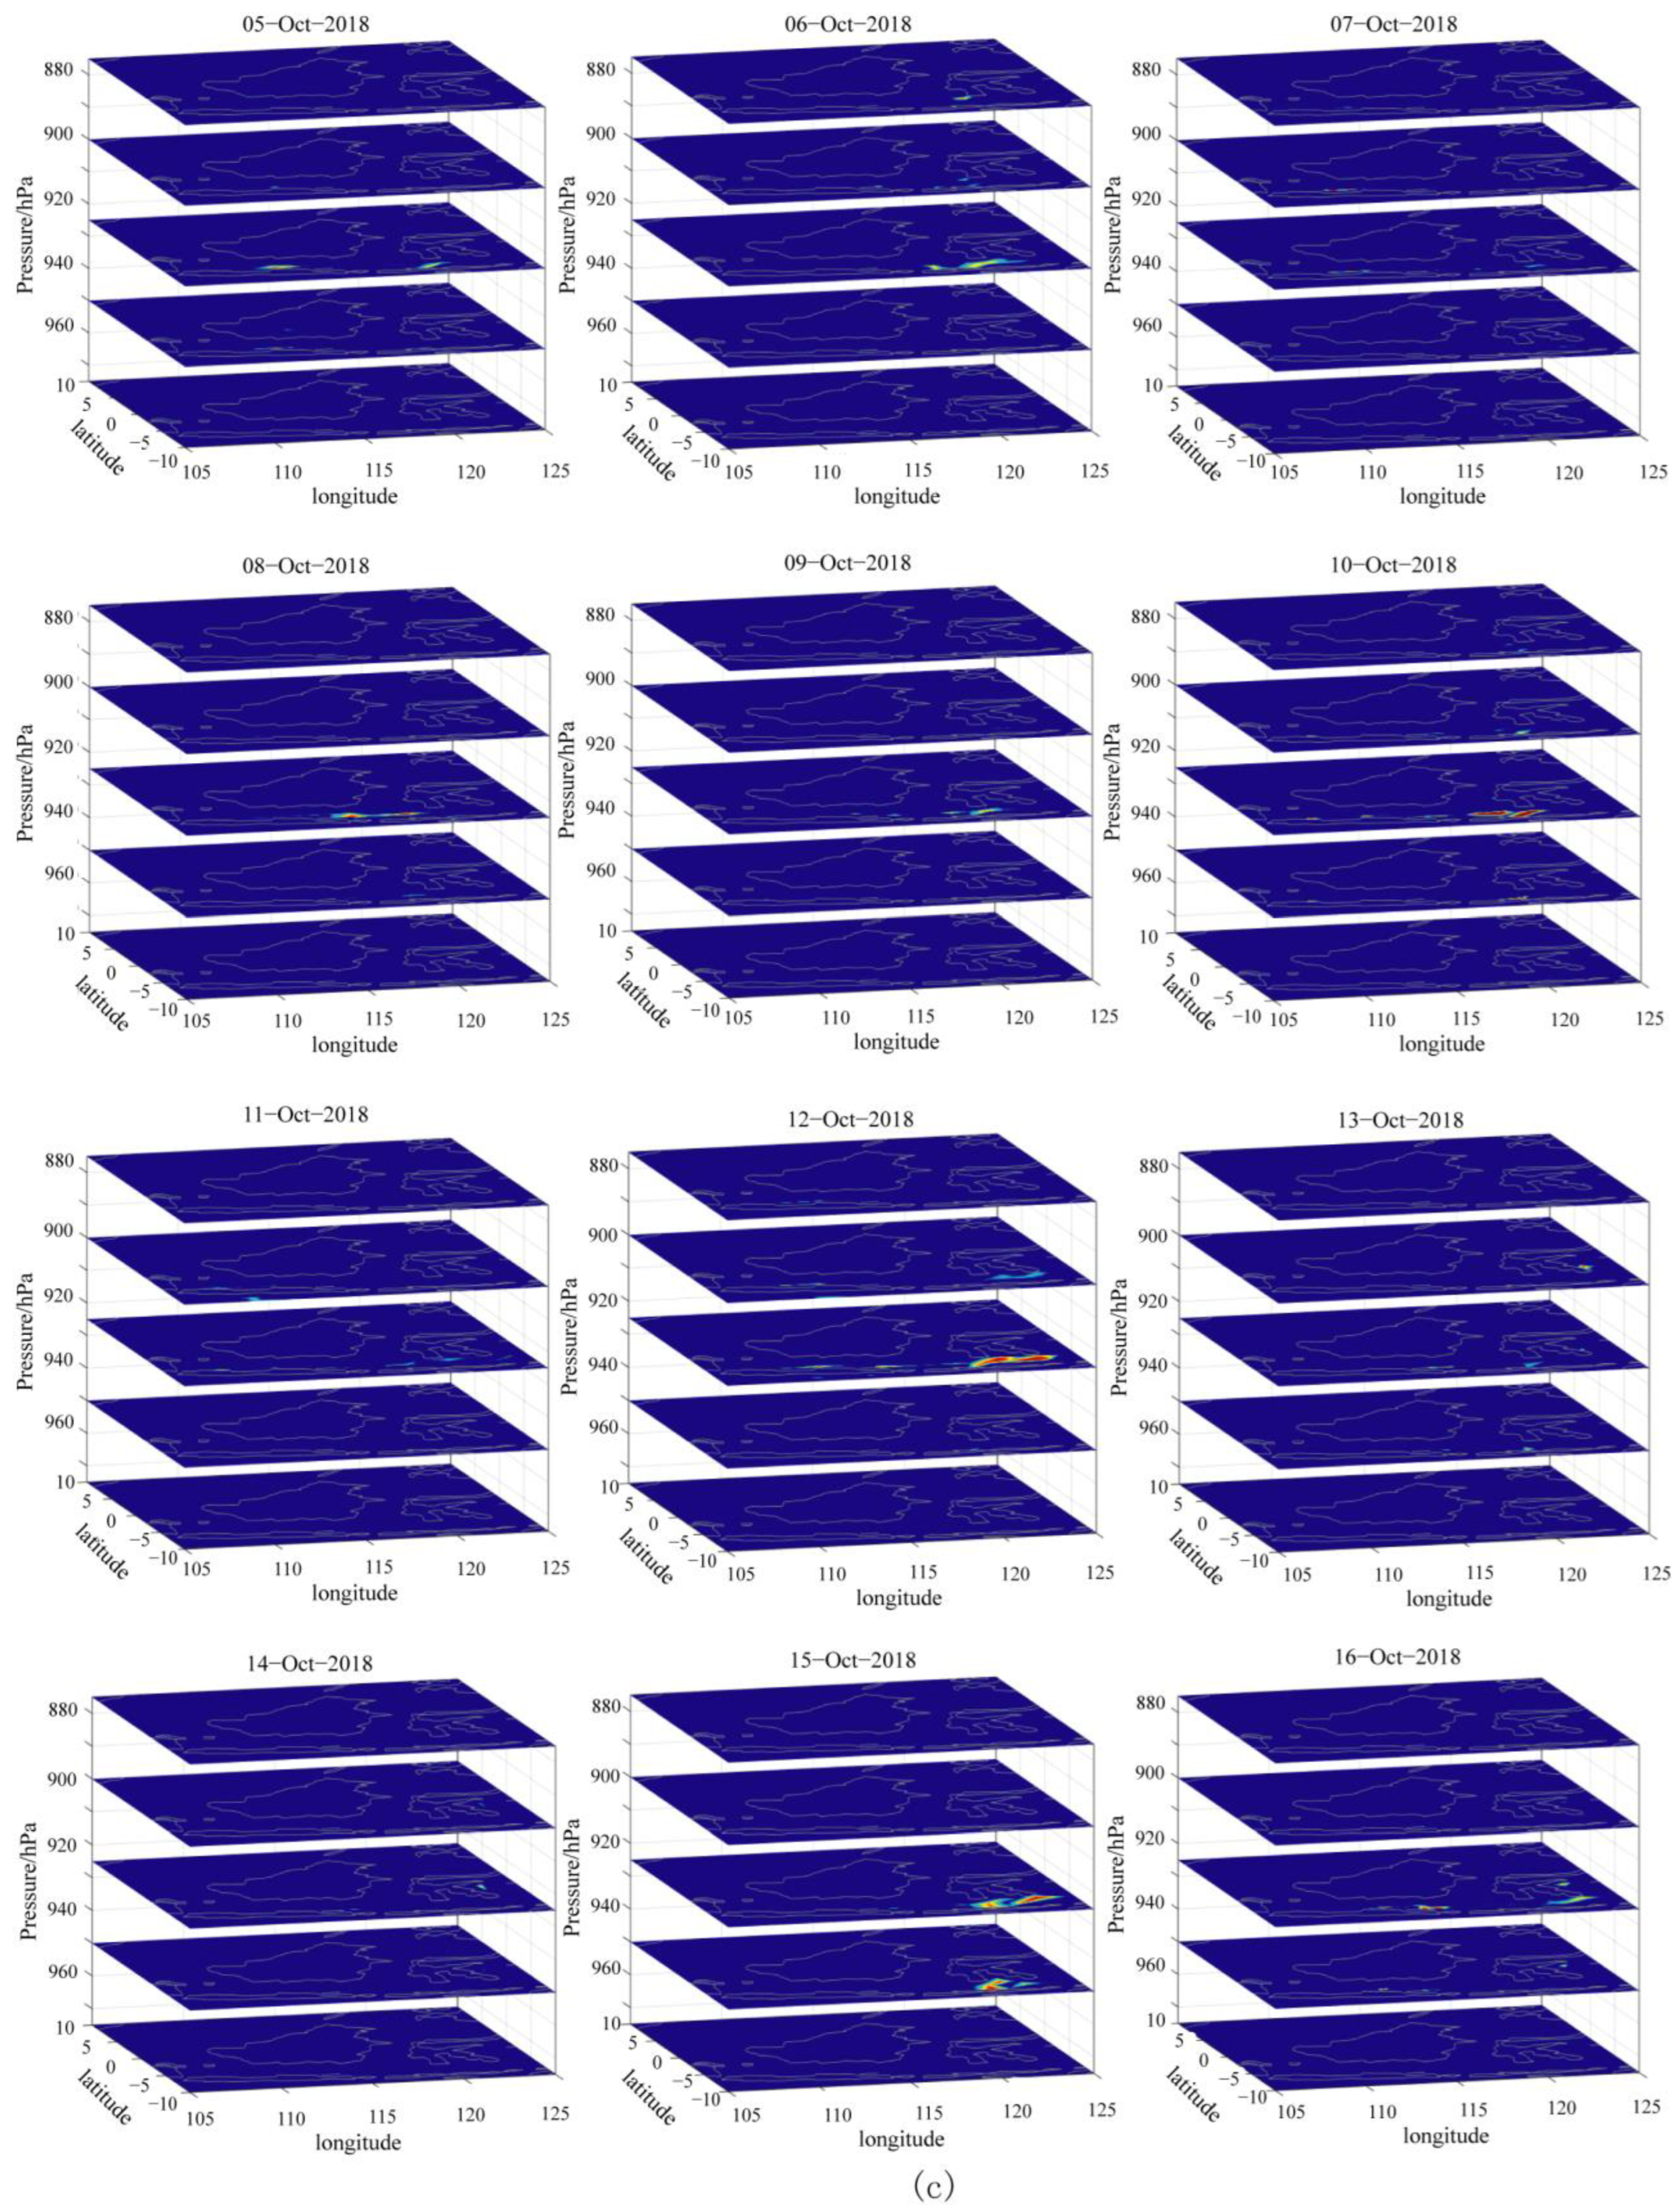
Figure 3 shows the temperature changes during different periods at different heights from 975 hPa (near the land surface) to 875 hPa (high altitude) in the study area. The Palu earthquake occurred on 28 September in Period B, and the high temperature anomaly began to appear in the southwest of Kalimantan Island on 21 September. On 22 September, the anomaly gradually migrated towards the southeast of Kalimantan Island, with the highest temperature anomaly near the land surface and the smaller the intensity of the temperature anomaly in a higher altitude. This was the thermal anomaly caused by underground tectonic activity. The high temperature anomaly on 26 September was very evidently in the southeast of the island, and the earthquake occurred on 28 September; then, the anomaly almost disappeared on 3 October. An earthquake is a sudden change from deformation to rupture of the crustal media, which is nonlinear and has been confirmed in physical monitoring of deformation and rupture of the media, such as GPS observations [70], Load Unload Response Ratio (LURR) [71], and Remote Sensing Rock Mechanics [72] experiments. Especially, the “intermittent criticality” of the medium at the critical point of rupture [73] and other results indicate that earthquakes are still a nonlinear process in nature. Therefore, after a significant high temperature anomaly appeared on 22 September in Period B, it weakened and became apparent again on 26 September, which may be related to the “nonlinear” deformation and fracture process of the underground medium. However, the air temperature anomaly in Period B remained consistent with the tidal force changes. The anomaly on the 22 September was in the southwest of the island, then the anomaly gradually migrated towards the southeast of the island, which was closer to the epicenter. The addition of tidal force and tectonic stress triggered or induced tectonic activity, which may lead to an increase emission of greenhouse gases (CO2, CH4, etc.) [74], resulting in air temperature increases.
The relatively evident air temperature anomalies appeared on 16 September in Period A; at the same time, there were air temperature anomalies both on 12 and 15 October in Period C. However, the air temperature anomalies on September 16 showed that the increase intensity near land surface temperature was weaker than the upper air temperature, whereas the air temperature anomalies on 12 and 15 October just only appeared in the upper layer, with no anomalies near the land surface. So, they were not air temperature increase anomalies caused by underground tectonic activities and had little relationship with seismicity.
4. Discussion
The air temperature is indeed easily affected by the weather conditions of cloud coverage, etc. Due to Indonesia being located in the equatorial region, the study region was covered with thick clouds for years (National Meteorological Satellite Center, http://www.nsmc.org.cn, accessed on 15 July 2023), so it is not practical to remove the clouds alone. Furthermore, although there were many clouds over the study area accompanied by rapid flow, the results of our research still showed that the anomaly areas of air temperature were relatively fixed and concentrated in the Sunda Continental, with a high surface heat flux, which was caused by radioactive granite and its erosion [75].
However, this study conducted a stratified study of the air temperature in the study area and found that air temperature anomalies related to earthquakes had the following characteristics: The air temperature closer to the land’s surface had a greater anomaly amplitude and a wider anomaly range. As the altitude increases, the air temperature gradually decreases, and the range of anomalies gradually reduces until it disappears. The anomalies in our research results belong to this type. If the surface temperature anomaly is weaker than the upper air temperature, or only the upper air temperature anomaly appears, it may be caused by weather conditions and not as an anomaly caused by seismic activity.
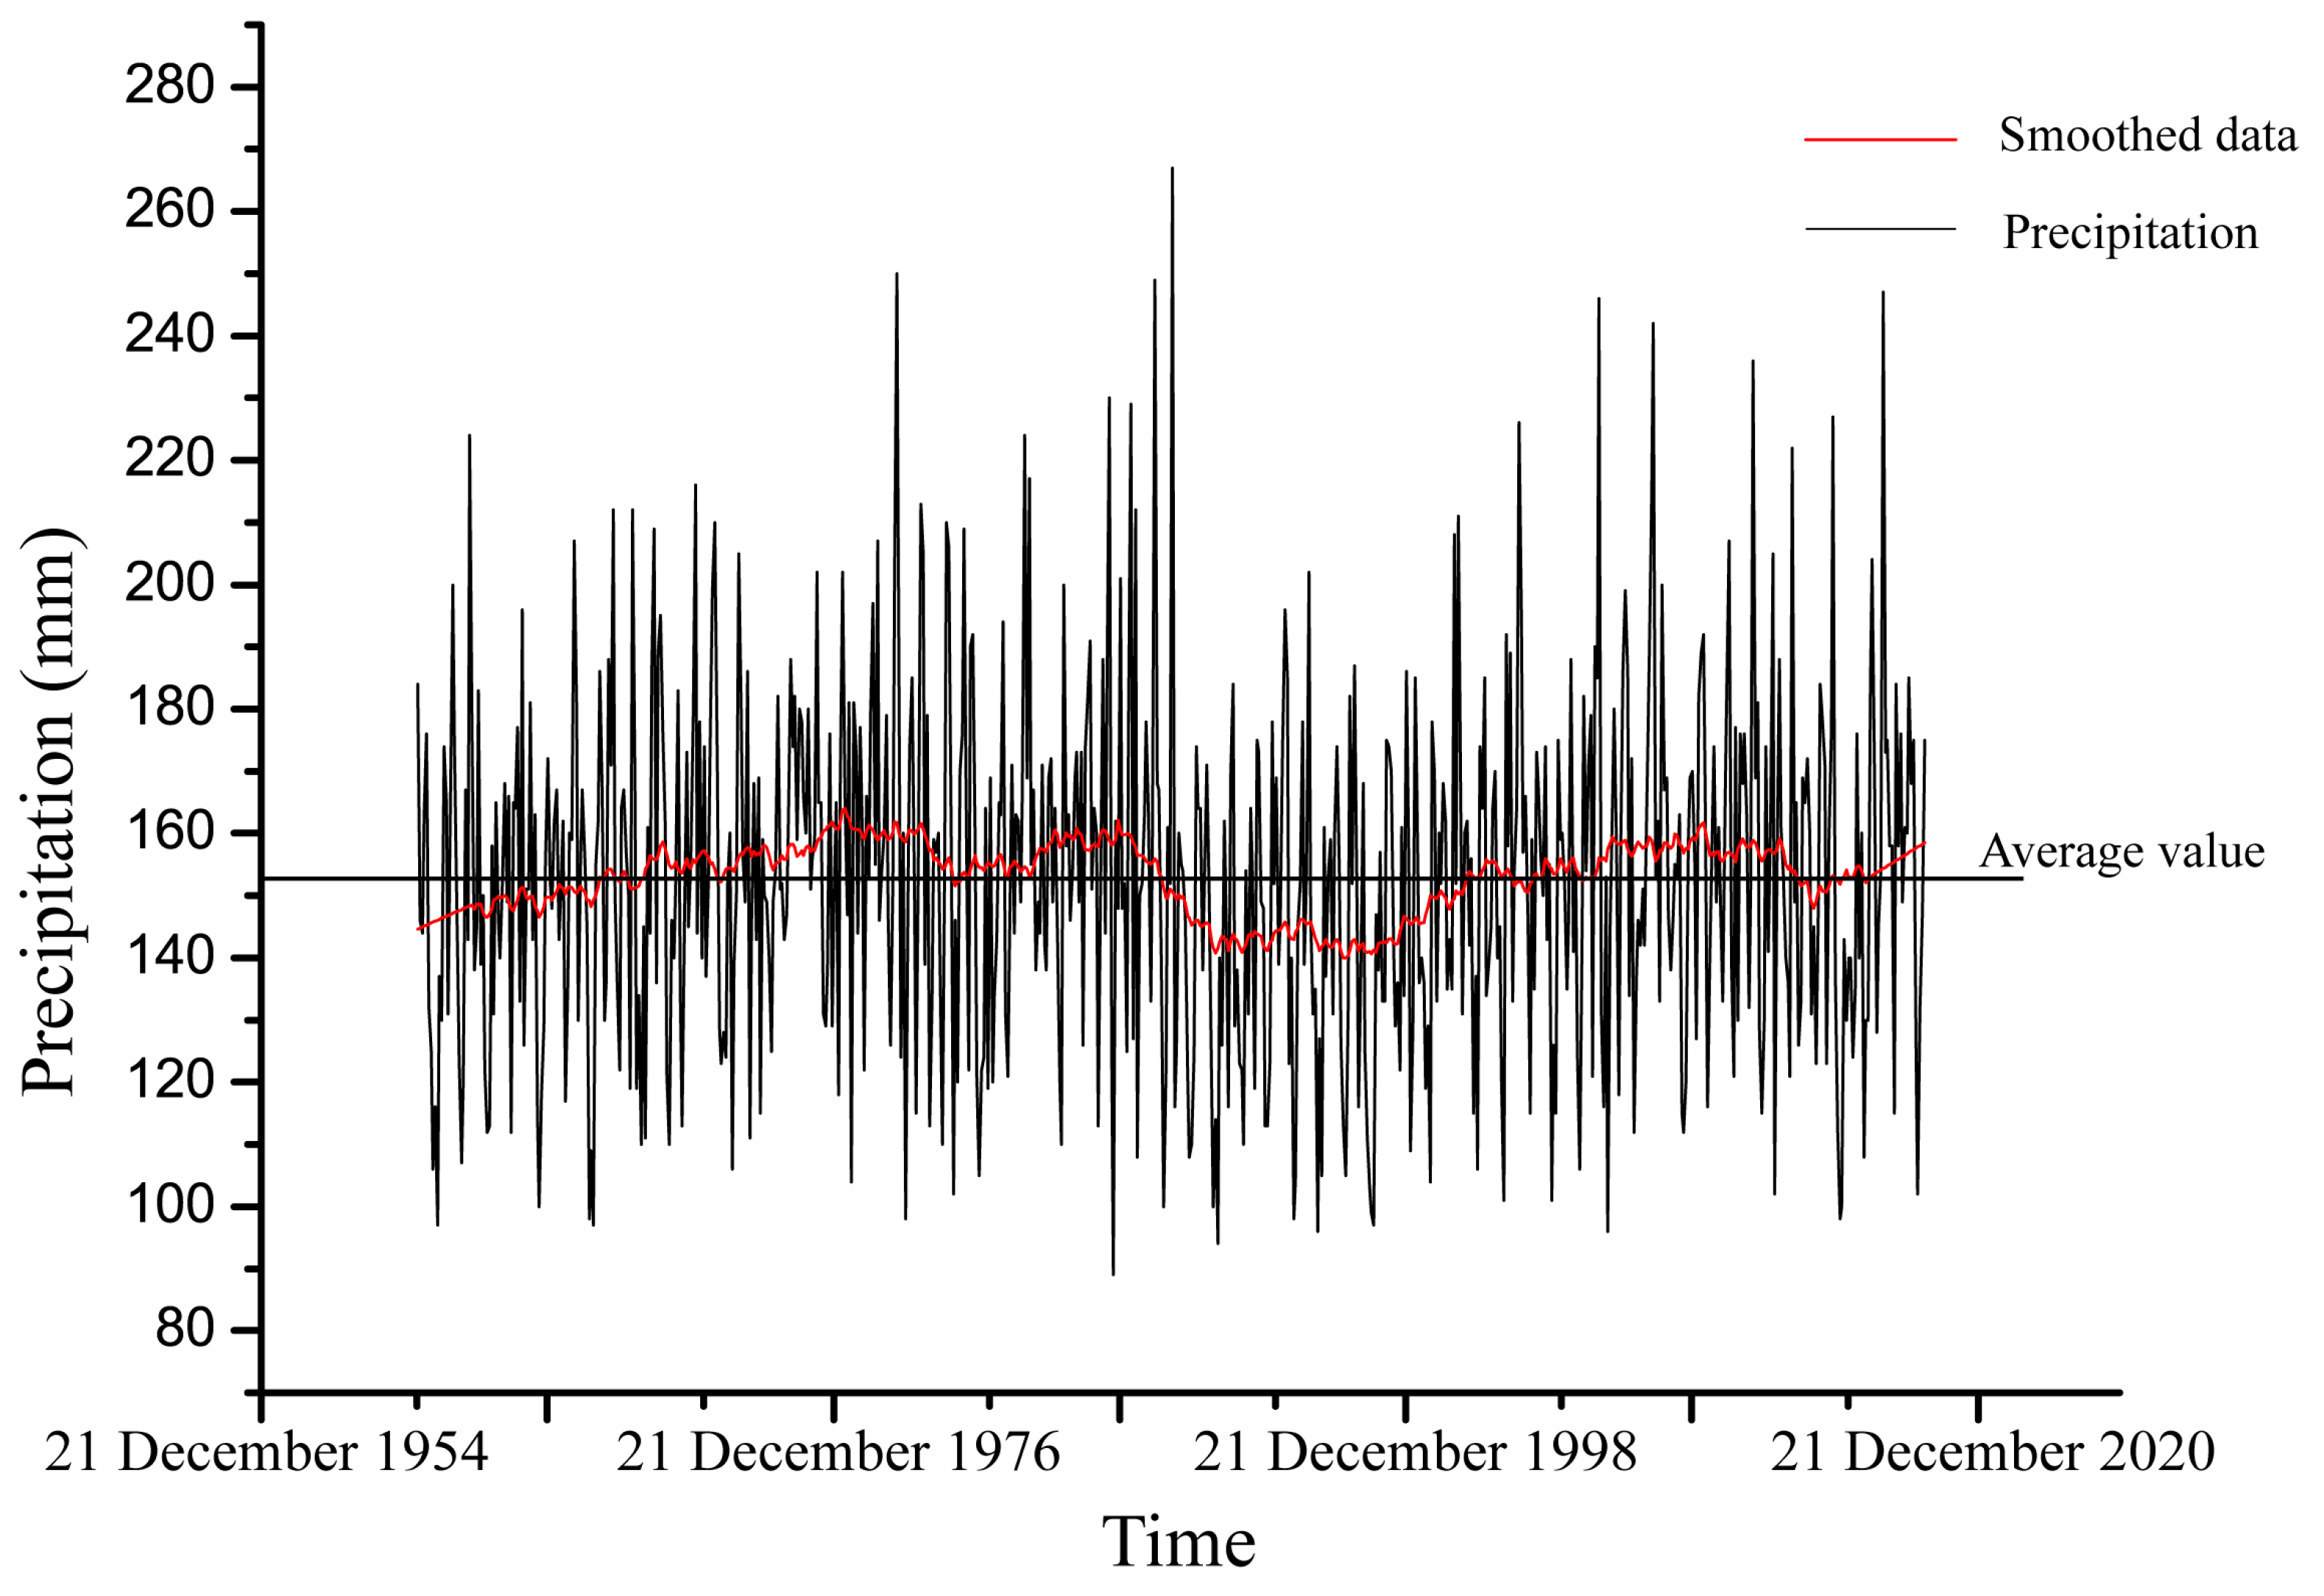
Indonesia does not have spring, summer, fall, or winter, but only the rainy and dry seasons. The main variable of climate is rainfall, with a lot of precipitation every month. Figure 4 shows the monthly precipitation of Palu in Indonesia from January 1961 to December 2018 [76,77]. It can be seen that the smoothing data of precipitation in Palu region has been fluctuating near the average value since 2001, indicating that there have been no extreme weather events in the region.
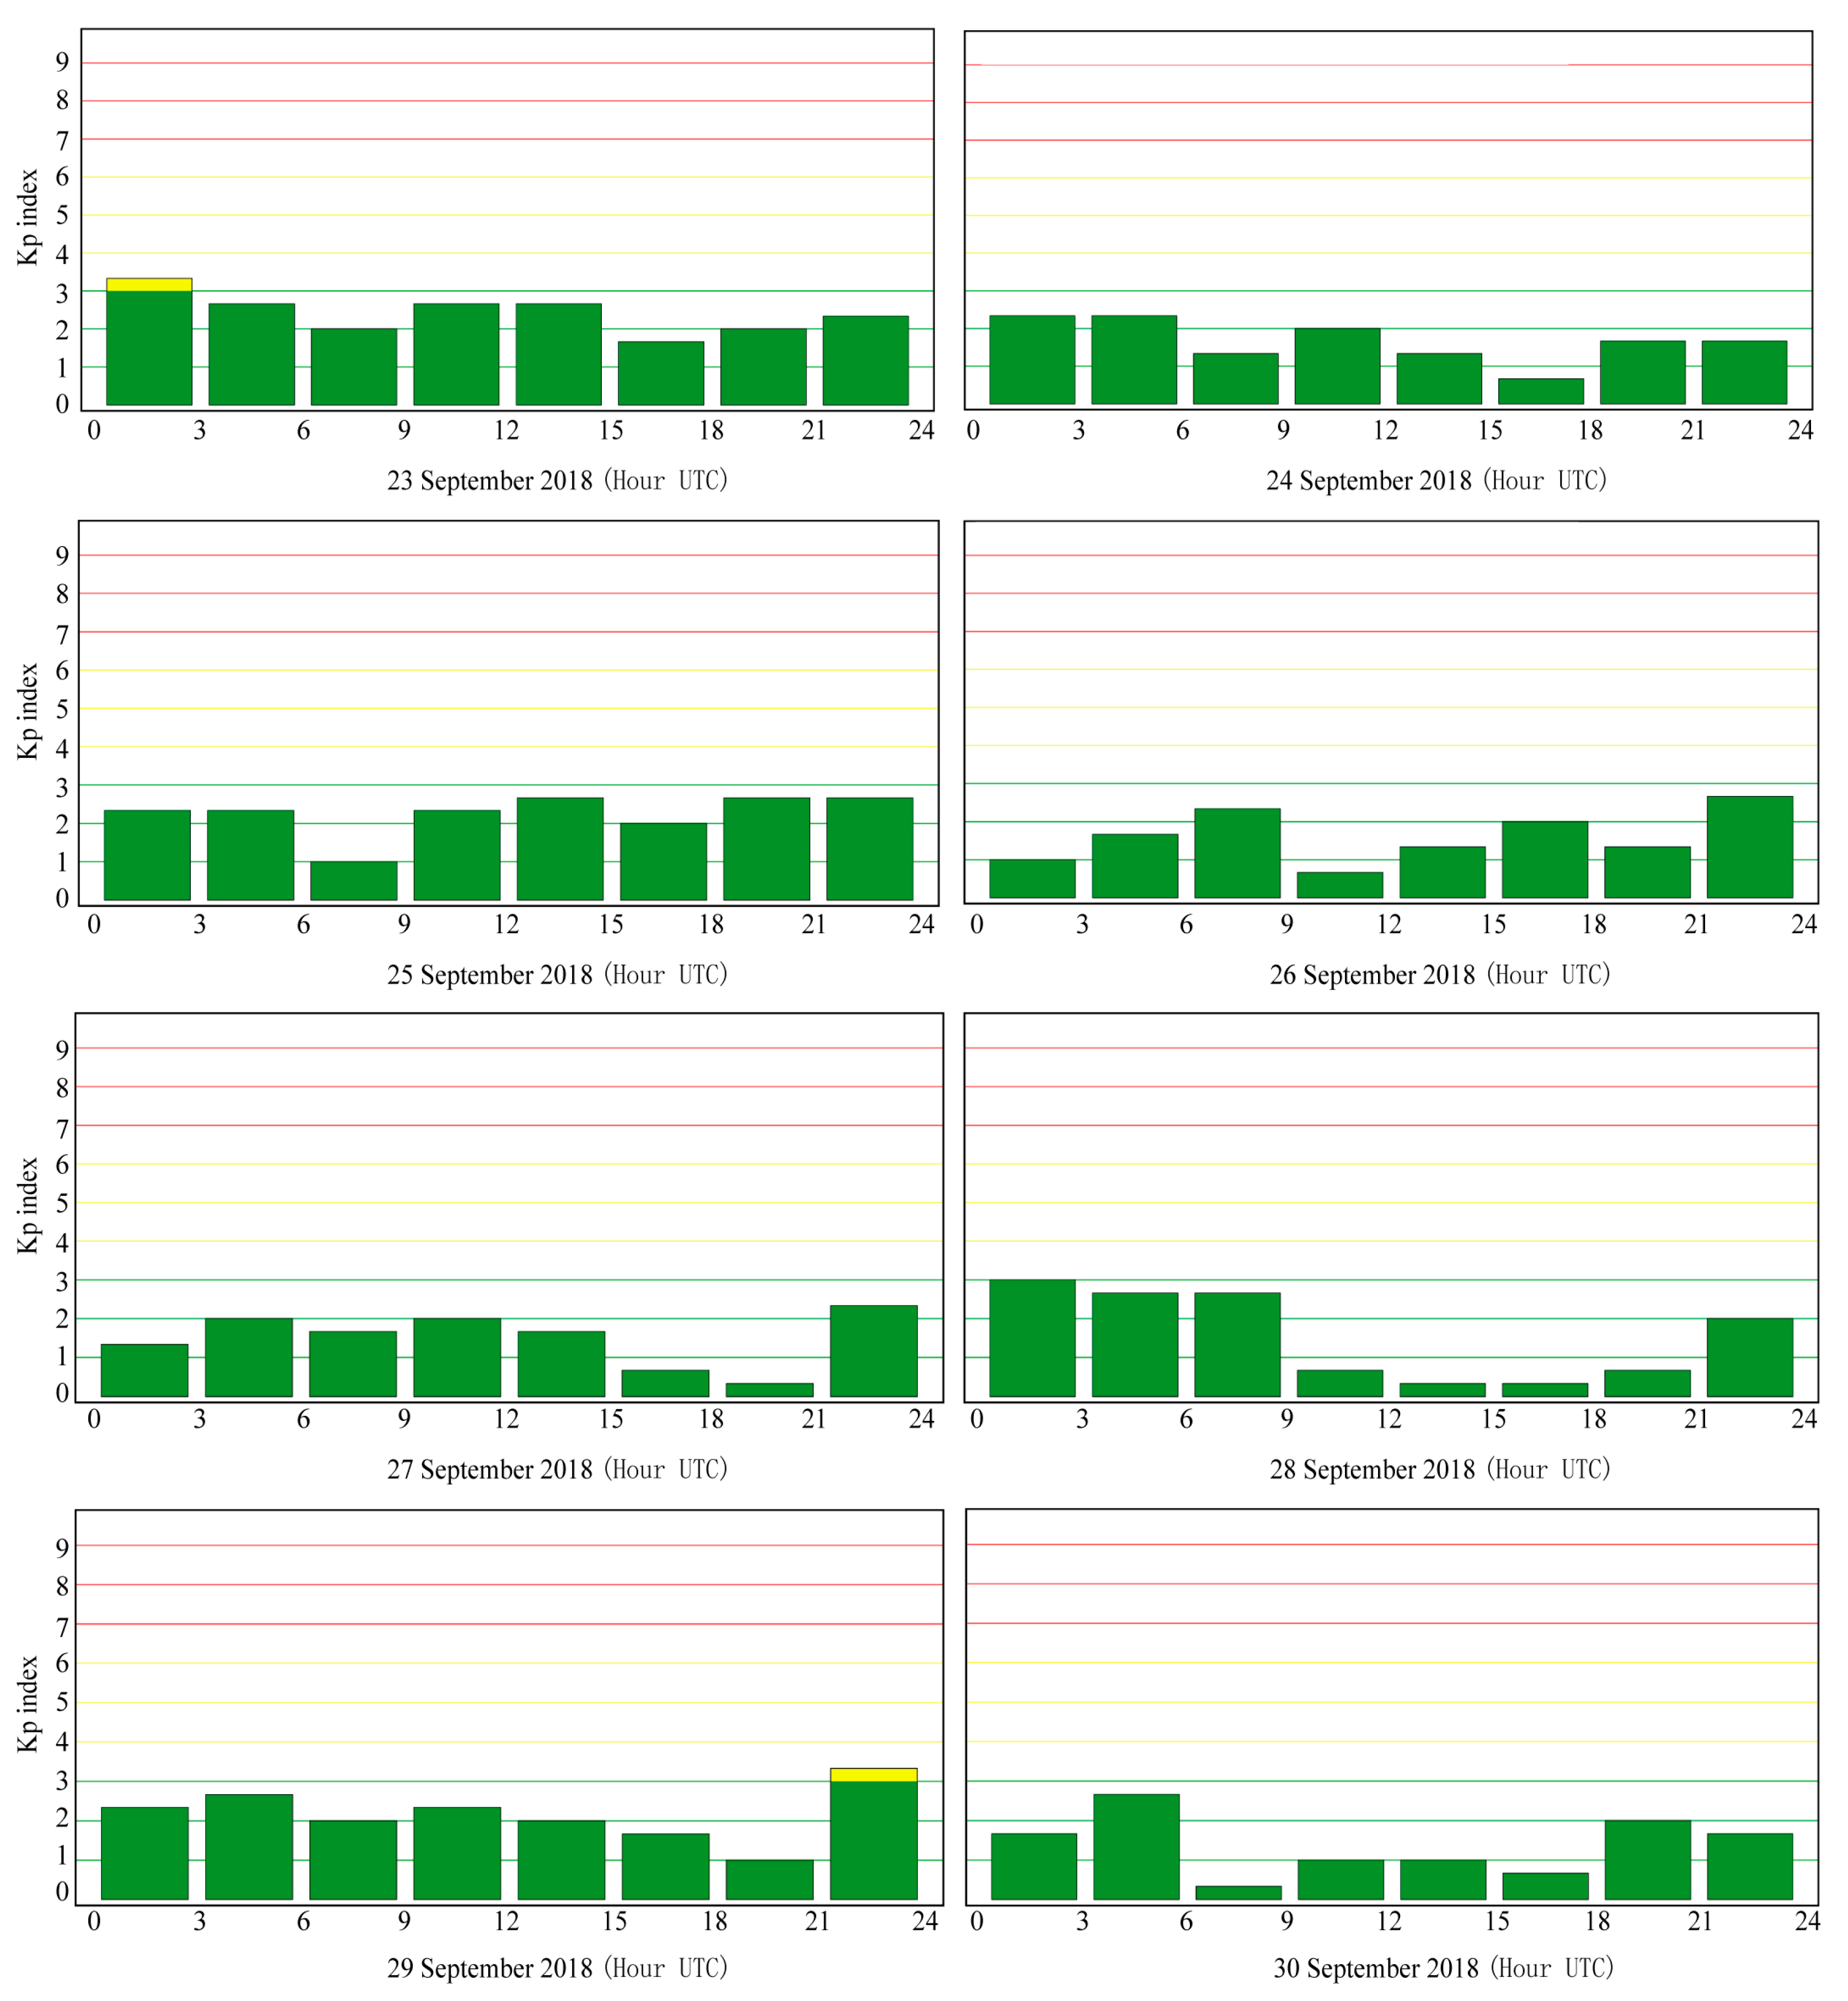
Solar geomagnetism also can influence the air temperature especially in the equatorial region. In order to eliminate the effects of solar geomagnetism during the observation, the solar geomagnetic Kp index during the observation period was studied. Figure 5 shows the variation in Kp index from 23–30 September 2018, which is also the period with most significant atmospheric temperature anomalies. The value of Kp index was always less than 5, which can be treated as geomagnetically quiet [34].
23–30 September is the period of significant concentration and enhancement of air temperature, with all Kp values below 3. The Kp values slightly exceed 3 only on 23–29 September. So, this area was relatively less contaminated by solar geomagnetism.
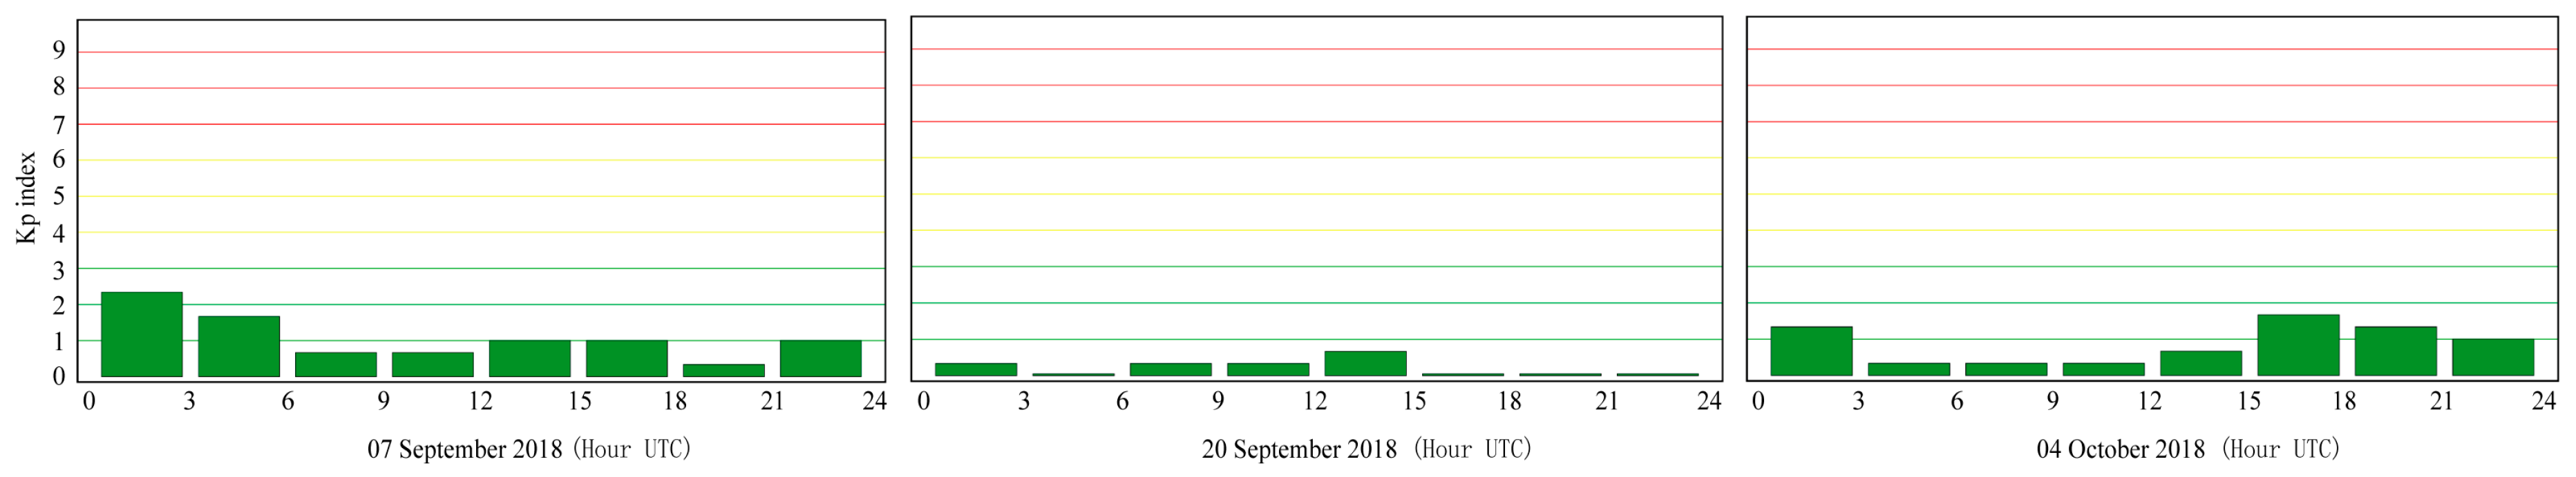
Figure 6 shows the variation in Kp index of 7 September, 20 September and 4 October 2018, which are the background dates for tidal calculation. Meanwhile, there were no earthquakes in those days, so the background dates chosen by this research were all during the non-seismic and geomagnetic quiet period. In all, the background data and the observation data of the Palu earthquake used in this paper were in a quiet period.
This study mainly applied air temperature data of NCEP combined with background information of celestial tidal forces to study the stratification of air temperature near the Palu earthquake. In Ghamry’s work [78], they jointly analyzed magnetic, MODIS, and MERRA-2 data in space and time around the epicenter before the Palu, Indonesia, earthquake. Precursory anomalies were observed using these methods, including the magnetic variation detected on 2 August 2018 at Swarm A. Due to the detection of electromagnetic anomalies on 2 August, the average temperature of MODIS on 2 August and the surface atmospheric temperature changes in NERRA-2 were studied. The results showed that both had significant warming anomalies in the southwest of the epicenter on 2 August. At the same time, the article also displayed the MODIS average temperature distribution on 26 and 27 September before the earthquake, and the results showed that there was indeed an abnormal phenomenon of significant warming in the study area, which was consistent with the air temperature anomaly near the moment of earthquake occurrence in this study. The more evident anomaly appeared on 24 September, and the maximum amplitude of the anomaly occurred on 26 September.
From the results of the study, the main area of the high-temperature anomaly on the 26 September was between 113°E–118°E, and the nearest distance from the epicenter to this anomalous area was approximately 205 km. Assuming that the zone of effective manifestation of the precursor deformations is a circle with the center in the epicenter of the preparing earthquake, the impact of a specific earthquake can be identified in this area, which is called the Earthquake Preparedness Zone (EPZ) [79]. The anomaly region of this study was inside the Dobovolsky’s area.
5. Conclusions
This paper proved that there was indeed abnormal of air temperature increase before and after the Palu earthquake in Indonesia. Some conclusions as follows:
The additional structural stress of the celestial tidal force acting on the critical seismic fault zone may be an important external factor inducing earthquakes. Although this earthquake occurred during the period when the additional structural stress of the celestial tidal force reached its peak, it did not occur every time when the tidal force reached its maximum. The earthquake occurred during the peak period, indicating that the effect of the additional structural stress of the celestial tidal force on the faults was of a pressurized type. Increasing the normal pressure and shear stress on the fault plane, the stress of the fault was enhanced and reached the strength condition of fracture sliding, and then the earthquake occurred.
According to the changes in the celestial tidal force, the Indonesian earthquake occurred during Period B of the three periods. The air temperatures during these three periods were calculated separately, and the results showed that there were occasional high air temperature anomalies in Periods A and C. However, the high air temperature anomalies only appeared in the upper atmosphere, or the warming intensity in the upper atmosphere was greater than the land surface. The warming anomaly that appeared in Period B was relatively significant, and the warming anomaly conformed to the law that the warming intensity of the land surface atmosphere was the highest. As the height increased, the warming intensity gradually weakened. As the thermal anomaly of the seismic activity caused by tectonic movement mainly came from the interiors of the faults, as the atmospheric movement rose, the spatial distribution of the air warming showed a close correlation with the local structure or underground structure. In terms of motion characteristics, it showed a process of weakening from bottom to top and disappeared at a certain height, which was significantly different from the temperature warming formed by atmospheric advection at high altitude and no significant warming in low altitude.
The air temperature warming anomaly area of the Indonesia earthquake was mainly distributed in Kalimantan Island. The initial warming anomaly appeared in the southwest of Kalimantan Island. Afterwards, the anomaly area gradually spread and migrated towards the southeast of Kalimantan Island near the epicenter of the earthquake. The significant anomaly area of latent heat flux of the 2004 Indonesian magnitude 9.0 earthquake was not appeared in the epicenter area either but in the central part of the Myanmar small plate, which was also related to local geological conditions and structural deformation [80]. It has been mentioned that the important force sources of Geodynamics may include the twisting upwelling of soft matter of heat flow in the deep earth [81], and there is a high surface heat flux in the Sunda Continental, which was caused by radioactive granite and its erosion [75] and was easier to show the temperature increase anomaly when the underground tectonic activity was intense. Therefore, the migration of the high temperature anomaly from the southwest to the southeast of the island may be the result of the combination of the celestial tide force and the soft matter surge of the heat flow in the deep earth.
Author Contributions
Conceptualization, X.L.; methodology, W.M.; software, X.L.; validation, C.Y. and J.Z.; writing—original draft preparation, X.L.; writing—review and editing, A.N. All authors have read and agreed to the published version of the manuscript.
Funding
This research was supported by the National Nature Science Youth Fund: 41704062, and the Project of Earthquake Tracking in 2023: 202301022.
Data Availability Statement
The data presented in this study are available on request from the corresponding author.
Acknowledgments
The authors thank the reviewers and editors for their positive and constructive comments.
Conflicts of Interest
The authors declare no conflict of interest.
References
- Qiang, Z.J.; Kong, L.C. Laboratory research on mechanism of satellite infrared anomaly. China Sci. Bull. 1995, 40, 1403–1404. [Google Scholar]
- Jing, F.; Shen, X.H.; Kang, C.L.; Xiong, P. Variations of multi-parameter observations in atmosphere related to earthquake. Nat. Hazards Earth Syst. Sci. 2013, 13, 27–33. [Google Scholar] [CrossRef]
- Ouzounov, D.; Freund, F. Mid-infrared emission prior to strong earthquakes analyzed by remote sensing data. Adv. Space Res. 2004, 33, 268–273. [Google Scholar] [CrossRef]
- Ouzounov, D.; Bryant, N.; Logam, T.; Pulinets, S.; Taylor, P. Satellite thermal IR phenomena associated with some of the major earthquakes in 1999–2003. Phys. Chem. Earth. 2006, 31, 154–163. [Google Scholar] [CrossRef]
- Ouzounov, D.; Liu, D.; Kang, C.L.; Cervone, G.; Kafatos, M.; Taylor, P. Outgoing long wave radiation variability from IR satellite data prior to major earthquakes. Tectonophysics 2007, 431, 211–220. [Google Scholar] [CrossRef]
- Saraf, A.K.; Choudhury, S. Thermal remote sensing technique in the study of pre-earthquake thermal anomalies. J. Ind. Geophys. Union. 2005, 9, 197–207. [Google Scholar]
- Tronin, A.; Hayakawa, M.; Molchanov, O.A. Thermal IR satellite data application for earthquake research in Japan and China. J. Geodyn. 2002, 33, 519–534. [Google Scholar] [CrossRef]
- Wu, L.X.; Qin, K.; Liu, S. GEOSS-based thermal parameters analysis for earthquake anomaly recognition. Proc. IEEE 2012, 100, 2891–2907. [Google Scholar] [CrossRef]
- Qin, K.; Wu, L.X.; Santis, A.D.; Meng, J.; Ma, W.Y.; Cianchini, G. Quasi-synchronous multi-parameter anomalies associated with the 2010–2011 New Zealand earthquake sequence. Nat. Hazards Earth Syst. Sci. 2012, 12, 1059–1072. [Google Scholar] [CrossRef]
- Liu, D.F.; Luo, Z.L.; Peng, K.Y. OLR anomalies before strong earthquakes. Earthquake 1997, 17, 126–132. [Google Scholar]
- Kang, C.L.; Zhang, Y.M.; Liu, D.F.; Jing, F. Long wave radiation signs of the Wenchuan 8.0 magnitude earthquake. Earthquake 2009, 29, 116–120. [Google Scholar]
- Xin, B. Study on the jumping phenomenon of geotemperature before earthquake. Recent Dev. World Seismol. 2008, 360, 11–18. [Google Scholar]
- Wang, L.Y.; Zhu, C.Z. Abnormal changes in ground temperature before the Tangshan and Haicheng earthquakes. Earthq. Res. 1984, 7, 649–656. [Google Scholar]
- Zhang, Z.Y. The Relationship between Shallow Ground Temperature and Strong Earthquakes. Earthquake 1994, 2, 73–80. [Google Scholar]
- Yan, W.B.; Xu, X.L. Analysis on the Characteristics of Surface Temperature Changes before and after the ”5.12” Wenchuan Earthquake. Meteorol. Res. Plateau Mt. Areas 2008, 28, 42–46. [Google Scholar]
- Chen, S.Y.; Liu, P.X.; Liu, L.Q. The phenomenon of ground temperature changes in Kangding before the Lushan earthquake. Seismogeology 2013, 35, 634–640. [Google Scholar]
- Tramutoli, V.; Cuomo, V.; Filizzola, C.; Pergola, N.; Pietrapertosa, C. Assessing the potential of thermal infrared satellite surveys for monitoring seismically active areas, The case of Kocaeli (İzmit) earthquake, August 17, 1999. Remote Sens. Environ. 2005, 96, 409–426. [Google Scholar] [CrossRef]
- Tramutoli, V.; Aliano, C.; Corrado, R.; Filizzola, C.; Genzano, N.; Lisi, M.; Martinelli, G.; Pergola, N. On the possible origin of thermal infrared radiation (TIR) anomalies in earthquake-prone areas observed using robust satellite techniques (RST). Chem. Geol. 2013, 339, 157–168. [Google Scholar] [CrossRef]
- Tramutoli, V.; Corrado, R.; Filizzola, C.; Genzano, N.; Sileo, G. A decade of RST applications to seismically active areas monitoring by TIR satellite observations. In Proceedings of the 2013 EUMETSAT Meteorological Satellite Conference & 19th American Meteorological Society (AMS) Satellite Meteorology, Oceanography, and Climatology Conference, Vienna, Austria, 16–20 September 2013; Volume 8. [Google Scholar]
- Bellaoui, M.; Hassini, A.; Kada, B. Pre-seismic Anomalies in Remotely Sensed Land Surface Temperature measurements: The Case Study of 2003 Boumerdes Earthquake. Adv. Space Res. 2017, 59, 2645–2657. [Google Scholar] [CrossRef]
- Pulinets, S.A.; Dunajecka, M.A. Specific variations of air temperature and relative humidity around the time of Michoacan earthquake M8.1 Sept. 19, 1985 as a possible indicator of interaction between tectonic plates. Tectonophysics 2007, 431, 221–230. [Google Scholar] [CrossRef]
- Kalnay, E.; Kanamitsu, M.; Kistler, R.; Collins, W.; Deaven, D.; Gandin, L.; Iredell, M.; Saha, S.; White, G.; Woollen, J.; et al. The NCEP/NCAR 40-year reanalysis project. Bull. Am. Meteor. Soc. 1996, 77, 437–471. [Google Scholar] [CrossRef]
- Kistler, R.; Kalnay, E.; Collins, W.; Saha, S.; White, G.; Woollen, J.; Chelliah, M.; Ebisuzaki, W.; Kanamitsu, M.; Kousky, V.; et al. The NCEP/NCAR 50-year reanalysis: Documentation and monthly-means CD-ROM. Bull. Am. Meteorol. Soc. 2001, 82, 247–268. [Google Scholar] [CrossRef]
- Ma, W.Y.; Zhang, X.D.; Liu, J.; Yao, Q.; Zhou, B.; Yue, C.; Kang, C.; Lu, X. Influences of multiple layers of air temperature differences on tidal forces and tectonic stress before, during and after the Jiujiang earthquake. Remote Sens. Environ. 2018, 210, 159–165. [Google Scholar]
- Zhang, Y.; Meng, Q.Y.; Wang, Z.A.; Lu, X. Temperature Variations in Multiple Air Layers before the Mw 6.2 2014 Ludian Earthquake, Yunnan, China. Remote Sens. 2021, 13, 884. [Google Scholar] [CrossRef]
- Mahmood, I. Anomalous variations of air temperature prior to earthquakes. Geocarto Int. 2019, 36, 1396–1408. [Google Scholar] [CrossRef]
- Mahmood, I.; Iqbal, M.F.; Shahzad, M.I.; Waqas, A. Investigation of earthquake thermal precursors in active tectonic regions of the world. J. Geodyn. 2020, 141–142, 101785. [Google Scholar] [CrossRef]
- Draz, M.U.; Shah, M.; Jamjareegulgarn, P.; Shahzad, R.; Hasan, A.M.; Ghamry, N.A. Deep Machine Learning Based Possible Atmospheric and Ionospheric Precursors of the 2021 Mw 7.1 Japan Earthquake. Remote Sens. 2023, 15, 1904. [Google Scholar] [CrossRef]
- Shah, M.; Shahzad, R.; Jamjareegulgarn, P.; Ghaffar, B.; Oliveira-Junior, J.F.d.; Hassan, A.M.; Ghamry, N.A. Machine-Learning-Based Lithosphere-Atmosphere-Ionosphere Coupling Associated with MW>6 Earthquakes in America. Atmosphere 2023, 14, 1236. [Google Scholar] [CrossRef]
- Pulinets, S.; Ouzounov, D. Lithosphere-Atmosphere-Ionosphere Coupling (LAIC) model-An unified concept for earthquake precursors validation. J. Asian Earth Sci. 2011, 41, 371–382. [Google Scholar] [CrossRef]
- Pulinets, S. Low-latitude atmosphere-ionosphere effects initiated by strong earthquakes preparation process. Int. J. Geophys. 2012, 131842, 1–14. [Google Scholar] [CrossRef]
- Mahmood, I.; Iqbal, M.F.; Shahzad, M.I.; Qaiser, S. Investigation of atmospheric anomalies associated with Kashmir and Awaran Earthquakes. J. Atmos. Solar Terr. Phys. 2017, 154, 75–85. [Google Scholar] [CrossRef]
- Ghosh, S.; Chowdhury, S.; Kundu, S.; Sasmal, S.; Politis, D.Z.; Potirakis, S.M.; Hayakawa, M.; Chakraborty, S.; Chakrabarti, S.K. Unusual Surface Latent Heat Flux Variations and Their Critical Dynamics Revealed before Strong Earthquakes. Entropy 2022, 24, 23. [Google Scholar] [CrossRef] [PubMed]
- Chakraborty, S.; Sasmal, S.; Basak, T.; Ghosh, S.; Palit, S.; Chakrabarti, S.K.; Ray, S. Numerical modeling of possible lower ionospheric anomalies associated with Nepal earthquake in May 2015. Adv. Space Res. 2017, 60, 1787–1796. [Google Scholar] [CrossRef]
- Chakraborty, S.; Sasmal, S.; Chakrabarti, S.K.; Bhattacharya, A. Observational signatures of unusual outgoing longwave radiation (OLR) and atmospheric gravity waves (AGW) as precursory effects of May 2015 Nepal earthquakes. J. Geodyn. 2018, 113, 43–51. [Google Scholar] [CrossRef]
- Ghosh, S.; Chakraborty, S.; Sasmal, S.; Basak, T.; Chakrabarti, S.K.; Samanta, A. Comparative study of the possible lower ionospheric anomalies in Very Low Frequency (VLF) signal during Honshu, 2011 and Nepal, 2015 earthquakes. Geomat. Nat. Hazards Risk 2019, 10, 1596–1612. [Google Scholar] [CrossRef]
- Dey, S.; Singh, R. Surface latent heat flux as an earthquake precursor. Nat. Hazards Earth Syst. Sci. 2003, 3, 749–755. [Google Scholar] [CrossRef]
- Cervone, G.; Kafatos, M.; Napoletani, D.; Singh, R.P. Wavelet maxima curves of surface latent heat flux associated with two recent Greek earthquakes. Nat. Hazards Earth Syst. Sci. 2004, 4, 359–374. [Google Scholar] [CrossRef]
- Harrison, R.G.; Aplin, K.L.; Rycroft, M.J. Atmospheric Electricity Coupling between Earthquake Regions and the Ionosphere. J. Atmos. Sol. Terr. Phy. 2010, 72, 376–381. [Google Scholar] [CrossRef]
- Song, R.; Hattori, K.; Zhang, X.M.; Sanaka, S. Seismic-ionospheric effects prior to four earthquakes in Indonesia detected by the China seismo-electromagnetic satellite. J. Atmos. Sol. Terr. Phys. 2020, 205, 105291. [Google Scholar] [CrossRef]
- Pulinets, S.A. Strong earthquake prediction possibility with the help of topside sounding from satellites. Adv. Space Res. 1998, 21, 455–458. [Google Scholar] [CrossRef]
- Singh, O.P.; Chauhan, V.; Singh, V.; Singh, B. Anomalous variation in total electron content (TEC) associated with earthquakes in India during September 2006-November 2007. Phys. Chem. Earth 2009, 34, 479–484. [Google Scholar] [CrossRef]
- Liu, J.Y.; Chen, Y.I.; Chuo, Y.J.; Chen, C.S. A statistical investigation of pre earthquake ionospheric anomaly. J. Geophys. Res. Space Phys. 2006, 111, A05304. [Google Scholar]
- Liu, J.Y.; Chen, Y.I.; Chen, C.H.; Hattori, K. Temporal and spatial precursors in the ionospheric global positioning system (GPS) total electron content observed before the 26 December 2004 M9. 3 Sumatra-Andaman Earthquake. J. Geophys. Res. Space Phys. 2010, 115, A09312. [Google Scholar] [CrossRef]
- Liu, J.; Huang, J.P.; Zhang, X.M. Ionospheric perturbations in plasma parameters before global strong earthquakes. Adv. Space Res. 2014, 53, 776–787. [Google Scholar] [CrossRef]
- Munawar, S.; Jin, S. Statistical characteristics of seismo-ionospheric GPS TEC disturbances prior to global Mw≥5.0 earthquakes (1998–2014). J. Geodyn. 2015, 92, 42–49. [Google Scholar]
- Zhang, X.; Shen, X.; Liu, J.; Ouyang, X.; Qian, J.; Zhao, S. Analysis of ionospheric plasma perturbations before Wenchuan earthquake. Nat. Hazards Earth Syst. Sci. 2009, 9, 1259–1266. [Google Scholar] [CrossRef]
- Jung, T.K.; Liu, J.Y.; Tsai, H.F.; Huang, B.S.; Lin, C.H.; Yu, S.B.; Yeh, Y.S. Ionospheric disturbances triggered by the Mw7.6 earthquake off the coast of El Salvador on 13 January 2001. Terr. Atmos. Ocean Sci. 2006, 17, 345–351. [Google Scholar] [CrossRef]
- Liu, J.Y.; Sun, Y.Y.; Tsai, H.F.; Lin, C.H. Seismo-traveling ionospheric disturbances triggered by the 12 May 2008 M 8.0 Wenchuan Earthquake. Terr. Atmos. Ocean Sci. 2012, 23, 9–15. [Google Scholar] [CrossRef]
- Liu, J.Y.; Chen, C.H.; Sun, Y.Y.; Chen, C.H.; Tsai, H.F.; Yen, H.Y.; Chum, J.; Lastovicka, Q.S.; Yang, W.S.; Chen, S.W. The vertical propagation of disturbances triggered by seismic waves of the 11 March 2011 M9.0 Tohoku Earthquake over Taiwan. Geophys. Res. Lett. 2016, 43, 1759–1765. [Google Scholar] [CrossRef]
- Liu, J.Y.; Lin, C.Y.; Chen, Y.I.; Wu, T.R.; Meng, J.C.; Liu, T.C.; Tsai, Y.-L.; Chang, L.C.; Chao, C.-K.; Ouzounov, D.; et al. The source detection of 28 September 2018 Sulawesi tsunami by using ionospheric GNSS total electron content disturbance. Geosci. Lett. 2020, 7, 11. [Google Scholar] [CrossRef]
- Tsai, H.F.; Liu, J.Y.; Lin, C.H.; Chen, C.H. Tracking the epicenter and the tsunami source with GPS ionosphere observation. Earth Planet Space 2011, 63, 859–862. [Google Scholar] [CrossRef]
- Cahyadi, M.N.; Muslim, B.; Pratomo, D.G.; Anjasmara, I.M.; Arisa, D.; Rahayu, R.W.; Hariyanto, Y.S.; Jin, S.; Muafiry, N. Co-Seismic Ionospheric Disturbances Following the 2016West Sumatra and 2018 Palu Earthquakes from GPS and GLONASS Measurements. Remote Sens. 2022, 14, 401. [Google Scholar] [CrossRef]
- Kilston, S.; Knopoff, L. Lunaresolar periodicities of large earthquakes in southern California. Nature 1983, 304, 21–25. [Google Scholar] [CrossRef]
- Wang, W.; Shearer, P.M.; Vidale, J.E.; Xu, X.; Trugman, D.T.; Fialko, Y. Tidal modulation of seismicity at the Coso geothermal field. Earth Planet. Sci. Lett. 2022, 579, 117335. [Google Scholar] [CrossRef]
- Huda, I.N.; Lambert, S.; Souchay, J. Tidal triggering of seismicity in the region of Palu, Central Sulawesi, Indonesia. Geod. Geodyn. 2023, 14, 377–384. [Google Scholar] [CrossRef]
- Lammlein, D.R.; Latham, G.V.; Dorman, J.; Nakamura, Y.; Ewing, M. Lunar seismicity, structure and tectonics. Rev. Geophy. 1974, 12, 1–21. [Google Scholar] [CrossRef]
- Heaton, T.H. Tidal Triggering of Earthquakes. Geophys. J. R. Astron. Soc. 1975, 43, 307–326. [Google Scholar] [CrossRef]
- Tanaka, S.; Ohtake, M.; Sato, H. Spatio-temporal variation of the tidal triggering effect on earthquake occurrence associated with the 1982 South Tonga earthquake of Mw 7.5. Geophys. Res. Lett. 2002, 29, 1756. [Google Scholar] [CrossRef]
- Allen, M.W. The lunar triggering of earthquakes in Southern California. Bull. Seism. Soc. Am. 1936, 26, 147–157. [Google Scholar] [CrossRef]
- Tamrazyan, G.P. Principal regularities in the distribution of major earthquakes relative to solar and lunar tides and other cosmic sources. Icerus 1968, 9, 574–592. [Google Scholar] [CrossRef]
- Ma, W.Y.; Zhang, X.C.; Dai, X.F.; Xie, F. A preliminary study on the use of NCEP temperature images and additive tectonic stress from Astro-Tidal-Triggering to forecast short-impending earthquakes. Earthq. Res. China 2007, 21, 85–93. [Google Scholar]
- Li, Q.; Tan, K.; Zhao, B. The 2018 Palu Mw7.5 earthquake in Indonesia-a super shear rupture event. Chin. J. Geophys. 2019, 62, 3017–3023. [Google Scholar]
- Qian, W.C.; Ye, K.Y. Elastic Mechanics; Science Press: Beijing, China, 1980; pp. 63–350. [Google Scholar]
- Su, B.; Li, H.; Ma, W.Y.; Zhao, J.; Yao, Q.; Cui, J.; Chong, Y.; Chunli, K. The Outgoing Longwave Radiation Analysis of Medium and Strong Earthquakes. IEEE J. Sel. Top. Appl. Earth Obs. Remote Rensing 2021, 14, 6962–6973. [Google Scholar] [CrossRef]
- Zhang, X.; Kang, C.; Ma, W.; Ren, J.; Wang, Y. Study on thermal anomalies of earthquake process by using tidal-force and outgoing-longwave-radiation. Therm. Sci. 2017, 22, 767–776. [Google Scholar]
- Zhou, B.; Liu, X.J.; Ma, W.Y. The analysis of celestial tectonicsgenerating force’s inducing effect to the M7.3 Japan earthquake on 9th, March 2011. Procedia Environ. Sci. 2011, 10, 2005–2009. [Google Scholar]
- Ma, W.Y.; Wang, H.; Li, F.S.; Ma, W.M. Relation between the celestial tide-generating stress and the temperature variations of the Abruzzo M6.3 earthquake in April 2009. Nat. Hazards Earth Syst. Sci. 2012, 12, 819–827. [Google Scholar] [CrossRef]
- Blackett, M.; Wooster, M.J.; Malamud, B.D. Exploring land surface temperature earthquake precursors: A focus on the Gujarat (India) earthquake of 2001. Geophys. Res. Lett. 2011, 38, L15303. [Google Scholar] [CrossRef]
- Shen, Z.K.; Sun, J.B.; Zhang, P.Z.; Wan, Y.G.; Wang, M.; Burgmann, R.; Zeng, Y.; Gan, W.; Liao, H.; Wang, Q. Slip maxima at fault junctions and rupturing of barriers during the 2008 Wenchuan earthquake. Nat. Geosci. 2009, 2, 718–724. [Google Scholar] [CrossRef]
- Yin, X.C.; Zhang, L.P.; Zhang, H.H.; Yin, C.; Wang, Y.C.; Zhang, Y.X.; Peng, K.; Wang, H.; Song, Z.; Yu, H.; et al. LURR’s Twenty Years and its Perspective. Pure Appl. Geophys. 2006, 163, 2317–2341. [Google Scholar] [CrossRef]
- Wu, L.X.; Cui, C.Y.; Geng, N.G.; Wang, J.Z. Remote sensing rock mechanics (RSRM) and associated experimental studies. Int. J. Rock Mech. Min. Sci. 2000, 37, 879–888. [Google Scholar] [CrossRef]
- Ben, Y.; Sammis, C.G. Characterization of fault zones. Pure Appl. Geophys. 2003, 160, 677–715. [Google Scholar]
- Lisi, M.; Filizzola, C.; Genzano, N.; Grimaldi, C.S.L.; Lacava, T.; Marchese, F.; Mazzeo, G.; Pergola, N.; Tramutoli, V. A study on the Abruzzo 6 April 2009 earthquake by applying the RST approach to 15 years of AVHRR TIR observations. Nat. Hazards Earth Syst. Sci. 2010, 10, 395–406. [Google Scholar] [CrossRef]
- Robert, H. Geology of Indonesia; Alphascript Publishing: Brigham, UT, USA, 2010; ISBN 13: 978-613-2-55756-8. [Google Scholar]
- Fick, S.E.; Hijmans, R.J. WorldClim 2: New 1km spatial resolution climate surfaces for global land areas. Int. J. Climatol. 2017, 37, 4302–4315. [Google Scholar] [CrossRef]
- Harris, I.; Osborn, T.J.; Jones, P.D.; Lister, D.H. Version 4 of the CRU TS monthly high-resolution gridded multivariate climate dataset. Sci. Data 2020, 7, 109. [Google Scholar] [CrossRef] [PubMed]
- Ghamry, E.; Mohamed, E.K.; Abdalzaher, M.S.; Elwekeil, M.; Marchetti, D.; Santis, A.D.; Hegy, M.; Yoshikawa, A.; Fathy, A. Integrating Pre-Earthquake signatures from different precursor tools. IEEE Access 2021, 9, 33268–33283. [Google Scholar] [CrossRef]
- Dobrovolsky, I.P.; Zubkov, S.I.; Miachkin, V.I. Estimation of the size of earthquake preparation zones. Pure Appl. Geophys. 1979, 117, 1025–1044. [Google Scholar] [CrossRef]
- Chen, M.H.; Deng, Z.H.; Yang, Z.Z.; Ma, X.J. Anomaly of Latent Heat Flux before the 2004 M9 Earthquake in Indonesia. Sci. Bull. 2006, 1, 118–120. [Google Scholar]
- Li, D.X. Dynamics of Twisting Structures-Theory. In Methods and Applications; Geology Press: Beijing, China, 2003. [Google Scholar]
Figure 1.
The MW ≥ 5.0 earthquakes from 1 September to 15 October in the study area.

Figure 2.
Variations of the tidal force before and after the Indonesia Mw7.5 earthquake. A represents Period A; B represents Period B; C represents Period C.
Figure 2.
Variations of the tidal force before and after the Indonesia Mw7.5 earthquake. A represents Period A; B represents Period B; C represents Period C.

Figure 3.
Air temperature changes in the Periods of A, B, and C. (a) Period A; (b) Period B; (c) Period C.
Figure 3.
Air temperature changes in the Periods of A, B, and C. (a) Period A; (b) Period B; (c) Period C.


Figure 4.
Monthly precipitation near the Palu earthquake in Indonesia from January 1961 to December 2018.
Figure 4.
Monthly precipitation near the Palu earthquake in Indonesia from January 1961 to December 2018.

Figure 5.
Variation in solar geomagnetic Kp index from 23–30 September 2018. The value of Kp is always less than 5 during the entire observation period, which implies a quiet geomagnetic condition.
Figure 5.
Variation in solar geomagnetic Kp index from 23–30 September 2018. The value of Kp is always less than 5 during the entire observation period, which implies a quiet geomagnetic condition.

Figure 6.
Variation in solar geomagnetic Kp index of 7 September, 20 September and 4 October 2018, which are the background dates for tidal calculation.
Figure 6.
Variation in solar geomagnetic Kp index of 7 September, 20 September and 4 October 2018, which are the background dates for tidal calculation.

Disclaimer/Publisher’s Note: The statements, opinions and data contained in all publications are solely those of the individual author(s) and contributor(s) and not of MDPI and/or the editor(s). MDPI and/or the editor(s) disclaim responsibility for any injury to people or property resulting from any ideas, methods, instructions or products referred to in the content. |
© 2023 by the authors. Licensee MDPI, Basel, Switzerland. This article is an open access article distributed under the terms and conditions of the Creative Commons Attribution (CC BY) license (https://creativecommons.org/licenses/by/4.0/).
Share and Cite
MDPI and ACS Style
Lu, X.; Ma, W.; Yu, C.; Zhao, J.; Niu, A. Air Temperature Variations in Multiple Layers of the Indonesia Earthquake Based on the Tidal Forces. Remote Sens. 2023, 15, 4852. https://0-doi-org.brum.beds.ac.uk/10.3390/rs15194852
AMA Style
Lu X, Ma W, Yu C, Zhao J, Niu A. Air Temperature Variations in Multiple Layers of the Indonesia Earthquake Based on the Tidal Forces. Remote Sensing. 2023; 15(19):4852. https://0-doi-org.brum.beds.ac.uk/10.3390/rs15194852
Chicago/Turabian StyleLu, Xian, Weiyu Ma, Chen Yu, Jing Zhao, and Anfu Niu. 2023. "Air Temperature Variations in Multiple Layers of the Indonesia Earthquake Based on the Tidal Forces" Remote Sensing 15, no. 19: 4852. https://0-doi-org.brum.beds.ac.uk/10.3390/rs15194852
Note that from the first issue of 2016, this journal uses article numbers instead of page numbers. See further details here.