Article

Estimating Effects of Natural and Anthropogenic Activities on Trophic Level of Inland Water: Analysis of Poyang Lake Basin, China, with Landsat-8 Observations

1
School of Geography and Environmental Engineering, Gannan Normal University, Jiangxi Provincial Key Laboratory of Low-Carbon Solid Waste Recycling, Ganzhou 341000, China
2
School of Geography, Nanjing Normal University, Key Laboratory of Virtual Geographic Environment of Education Ministry, Nanjing 210023, China
3
Northeast Institute of Geography and Agroecology, CAS, Changchun 130102, China
4
Laboratory of Geo-Information Science and Remote Sensing, Wageningen University & Research, Droevendaalsesteeg 3, 6708 PB Wageningen, The Netherlands
5
State Key Laboratory of Hydrology-Water Resources and Hydraulic Engineering, Nanjing Hydraulic Research Institute, Nanjing 210029, China
6
Yangtze River Basin Ecological Environment Monitoring and Scientific Research Center, Yangtze River Basin Ecological Environment Supervision and Administration Bureau, Ministry of Ecological Environment, Wuhan 430010, China
7
School of Tourism and Urban & Rural Planning, Zhejiang Gongshang University, Hangzhou 310018, China
*
Author to whom correspondence should be addressed.
Submission received: 10 February 2023 / Revised: 13 March 2023 / Accepted: 15 March 2023 / Published: 16 March 2023

Abstract

:
The intensification of anthropogenic activities has led to the infiltration of enormous quantities of pollutants into rivers and lakes, resulting in significant deterioration in water quality and a more prominent occurrence of eutrophication. Poyang Lake, the largest freshwater lake in China, is facing a severe challenge related to eutrophication, which seriously threatens the delivery of the ecosystem service and the safety of drinking water. To address this challenge, Landsat-8 Operational Land Imager (OLI) data for the Poyang Lake Basin (PLB) from May 2013 to December 2020 were used. Since inland water bodies with complex optical characteristics, we developed a semi-analytical algorithm to assess the trophic state of the water based on two cruise field measurements in 2016 and 2019. Combining the semi-analytical trophic level index (TLI) with an atmospheric correction model is the most suitable model for OLI images of the PLB, this model was then applied to Landsat-8 time series observations. The trends of the trophic state of water bodies in PLB were revealed, and the annual, quarterly and monthly percentages of eutrophic water bodies were calculated. Natural and anthropogenic factors were then used to explain the changes in the trophic state of the PLB waters. The main findings are as follows: (1) From the 8-year observation results, it can be seen that the variation of trophic level of water in PLB showed obviously spatial and temporal variations, characterized by higher in the north than in the south and higher in winter than in summer. (2) Temperature promoted the growth of harmful algae and plays an essential role in affecting changes in the trophic level of the water. (3) Changes in the trophic level of water bodies in PLB were mainly affected by human activities. The results of spatial and temporal variation of the trophic level of water and the driving factors in PLB can extend our knowledge of water quality degradation and provide essential references for relevant policy-making institutions.

Graphical Abstract

1. Introduction

Climate change and human activities have led to significant challenges for global lakes. As the global climate continues to warm, lakes are experiencing a range of impacts that threaten their ecological health and functioning [1,2]. Global lake productivity is increasing, and eutrophication is a growing problem [3,4]. Lake eutrophication is a phenomenon caused by a combination of natural and human factors, which leads to the excessive growth of algae, a sharp decrease in water transparency and dissolved oxygen levels, resulting in the degradation of water quality, aquatic ecosystem, and the overall functioning of the lake [5,6]. Although eutrophication of water bodies naturally occurs [7], human activities and global warming have accelerated the process [4,8], causing a tremendous challenge to human drinking water safety, aquatic biodiversity, and aquatic ecosystems.
Traditionally, monitoring and assessment of eutrophication were based on periodic sampling and analysis of water quality parameters determining trophic status [9], namely, water temperature, Secchi disk depth (SDD), chlorophyll a (Chla) concentration, and other non-optically active water quality parameters [9,10]. Carlson [11] developed a trophic state index (TSI) to evaluate the trophic state of inland water based on measured water quality parameter data. Aizaki et al. [12] improved the TSI model using in situ measurement data from lakes in Japan and developed a modified trophic state index (TSIM). Jin and Tu [13] developed a trophic level index (TLI) to evaluate the trophic state of Chinese lakes based on the TSI model using survey data from 35 major lakes in China. The traditional method is based on measured data and laboratory analysis, making it difficult to accurately monitor the trophic levels of the lake as a whole and lacking the capability of consistent observation [14].
Remote sensing is widely used in inland aquatic remote sensing studies owing to its wide observation range, periodic observation, and data accessibility [4,7,8]. Remote sensing data have been used to monitor the changing trophic levels of shallow lakes in eastern China [8,14,15,16]. Although satellite remote sensing has made significant progress in the study of eutrophication in large lakes in recent years, most of the data used in lake eutrophication monitoring and evaluation studies are the Moderate Resolution Imaging Spectrometer (MODIS), Medium-Resolution Imaging Spectroradiometer (MERIS), Sea-Viewing Wide Field-of-View Sensor (SeaWiFS), and Ocean and Land Colour Instrument (OLCI) [8,17,18,19,20,21]. However, the coarse spatial resolution (>100 m) makes it difficult to monitor small lakes and rivers with these remote sensing data. Furthermore, it is impossible to take into account numerous parameters [22]. For instance, MODIS data have a high temporal resolution; however, the spatial resolution is hard to match the demands of inland water environment monitoring, limiting its usefulness in inland water eutrophication monitoring.
Landsat-8 is widely used in inland lake water quality monitoring and eutrophication assessment due to its excellent performance and spatial resolution [7,16,22,23,24]. Hu et al. [7] assessed the trophic state of lakes in eastern China using Landsat data and a water optical classification model and analyzed their spatiotemporal variations and driving factors. Zheng et al. [22] developed a band ratio model for estimating the diffuse attenuation coefficient (Kd (490)) of inland turbid waters and successfully obtained the spatial and temporal distribution of Kd (490) in Dongting Lake. Li et al. [24] developed an empirical model for estimating water transparency using Landsat data and successfully obtained the spatiotemporal variations of water transparency in Qiandao Lake. The low spectral resolution (>50 nm) of the Landsat-8 satellite restricts its capacity to represent spectral properties of the features of the ground and limits its efficacy in estimating the material composition and concentration of inland waters. However, several studies have demonstrated its potential to assess the trophic levels of water in specific lakes and the precision of the results [7,22,25,26].
In this study, we analyzed the drivers of changes in the trophic level of water in the Poyang Lake Basin (PLB) using Landsat-8 time-series images (2013–2020) and combining natural and anthropogenic data. The following objectives of this study are: (1) to develop a robust semi-analytical algorithm to assess the trophic levels of inland waters in PLB, (2) to characterize the spatial-temporal patterns of changes in the trophic state of waters in the PLB and to quantify the impact of natural and human activities; and (3) to propose the eutrophication control strategies for inland waters in PLB, which will be the theoretical basis for the implementation of environmental protection policies.

2. Materials and Methods

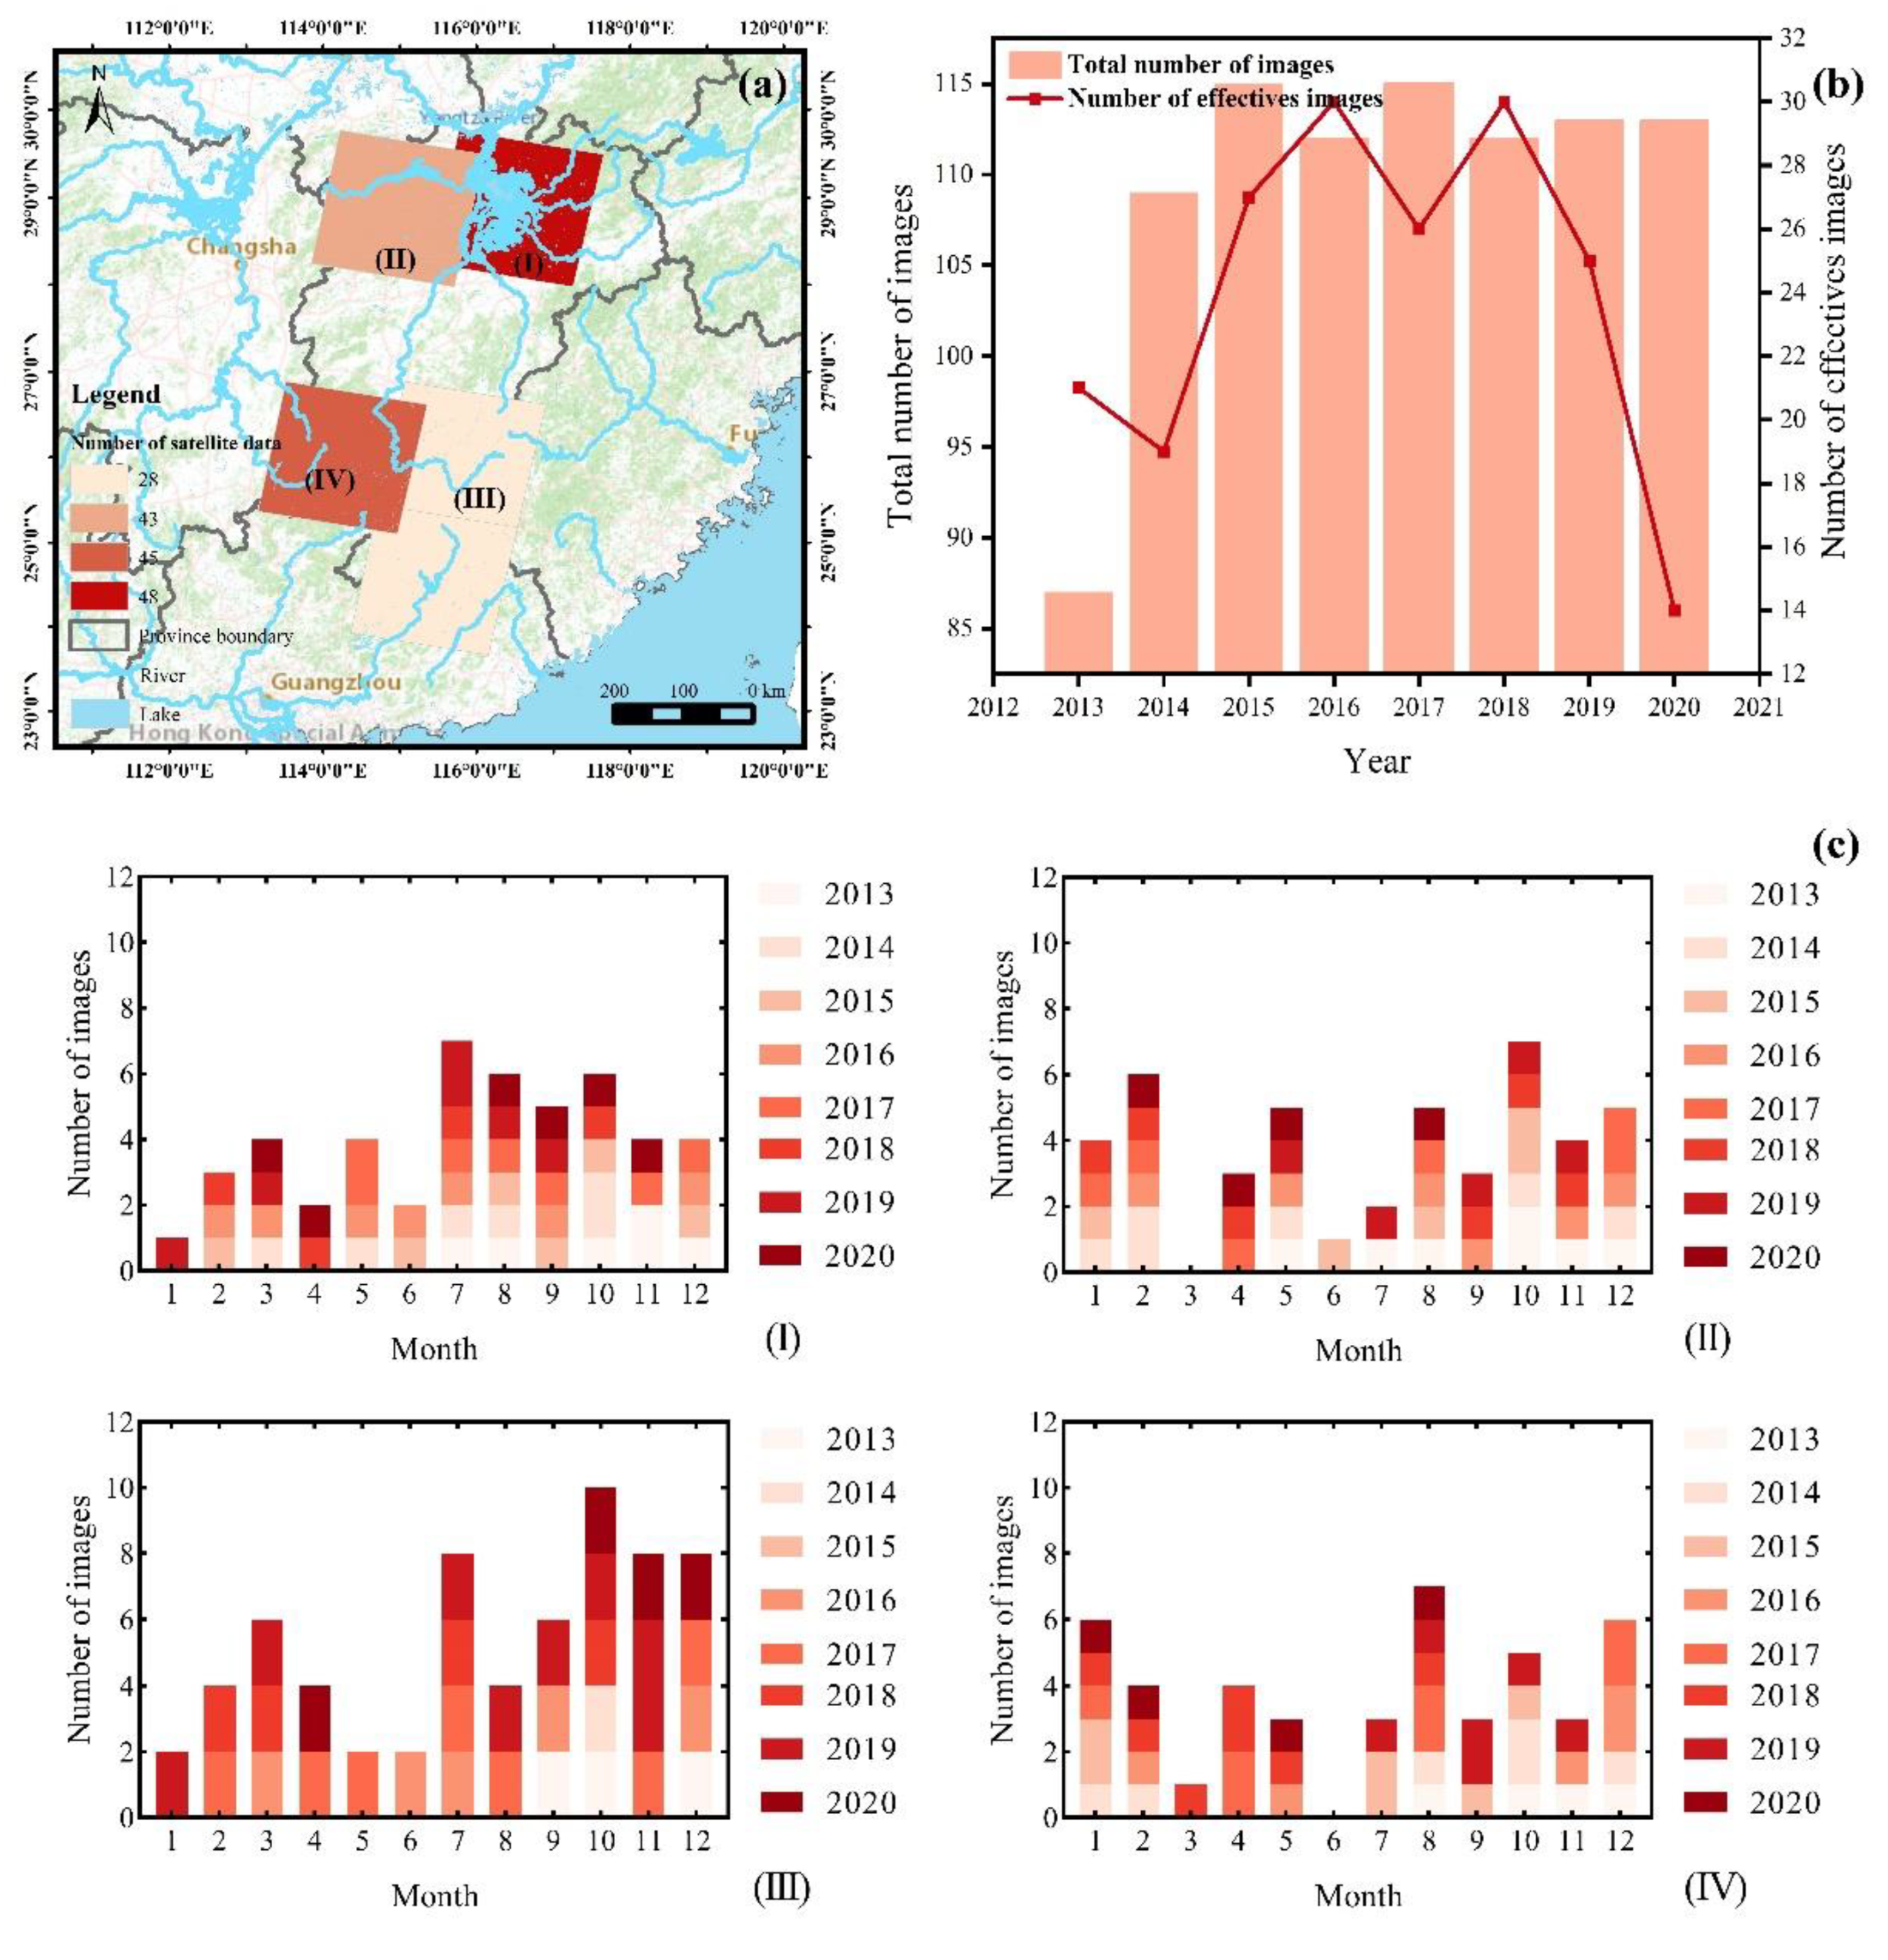
2.1. Overview of the Study Area

Poyang Lake Basin (PLB) is located in the middle and lower reaches of the Yangtze River Basin (24°29′14″–30°04′41″N, 113°34′36″–118°28′58″E, Figure 1). The basin covers 1.62 × 10⁵ km2. The PLB is a converging water system with Poyang Lake as the center of convergence. The PLB is influenced by the East Asian monsoon climate, with high temperatures and rain in summer and low temperatures and little rain in winter. Poyang Lake, the largest freshwater lake in China, covers an area of 4070 km2 during the period of abundant water. In addition, two major artificial reservoirs of drinking water sources in Jiangxi Province were selected as study areas. Zhelin Reservoir is an important drinking water source located in the Xiushui River Basin, which is one of the major sub-basins in the Poyang Lake Basin. It plays a crucial role in the regional water supply, flood control, and ecological environment. Yangming Lake provides water for irrigation to more than 40,000 hectares of farmland and supplies drinking water to over 600,000 people in Ganzhou City and the surrounding areas. Tao River is the river most polluted by rare earth mining. However, as human activities such as mining and enclosure aquaculture around the lake have increased, its water bodies have become eutrophic [27], which has threatened aquatic ecosystems, fisheries and recreational purposes, and human health [28].

2.2. Data and Processing

2.2.1. In Situ Data Collection

Two cruises were conducted on Poyang Lake from 3–14 October 2016, and 19 April 2019, and one cruise was conducted at Zhelin Reservoir on 19 April 2019 (Figure 1). Remote sensing reflectance (Rrs(λ), sr−1) data were obtained from 44 points in Poyang Lake and 10 points in Zhelin Reservoir, respectively. In addition, 54 samples were collected for laboratory analysis to obtain water quality parameters such as chlorophyll a concentration (Chla, mg m−3).
Rrs(λ) data were measured using a FieldSpec Spectroradiometer (Analytical Spectral Device, Inc., Boulder, CO, USA) with a spectral collection range of 350–1075 nm and 512 bands [28]. In addition, Rrs(λ) were measured following the existing measurement method [29].
Chla concentrations were generally measured using the hot ethanol-spectrophotometer method. The water samples were filtered through pore-size of 0.7 μm Whatman GF/F filters (Whatman, Inc., Maidstone, UK). Then Chla concentrations were determined using Shimadzu UV2550 UV-spectrophotometer (Shimadzu, Inc., Kyoto, Japan) [22]. The absorption coefficients at 750 nm and 665 nm were measured to determine the chlorophyll a concentration.

2.2.2. Landsat OLI Images and Preprocessing

Landsat-8 OLI level-1 data from May 2013 to December 2020 of the PLB were downloaded from the United States Geological Survey (USGS: https://glovis.usgs.gov/, accessed on 10 June 2022) (Figure 2). The data need to be processed into a remote sensing reflectance product as they are pre-processed level-1 data. The pre-processing steps performed on data include radiometric calibration, atmospheric correction (AC), and extraction of water in the study area.
To understand the effect of different atmospheric correction modules on the trophic level assessment model, Fast Line-of-sight Atmospheric Analysis of Spectral Hypercubes (FLAASH), Second Simulation of the Satellite Signal in the Solar Spectrum correction scheme (6S), Dark of subtraction (DOS) and Quick Atmospheric Correction (QUAC) modules were used for OLI data. FLAASH is extensively employed in multispectral and hyperspectral data [30]. 6S takes full account of the topography and sensor altitude to derive atmospheric correction parameters for simulating airborne and satellite observations [31]. DOS assumes the existence of a dark pixel region and the reflectance values of all bands excluding this dark pixel region [32]. QUAC is a method for rapid atmospheric correction of images in the Environment for Visualizing Images (ENVI) [33].

2.2.3. Meteorological, Anthropogenic, and Land Use Data

To analyze the effects of meteorological factors on the variation of trophic levels in waters, temperature, precipitation, and wind speed were used. Meteorological data were obtained from the China Meteorological Administration (http://data.cma.cn/site/index.html/, accessed on 20 June 2022) [34]. The meteorological stations corresponding to Poyang Lake are Poyang and Nanchang, in Zhelin reservoir is Wuning, in Tao River and Yangming Lake are Ganxian and Longnan, respectively.
Human activities have a significant impact on changes in the trophic state of water. To determine the anthropogenic activities on the changes of trophic levels of waters, the total population, gross domestic product (GDP, Chinese Yuan), GDP of primary industry (GDP1), GDP of secondary industry (GDP2), GDP of tertiary industry (GDP3), chemical fertilizer usage (ton), agrochemicals usage (ton), effective irrigation area (km2), crop planting area (km2), agriculture, forestry, fisheries and livestock GDP data of the PLB were analyzed from the statistical yearbooks of Nanchang City, Jiujiang City, Shangrao City, and Ganzhou City.
Land use influences the direction and intensity of surface runoff via the alteration of surface topography. Land use and land cover (LULC) data from 2013 to 2020 were interpreted using Landsat-8 data and support vector machine (SVM) classification. The LULC in the PLB was divided into five following categories: bare land, forest and grassland, water, built-up land, and cropland. Training and validation samples were selected using Google Earth high-resolution images.

2.3. Motivation of Evaluation Factor for Eutrophication

The comprehensive trophic level index (TLI) is the most extensively utilized among most evaluation processes. Jin and Tu (1990) developed a trophic level index (TLI) to evaluate the trophic state of Chinese lakes based on the TSI model using survey data from 35 major lakes in China.
TLI (Chla) = 25 + 10.86ln (Chla),
TLI (TP) = 94.36 + 16.24ln (TP),
TLI (TN) = 54.53 + 16.94ln (TN),
TLI (SD) = 51.18 − 19.4ln (SD).
Jin et al. [35] assessed the correlations between Chla and TN, TP, and other evaluation parameters. However, due to the large difference in the status of the aquatic environment between lakes and seasons within the same lake, the association between Chla and metrics such as TN, TP, and so on varies to some amount. As a result, if multiple indicators were used to evaluate trophic levels of water, the TLI model should be rectified for different regions and seasons. This challenge limits the application of the trophic level evaluation models, and long-term remote sensing monitoring of the trophic levels of waters is impossible. Chlorophyll a concentration is often described as a scale to evaluate primary productivity and trophic levels in water bodies. In addition, in Case-2 water bodies, the optical properties of Chla are relatively stable and the remote sensing inversion model for Chla concentration is also more mature [36]. There were numerous types of models for the inversion of Chla concentration, such as empirical models, fluorescence line height, semi-analytical models, and bio-optical models [36,37,38,39,40,41,42,43,44]. Thus, chlorophyll a concentration was chosen as the indicator for the evaluation of the trophic level of water bodies.

2.4. Landsat-Based TLI Calibration

The PLB eutrophication assessment model was developed and effectively implemented to Landsat-8 OLI data, and then long-term remotely sensed monitoring of the trophic level of water was performed. However, since the TLI model was evaluated based on Chla concentration, it is essential to determine the band combinations with the correlation of Chla concentration. Based on previous studies’ results, 172 multi-band combination models were constructed for Chla concentration. Table 1 shows the correlation coefficients of the 10 most correlated multi-band combinations with Chla concentration.
The central wavelengths of the Band 1, Band 3, and Band 5 of Landsat-8 data were 443 nm, 562 nm, and 865 nm, respectively, which correspond to an absorption canyon (at 420 nm) and two reflection peaks (590 nm and 830 nm) in the Chla spectral curve, respectively. As a result, the ratio of Band 1 (B1) in the absorption canyon and the sum of Band 3 and Band 5 (B3 + B5) in the reflection peak was used as a factor to estimate the level of eutrophication in PLB.
TLI (Rrs) = −85.61 × M + 75.51, M = B1/(B3 + B5).
where B1 is the blue band remotely sensed reflectance, B3 is the green band remotely sensed reflectance, and B5 is the near-infrared (NIR) band remotely sensed reflectance of Landsat-8 data.
The remote sensing evaluation model of eutrophication of water bodies in PLB based on Landsat-8 data was constructed (Figure 3). In addition, based on the TLI evaluation criteria, we classified the TLI (Rrs) into five levels: oligotrophic (TLI (Rrs) < 30), mesotrophic (30 ≤ TLI (Rrs) ≤ 50), mildly eutrophic (50 < TLI (Rrs) ≤ 60), moderately eutrophic (60 < TLI (Rrs) ≤ 70), severe eutrophic (TLI (Rrs) > 70) [7,11,18].

2.5. Assessments of the TLI Patterns and Driving Variables

The TLI model in Equation (5) was implemented to Landsat-8 OLI surface reflectance data of the PLB to obtain TLI values for lakes, reservoirs, and rivers. The seasonal, annual, and 8-year mean TLI values (i.e., 8-year TLI climatology) from 2013 to 2020 were estimated for each of the study regions in the PLB. To determine the rate of change in water trophic level across the research period, linear regressions were performed on the 8-year annual values.
Meteorological factors have an important influence on changes in the trophic state of water bodies [3,45,46]. Spearman’s correlation coefficient values between meteorological factors and the percentage of eutrophic water bodies were calculated using SPSS software. Meteorological factors with significant correlation (p < 0.05) were identified for analysis.
The implications of socioeconomic growth on water quality have become a major global issue [47]. However, previous research may have neglected the major influence of socioeconomic variables on water quality changes and intensification of eutrophication [48]. Thus, this study refers to the previous studies [24,49], the processes of socioeconomic variables on water quality were chosen for analysis.
In this study, grey relation analysis (GRA) was used to correlate the proportion of eutrophic water bodies with socioeconomic factors and the percentage of each land use factor, and the factors with the highest reliability were selected for driving force analysis. Deng [50] proposed gray correlation analysis in 1982 as a multi-factor analysis method to reflect the similarity and dissimilarity of development trends among factors. A correlation greater than 0.7, according to the gray correlation analysis method, indicates that the two indicators have a significant correlation [51,52]. The weights of drive factors were analyzed using the entropy weight method (EWM). In water quality evaluation [53,54], ecological and environmental benefit assessment [55], and other studies, the entropy weighting method has been widely used.

2.6. Statistical Analysis and Accuracy Assessment

Mean absolute deviation (MAD), root mean square deviation (RMSD), and mean absolute percent deviation (MAPD) were the main parameters we used to evaluate model accuracy [56]. The MAD, RMSD, and MAPD were calculated as follows:
M A D = 1 N i = 1 N | T L I m e a s u r e d T L I p r e d i c t e d |
R M S D = i = 1 N ( T L I m e a s u r e d T L I p r e d i c t e d ) 2 N
M A P D = 1 N i = 1 N | T L I m e a s u r e d T L I p r e d i c t e d T L I p r e d i c t e d | × 100 %
where, TLI measured is the measured value, TLI predicted is the predicted value, and N is the sample size.

3. Results

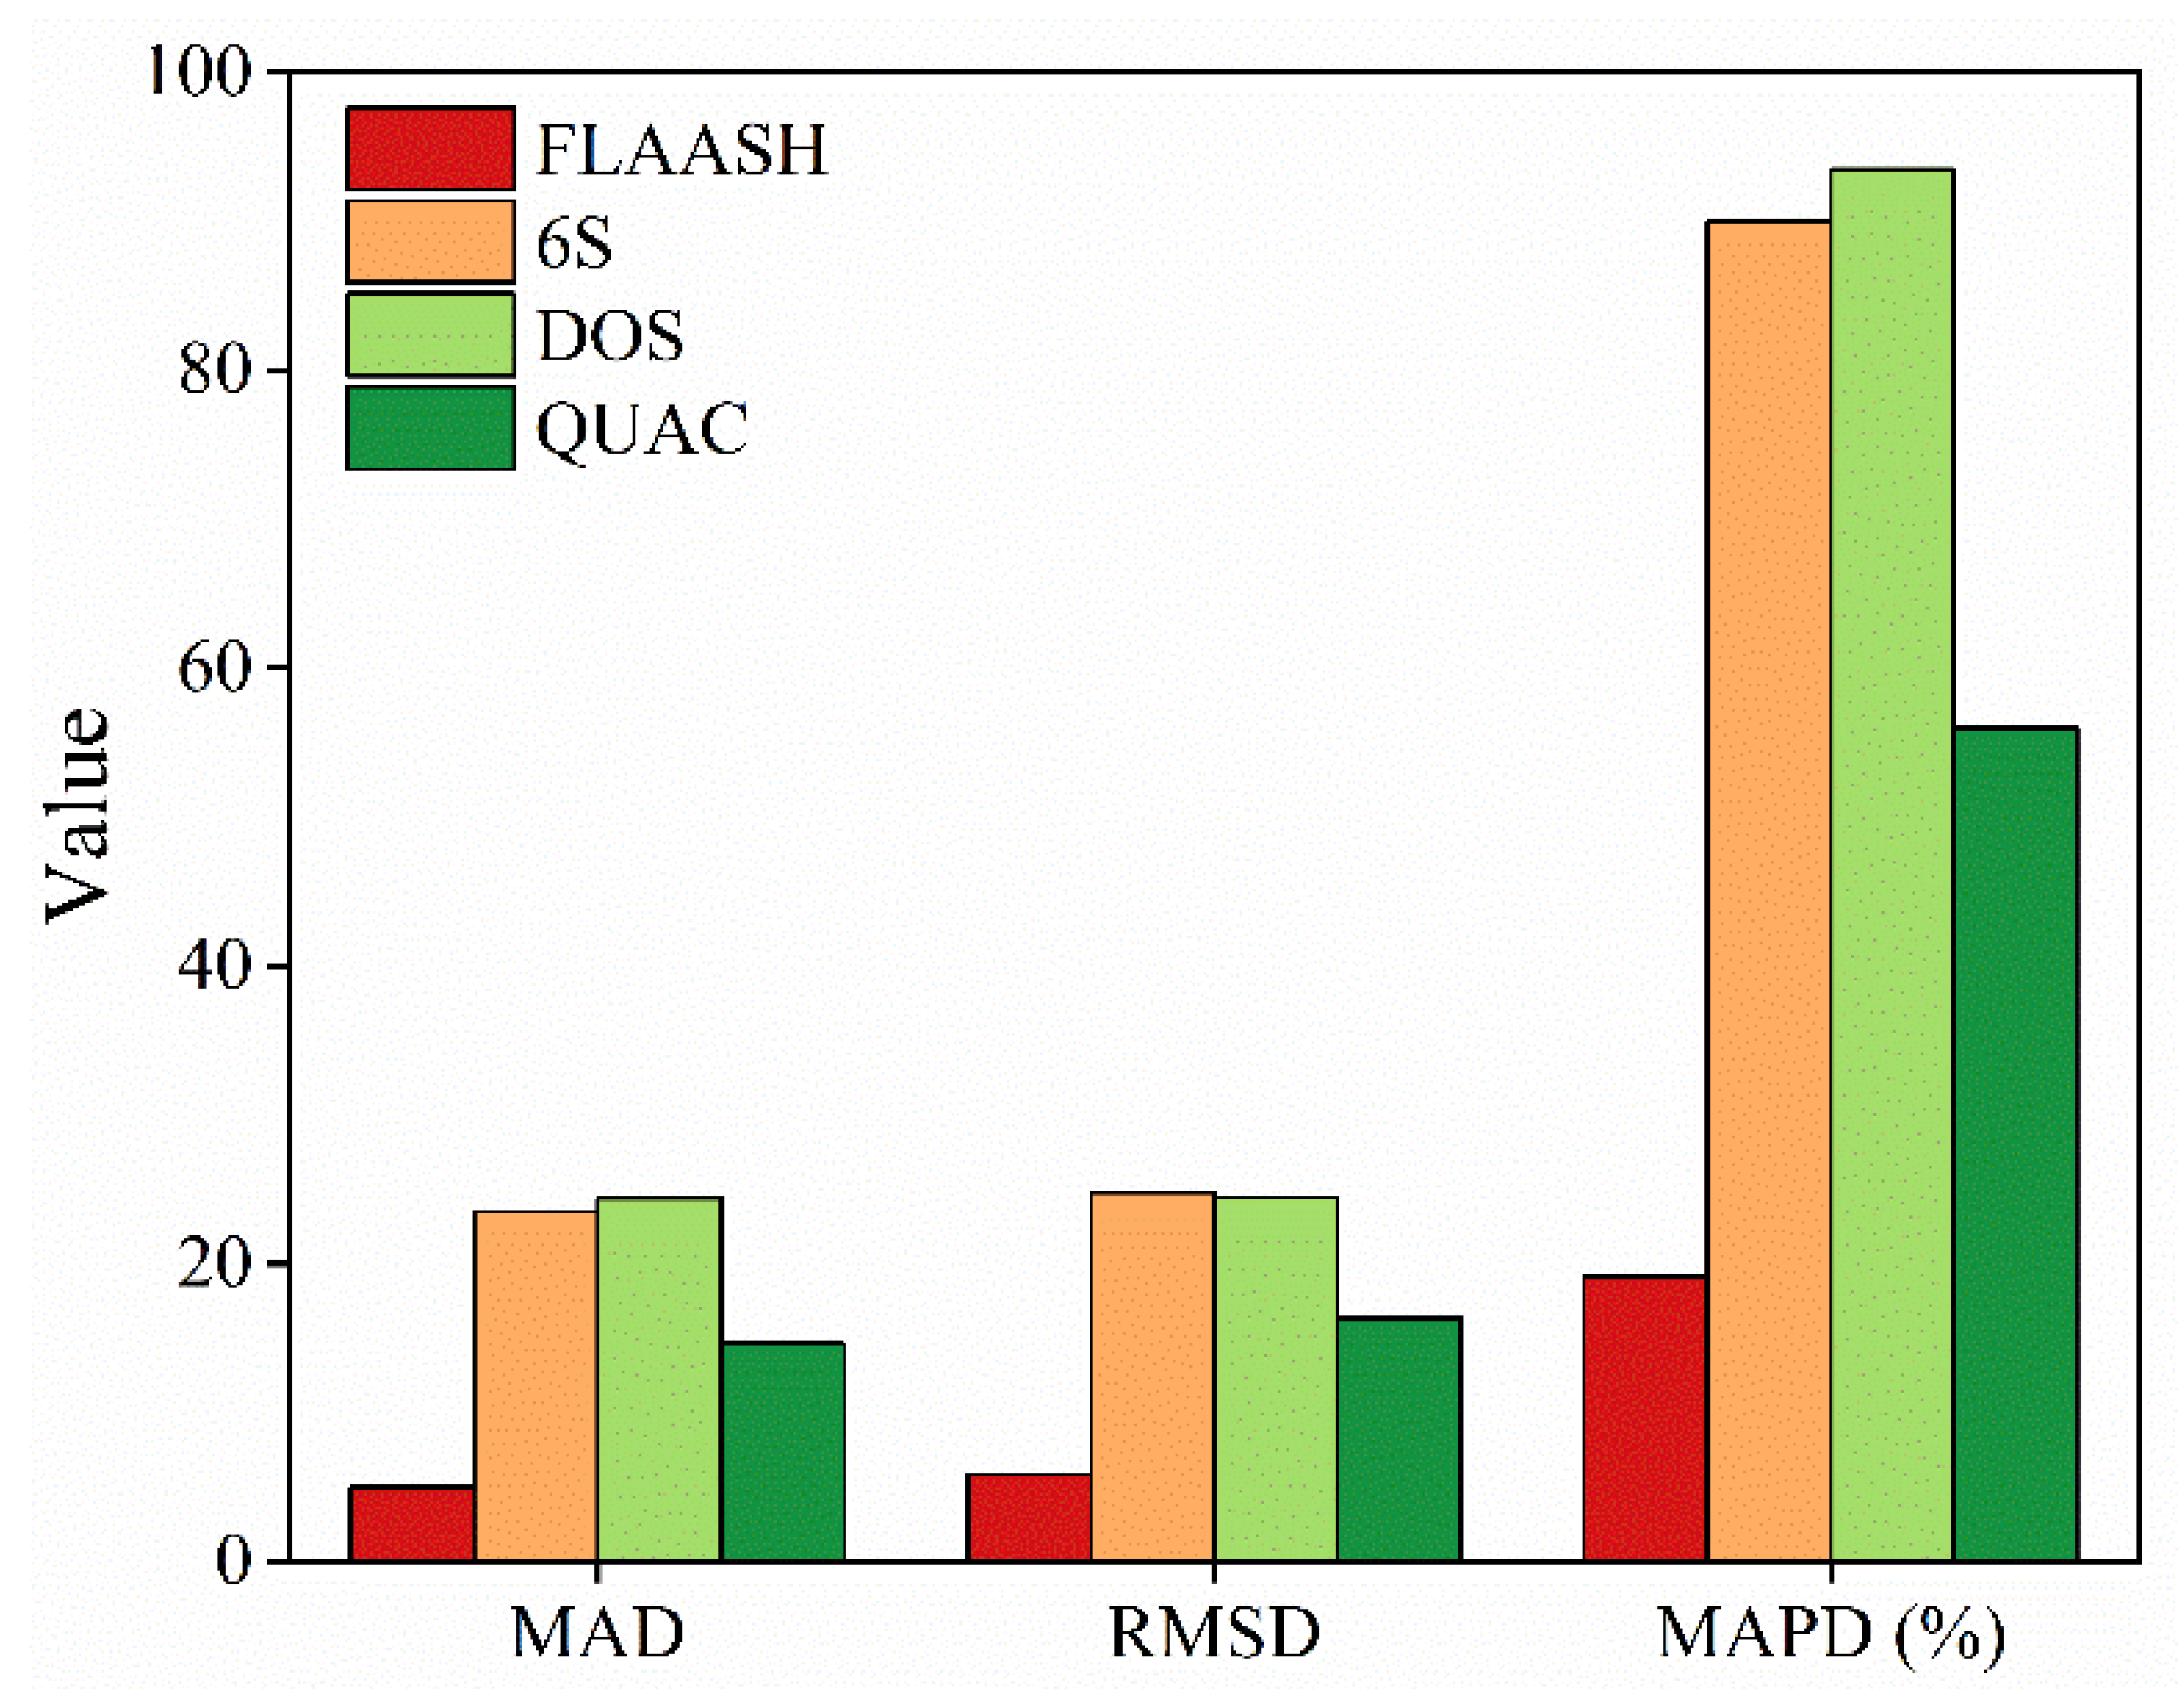
3.1. Evaluation of the Applicability of Atmospheric Correction Algorithms to the Model of Trophic Level of Inland Waters

What impact may various atmospheric correction models have on inversion results? Four AC models (i.e., FLAASH, 6S, DOS, and QUAC) were used in this study to process Landsat-8 images and assess the effects of different AC methods on inversion results. Due to the presence of persistent clouds in the satellite data of Poyang Lake in October 2016 and April 2019, the image reflectance data of the actual measurement points could not be obtained. Whereas the Landsat-8 data with the nearest sampling time and better image quality were collected within 7 days after the field data. Thus, the impact of different atmospheric correction methods on the model could not be accessed directly. However, previous researchers in the long time series water quality monitoring identified that water quality in a specified duration would be to maintain a steady condition with regularity [16,57,58,59,60].
Pearson correlation coefficients were used to calculate the correlation coefficients between remote sensing reflectance and TLI (Chla) for each band of Landsat-8 data on 19 April 2019, via various atmospheric correction algorithms (Figure 4) [61]. The effect of different AC algorithms varies for different bands, with some performing better in red band and others displaying accessibility in the short-wave Infrared (SWIR) band. Overall, the four AC algorithms showed better TLI (Chla) retrieval at the green and the red bands than at the blue and SWIR bands. The results indicated that all AC algorithms in the SWIR regions performed relatively poorly (r < 0.3).
Among the four atmospheric correction modules, FLAASH atmospheric correction modules presented the best performance (MAD = 4.99, RMSD = 5.82, MAPD = 19.13%) (Figure 5). The remotely sensed reflectance of each band of OLI retrieved using the DOS atmospheric correction algorithm has the best correlation with TLI (Chla). However, it showed exceptionally worse performance compared to the other AC processors (MAD = 24.36, RMSD = 24.44, MAPD = 93.48%), which might result in poor aerosol models in the NIR band. In summary, the FLAASH atmospheric correction module succeeded the evaluation of the trophic levels of water bodies in the Poyang Lake Basin. As a result, the FLAASH atmospheric correction module was used to process all Landsat-8 data.

3.2. Validation of Algorithm in Landsat-Based TLI Calibration

A total of 54 sample points were measured in October 2016 and April 2019, of which 2/3 were used to calibrate the TLI model, and the remaining 1/3 were employed to validate the performance of the model. TLI (Rrs) calculated from observed chlorophyll a concentrations was used as the measured value, while the TLI (Rrs) calculated from the remote sensing reflectance (i.e., Equation (5)) was used as the predicted value, and the correlation between the two was evaluated (Figure 6). The results were shown with a MAD of 3.88, RMSD of 4.43, and MAPD of 8.88%.

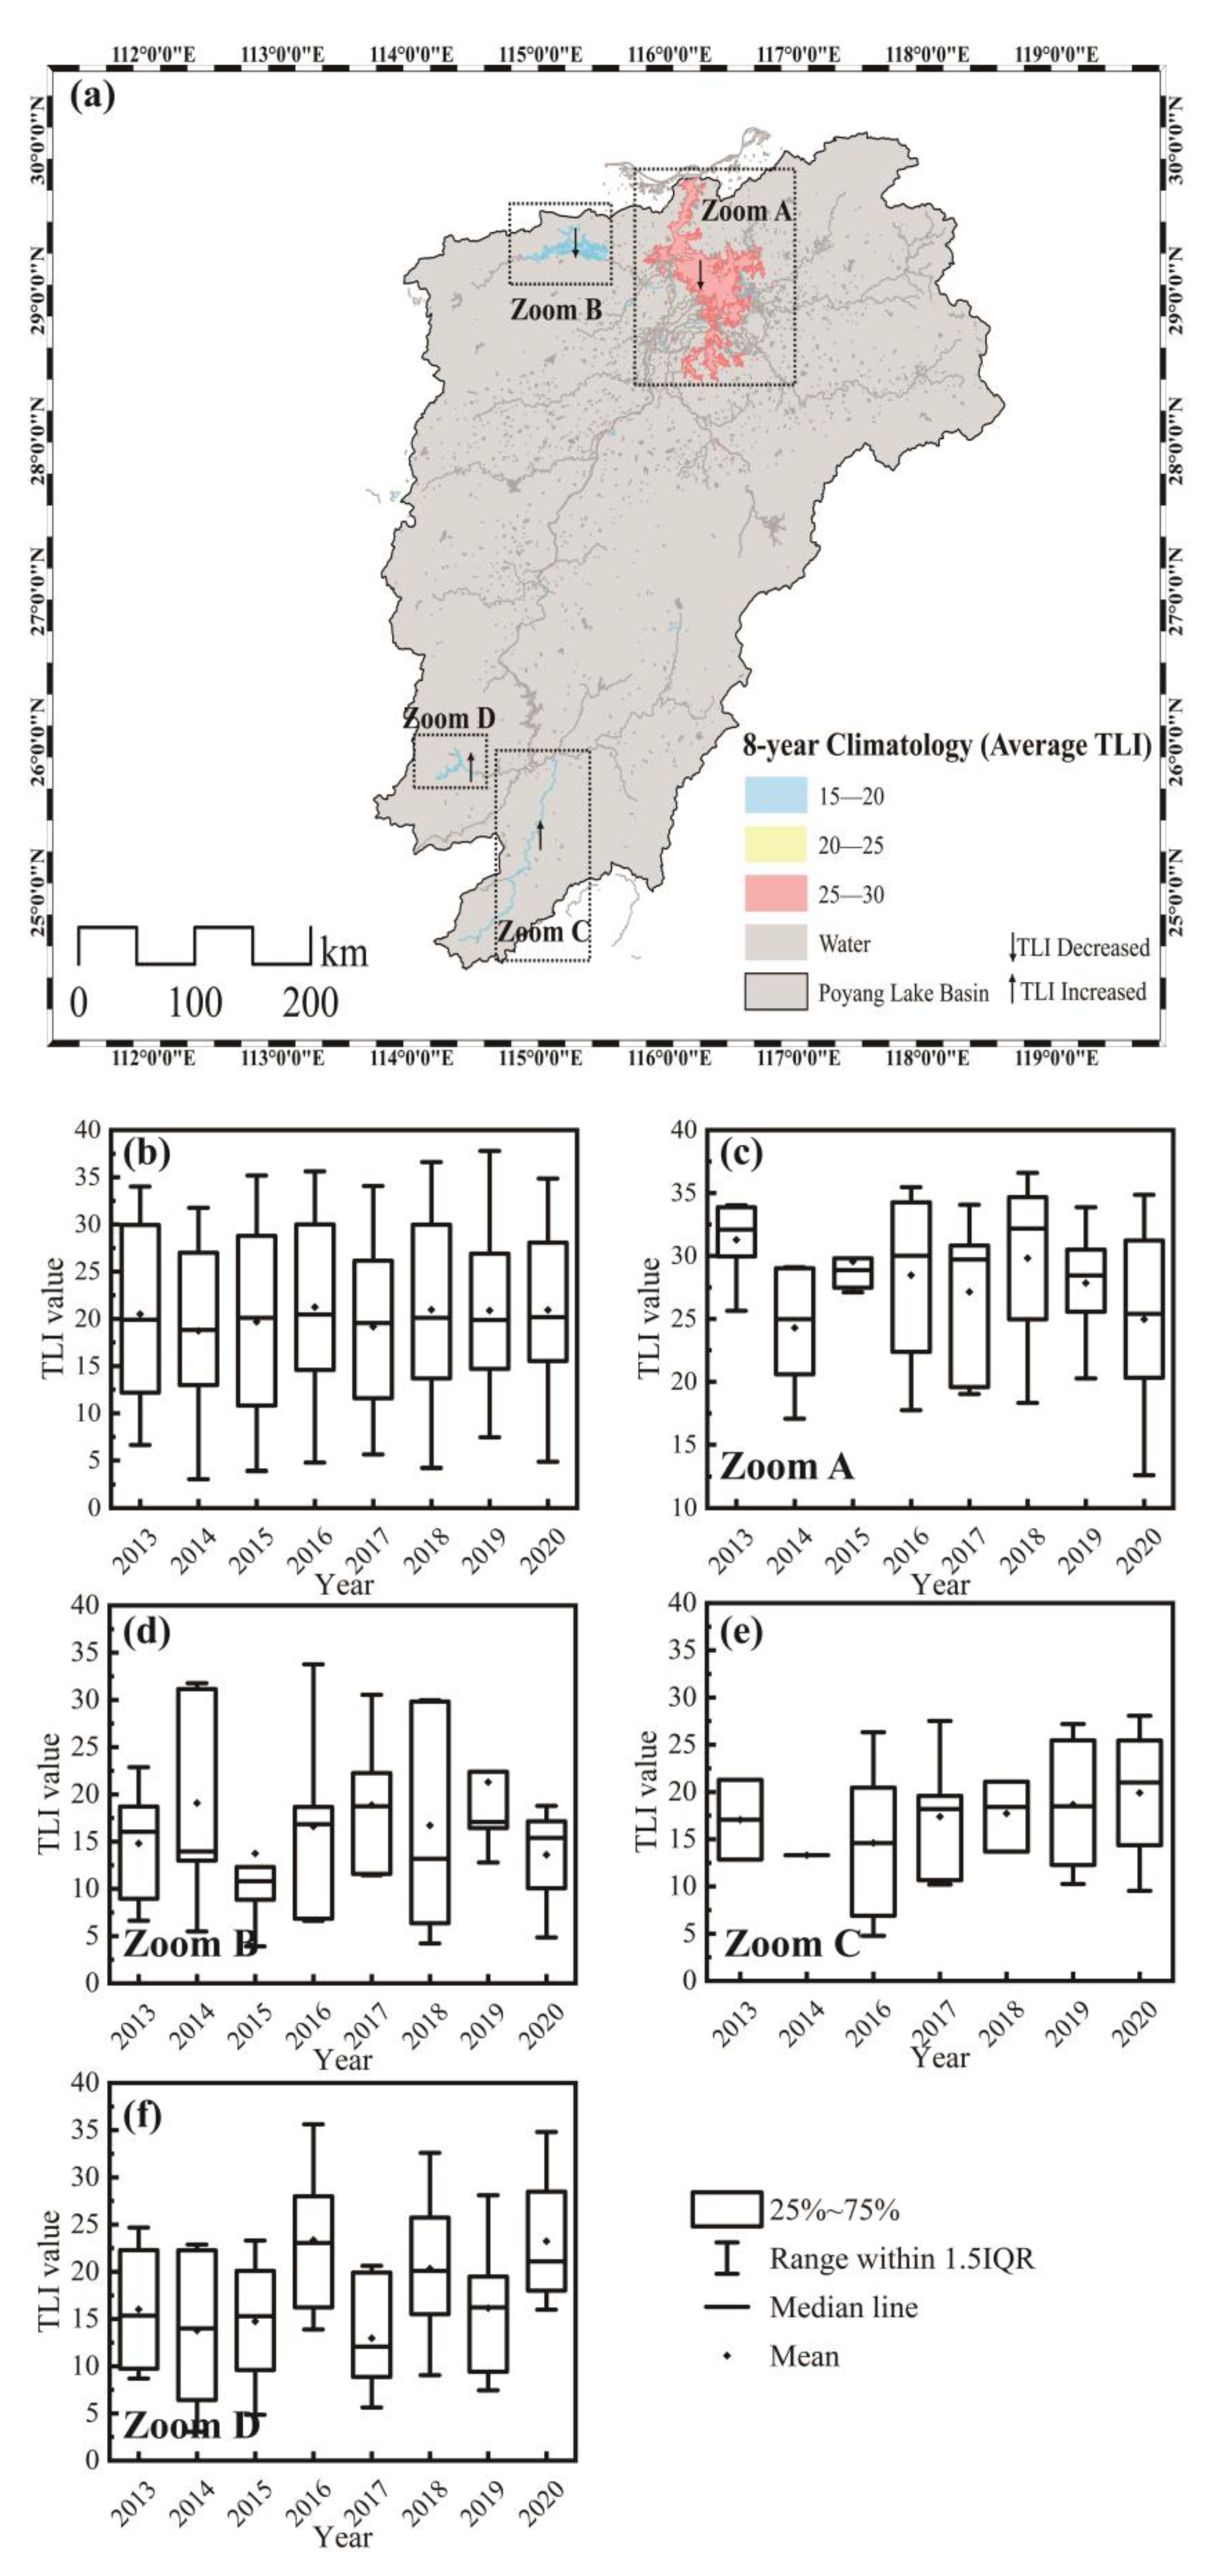
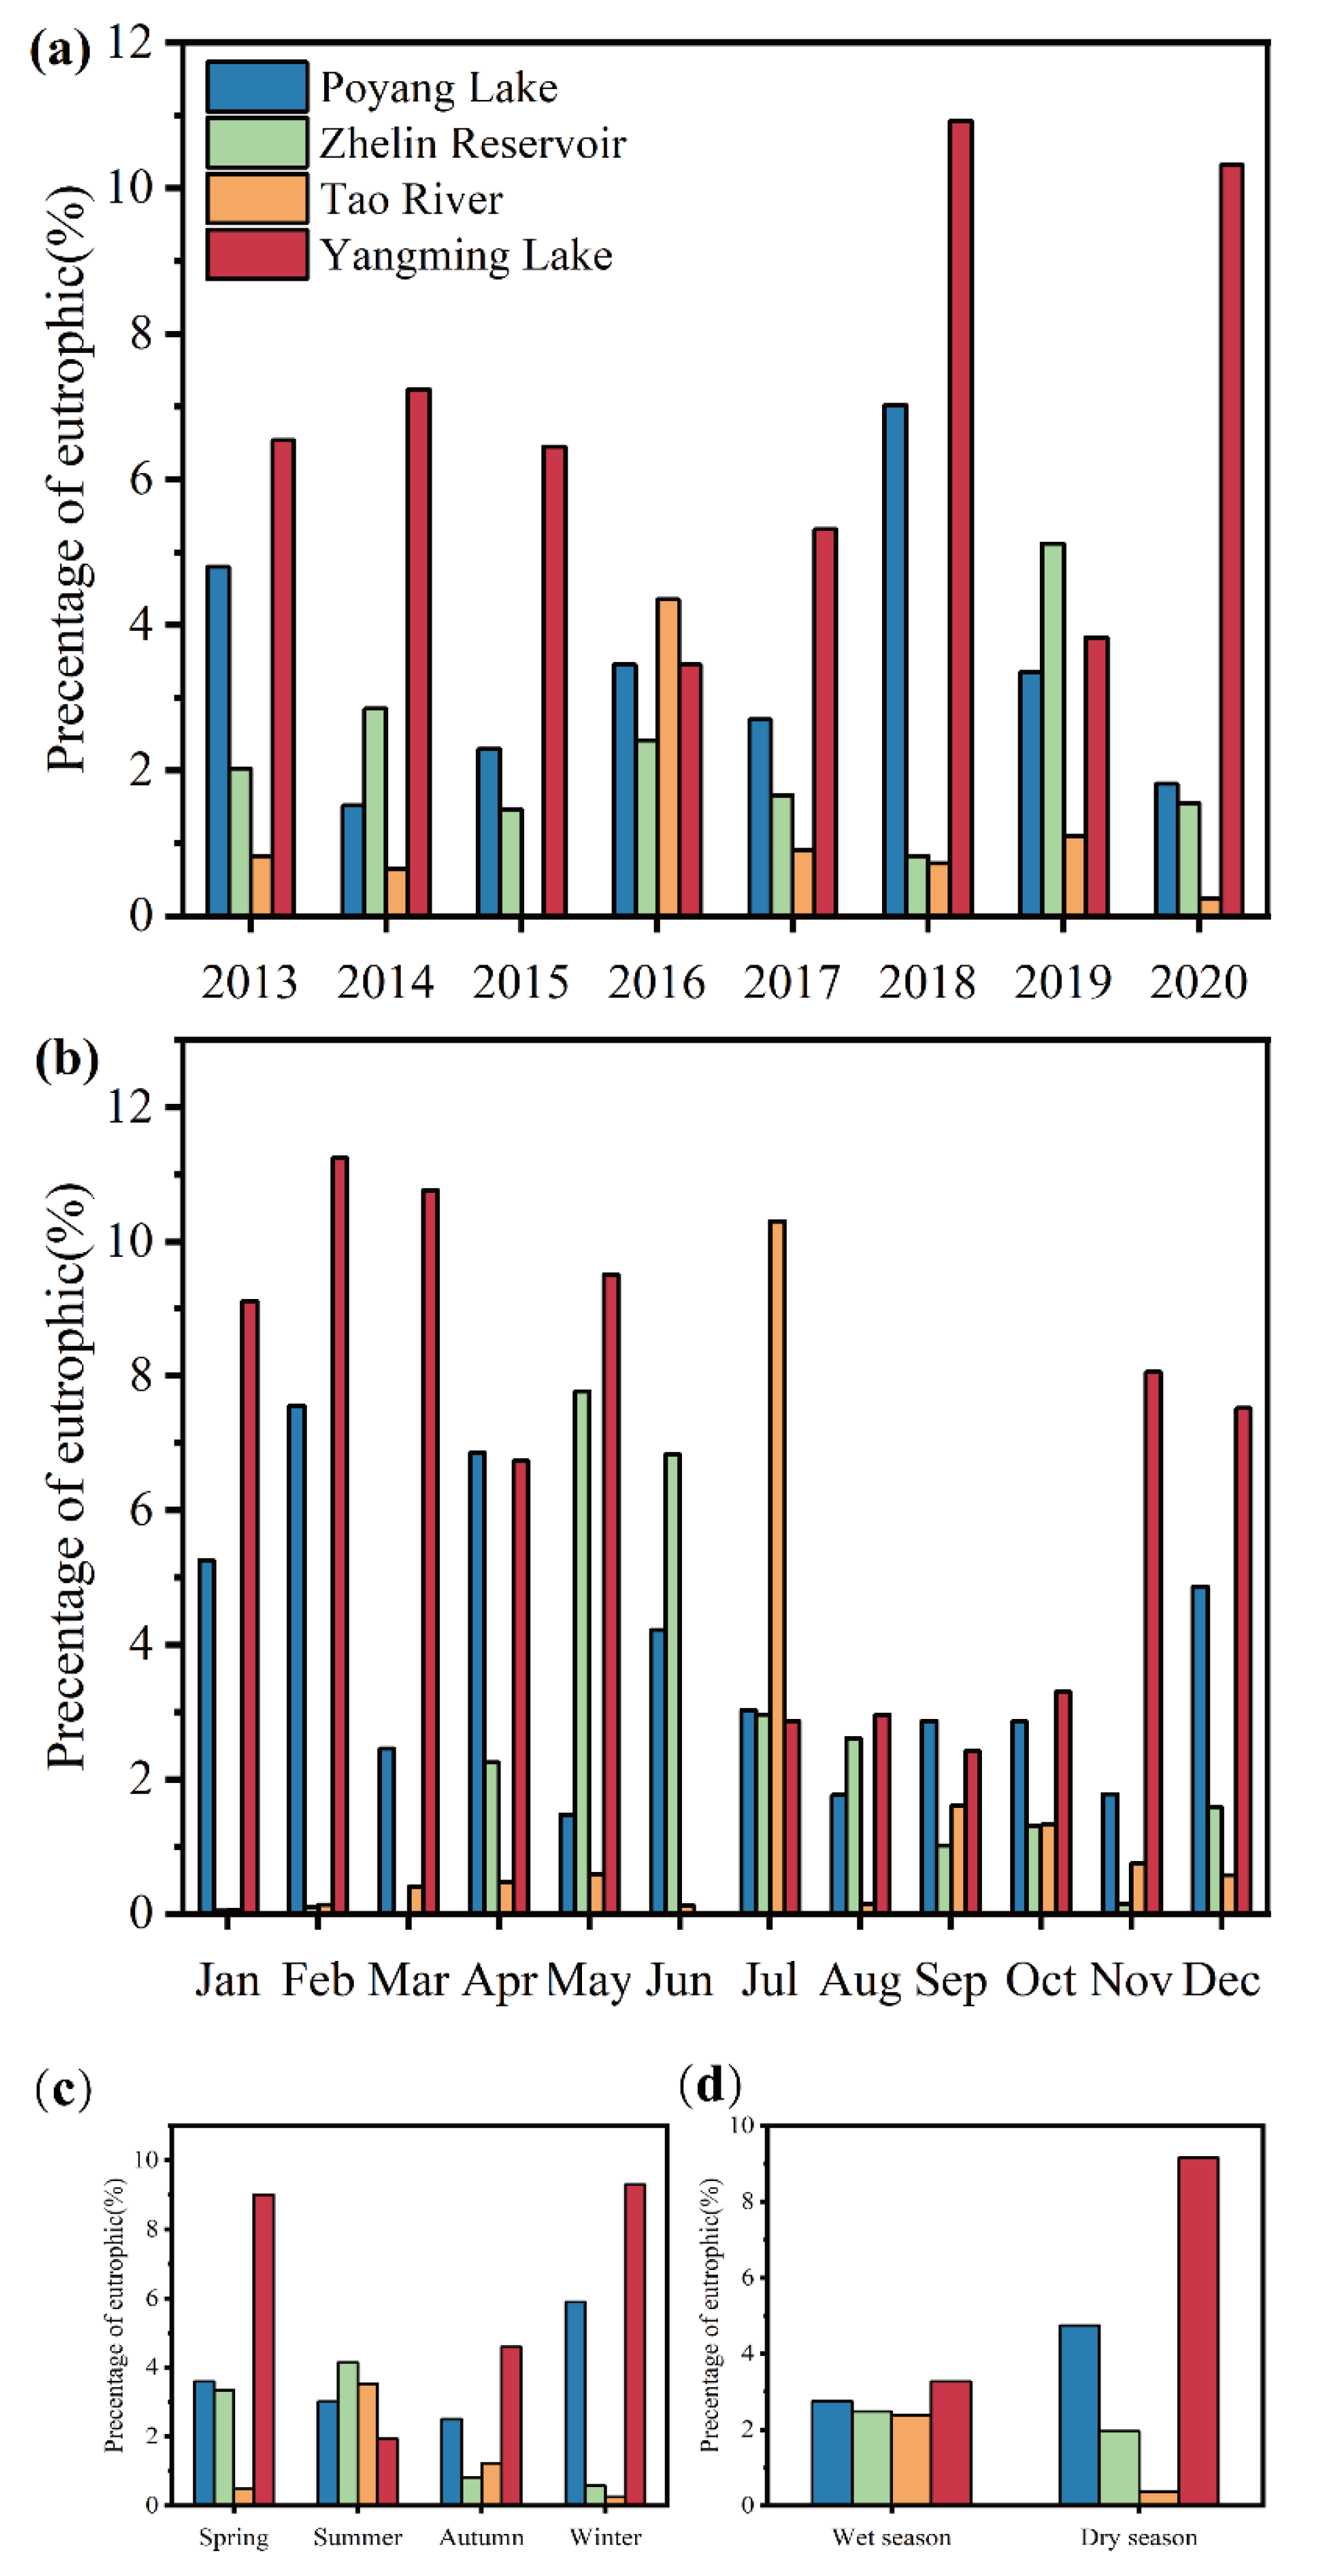
3.3. Spatio-Temporal Variations in OLI-Derived TLI

The 8-year TLI climatology values of three study regions (Zhelin Reservoir, Tao River, and Yangming Lake) were >15 and Poyang Lake was >25 (Figure 7a). Poyang Lake was the most eutrophic lake compared to other lake, reservoir, and river, with a long-term average TLI of 27.8, and the mean values for Zhelin Reservoir, Yangming Lake, and Tao River were less than 20. Zhelin Reservoir was comparatively clearer (long-term average TLI = 16.86). In addition, Poyang Lake and Zhelin Reservoir advertised statistical TLI significantly decreasing trends in the past 8 years, with the annual rates of change of −0.79 yr−1 and −0.15 yr−1, respectively. On the contrary, the TLI values of Yangming Lake and Tao River showed a significant increasing trend, with the annual rate of change of 0.90 yr−1 and 0.36 yr−1, respectively.
Figure 7c–f shows the annual mean values of TLI in four regions of Poyang Lake Basin. For Poyang Lake, the mean TLI value showed a trend from increasing (2014–2018) to decreasing (2018–2020), with the annual average maximum value of TLI appearing in 2018 (TLI = 29.81). Similarly, the annual mean value of TLI in Zhelin Reservoir also showed a trend from increasing (2014–2017) to decreasing (2017–2020), with the annual mean value of TLI occurring in 2017 (TLI = 18.89). In contrast, Tao River and Yangming Lake showed an increasing trend of TLI values in the 8-year period from 2013 to 2020. Compare with the waters in Tao River, the annual mean TLI of Yangming Lake was fluctuating from 2016 to 2020, with the annual mean maximum TLI displayed in 2016 (TLI = 23.36). Overall, the TLI annual value of the Poyang Lake Basin is in a stable state from 2013 to 2020.
The twelve months of the year were divided into four seasons, namely, spring from March to May, summer from June to August, autumn from September to November, and winter from December to next February. Seasonally, TLI values for several studied regions were also determined (Figure 8). We found that the average value of TLI in the Poyang Lake Basin was maximum in the spring (TLI = 23.30), followed by winter (TLI = 20.48), and the lowest in summer and autumn (TLI = 19.02, 17.46, respectively) (Figure 8f). In addition, there were differences in the seasonal variation of mean TLI in each region. For Poyang Lake, the average TLI value remained high in winter (TLI = 32.75) and spring (TLI = 29.64) and displayed an obvious deteriorating trend from summer to winter. The mean value of TLI rose from the lowest value in summer (TLI = 24.22) to the highest value in winter (TLI = 32.75). In contrast, the average the TLI value of Zhelin Reservoir showed a downward trend from spring (TLI = 24.46) to autumn (TLI = 11.53) and increased in winter (TLI = 15.65). Interestingly, the seasonal variation of the Tao River TLI means was opposite to that of the Yangming Lake TLI. The minimum value of the mean TLI value of Tao River appeared in summer (TLI = 12.88), on the contrary, the maximum value of the mean value of TLI of Yangming Lake appeared in summer (TLI = 20.11).
Figure 9a shows the interannual distribution of the percentage of eutrophic water in four typical zones of the PLB. Generally, the proportion of eutrophic water bodies in Yangming Lake was relatively high each year. In particular, in 2018 and 2020, the proportion of eutrophic water bodies exceeded 10%, while in 2018, it accounted for 10.8%. The proportion of eutrophic in Tao River was the lowest; its maximum never exceeded 5% (which appeared in 2016). Figure 9b shows the monthly distribution of the proportion of eutrophic water bodies in four typical regions of PLB. The monthly distribution of the proportion of eutrophic water in Poyang Lake and Yangming Lake was similar, both reaching the maximum (7.56% and 10.77%, respectively) in February–March, then falling to the minimum (1.76% and 2.41%, respectively), and then showing an upward trend. In contrast, the monthly distribution of the proportion of eutrophic water bodies in Zhelin Reservoir and Tao River reached its maximum value and then decreased to the minimum value, and the maximum value appeared May–July.
Figure 9c shows the seasonal distribution of eutrophication proportion in four typical regions of PLB. Poyang Lake and Yangming Lake were higher in winter and spring than in summer and autumn, with the maximum occurring in winter (5.89% and 9.29%, respectively). On the contrary, Zhelin Reservoir and Tao River showed higher performance in spring and summer than in autumn and winter, with the maximum occurring in summer (4.14% and 3.52%, respectively). According to the statistical results of the dry and the wet seasons (Figure 9d), the proportion of eutrophic water in Poyang Lake and Yangming Lake in the dry season (December to next May) was greater than in the wet season (June to November), while Zhelin Reservoir and Tao River showed the opposite trend.

3.4. Relationships between the TLI and Driving Forces

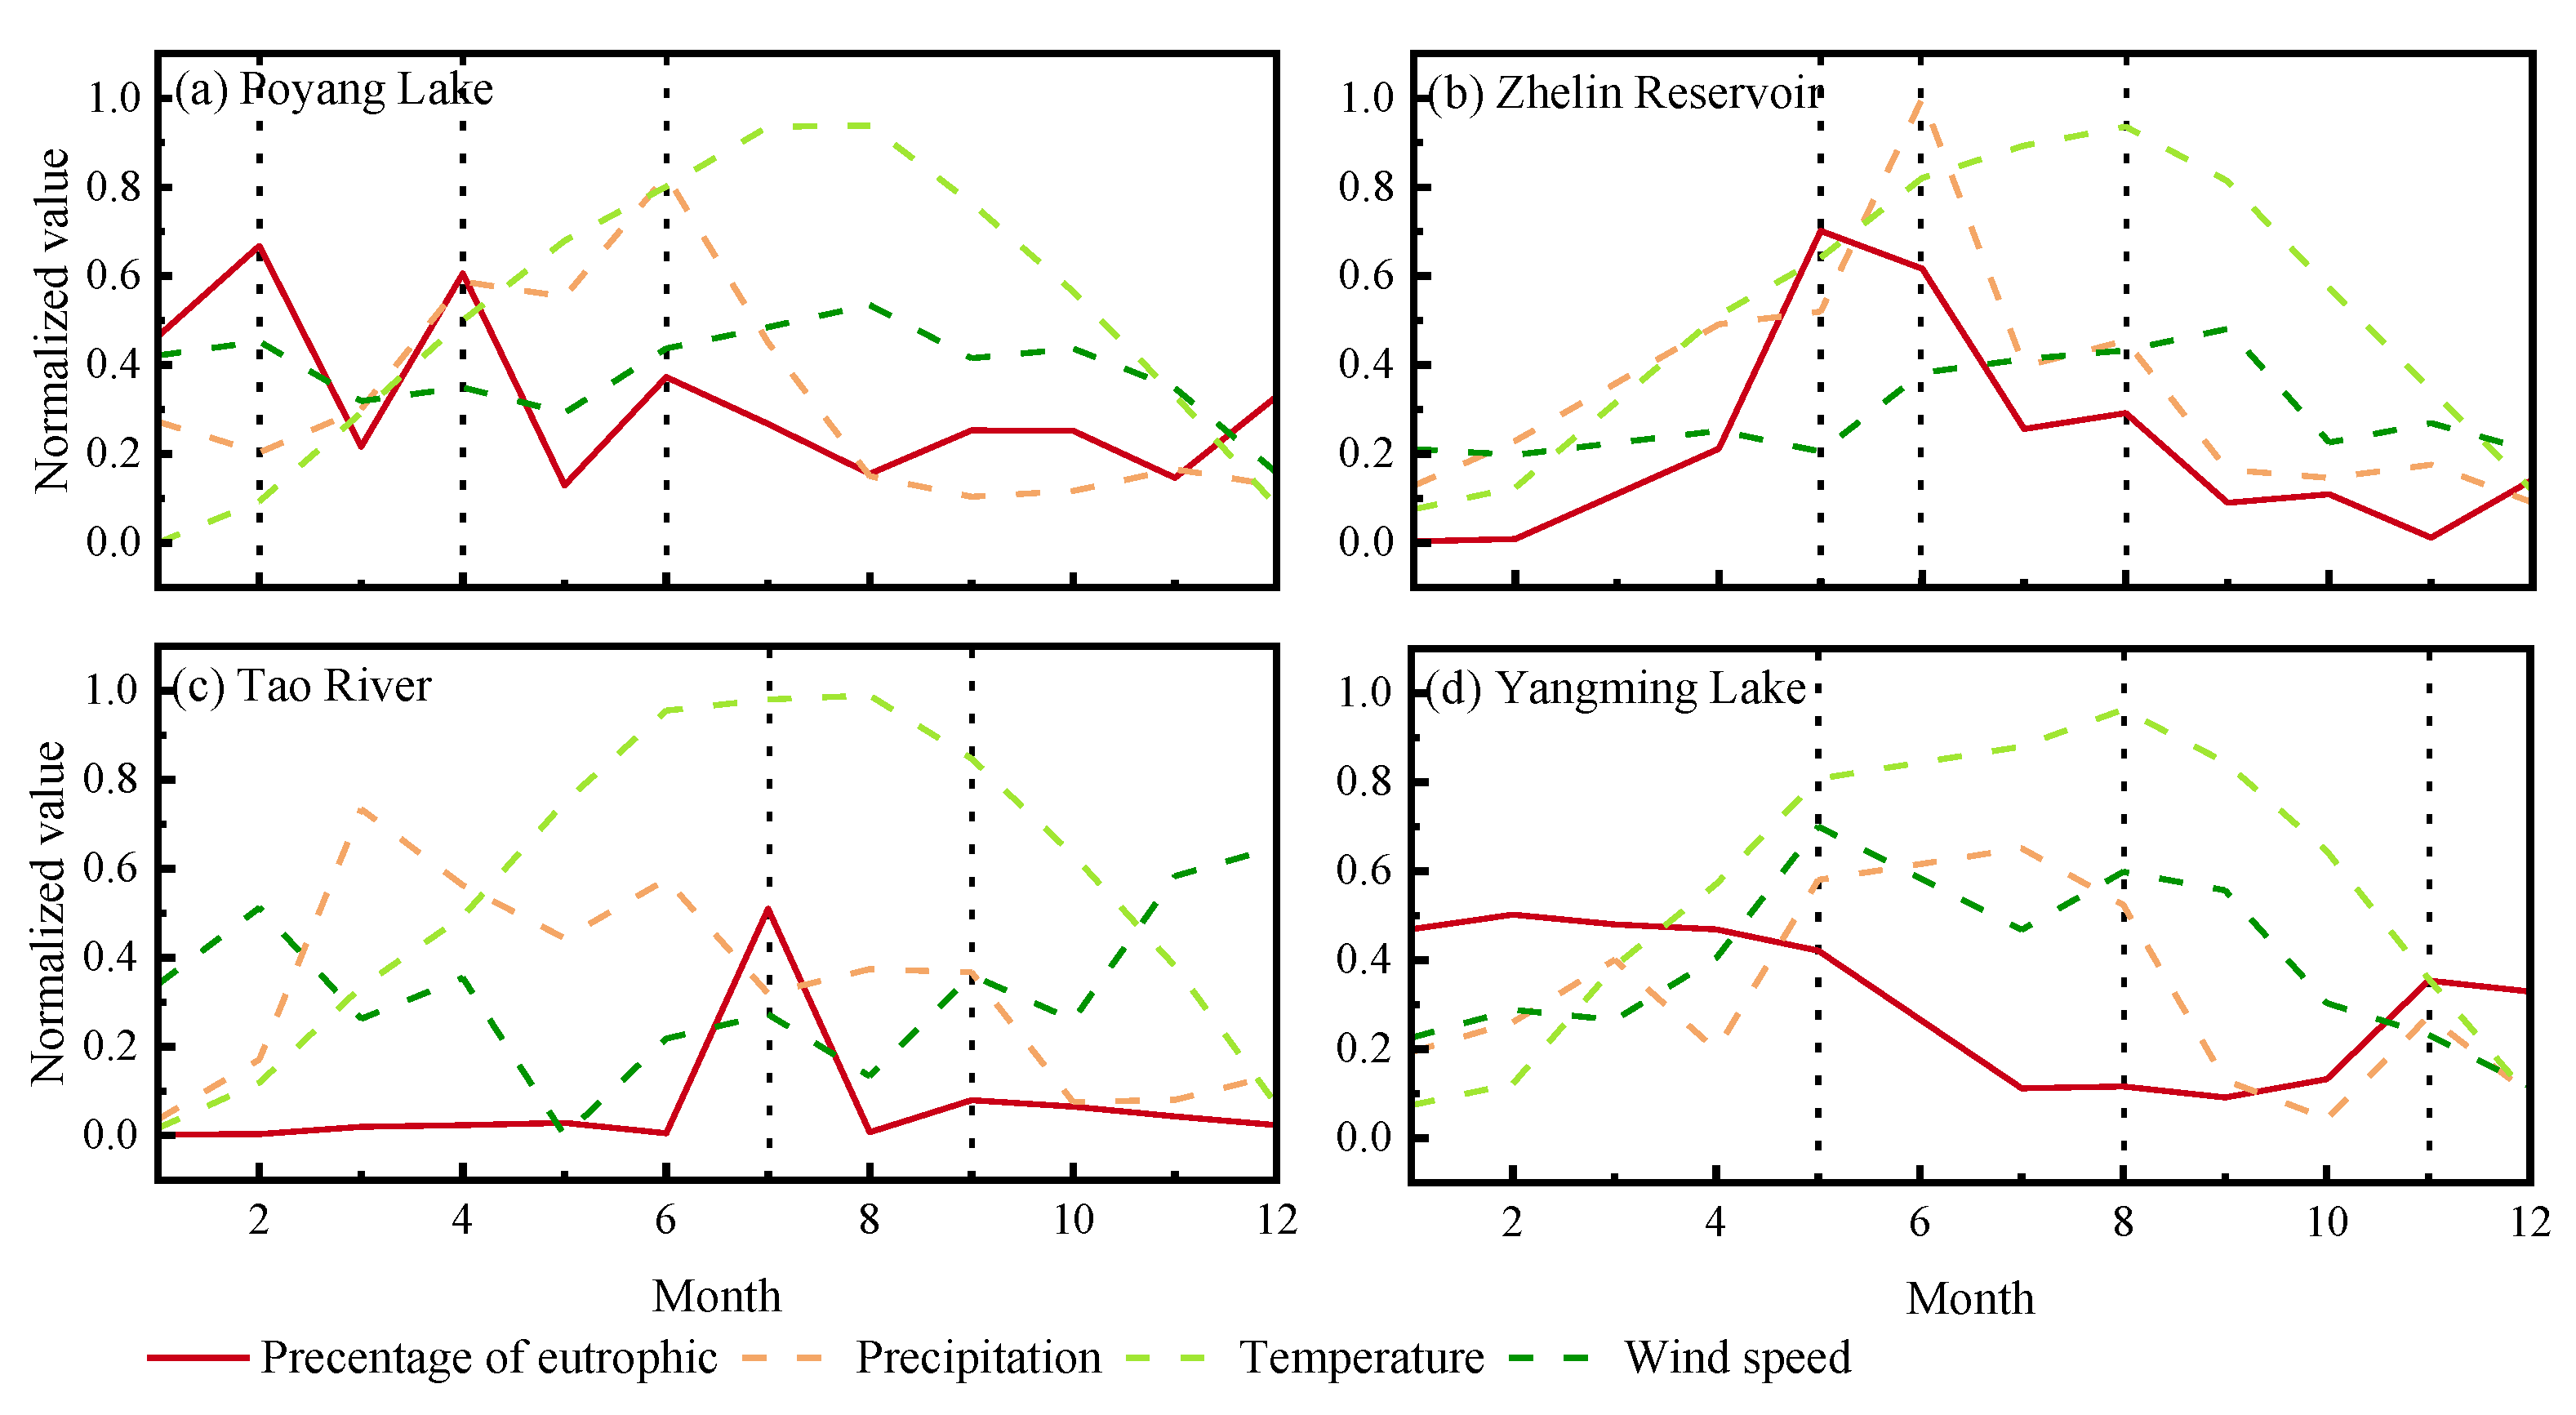
3.4.1. Meteorological Factors

It can be seen from Figure 10 that there was a significant negative correlation between temperature and the proportion of eutrophic water bodies in Poyang Lake and Yangming Lake. The reason for this phenomenon is that the short-term strong precipitation generated during the wet season when the temperature is higher replenishes a large amount of freshwater and accelerated the settling rate of suspended matter [27]. In addition, in Yangming Lake, the negative correlation between the percentage of eutrophic state water and wind speed indicate that lower wind speed is favorable for the accumulation and flotation of cyanobacteria on the water surface, and less disturbance to the water column, higher water clarity, and thus more light entering the water column, allowing higher productivity of algae [62]. Previous studies have shown that the high-level dilution and biodegradation ability of Poyang Lake were the leading reasons for the water bodies to maintain relatively low trophic levels during high water levels and high trophic levels during low water levels, respectively [27,63]. In Zhelin Reservoir and the Tao River, the temperature has a significant impact. Higher temperatures hasten cyanobacterial growth and algae blooms of water.

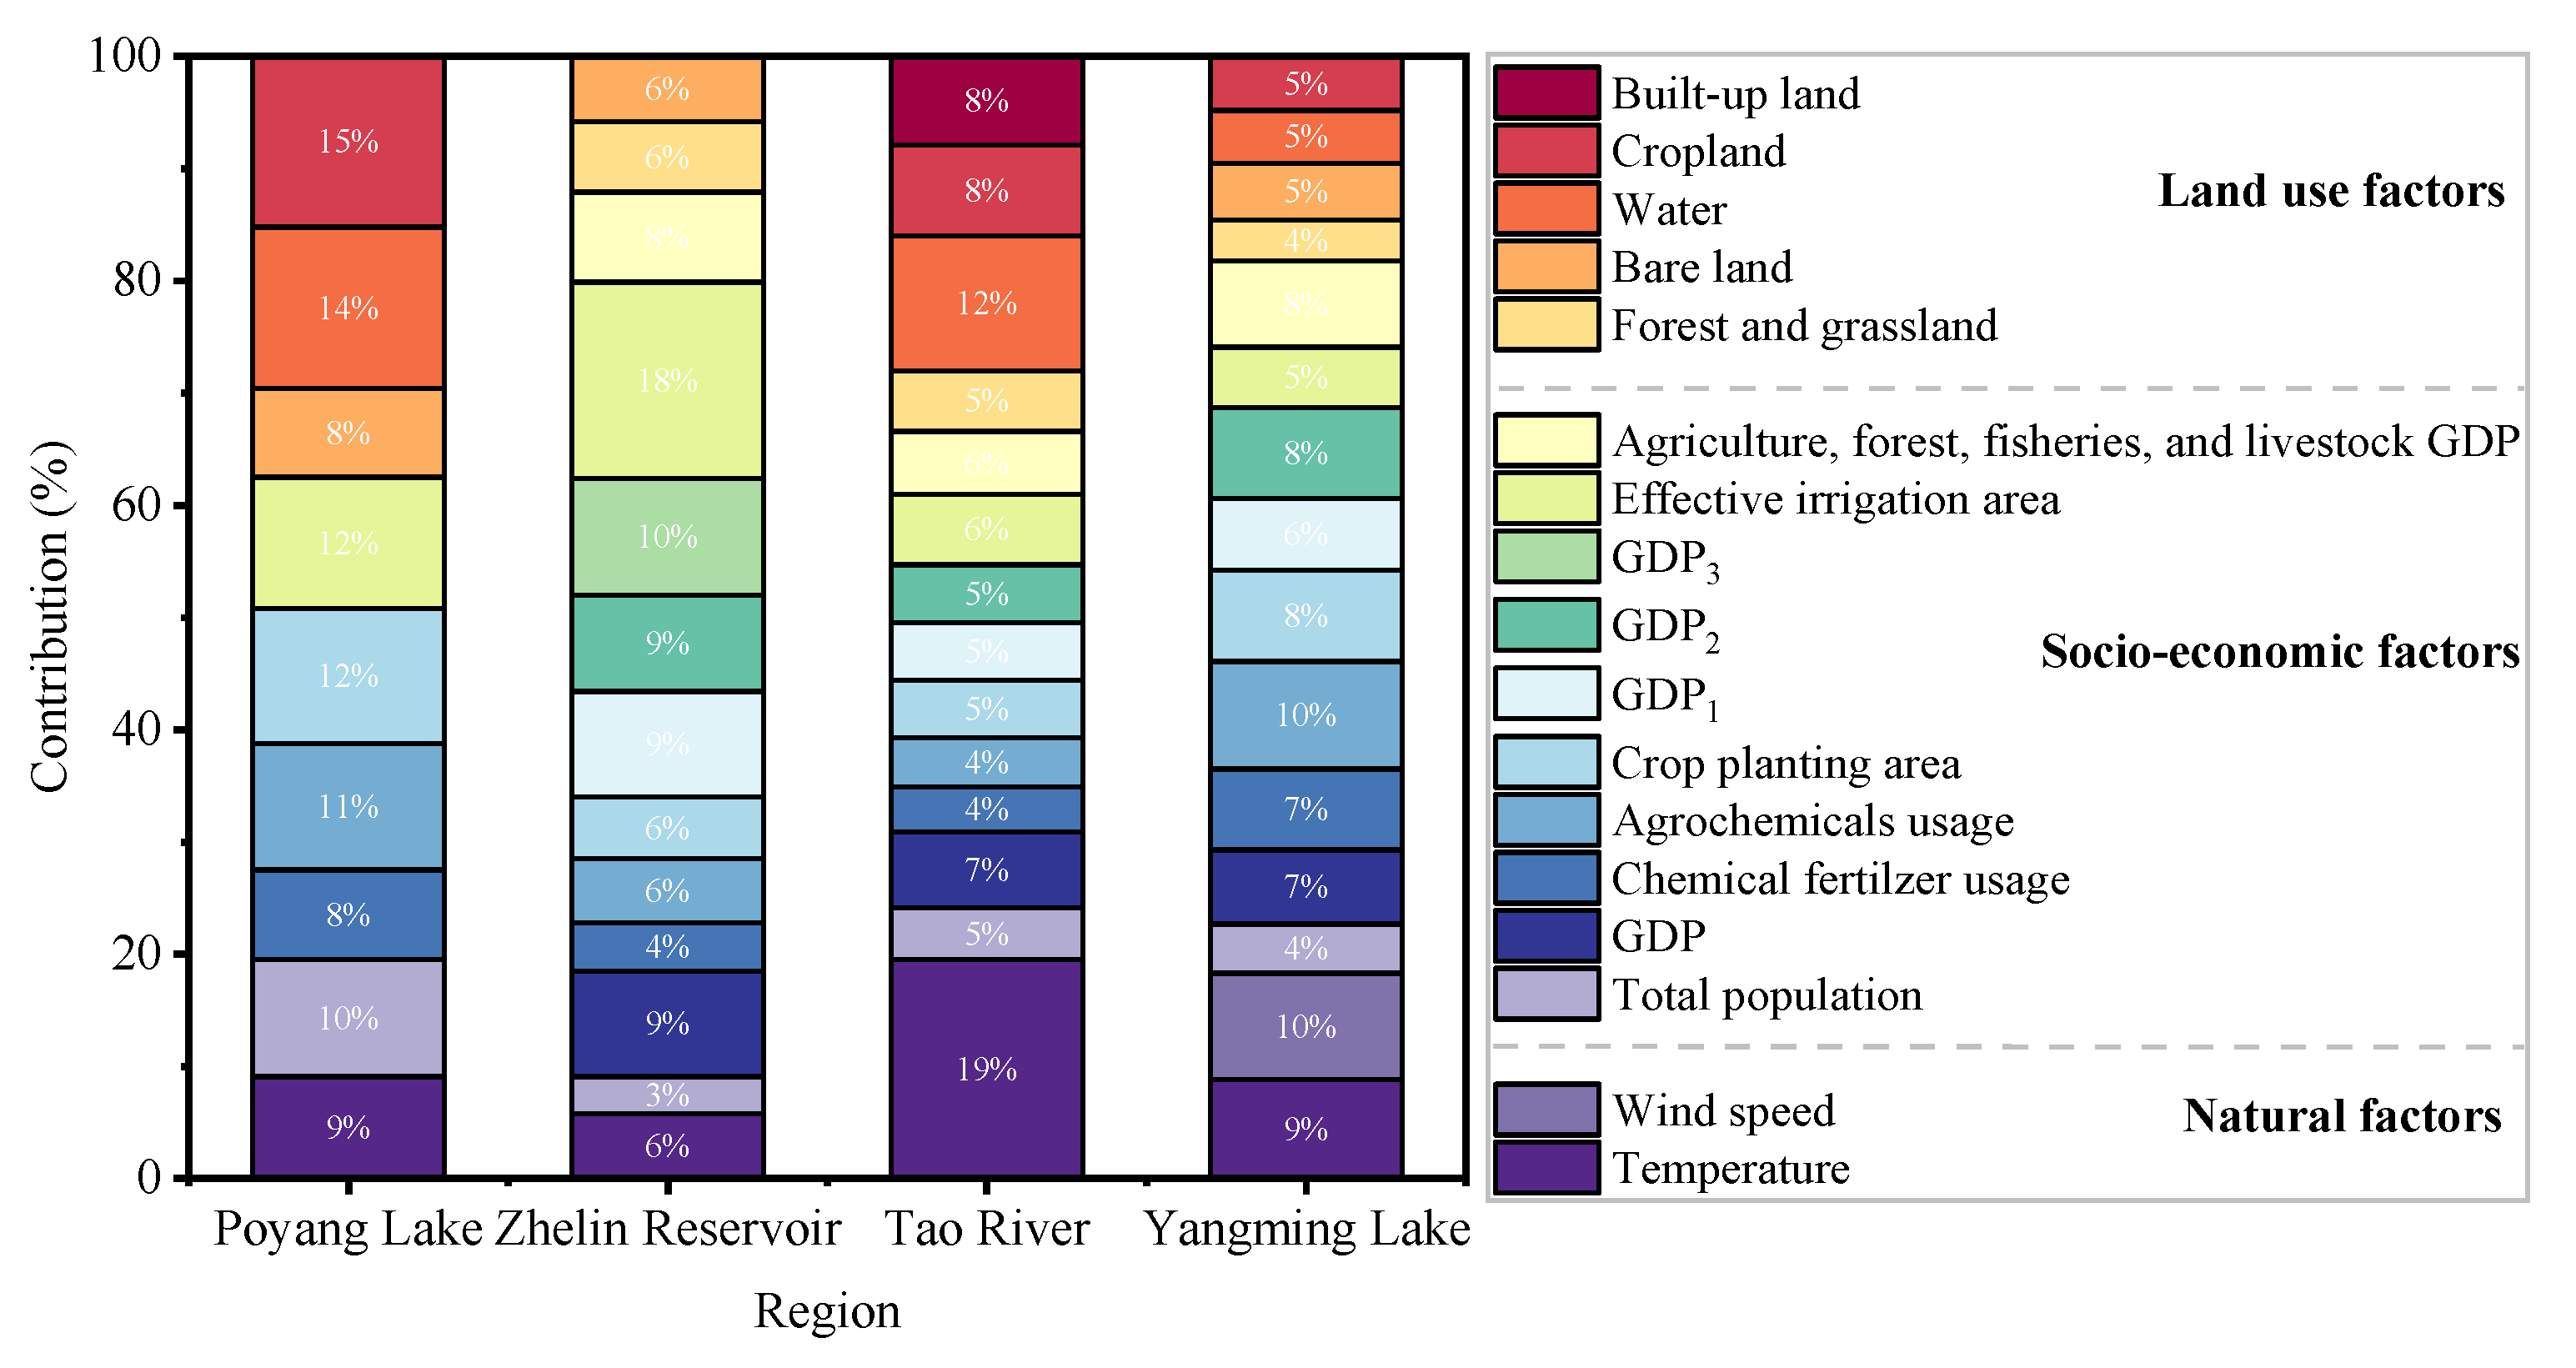
3.4.2. Socio-Economic Factors

The correlation degree was estimated employing data from the statistical yearbook, if the correlation degree of the index was low, the index was eliminated. The data of indicators were analyzed and the degree of correlation of each indicator was estimated using gray correlation degree analysis (Table A1). The gray correlation degrees of the total population, chemical fertilizer usage, pesticide use, crop planting area, effective irrigation area, and the proportion of eutrophic state water bodies were greater than 0.7 in the Poyang Lake, and the correlation degree of the remainder indicators does not meet the criteria. The gray correlation between the ten socioeconomic indicators and the proportion of eutrophic state water bodies in the Zhelin Reservoir region would be all greater than 0.7. Except for the gross domestic product of tertiary industry (GDP3), the gray correlations in the Tao River and Yangming Lake were more than 0.7 between the nine indicators and the percentage of eutrophic state water bodies.

3.4.3. Land Use/Cover Factors

The correlation degree of correlation of the interannual change of the area of each classification of features and the eutrophic state of water body in PLB were calculated separately using the statistical area of each classification in PLB, and the change of area of classifications with lower correlation degrees were not considered. The GRA was used to calculate the degree of correlation of each index in the PLB (Table A2). Except for the built-up land, forest, and grassland, the gray correlation between the other classifications and the eutrophication status of the water body area of Poyang Lake were greater than 0.7. Except for the forest and grassland and bare land, the gray correlation between the classifications and the percentage of eutrophication status to water bodies of Zhelin Reservoir were less than 0.7. In the Tao River, except for bare land, the gray correlation between the classifications and the eutrophication status of the percentage of the water body area was greater than 0.7. Except for built-up land, the gray correlation between the classifications and the eutrophication status of Yangming Lake, a drinking water source, as a proportion of the water body area is greater than 0.7.

4. Discussion

4.1. Driving Forces

The entropy weight method was used to calculate the weights accounted for each factor. Our results showed that natural and anthropogenic factors simultaneously determine the spatiotemporal variation of eutrophication in the PLB (Figure 11). Lakes and reservoirs in the PLB are usually in oligotrophic or mesotrophic state, with average TLI values ranging from 16.86 to 31.26 [7]. Temperature is an important driver that promotes algae growth and plays a crucial role in algal bloom in most lakes of central and eastern China [58,64]. Many studies have confirmed that temperature has an important impact on water eutrophication [9,64]. However, Poyang Lake Basin is controlled by the East Asian monsoon, with hot and rainy summers and cold and dry winters. Precipitation sinks into the lake through surface runoff, resulting in greater depths and an increase in the lake’s dilution and purification capacity. It also explains why the proportion of eutrophic water bodies was smaller in months with high temperatures than in months with low temperatures.
Population growth plays a vital role in the process of water eutrophication. On the one hand, domestic wastewater generated by population growth enters rivers and lakes with surface runoff; On the other hand, population growth leads to urban sprawl, a large amount of forest and grassland were converted into construction land, and the function of soil purification decreases [2,58].
Socioeconomic activities also significantly affect the process of water eutrophication in the Poyang Lake Basin. Agricultural non-point source pollution (i.e., chemical fertilizers and pesticides) seriously affects the water quality of lakes and rivers, causing the lakes to evolve from oligotrophic to eutrophic, with massive growth of algae and severe damage to aquatic ecology [7]. With the rapid economic growth and urbanization process, a large amount of industrial wastewater and domestic sewage were discharged into rivers and lakes, resulting in the deterioration of water quality, which is more obvious in the eastern and southwestern lake regions of China [1,17]. The continuous increase of purse seine farming and mining activities in lakes directly affects water quality and aquatic ecosystems, thus increasing the eutrophication of lakes [27]. However, we need to admit that the impact of urbanization requires more detailed data analysis (e.g., accurate industrial wastewater discharge and domestic sewage discharge).
Cropland only accounts for a small part of the PLB, but it has a significant negative effect on water quality and productivity shifts. Many research results have shown that nitrogen and phosphorus nutrients artificially applied in cultivated soil easily enter rivers and lakes with surface runoff, resulting in an imbalance of N/P ratio in lakes, frequent occurrence of harmful algal blooms, and increased productivity of lakes [24].
Seasonal changes in the proportion of eutrophication in the PLB could be related to the East Asian monsoon climate, which is characterized by hot and rainy summers and cold and dry winters. Previous studies have also illustrated the essential contributions of temperature and precipitation to seasonal changes in water quality [15,22].

4.2. Comparing with the Existing Algorithms

Water bodies in different regions have unique optical properties, and the remote sensing assessment model of water body eutrophication developed for a particular study area might not be suitable to monitor water body eutrophication in other regions. What is the performance of the TLI model of eutrophication in PLB based on Landsat-8 OLI data constructed in this paper? We evaluate published models from Wen, et al. [10], Duan, et al. [65], and Hu, et al. [7].
Table 2 shows the results of comparing the model in this study to other parametrized models. For the TLI model proposed for this study the MAD is 3.58, and the RMSD is 4.43, both of which was lower than the MADs of the existing models, indicating that the model proposed for this study was more applicable to evaluation of water body eutrophication in the PLB. The model proposed in this paper for assessing the trophic level of waters in PLB using remote sensing data is more effective than the currently available models. The optical properties of water bodies in different waters might vary massively, and the dominant factors of water color might differ [64]. However, these models were successfully applied to monitor the eutrophication of inland lakes in China.

4.3. Limitations of Satellite Monitoring of Water Eutrophication

Satellite monitoring has significantly improved the spatial coverage and time period of eutrophication monitoring in watersheds and can be used as an important complement to field measurements and laboratory analysis, especially for rivers and lakes that lack sampling data. However, this study has some limitations: (i) the TLI model proposed for this study is likely to cause underestimation in high-value areas, especially in areas with TLI greater than 65. Although there are limitations in the generation of long-term large-scale water body eutrophication data sets, TLI estimation models applicable to a wider range of water body types can be developed in the future. (ii) Only uses Landsat-8 data to study water eutrophication in large lakes and reservoirs. In the future, Sentinel-2 MSI data, GaoFen (GF) data, and Huanjing (HJ) data can be considered, and monitoring of small lakes and reservoirs is encouraged. (iii) In this study, only 17 potential explanatory driving factors were used to analyze the temporal and spatial changes of eutrophication in the Poyang Lake Basin. However, more accurate data should be used for analysis (e.g., industrial wastewater and domestic wastewater discharge).

4.4. Implications for the Water Environment Management

We classify the main rivers and lakes in the Poyang Lake Basin into four categories and suggest water quality management plans based on the study results by analyzing the driving forces of eutrophication characteristics of long-term TLI changes. (i) Drinking water source protection regions: All levels of government should effectively supervise and restrict the construction of additional polluting industrial estates in water source protection zones. Enhancing water quality monitoring activities and monitoring water quality in drinking water sources in real-time. (ii) Mineral exploitation regions: To manage the issue of sand mining activity in Poyang Lake, a detailed plan of sand mining in Poyang Lake should be constructed in order to define the mineable area, mineable period, forbidden area, and forbidden period. To solve the problem of the illegal sneak discharge in rare earth mining areas, environmental administrators should strengthen the investigation and supervision of river outfalls, along with punishments. (iii) Agricultural production concentration regions: The structure of the watershed’s plantation industry should be modified and improved as soon as feasible to promote the development of ecological green agriculture. (iv) Concentrated human activity regions: Relevant government departments should improve the rate of urban and rural domestic sewage treatment.

5. Conclusions

The spatiotemporal distribution and driving factors of eutrophication in the Poyang Lake Basin were investigated using Landsat-8 OLI images and TLI model. Under the effect of natural and anthropogenic activities factors, the eutrophication of Poyang Lake Basin presented a spatial distribution pattern of high in the north and low in the south. In contrast, the process of water eutrophication showed a trend of declining in the north and rising in the south. The proportion of eutrophication in the Poyang Lake Basin had a seasonal pattern of low in summer and high in winter. The climate of the East Asian monsoon region is characterized by high temperature and rain in summer, which may affect the seasonal variation of water eutrophication.
The eutrophication of the water body in the Poyang Lake Basin was most affected by human activities, with an average contribution of more than 60%. However, the proportion of natural factors and human factors in different regions was not balanced. Human activities contributed the most to the eutrophication of Zhelin Reservoir, reaching 82.1%, and natural factors contributed more to the eutrophication of Tao River than other regions.
To improve the water quality of lakes, we recommend that the government and management departments formulate policies and manage protection measures, strengthen the supervision of activities such as sand mining and mining, and improve the purification capacity of agricultural and urban wastewater.

Author Contributions

Conceptualization, Z.Z. and J.L.; methodology, J.L., Z.Z. and G.L.; software, J.L. and S.L.; validation, J.L., S.L. and R.Z.; formal analysis, J.L., S.L., J.X. and Y.L.; investigation, Z.Z., G.L. and J.L.; resources, Z.Z., G.L. and J.L.; data curation, Z.Z., G.L. and J.L.; writing—original draft preparation, J.L. and Z.Z.; writing—review and editing, Z.Z., N.C., G.L., C.D. and R.Z.; visualization, J.L., N.C. and R.Z.; supervision, G.L., J.L., Z.Z. and C.H.; project administration, Z.Z.; funding acquisition, Z.Z., G.L., C.D., S.L. and Y.L. All authors have read and agreed to the published version of the manuscript.

Funding

This research was funded by the National Natural Science Foundation of China (No. 41701412; 42171385; 41907331; 42101384 & 42071333), the Social Science Foundation of Jiangxi Province (No. 22GL27), the Humanities and Social Sciences Project of Jiangxi Provincial University (No. GL21143), the Science and Technology Project of Jiangxi Educational Committee (No. GJJ2201216), the National Key Research and Development Program of China (No. 2021YFB3901101).

Data Availability Statement

The data presented in this study are available upon request from the corresponding author.

Acknowledgments

We thank the U.S. Geological Survey for providing Landsat-8 satellite data, and China Meteorological Administration for providing meteorological data. The authors would also like to thank four anonymous reviewers for their valuable comments and suggestions for improving the quality of the manuscript.

Conflicts of Interest

The authors declare no conflict of interest.

Appendix A

Table A1. Grey correlation of socio-economic factors.
The Total PopulationGDPChemical Fertilizer UsageAgrochemicals UsageCrop Planting AreaGDP1GDP2GDP3Effective Irrigation AreaAgriculture, Forestry, Fisheries, and Livestock GDP
Poyang Lake0.780.650.860.850.790.690.670.560.820.64
Zhelin Reservoir0.800.850.810.750.810.840.840.710.810.85
Tao River0.810.720.810.790.810.790.810.660.810.79
Yangming Lake0.780.760.760.720.780.780.760.670.780.78
Table A2. Grey correlation of land use/cover factors.
Built-Up LandForest and GrasslandWaterBare LandCropland
Poyang Lake0.590.690.760.890.72
Zhelin Reservoir0.550.780.620.700.60
Tao River0.760.830.750.570.78
Yangming Lake0.660.820.800.720.74

References

  1. Liu, S.; Hou, J.; Suo, C.; Chen, J.; Liu, X.; Fu, R.; Wu, F. Molecular-level composition of dissolved organic matter in distinct trophic states in Chinese lakes: Implications for eutrophic lake management and the global carbon cycle. Water Res. 2022, 217, 118438. [Google Scholar] [CrossRef] [PubMed]
  2. Li, S.; Xu, S.; Song, K.; Kutser, T.; Wen, Z.; Liu, G.; Shang, Y.; Lyu, L.; Tao, H.; Wang, X.; et al. Remote Quantification of the Trophic Status of Chinese Lakes. Hydrol. Earth Syst. Sci. Discuss. 2022, 2022. [Google Scholar] [CrossRef]
  3. Paerl, H.W.; Huisman, J. Blooms like it hot. Science 2008, 320, 57–58. [Google Scholar] [CrossRef] [PubMed] [Green Version]
  4. Gilarranz, L.J.; Narwani, A.; Odermatt, D.; Siber, R.; Dakos, V. Regime shifts, trends, and variability of lake productivity at a global scale. Proc. Natl. Acad. Sci. USA 2022, 119, e2116413119. [Google Scholar] [CrossRef]
  5. Conley, D.J.; Paerl, H.W.; Howarth, R.W.; Boesch, D.F.; Seitzinger, S.P.; Havens, K.E.; Lancelot, C.; Likens, G.E. Controlling eutrophication: Nitrogen and phosphorus. Science 2009, 323, 1014–1015. [Google Scholar] [CrossRef]
  6. Schindler, D.W.; Hecky, R.E.; Findlay, D.L.; Stainton, M.P.; Parker, B.R.; Paterson, M.J.; Beaty, K.G.; Lyng, M.; Kasian, S.E.M. Eutrophication of lakes cannot be controlled by reducing nitrogen input: Results of a 37-year whole-ecosystem experiment. Proc. Natl. Acad. Sci. USA 2008, 105, 11254–11258. [Google Scholar] [CrossRef] [Green Version]
  7. Hu, M.; Ma, R.; Xiong, J.; Wang, M.; Cao, Z.; Xue, K. Eutrophication state in the Eastern China based on Landsat 35-year observations. Remote Sens. Environ. 2022, 277, 113057. [Google Scholar] [CrossRef]
  8. Guan, Q.; Feng, L.; Hou, X.; Schurgers, G.; Zheng, Y.; Tang, J. Eutrophication changes in fifty large lakes on the Yangtze Plain of China derived from MERIS and OLCI observations. Remote Sens. Environ. 2020, 246, 111890. [Google Scholar] [CrossRef]
  9. Shi, K.; Zhang, Y.; Song, K.; Liu, M.; Zhou, Y.; Zhang, Y.; Li, Y.; Zhu, G.; Qin, B. A semi-analytical approach for remote sensing of trophic state in inland waters: Bio-optical mechanism and application. Remote Sens. Environ. 2019, 232, 111349. [Google Scholar] [CrossRef]
  10. Wen, Z.; Song, K.; Liu, G.; Shang, Y.; Fang, C.; Du, J.; Lyu, L. Quantifying the trophic status of lakes using total light absorption of optically active components. Environ. Pollut. 2019, 245, 684–693. [Google Scholar] [CrossRef]
  11. Carlson, R.E. A trophic state index for lakes 1. Limnol. Oceanogr. 1977, 22, 361–369. [Google Scholar] [CrossRef] [Green Version]
  12. Aizaki, M.; Otsuki, A.; Fukushima, T.; Hosomi, M.; Muraoka, K. Application of Carlson’s trophic state index to Japanese lakes and relationships between the index and other parameters. SIL Proc. 1922–2010 1981, 21, 675–681. [Google Scholar] [CrossRef]
  13. Jin, X.; Tu, Q. Specification of Lake Eutrophication Survey (in Chinese); Environmental Science Press: Beijing, China, 1990. [Google Scholar]
  14. Lin, S.-S.; Shen, S.-L.; Zhou, A.; Lyu, H.-M. Assessment and management of lake eutrophication: A case study in Lake Erhai, China. Sci. Total Environ. 2021, 751, 141618. [Google Scholar] [CrossRef]
  15. Ren, J.; Zheng, Z.; Li, Y.; Lv, G.; Wang, Q.; Lyu, H.; Huang, C.; Liu, G.; Du, C.; Mu, M.; et al. Remote observation of water clarity patterns in Three Gorges Reservoir and Dongting Lake of China and their probable linkage to the Three Gorges Dam based on Landsat 8 imagery. Sci. Total Environ. 2018, 625, 1554–1566. [Google Scholar] [CrossRef]
  16. Zheng, Z.; Li, Y.; Guo, Y.; Xu, Y.; Liu, G.; Du, C. Landsat-based long-term monitoring of total suspended matter concentration pattern change in the wet season for Dongting Lake, China. Remote Sens. 2015, 7, 13975–13999. [Google Scholar] [CrossRef] [Green Version]
  17. Shen, M.; Duan, H.; Cao, Z.; Xue, K.; Qi, T.; Ma, J.; Liu, D.; Song, K.; Huang, C.; Song, X. Sentinel-3 OLCI observations of water clarity in large lakes in eastern China: Implications for SDG 6.3.2 evaluation. Remote Sens. Environ. 2020, 247, 111950. [Google Scholar] [CrossRef]
  18. Liu, H.; He, B.; Zhou, Y.; Kutser, T.; Toming, K.; Feng, Q.; Yang, X.; Fu, C.; Yang, F.; Li, W.; et al. Trophic state assessment of optically diverse lakes using Sentinel-3-derived trophic level index. Int. J. Appl. Earth Obs. Geoinf. 2022, 114, 103026. [Google Scholar] [CrossRef]
  19. Zeng, S.; Lei, S.; Li, Y.; Lyu, H.; Dong, X.; Li, J.; Cai, X. Remote monitoring of total dissolved phosphorus in eutrophic Lake Taihu based on a novel algorithm: Implications for contributing factors and lake management. Environ. Pollut. 2022, 296, 118740. [Google Scholar] [CrossRef]
  20. Wang, S.; Li, J.; Zhang, B.; Spyrakos, E.; Tyler, A.N.; Shen, Q.; Zhang, F.; Kuster, T.; Lehmann, M.K.; Wu, Y.; et al. Trophic state assessment of global inland waters using a MODIS-derived Forel-Ule index. Remote Sens. Environ. 2018, 217, 444–460. [Google Scholar] [CrossRef] [Green Version]
  21. Pozdnyakov, D.V.; Korosov, A.A.; Petrova, N.A.; Grassl, H. Multi-year satellite observations of Lake Ladoga’s biogeochemical dynamics in relation to the lake’s trophic status. J. Great Lakes Res. 2013, 39, 34–45. [Google Scholar] [CrossRef]
  22. Zheng, Z.; Ren, J.; Li, Y.; Huang, C.; Liu, G.; Du, C.; Lyu, H. Remote sensing of diffuse attenuation coefficient patterns from Landsat 8 OLI imagery of turbid inland waters: A case study of Dongting Lake. Sci. Total Environ. 2016, 573, 39–54. [Google Scholar] [CrossRef] [PubMed]
  23. Cao, Z.; Ma, R.; Liu, M.; Duan, H.; Xiao, Q.; Xue, K.; Shen, M. Harmonized Chlorophyll-a Retrievals in Inland Lakes From Landsat-8/9 and Sentinel 2A/B Virtual Constellation Through Machine Learning. IEEE Trans. Geosci. Remote Sens. 2022, 60, 1–16. [Google Scholar] [CrossRef]
  24. Li, Y.; Shi, K.; Zhang, Y.; Zhu, G.; Zhang, Y.; Wu, Z.; Liu, M.; Guo, Y.; Li, N. Analysis of water clarity decrease in Xin’anjiang Reservoir, China, from 30-Year Landsat TM, ETM+, and OLI observations. J. Hydrol. 2020, 590, 125476. [Google Scholar] [CrossRef]
  25. Lee, Z.; Shang, S.; Qi, L.; Yan, J.; Lin, G. A semi-analytical scheme to estimate Secchi-disk depth from Landsat-8 measurements. Remote Sens. Environ. 2016, 177, 101–106. [Google Scholar] [CrossRef]
  26. Watanabe, F.S.; Alcântara, E.; Rodrigues, T.W.; Imai, N.N.; Barbosa, C.C.; Rotta, L.H. Estimation of Chlorophyll-a Concentration and the Trophic State of the Barra Bonita Hydroelectric Reservoir Using OLI/Landsat-8 Images. Int. J. Environ. Res. Public Health 2015, 12, 10391–10417. [Google Scholar] [CrossRef] [PubMed] [Green Version]
  27. Li, B.; Yang, G.; Wan, R. Multidecadal water quality deterioration in the largest freshwater lake in China (Poyang Lake): Implications on eutrophication management. Environ. Pollut. 2020, 260, 114033. [Google Scholar] [CrossRef]
  28. Li, J.; Li, Y.; Bi, S.; Xu, J.; Guo, F.; Lyu, H.; Dong, X.; Cai, X. Utilization of GOCI data to evaluate the diurnal vertical migration of Microcystis aeruginosa and the underlying driving factors. J. Environ. Manag. 2022, 310, 114734. [Google Scholar] [CrossRef]
  29. Morel, A.; Mueller, J.L. Normalized Water-Leaving Radiance and Remote Sensing Reflectance: Bidirectional Reflectance and. In Ocean Optics Protocols for Satellite Ocean Color Sensor Validation, Revision 3; National Aeronautics and Space Administration, Goddard Space Flight Center: Greenbelt, MD, USA, 2002; Volume 210004, p. 183. [Google Scholar]
  30. Xing, Q.; Hu, C. Mapping macroalgal blooms in the Yellow Sea and East China Sea using HJ-1 and Landsat data: Application of a virtual baseline reflectance height technique. Remote Sens. Environ. 2016, 178, 113–126. [Google Scholar] [CrossRef]
  31. Vermote, E.F.; Tanré, D.; Deuze, J.L.; Herman, M.; Morcette, J.J. Second simulation of the satellite signal in the solar spectrum, 6S: An overview. IEEE Trans. Geosci. Remote Sens. 1997, 35, 675–686. [Google Scholar] [CrossRef] [Green Version]
  32. Gordon, H.R.; Wang, M. Retrieval of water-leaving radiance and aerosol optical thickness over the oceans with SeaWiFS: A preliminary algorithm. Appl. Opt. 1994, 33, 443–452. [Google Scholar] [CrossRef]
  33. Bernstein, L.S.; Jin, X.; Gregor, B.; Adler-Golden, S.M. Quick atmospheric correction code: Algorithm description and recent upgrades. Opt. Eng. 2012, 51, 111719. [Google Scholar] [CrossRef]
  34. National Meteorological Information Center. Daily Meteorological Dataset of Basic Meteorological Elements of China National Surface Weather Station (V3.0) (1951–2020); National Meteorological Information Center: Beijing, China, 2021. [Google Scholar]
  35. Xu, Y.; Li, Y.; Wang, Q.; Lv, H.; Liu, Z.; Xu, X.; Tan, J.; Guo, Y.; Wu, C. Eutrophication evaluation of three lakes and one reservoir using CCD images of HJ-1 satellite (in Chinese). Acta Sci. Circumstantiae 2011, 31, 81–93. [Google Scholar] [CrossRef]
  36. Gupana, R.S.; Odermatt, D.; Cesana, I.; Giardino, C.; Nedbal, L.; Damm, A. Remote sensing of sun-induced chlorophyll-a fluorescence in inland and coastal waters: Current state and future prospects. Remote Sens. Environ. 2021, 262, 112482. [Google Scholar] [CrossRef]
  37. Guo, Y.; Huang, C.; Li, Y.; Du, C.; Shi, L.; Li, Y.; Chen, W.; Wei, H.; Cai, E.; Ji, G. Hyperspectral reconstruction method for optically complex inland waters based on bio-optical model and sparse representing. Remote Sens. Environ. 2022, 276, 113045. [Google Scholar] [CrossRef]
  38. Bi, S.; Li, Y.; Liu, G.; Song, K.; Xu, J.; Dong, X.; Cai, X.; Mu, M.; Miao, S.; Lyu, H. Assessment of algorithms for estimating chlorophyll-a concentration in inland waters: A round-robin scoring method based on the optically fuzzy clustering. IEEE Trans. Geosci. Remote Sens. 2021, 60, 4200717. [Google Scholar] [CrossRef]
  39. Carpenter, D.J.; Carpenter, S.M. Modeling inland water quality using Landsat data. Remote Sens. Environ. 1983, 13, 345–352. [Google Scholar] [CrossRef]
  40. Gitelson, A.; Szilagyi, F.; Mittenzwey, K.H. Improving quantitative remote sensing for monitoring of inland water quality. Water Res. 1993, 27, 1185–1194. [Google Scholar] [CrossRef]
  41. Gons, H.J.; Auer, M.T.; Effler, S.W. MERIS satellite chlorophyll mapping of oligotrophic and eutrophic waters in the Laurentian Great Lakes. Remote Sens. Environ. 2008, 112, 4098–4106. [Google Scholar] [CrossRef]
  42. Le, C.; Li, Y.; Zha, Y.; Sun, D.; Huang, C.; Lu, H. A four-band semi-analytical model for estimating chlorophyll a in highly turbid lakes: The case of Taihu Lake, China. Remote Sens. Environ. 2009, 113, 1175–1182. [Google Scholar] [CrossRef]
  43. Warren, M.A.; Simis, S.G.H.; Selmes, N. Complementary water quality observations from high and medium resolution Sentinel sensors by aligning chlorophyll-a and turbidity algorithms. Remote Sens. Environ. 2021, 265, 112651. [Google Scholar] [CrossRef]
  44. Zhang, R.; Zheng, Z.; Liu, G.; Du, C.; Du, C.; Lei, S.; Xu, Y.; Xu, J.; Mu, M.; Bi, S.; et al. Simulation and assessment of the capabilities of Orbita Hyperspectral (OHS) imagery for remotely monitoring chlorophyll-a in eutrophic plateau lakes. Remote Sens. 2021, 13, 2821. [Google Scholar] [CrossRef]
  45. Mooij, W.M.; Hülsmann, S.; De Senerpont Domis, L.N.; Nolet, B.A.; Bodelier, P.L.E.; Boers, P.; Pires, L.; Gons, H.J.; Ibelings, B.W.; Noordhuis, R. The impact of climate change on lakes in the Netherlands: A review. Aquat. Ecol. 2005, 39, 381–400. [Google Scholar] [CrossRef]
  46. Zhang, M.; Duan, H.; Shi, X.; Yu, Y.; Kong, F. Contributions of meteorology to the phenology of cyanobacterial blooms: Implications for future climate change. Water Res. 2012, 46, 442–452. [Google Scholar] [CrossRef]
  47. Whitehead, P.G.; Barbour, E.; Futter, M.N.; Sarkar, S.; Rodda, H.; Caesar, J.; Butterfield, D.; Jin, L.; Sinha, R.; Nicholls, R.; et al. Impacts of climate change and socio-economic scenarios on flow and water quality of the Ganges, Brahmaputra and Meghna (GBM) river systems: Low flow and flood statistics. Environ. Sci. Process. Impacts 2015, 17, 1057–1069. [Google Scholar] [CrossRef] [PubMed]
  48. Berkhout, F.; Hertin, J.; Jordan, A. Socio-economic futures in climate change impact assessment: Using scenarios as ‘learning machines’. Glob. Environ. Change 2002, 12, 83–95. [Google Scholar] [CrossRef]
  49. Islam, M.M.M.; Iqbal, M.S.; Leemans, R.; Hofstra, N. Modelling the impact of future socio-economic and climate change scenarios on river microbial water quality. Int. J. Hyg. Environ. Health 2018, 221, 283–292. [Google Scholar] [CrossRef]
  50. Deng, J. Control problems of grey systems. Syst. Control Lett. 1982, 1, 288–294. [Google Scholar] [CrossRef]
  51. Huang, Y.; Shen, L.; Liu, H. Grey relational analysis, principal component analysis and forecasting of carbon emissions based on long short-term memory in China. J. Clean. Prod. 2019, 209, 415–423. [Google Scholar] [CrossRef]
  52. Malek, A.; Ebrahimnejad, S.; Tavakkoli-Moghaddam, R. An improved hybrid grey relational analysis approach for green resilient supply chain network assessment. Sustainability 2017, 9, 1433. [Google Scholar] [CrossRef] [Green Version]
  53. Mu, M.; Li, Y.; Bi, S.; Lyu, H.; Xu, J.; Lei, S.; Miao, S.; Zeng, S.; Zheng, Z.; Du, C. Prediction of algal bloom occurrence based on the naive Bayesian model considering satellite image pixel differences. Ecol. Indic. 2021, 124, 107416. [Google Scholar] [CrossRef]
  54. Zhe, W.; Xigang, X.; Feng, Y. An abnormal phenomenon in entropy weight method in the dynamic evaluation of water quality index. Ecol. Indic. 2021, 131, 108137. [Google Scholar] [CrossRef]
  55. Li, Y.; Zhang, Q.; Wang, L.; Liang, L. Regional environmental efficiency in China: An empirical analysis based on entropy weight method and non-parametric models. J. Clean. Prod. 2020, 276, 124147. [Google Scholar] [CrossRef]
  56. Neil, C.; Spyrakos, E.; Hunter, P.D.; Tyler, A.N. A global approach for chlorophyll-a retrieval across optically complex inland waters based on optical water types. Remote Sens. Environ. 2019, 229, 159–178. [Google Scholar] [CrossRef]
  57. Bonansea, M.; Rodriguez, M.C.; Pinotti, L.; Ferrero, S. Using multi-temporal Landsat imagery and linear mixed models for assessing water quality parameters in Río Tercero reservoir (Argentina). Remote Sens. Environ. 2015, 158, 28–41. [Google Scholar] [CrossRef]
  58. Feng, L.; Hou, X.; Zheng, Y. Monitoring and understanding the water transparency changes of fifty large lakes on the Yangtze Plain based on long-term MODIS observations. Remote Sens. Environ. 2019, 221, 675–686. [Google Scholar] [CrossRef]
  59. Zhou, Q.; Wang, J.; Tian, L.; Feng, L.; Li, J.; Xing, Q. Remotely sensed water turbidity dynamics and its potential driving factors in Wuhan, an urbanizing city of China. J. Hydrol. 2021, 593, 125893. [Google Scholar] [CrossRef]
  60. Li, Y.; Shi, K.; Zhang, Y.; Zhu, G.; Qin, B.; Zhang, Y.; Liu, M.; Zhu, M.; Dong, B.; Guo, Y. Remote sensing of column-integrated chlorophyll a in a large deep-water reservoir. J. Hydrol. 2022, 610, 127918. [Google Scholar] [CrossRef]
  61. Akoglu, H. User’s guide to correlation coefficients. Turk. J. Emerg. Med. 2018, 18, 91–93. [Google Scholar] [CrossRef]
  62. Shi, K.; Zhang, Y.; Liu, X.; Wang, M.; Qin, B. Remote sensing of diffuse attenuation coefficient of photosynthetically active radiation in Lake Taihu using MERIS data. Remote Sens. Environ. 2014, 140, 365–377. [Google Scholar] [CrossRef]
  63. Li, B.; Yang, G.; Wan, R.; Hörmann, G. Dynamic water quality evaluation based on fuzzy matter—Element model and functional data analysis, a case study in Poyang Lake. Environ. Sci. Pollut. Res. 2017, 24, 19138–19148. [Google Scholar] [CrossRef]
  64. Shi, K.; Zhang, Y.; Qin, B.; Zhou, B. Remote sensing of cyanobacterial blooms in inland waters: Present knowledge and future challenges. Sci. Bull. 2019, 64, 1540–1556. [Google Scholar] [CrossRef] [PubMed] [Green Version]
  65. Duan, H.; Zhang, Y.; Zhang, B.; Song, K.; Wang, Z. Assessment of Chlorophyll-a Concentration and Trophic State for Lake Chagan Using Landsat TM and Field Spectral Data. Environ. Monit. Assess. 2007, 129, 295–308. [Google Scholar] [CrossRef] [PubMed]
Figure 1. Study area. (a) Location of the study area. (b) The red points represent the locations of field measurement points at Poyang Lake and Zhelin Reservoir in 2016 and 2019 respectively. Pink triangles represent meteorological stations.
Remotesensing 15 01618 g001
Figure 2. Statistics of Landsat imagery across PLB from 2013 to 2020. (a) Spatial distribution of the total Landsat-8 images across the PLB from 2013 to 2020 coverage; (b) the annual number of available Landsat images; (c) the monthly number of available Landsat images across PLB ((I) Poyang Lake region; (II) Zhelin Reservoir region; (III) Tao River region; (IV) Yangming Lake region).
Remotesensing 15 01618 g002
Figure 3. Scatterplots of TLI (Rrs) calibration between M value and in situ measurement TLI (Rrs) data.
Remotesensing 15 01618 g003
Figure 4. Correlation coefficients between remote sensing reflectance and TLI after different atmospheric correction modules.
Remotesensing 15 01618 g004
Figure 5. Accuracy of four atmospheric correction algorithms on Landsat-8 OLI.
Remotesensing 15 01618 g005
Figure 6. Accuracy validation of TLI model.
Remotesensing 15 01618 g006
Figure 7. (a) Spatial distribution of climatological TLI for the four studied regions on the Poyang Lake Basin (PLB) from the Landsat-8 OLI observations. The annotations “↑” and “↓” represent statistically significant increasing and significant decreasing trends, respectively. Subpanels A to D shows the four studied regions, respectively. (b) represent the variations in annual mean TLI in Poyang Lake Basin. (cf) represent the variations in annual mean TLI in Poyang Lake, Zhelin Reservoir, Tao River, and Yangming Lake, respectively.
Remotesensing 15 01618 g007
Figure 8. The quarterly mean TLI of these studied regions in the Poyang Lake Basin ((ad) represent Quarter 1 to 4) between 2013 to 2020; (e) represents the seasonal variation of mean TLI values in Poyang Lake Basin; (fi) represents the seasonal variation of mean TLI values in Poyang Lake, Zhelin Reservoir, Tao Lake and Yangming Lake, respectively.
Remotesensing 15 01618 g008
Figure 9. Spatial patterns of eutrophic water body proportion in four typical regions: (a) Annual distribution, (b) Monthly distribution, (c) Quarterly distribution, and (d) Pattern distribution between wet and dry seasons.
Remotesensing 15 01618 g009
Figure 10. Monthly mean change of the proportion of eutrophic water bodies and three meteorological factors.
Remotesensing 15 01618 g010
Figure 11. Contribution of drivers on spatial variation of water body eutrophication proportion in typical areas of Poyang Lake Basin using the entropy weight method.
Remotesensing 15 01618 g011
Table 1. Correlation coefficients of multi-band combinations with Chla concentration.
Band CombinationCorrelation CoefficientBand CombinationCorrelation Coefficient
B1/(B3 + B5)−0.6239B2/(B1 + B3)−0.5914
B2/(B3 + B5)−0.6034B3/(B2 + B3)0.5900
(B3 − B2)/(B1 + B2)0.6014(B3 − B2)/(B1 + B3)0.5897
B3/(B1 + B2)0.5993B4/(B1 + B2)0.5855
(B3 − B1)/(B1 + B2)0.5966(B5 − B2)/(B1 − B3)−0.5850
Table 2. Comparison of performance between the existing and proposed TLI-evaluated models based on in situ measurement data.
ModelEquation FormMADRMSDMAPD
Wen, et al. [10] T S I M ( C h l a ) = 48.677 ( R r s ( 561 ) R r s ( 655 ) ) 0.786 4.335.319.39
T S I M ( C h l a ) = 49.479 ( OLI 3 OLI 4 ) 0 . 603 3.744.697.63
Duan, et al. [65] C h l a = 5.5973 × OLI 5 OLI 4 + 6.7069
T S I M ( C h l a ) = 10 × ( 2 . 46 + ln C h l a ln 2 . 5 )
11.2523.4722.92
Hu, et al. [7] A B I = ( OLI 4 OLI 2 ) × λ Green λ Blue λ Red λ Blue ( OLI 5 OLI 2 ) × λ G r e e n λ B l u e λ N I R λ B l u e
T S I = 3.7181 × A B I + 65.179
4.495.339.21
This study T L I = 85.612 × ( O L I 1 / ( O L I 3 + O L I 5 ) ) + 75.511 3.584.438.88
Note: OLI1, OLI3, OLI4, and OLI5 are Landsat-8 near-coastal band, blue band, green band, red band, and near-infrared band, respectively. λGreen, λBlue, λRed, λNIR are the corresponding band wavelengths of Landsat-8.
Disclaimer/Publisher’s Note: The statements, opinions and data contained in all publications are solely those of the individual author(s) and contributor(s) and not of MDPI and/or the editor(s). MDPI and/or the editor(s) disclaim responsibility for any injury to people or property resulting from any ideas, methods, instructions or products referred to in the content.

