

Postfire Forest Regrowth Algorithm Using Tasseled-Cap-Retrieved Indices

Department of Aerospace Information, Space Research and Technology Institute, Bulgarian Academy of Sciences, Str. “Acad. Georgy Bonchev” Bl. 1, 1113 Sofia, Bulgaria
*
Author to whom correspondence should be addressed.
Remote Sens. 2024, 16(3), 597; https://0-doi-org.brum.beds.ac.uk/10.3390/rs16030597
Submission received: 15 December 2023
/
Revised: 27 January 2024
/
Accepted: 1 February 2024
/
Published: 5 February 2024
(This article belongs to the Topic Application of Remote Sensing in Forest Fire)
Abstract
:Wildfires are a common disturbance factor worldwide, especially over the last decade due to global climate change. Monitoring postfire forest regrowth provides fundamental information needed to enhance the management and support of ecosystem recovery after fires. The purpose of this study is to propose an algorithm for postfire forest regrowth monitoring using tasseled-cap-derived indices. A complex approach is used for its implementation, for which a model is developed based on three components—Disturbance Index (DI), Vector of Instantaneous Condition (VIC), and Direction Angle (DA). The final product—postfire regrowth (PFIR)—allows for a quantitative assessment of the intensity of regrowth. The proposed methodology is based on the linear orthogonal transformation of multispectral satellite images—tasseled cap transformation (TCT)—that increases the degree of identification of the three main components that change during a fire—soil, vegetation, and water/moisture—and implies a higher accuracy of the assessments. The results provide a thematic raster representing the intensity of the regrowth classes, which are defined after the PFIR threshold values are determined (HRI—high regrowth intensity; MRI—moderate regrowth intensity; and LRI—low regrowth intensity). The accuracy assessment procedure is conducted using very-high-resolution (VHR) aerial and satellite data from World View (WV) sensors, as well as multispectral Sentinel 2A images. Three different forest test sites affected by fire in Bulgaria are examined. The results show that the classified thematic raster maps are distinguished by a good performance in monitoring the regrowth dynamics, with an average overall accuracy of 62.1% for all three test sites, ranging from 73.9% to 48.4% for the individual forests.
1. Introduction
Global climate change is increasing the frequency of wildfires, resulting in various disturbances to forest ecosystems. The restoration of vegetation and beginning of successional processes, called recovery, are major components of landscape dynamics [1,2]. The monitoring of postfire forest regrowth provides essential information for enhancing the management of and support for ecosystem recovery after wildfires.
The remote sensing methods used in fire research mainly apply vegetation indices (VIs), which indirectly assess the changes that occur in the biophysical characteristics of vegetation after a fire, such as the leaf area index, photosynthetic activity, water content, and moisture stress [3]. Traditionally, VIs have been used for the assessment of disturbances caused by fires [3,4,5,6]. Remote sensing methods based on VI methodologies support the study of the disturbance to forest ecosystems; however, they are not accurate enough to study the recovery processes in forest ecosystems observed after a fire. In the scientific literature, contradictory reports present the effectiveness of spectral indices for monitoring postfire vegetation regrowth [2,3,5,6]. The proposed methodology is based on the linear orthogonal transformation of multispectral satellite images—tasseled cap transformation (TCT) [7,8]—that increases the degree of identification of the three main components that change during a fire—soil, vegetation, and water/moisture—and implies a higher accuracy of the assessments.
The algorithm for postfire forest regrowth monitoring proposed in this paper is based on three components—Disturbance Index (DI) [9], Vector of Instantaneous Condition (VIC) [10], and Direction Angle (DA) [10]. DI images ensure an opportunity to emphasize pixels that vary from average to disturbed forest conditions [9]. According to recent studies, the DI was examined as a comparatively efficient approach to monitoring forest disturbances and recovery processes [11,12,13]. The VIC and DA represent indices that are obtained on the basis of the TCT and were introduced in previous research [10]. Based on the three tasseled cap components—brightness (TCB), greenness (TCG), and wetness (TCW)—a vector describing the current condition of the forest ecosystem is obtained, namely, the VIC. The VIC represents the condition and the connection among the three main components of a studied ecosystem, as well as quantitatively displaying the correlation among the components in the case of a disaster (e.g., fire). The DA is the angle between the TCG and VIC [10]. The DA represents the deviation from the pre-fire forest ecosystem condition. It enables the evaluation of the rate of regrowth of the TCG.
The aim of this paper is to propose a model that utilizes the traditionally used DI in addition to those introduced by the authors, VIC and DA, which allows for a quantitative assessment of the intensity of regrowth in various forest ecosystems. The final product—postfire regrowth (PFIR)—provides a thematic raster representing the intensity of regrowth classes. The recovery classes are defined after the determination of the threshold values for the PFIR: HRI—high regrowth intensity; MRI—moderate regrowth intensity; and LRI—low regrowth intensity. Three different forest test sites affected by fire in Bulgaria were examined. The accuracy assessment procedure was performed based on very-high-resolution (VHR) aerial and satellite images and Sentinel 2A images.
2. Materials and Methods
2.1. Study Area
The proposed algorithm for postfire forest regrowth was implemented and tested on the territory of the three test sites with forests that had been disturbed by fires. The selected test sites are located next to the town of Ardino and the villages of Bistritsa and Perperek, Bulgaria (Figure 1).
2.1.1. Ardino Test Site
The test site, next to the town of Ardino, Bulgaria, is located in the southeastern part of Rhodope Mountains at 660–990 m above sea level (a.s.l.) (Figure 1b). A wildfire broke out on 29 July 2016 and burned an area of 100 ha with coniferous forests. The most common tree species in the coniferous forests are Scots pine (Pinus sylvestris L.) and black pine (Pinus nigra Arn.). The mean value of the slope inclination is 16°, and the maximum is 27°, which conditions allow for the development of shallow Luvisols. The climate in the region is continental Mediterranean with mountainous elements, and the forests in the Ardino test site are Mediterranean mountain forests [14].
2.1.2. Bistritsa Test Site
The Bistritsa test site is located on the northeastern slope of Vitosha Mountain, next to the capital city Sofia, at 1430–1760 m a.s.l. (Figure 1c). The test site covers one of the first nature reserves in Bulgaria—Bistrishko Branishte, established to preserve the typical old spruce forests in the region. There are seven different forms of the European (Norway) spruce (Picea abies) on the territory of the nature reserve Bistrishko Branishte. A wildfire broke out in the area of Bistrishko Branishte on 1 July 2012 and affected 70 ha mostly dry and dead forest vegetation (resulting from a tornado in 2001 and a bark beetle outbreak in 2004). The fire was devastating and the forest stands were almost completely destroyed, which predetermined the worst vegetation status of the forest ecosystems amongst the test sites examined in this study. The slopes are steep (mean value of slope inclination 21°, maximum 33°), and the soils are highly erodible and shallow Leptosols. The climate is mountainous and according to the Köppen climate classification it is characterized as Boreal; therefore, the forests are classified as Boreal mountain forests [14,15].
2.1.3. Perperek Test Site
The test site next to Perperek village is situated in the northeastern part of Rhodope Mountains, 15 km from the city of Kardzhali (Figure 1d). A wildfire took place on 21 November 2015 and affected an area of 30 ha with mixed and coniferous forests. The mixed forests are represented by Turkey oak (Quercus cerris L.), hornbeam (Quercus frainetto Ten), and Oriental hornbeam (Carpinus orientalis Mill.), with Mediterranean elements in places with secondary origin. A massive afforestation with black pine coniferous forest was performed in the 1950s due to erosion processes and the expansion of bare lands. The Perperek test site has a lower altitude and gentler slopes (mean value of slope inclination of 10° and maximum 17°) than the other test sites. The soils are Chromic Cambisols. The climate is continental Mediterranean and the forests are Mediterranean hill forests [14,15]. Although the climate conditions are similar to those of the Ardino test site, the gentler slopes define lower vulnerability to soil erosion and more favorable conditions for vegetation regrowth. This test site exhibited the lowest damage after the fire and optimal environmental conditions for forest regrowth [14].
2.2. Data Used
2.2.1. Satellite Data Used for Postfire Regrowth
Postfire forest regrowth monitoring was conducted on the territory of the three test sites using Landsat and Sentinel 2 data. The forest regrowth assessment was performed for the study period 2012–2022 taking into account the vegetation period of the forests (growing season) as well as the absence of clouds and cloud shadows over the study areas. Landsat (ETM+ and OLI) with spatial resolution of 30 m and Sentinel 2A satellite imageries (Table 1) with spatial resolution ranging between 10 m and 60 m were freely downloaded from the US Geological Survey—Earth Explorer [16], and Copernicus Open Access Hub [17] on behalf of the regrowth monitoring.
2.2.2. Data Used for PFIR Threshold Values Determination and Accuracy Assessment Procedure
For the purpose of the PFIR threshold values determination and accuracy assessment procedure, VHR aerial and satellite optical data were utilized as well as multispectral Sentinel 2A images (Table 2).
The spatial resolution of the aerial images is 0.4 m. In addition to the aerial images, VHR satellite data from World View (WV) (2 and 3) sensors of MAXAR technologies were used (Table 2) with spatial resolution ranging between 0.6 m and 2 m. The VHR data processing was conducted using the extensive cloud-based Earth Observation platform Sentinel-Hub (c), provided by “Synergise” (Slovenia).
2.3. Methodology
2.3.1. PFIR Workflow Description
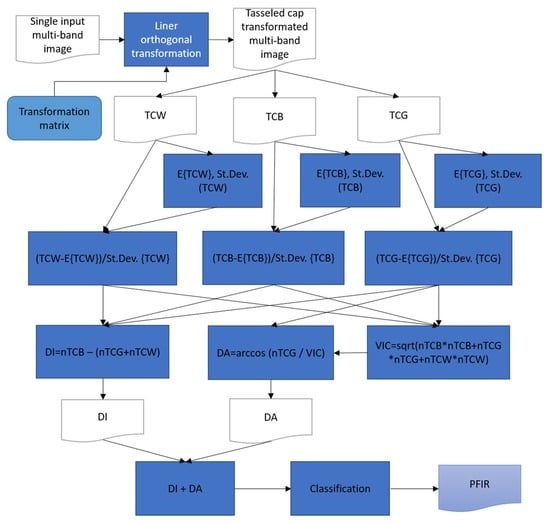
The aim of the PFIR is to monitor the recovery in the forest ecosystems after fire. To achieve this goal, a complex approach is used; for the implementation of this, a model based on three components, DI, VIC, and DA, has been developed. The PFIR algorithm represents the series of processing steps needed to derive the PFIR. It uses Sentinel 2 images (replaced by Landsat 7 ETM+ and Landsat 8 OLI for years before Sentinel 2).
The different operations are described in the following sections.
Input Data
PFIR uses Landsat 7 ETM+, Landsat 8 OLI, and Sentinel 2 A stacked multi-band images as input data. Landsat 7 ETM+ stacked multi-band images comprise band (B) B1, B2, B3, B4, B5, and B7. Landsat 8 OLI—B2, B3, B4, B5, B6, and B7. Sentinel 2A stacked images use the following bands—B1, B2, B3, B4, B5, B6, B7, B8, B8A, B9, B10, B11, and B12. If needed, the spectral bands used as input data could be resampled to 10/20/30 m resolution. However, for the purpose of the regrowth monitoring in this research, this is not the case.
TCT
The aim of this step is to apply TCT to the input multi-band images. Different sensors (Landsat 7 ETM+, Landsat 8 OLI, and Sentinel 2 A) use different transformation matrices [18,19,20] fixed only to them.
The coefficients for orthogonal transformations of Landsat 7 ETM+ are derived by Huang et al. [18] as follows:
TCB = 0.356*B1 + 0.397*B2 + 0.390*B3 + 0.697*B4 + 0.229*B5 + 0.160*B7
TCG = −0.334*B1 − 0.354*B2 − 0.456*B3 + 0.697*B4 − 0.024*B5 − 0.263*B7
TCW = 0.263*B1 + 0.214*B2 + 0.093*B3 + 0.066*B4 − 0.763*B5 − 0.539*B7
The coefficients for orthogonal transformations of Landsat 8 OLI are derived by Baig et al. [19] as follows:
TCB = 0.3029*B2 + 0.2786*B3 + 0.4733*B4 + 0.5599*B5 + 0.508*B6 + 0.1872*B7
TCG = −0.2941*B2 − 0.243*B3 − 0.5424*B4 + 0.7276*B5 + 0.0713*B6 − 0.1608*B7
TCW = 0.1511*B2 + 0.1973*B3 + 0.3283*B4 + 0.3407*B5 − 0.7117*B6 − 0.4559*B7
The coefficients for orthogonal transformations of Sentinel 2 are derived by Nedkov [20] as follows:
TCB = 0.0356*B1 + 0.0822*B2 + 0.1360*B3 + 0.2611*B4 + 0.2964*B5 + 0.3338*B6 +0.3877*B7 + 0.3895*B8 + 0.0949*B9 + 0.0009*B10 + 0.3882*B11 + 0.1366*B12 + 0.4750*B8A
TCG = −0.0635*B1 − 0.1128*B2 − 0.1680*B3 − 0.3480*B4 − 0.3303*B5 + 0.0852*B6 +0.3302*B7 + 0.3165*B8 + 0.0467*B9 − 0.0009*B10 − 0.4578*B11 − 0.4064*B12 + 0.3625*B8A
TCW = 0.0649*B1 + 0.1363*B2 + 0.2802*B3 + 0.3072*B4 − 0.5288*B5 − 0.1379*B6 − 0.0001*B7 − 0.0807*B8 − 0.0302*B9 + 0.0003*B10 − 0.4064*B11 − 0.5602*B12 − 0.1389*B8A
The result is TC transformed multi-band images containing three layers—TCB, TCG, and TCW. The next step is decomposition of each of the TC components.
Normalization
The aim of this step is calculation of the normalized values of TC components. Firstly, calculation of the mean and standard deviations is conducted. Secondly, calculation of the normalized values of the TC components is performed. These spectral normalization steps should be taken in order to normalize radiometric change. The normalization is conducted as follows:
where E{TCB}, E{TCG}, and E{TCW} represent the mean TCB, TCG, and TCW of the mature forest class, respectively. St.Dev (TCB), St.Dev (TCG), and St.Dev (TCW) are the corresponding standard deviations within the mature forest class. Hence, nTCB, nTCG, and nTCW indicate the TCB, TCG, and TCW normalized by the statistics of a mature forest class, respectively. The mature forest class is identified using the forest map (forest dominant leaf type raster—Copernicus high-resolution layers).
nTCW = (TCW − E{TCW})⁄(St.Dev(TCW))
nTCB = (TCB − E{TCB})⁄(St.Dev(TCB))
nTCG = (TCG − E{TCG})⁄(St.Dev(TCG))
DI
The aim of this step Is calculation of the DI. After normalization, the three component indices were combined linearly to determine the DI [9] as follows:
VIC
The aim of this step is calculation of the VIC. Based on the normalized values of the TC components, the calculation of the VIC [10] is conducted as follows:
The VIC calculation is a step towards obtaining the DA.
DA
After calculation of the VIC, the DA generation follows. The DA represents the deviation angle between the TCG and the VIC [10]:
Classification
The aim of this step is to combine the DI and the DA with raster calculations and to classify the output raster. The PFIR sums the values of the DI and the DA. The result provides thematic raster classified by the intensity of recovery—the PFIR. The PFIR varies widely—in the present study the values ranged between −2.6 and +7.6. The lower the value, the higher the regrowth intensity, and vice versa, the greater the value, the lower the regrowth intensity.
2.3.2. PFIR Threshold Values Determination and Accuracy Assessment Procedure
VHR aerial and satellite images (Table 2) and Sentinel 2A images were used to determine the threshold values of the PFIR and to assess its accuracy. The procedure follows several steps:
- The forest regrowth intensity was identified by visual interpretation of VHR images between two dates far enough apart to observe progress in forest vegetation regrowth and expert knowledge (Table 2). Sample point locations representative for the intensity of the forest regrowth were selected on each of the acquired VHR images. The number of sample points was adjusted to the area of the individual test sites. However, due to intra-categorical heterogeneity for some categories, the number of samples differs. More samples were used for the categories where there isa possibility of error in the interpretation. Areas with three distinct categories of regrowth intensity were identified: areas with high regrowth intensity (HRI), moderate regrowth intensity (MRI), and low regrowth intensity (LRI) (Figure 2, Table 3). In the Bistritsa test site, the categories of regrowth intensity were difficult to differentiate only by visual interpretation. For that reason, for this test site, the normalized difference vegetation index (NDVI) was calculated to facilitate the differentiation in the individual classes (Figure 2d).
- 2.
- After that, the PFIR was calculated on Sentinel 2A images, acquired on the nearest to the later after fire VHR date. The PFIR values in each sample point location were extracted for each test site.
- 3.
- Afterwards, a matrix was created with the number of pixels categorized into each of the categories. The range of the PFIR values was divided by a step of 0.5 to obtain representative values for each of the three categories. The number of sample points falling into each of the representatives was counted and summed for each test site. The thresholds between the three categories (HRI, MRI, and LRI) are where the number of points between two consecutive categories is equal (Table 4).
The PFIR values of 61% of the sample points categorized by the visual interpretation of VHR images as points with HRI are below 1. A total of 81.6% of the sample points categorized as points with MRI are with PFIR values ranging between 1 and 2.5, and 73% of the sample points categorized as points with LRI have PFIR values above 2.5.
- 4.
- Accuracy assessment procedure is based on the same VHR and Sentinel 2A images. The classification accuracy was calculated only on the classified Sentinel 2A images and only images from this sensor were coupled with the VHR reference data in the accuracy assessment procedure. Sample polygons categorized by visual interpretation into areas with HRI, MRI, and LRI were delineated on the VHR satellite imageries acquired on the later postfire dates, which serves as reference data in the accuracy assessment procedure. Similarly, we tried to adjust the area of the sample polygons to the area of the test sites, considering the heterogeneity of the territory. The PFIR rasters calculated based on the Sentinel 2A images were used as classified data. The classified PFIR rasters were extracted by the sample polygons representative for each of the three categories, showing the intensity of regrowth (HRI, MRI, and LRI). The generated outputs were used for accuracy assessment calculations in an error matrices for each test site (Table 5) [21]. The accuracy metrics calculated include overall accuracy (OA), error of omission (EO), error of commission (EC), producer’s accuracy (PA), and user’s accuracy (UA).
Each error matrix consists of an N × N array where N is the number of classes/pixels in the data. The columns represent the reference data (the ground truth) and the rows the classified data (PFIR) [21]. The OA shows the proportion of correctly classified reference data expressed as a percentage, with 100% accuracy being a perfect classification [21]. The EO refers to the reference sites and the EC refers to the classified results. EO and EC are calculated by inspecting the reference and classified sites for incorrect classifications. For each class, separate EO and EC calculations were made. The sum of incorrect EO classifications in the columns of the error matrix was divided by the total number of reference sites, and the sum of incorrect EC classifications in the rows of the error matrix was divided by the total number of classified sites [21]. PA indicates how often the actual on-site features are correctly represented on the classified map, and UA indicates how often that class actually appears on the map [21].
3. Results
3.1. PFIR for Ardino Test Site
Using the proposed algorithm PFIR for Ardino test site, the intensity of regrowth was calculated for the period of the monitoring—2016–2022 (Figure 3). The PFIR was generated several days before the fire (11 July 2016) (Figure 3a) and immediately after the fire (5 August 2016) (Figure 3b) in order to assess the prefire forest condition as well as the postfire disturbances due to the fire event. The same methodology for postfire regrowth was applied to pre- and postfire imageries aiming to provide a starting point for the monitoring and making the results comparable. Figure 3c–h show the PFIR for the study period 2017–2022. The PFIR classified thematic rasters display three classes indicating the regrowth intensity rate—HRI, MRI, and LRI.
3.2. PFIR for Bistritsa Test Site
The PFIR for Bistritsa test site was calculated for the study period 2012–2022 (Figure 4). The PFIR was obtained two days before the fire event (29 June 2012) (Figure 4a) and a few days after the fire (15 July 2012) (Figure 4b) aiming to assess the pre- and postfire forest condition and disturbances. Figure 4c–k exhibit the PFIR for the time of the monitoring—2013–2022.
3.3. PFIR for Perperek Test Site
The PFIR for Perperek test site was obtained for the period 2015–2022 (Figure 5). The PFIR was generated the same way before the fire (7 November 2015) (Figure 5a) and after the fire (25 December 2015) (Figure 5b) for assessment of pre-fire condition and postfire forest ecosystem disturbances using the proposed methodology. Figure 5c–i show the results for PFIR for the monitoring period—2016–2022.
3.4. Accuracy Metrics
The overall accuracy for all of the three test sites is 62.1%, ranging from 48.4% for the Perperek test site and 73.9% for the Ardino test site. The LRI class of the Ardino test site is distinguished by the lowest EO. For the rest of the regrowth intensity classes in the other test sites, this type of error is significantly larger, except for the HRI, as well as in the Ardino test site (Table 6).
In general, with less than 40% EO, the LRI class stands out, resulting in an average value of 24.5% for this type of error. The EO is highest for the MRI class, which is expected because the intermediate classes are generally the most difficult to differentiate. The lowest EC values are observed for the Bistritsa (4%) and Ardino (8.8%) test sites. For the HRI in Ardino, both types of errors are equivalent and much smaller in value compared to those of the other two test sites. The low EC value at MRI for Bistritsa test site results in lower EC overall for all three test sites (17.6%). The highest EC has Bistritsa test site for both extreme classes and Perperek site for the HRI class (Table 4).
The PFIR is distinguished by very good PA in the classification of HRI (93.5%) and LRI (75.5%). For the HRI, the Bistritsa test site has PA of 100%, Perperek with PA of 98.2%, and Ardino—82.4%. For the LRI classification, Ardino has PA of 95.5%. The UA is highest for MRI classification, as for the Bistritsa test site this value is the highest (96%), and for the Perperek test site it is 83.7%. Similarly, the UA for HRI classification is high in Ardino (91.2%), as well as LRI classification in Perperek (79.9%) (Table 6).
4. Discussion
4.1. Assessment of Postfire Regrowth Dynamics Using PFIR
In Figure 3a, the territory of almost the entire fire area is classified with HRI, which determines better vegetation status of the forest ecosystems several days before the fire. A large part of the test site is classified with LRI, distinguishing the burnt areas a few days after the fire (Figure 3b) and showing that the Ardino test site was significantly affected by the fire [19]. The largest part of the test area is classified with HRI and MRI in Figure 3c—one year after the fire, typically for the initial regrowth process—starting with herbaceous and shrubby vegetation [3,14,22]. Sanitary logging was conducted in 2018 removing the damaged forest stands [14], resulting in LRI over the large part of the test site (Figure 3d). In the next few years (Figure 3e–h), the PFIR exhibits less favorable condition for intensive regrowth.
The worst vegetation status of the forest ecosystems (resulting from a tornado and bark beetle outbreak in the previous years) is observed in Bistritsa test site, which is verified by PFIR raster before the fire (Figure 4a). The completely dry forests were the perfect fuel for the wildfire, benefited from hot and dry climatic conditions [14]. The most affected by the fire forests are those of the Bistritsa test site as well, distinguished by LRI over the entire test site (Figure 4b). The PFIR after the wildfire demonstrates the completely destroyed forests. Although there was no sanitary logging in Bistritsa test site, due to its nature reserve protective status, the PFIR exhibits low recovery rates during the first years of the monitoring (Figure 4c–e). The post-ire regrowth vegetation is presented predominantly by annual herbaceous plants [14] mainly influencing the PFIR fluctuations during the study period of the monitoring (Figure 4f–l).
Ecosystems with limited water resources and low gross primary productivity, such as grassland ecosystems, exhibit higher dependency on hydro-climatic changes influencing vegetation status. They are distinguished by essential productivity reduction under drought impact [23]. This is the reason for the higher dynamics in the PFIR in the Bistritsa test site. Assessing the impact of local forest ecology on the postfire regrowth dynamics using DI, Chen et al., 2022 [12] found a correlation between DI and topographic and climatic factors. In mountainous areas, colder habitats are distinguished by lower recovery rates than warmer ones. The results of postfire regrowth dynamics monitoring in this article confirm the results of Chen et al., 2022 [12]. Similarly, the results obtained in this study confirm that forest regrowth depends on climatic factors [14,24].
The PFIR exhibits HRI distinguishing good vegetation status of the study forests in the Perperek test site before the fire event (Figure 5a). After the fire, almost the entire test site area is distinguished by LRI, which confirms the negative ecologic impact of the wildfire over the forests (Figure 5b). The PFIR demonstrates optimal condition for regrowth dynamics (Figure 5c–i). In particular areas, the PFIR exhibits LRI due to sanitary logging in 2017 (Figure 5d) [14]. Burnt forest stands were removed in some small areas during the sanitary logging [14] and the PFIR indicates them with LRI that persists during the entire period of the regrowth monitoring (Figure 5d–i).
The PFIR distinguishes areas with sanitary logging, indicating them with LRI. However, the PFIR could not distinguish if the regrowth is due to forest vegetation regrowth or other types of vegetation (herbaceous, shrubby vegetation).
4.2. Accuracy Metrics Discussion
Errors of omission represent the real-life objects that were not correctly classified. The results of the present study show that the greater the heterogeneity, the greater the EO is. These observations were confirmed also on the test site level. The lowest EO was found at the test site with the most homogenous environmental conditions throughout the territory and, hence, the most uniformly distributed regrowth categories (Bistritsa test site). Due to the cold and wet conditions for vegetation development, the regrowth intensity in Bistritsa is slower compared with the other test sites. In addition, the greatest part of the territory was identified namely with MRI on the date used for accuracy assessment procedure (Table 2, Figure 4h), which undoubtedly influenced the lower EO for this test site. On the contrary, the greatest EO for the Bistritsa test site was found in the HRI class, which was the class with the lowest territorial representation on the date used for accuracy assessment procedure (Figure 4h). EO increased with the heterogeneity in the environmental conditions and, hence, in the intensity of forest regrowth. Perperek was the test site with the most preserved forest stands after the fire outbreak and the most diverse environmental conditions for forest regrowth after that (Figure 5i). This effect can be observed also in the results shown in Table 6. The EO in Perperek was the greatest for all three regrowth categories amongst the studied test sites.
In general, it is observed that in assessing the errors, the values for the individual test sites are mostly influenced by the number of sample points used in the determination of threshold values. An exception is the EC value at MRI for Bistritsa test site. In the assessment of accuracies, this trend is not always observed. However, PA and UA are complements of the OE and CE. Hence, it can be concluded that the results obtained about the individual test sites should be interpreted carefully.
Taking into consideration the differences in the percentage reliability of the individual threshold categories, the lowest accuracy can be predicted for the classification of the HRI and the highest—for MRI. Barely 61% of the test points with a PFIR value below 1 are determined as HRI, whereas the confidence in the classification of MRI is 81.6% (Table 4). These expectations were confirmed by the results after the calculation of the different accuracy metrics (Table 6).
The results show that the classified raster thematic maps are distinguished by a good performance in monitoring the regrowth intensity with an average overall accuracy of 62.1%. The PFIR is distinguished by very good PA in the classification of HRI (93.5%) and LRI (75.5%). The UA is highest for MRI classification. Due to possible influence of the number of sample points used in the determination of threshold values, the obtained results related to the accuracy metrics for the individual test sites should be interpreted carefully. However, the final results for the accuracy metrics, including all three test sites, normalize these differences and can be taken as representative of the PFIR performance generally.
5. Conclusions
This study introduces a unique and novel algorithm for monitoring postfire forest regrowth using tasseled-cap-retrieved indices. The proposed model, utilizing the well-known DI, as well as VIC and DA, introduced by the authors, allows for a quantitative assessment of the intensity of regrowth in various forest ecosystems. The results provide a thematic raster—PFIR—performing the intensity of regrowth classes, determined after PFIR threshold values qualification (HRI, MRI, and LRI).
Postfire regrowth monitoring was performed and tested on the territory of three test sites with various forest environment in Bulgaria for the study period 2012–2022. For the purpose of this particular study, Landsat and Sentinel 2 imageries have been utilized. However, satellite data by various sensors could be applied as long as there is a TC transformation matrix for them. The objective of this paper was not to compare the performance of the method across different sensors. However, this could be a subject of further research. The results for PFIR exhibit good performance assessing the pre-fire forest condition as well as postfire disturbances. Furthermore, PFIR could be a subject of further research, aiming to assess the postfire disturbances defined after threshold values determination.
Author Contributions
Conceptualization, N.S. and D.A.; methodology, N.S.; software, N.S.; validation, D.A.; formal analysis, N.S. and D.A.; investigation, N.S. and D.A.; resources, N.S. and D.A.; data curation, N.S. and D.A.; writing—original draft preparation, N.S. and D.A.; writing—review and editing, N.S. and D.A.; visualization, N.S. and D.A.; supervision, D.A.; project administration, N.S.; funding acquisition, N.S. and D.A. All authors have read and agreed to the published version of the manuscript.
Funding
This research was funded by the European Space Agency under the ESA contract no. 4000134290/21/NL/CBi and project “Forest Disturbance Inventory using Remote Sensing (FoReS)”. The project was supported by ESA Network of Resources Initiative.
Data Availability Statement
The data presented in this study are available on request from the corresponding author. The data are not publicly available due to privacy.
Acknowledgments
We thank also for the provided sponsorship and access to data and services through Sentinel Hub platform; Maxar and European Space Imaging for provision of World View high-resolution optical imagery; U.S. Geological Survey and European Space Agency for the free access to Landsat and Sentinel 2 satellite data; and the Ministry of Agriculture of Republic of Bulgaria for the VHR aerial imagery.
Conflicts of Interest
The authors declare no conflicts of interest.
References
- Kennedy, R.E.; Yang, Z.; Cohen, W.B.; Pfaff, E.; Braaten, J.; Nelson, P. Spatial and Temporal Patterns of Forest Disturbance and Regrowth within the Area of the Northwest Forest Plan. Remote Sens. Environ. 2012, 122, 117–133. [Google Scholar] [CrossRef]
- Pickell, P.D.; Hermosilla, T.; Frazier, R.J.; Coops, N.C.; Wulder, M.A. Forest recovery trends derived from Landsat time series for North American boreal forests. Int. J. Remote Sens. 2016, 37, 138–149. [Google Scholar] [CrossRef]
- Viedma, O.; Meliá, J.; García-Haro, J.; Segarra, D. Monitoring forest regeneration rates after fires with multitemporal Landsat TM imagery. EARSeL Adv. Remote Sens. 1996, 4, 146–154. [Google Scholar]
- Crabtree, R.; Potter, C.; Mullen, R.; Sheldon, J.; Huang, S.; Harmsen, J.; Rodman, A.; Jean, C. A modeling and spatio-temporal analysis framework for monitoring environmental change using NPP as an ecosystem indicator. Remote Sens. Environ. 2009, 113, 1486–1496. [Google Scholar] [CrossRef]
- Dimitrov, P.; Gikov, A. Identification and evaluation of traces of fires in Rila mountain using spectral indices from Landsat data. In Proceedings of the Fifth Scientific Conference with International Participation, Space, Ecology, Safety, Sofia, Bularia, 2–4 November 2009; pp. 142–149. [Google Scholar]
- Chen, W.; Moriya, K.; Sakai, T.; Koyama, L.; Cao, C. Monitoring of post-fire forest recovery under different restoration modes based on time series Landsat data. Eur. J. Remote Sens. 2014, 47, 153–168. [Google Scholar] [CrossRef]
- Kauth, R.; Thomas, G. The Tasseled Cap—A graphic description of the spectral-temporal development of agricultural crops as seen by Landsat. In Symposium of Machine Processing of Remotely Sensed Data; West Lafayette’ Purdue University Lab.: West Lafayette, IN, USA, 1976. [Google Scholar]
- Crist, E.; Cicone, R. A physicaly-based transformation of Thematic Mapper data—The TM Tasseled Cap. IEEE Trans. Geosci. Remote Sens. 1984, 22, 256–263. [Google Scholar] [CrossRef]
- Healey, S.; Cohen, W.; Yang, Z.; Krankina, O. Comparison of Tasseled Cap-based Landsat data structures for use in forest disturbance detection. Remote Sens. Environ. 2005, 97, 301–310. [Google Scholar] [CrossRef]
- Stankova, N.; Nedkov, R. Model for quantitative assessment of Disturbance Index and Vector of Instantaneous Condition of an ecosystem after fire based on aerospace data. In Proceedings of the Eleventh Scientific Conference with International Participation, Space, Ecology, Safety, Sofia, Bularia, 4–6 November 2015; pp. 292–297. [Google Scholar]
- Thayn, J.B. Using a remotely sensed optimized Disturbance Index to detect insect defoliation in the Apostle Islands, Wisconsin, USA. Remote Sens. Environ. 2013, 136, 210–217. [Google Scholar] [CrossRef]
- Chen, X.; Chen, W.; Xu, M. Remote-Sensing Monitoring of Postfire Vegetation Dynamics in the Greater Hinggan Mountain Range Based on Long Time-Series Data: Analysis of the Effects of Six Topographic and Climatic Factors. Remote Sens. 2022, 14, 2958. [Google Scholar] [CrossRef]
- Masek, J.; Huang, C.; Wolfe, R.; Cohen, W.; Hall, F.; Kutler, J.; Nelson, P. North American forest disturbance mapped from a decadal Landsat record. Remote Sens. Environ. 2008, 112, 2914–2926. [Google Scholar] [CrossRef]
- Avetisyan, D.; Stankova, N.; Dimitrov, Z. Assessment of Spectral Vegetation Indices Performance for Post-Fire Monitoring of Different Forest Environments. Fire 2023, 6, 290. [Google Scholar] [CrossRef]
- Topliisky, D. Climate of Bulgaria; Amstels: Sofia, Bulgaria, 2006; pp. 298–309. (In Bulgarian) [Google Scholar]
- USGS. Earth Explorer. Available online: https://earthexplorer.usgs.gov/ (accessed on 22 October 2022).
- Copernicus Open Access Hub. Available online: https://scihub.copernicus.eu/ (accessed on 22 October 2022).
- Huang, C.; Wylie, B.; Homer, C.; Zylstra, G. Derivation of a tasseled cap transformation based on Landsat 7 at-satellite reflectance. Int. J. Remote Sens. 2002, 23, 1741–1748. [Google Scholar] [CrossRef]
- Baig, M.; Zhang, L.; Shuai, T.; Tong, Q. Derivation of a tasseled cap transformation based on Landsat 8 at-satellite reflectance. Remote Sens. Lett. 2014, 5, 423–431. [Google Scholar] [CrossRef]
- Nedkov, R. Orthogonal transformation of segmented images from the satellite Sentinel-2. Comptes Rendus L’Academie Bulg. Sci. 2017, 70, 687–692. [Google Scholar]
- Olofsson, P.; Foody, G.M.; Herold, M.; Stehman, S.V.; Woodcock, C.E.; Wulder, M.A. Good practices for estimating area and assessing accuracy of land change. Remote Sens. Environ. 2014, 148, 42–57. [Google Scholar] [CrossRef]
- Hislop, S.; Jones, S.; Soto-Berelov, M.; Skidmore, A.K.; Haywood, A.; Nguyen, T. Using Landsat Spectral Indices in Time-Series to Assess Wildfire Disturbance and Recovery. Remote Sens. 2018, 10, 460. [Google Scholar] [CrossRef]
- Avetisyan, D.; Borisova, D.; Velizarova, E. Integrated Evaluation of Vegetation Drought Stress through Satellite Remote Sensing. Forests 2021, 12, 974. [Google Scholar] [CrossRef]
- Wilson, A.M.; Latimer, A.M.; Silander, J.A. Climatic controls on ecosystem resilience: Postfire regeneration in the Cape Floristic Region of South Africa. Proc. Natl. Acad. Sci. USA 2015, 112, 9058–9063. [Google Scholar] [CrossRef] [PubMed]
Figure 1.
(a) Overall view of the test site locations on the territory of Bulgaria; (b) aerial images of Ardino, 2017; (c) Bistritsa, 2013; (d) Perperek, 2017, after the fires. The red line displays the perimeter of the fire.
Figure 1.
(a) Overall view of the test site locations on the territory of Bulgaria; (b) aerial images of Ardino, 2017; (c) Bistritsa, 2013; (d) Perperek, 2017, after the fires. The red line displays the perimeter of the fire.

Figure 2.
Sample point locations representative for the three distinct categories of regrowth intensity (HRI, MRI, and LRI) in each of the test sites: Ardino (a,b), Bistritsa (c,d), and Perperek (e,f).
Figure 2.
Sample point locations representative for the three distinct categories of regrowth intensity (HRI, MRI, and LRI) in each of the test sites: Ardino (a,b), Bistritsa (c,d), and Perperek (e,f).

Figure 3.
PFIR for Ardino test site for the study period 2016–2022. (a) Before the fire—11 July 2016; (b) after the fire—5 August 2016; (c–h) PFIR for the study period 2017–2022. HRI—high regrowth intensity, MRI—moderate regrowth intensity, LRI—low regrowth intensity.
Figure 3.
PFIR for Ardino test site for the study period 2016–2022. (a) Before the fire—11 July 2016; (b) after the fire—5 August 2016; (c–h) PFIR for the study period 2017–2022. HRI—high regrowth intensity, MRI—moderate regrowth intensity, LRI—low regrowth intensity.


Figure 4.
PFIR for Bistritsa test site for the study period 2012–2022. (a) Before the fire—29 June 2012; (b) after the fire—15 July 2012; (c–l) PFIR for the period of monitoring 2013–2022. HRI—high regrowth intensity, MRI—moderate regrowth intensity, LRI—low regrowth intensity.
Figure 4.
PFIR for Bistritsa test site for the study period 2012–2022. (a) Before the fire—29 June 2012; (b) after the fire—15 July 2012; (c–l) PFIR for the period of monitoring 2013–2022. HRI—high regrowth intensity, MRI—moderate regrowth intensity, LRI—low regrowth intensity.


Figure 5.
PFIR for Perperek test site for the study period 2016–2022. (a) Before the fire—7 November 2015; (b) after the fire—25 December 2015; (c–i) PFIR for the study period 2016–2022. HRI—high regrowth intensity, MRI—moderate regrowth intensity, LRI—low regrowth intensity.
Figure 5.
PFIR for Perperek test site for the study period 2016–2022. (a) Before the fire—7 November 2015; (b) after the fire—25 December 2015; (c–i) PFIR for the study period 2016–2022. HRI—high regrowth intensity, MRI—moderate regrowth intensity, LRI—low regrowth intensity.


Table 1.
Satellite data used for postfire regrowth monitoring.
| Ardino | Bistritsa | Perperek | |
|---|---|---|---|
| 29 June 2012 | |||
| 15 July 2012 | |||
| Landsat 7 ETM+ | 19 August 2013 | ||
| 5 July 2014 | |||
| 8 July 2015 | |||
| Landsat 8 OLI | 7 November 2015 | ||
| 25 December 2015 | |||
| 11 July 2016 | |||
| 5 August 2016 | 13 July 2016 | 21 August 2016 | |
| 15 July 2017 | 27 August 2017 | 15 July 2017 | |
| Sentinel 2A | 24 August 2018 | 1 September 2018 | 29 August 2018 |
| 29 August 2019 | 12 August 2019 | 24 August 2019 | |
| 28 August 2020 | 5 September 2020 | 23 August 2020 | |
| 23 August 2021 | 1 August 2021 | 18 August 2021 | |
| 28 August 2022 | 22 July 2022 | 18 August 2022 |
Table 2.
Data used in the PFIR threshold values determination and accuracy assessment procedure.
| Test Site | Fire Date | VHR Aerial Data Soon after Fire Date | VHR Satellite Data (WV02, WV03) Later after Fire Date | S2A Data |
|---|---|---|---|---|
| Ardino | 29 July 2016 | 2017 | 4 August 2021 | 3 August 2021 |
| Bistritsa | 1 July 2012 | 2013 | 18 September 2018 | 1 September 2018 |
| Perperek | 21 November 2015 | 2017 | 17 June 2022 | 14 June 2022 |
Table 3.
Number of the sample points and area of the sample polygons used for each individual postfire regrowth category in the different test sites (LRI—low regrowth intensity; MRI—moderate regrowth intensity; HRI—high regrowth intensity).
Table 3.
Number of the sample points and area of the sample polygons used for each individual postfire regrowth category in the different test sites (LRI—low regrowth intensity; MRI—moderate regrowth intensity; HRI—high regrowth intensity).
| Post-Fire Regrowth | |||||||||
|---|---|---|---|---|---|---|---|---|---|
| Bistritsa (70 ha) | Ardino (100 ha) | Perperek (30 ha) | |||||||
| LRI | MRI | HRI | LRI | MRI | HRI | LRI | MRI | HRI | |
| Sample points (num) | 10 | 10 | 10 | 19 | 18 | 18 | 12 | 10 | 13 |
| Sample polygons (ha) | 2.38 | 3.77 | 2.29 | 20.94 | 5.64 | 7.64 | 2.11 | 2.73 | 9.16 |
Table 4.
Matrix for determination of PFIR threshold values containing the number of pixels categorized into each of the classes (HRI, MRI, and LRI) divided into pre-defined groups according the PFIR values and confidence in the classification for each of the classes.
Table 4.
Matrix for determination of PFIR threshold values containing the number of pixels categorized into each of the classes (HRI, MRI, and LRI) divided into pre-defined groups according the PFIR values and confidence in the classification for each of the classes.
| PFIR Values | |||||||||||
|---|---|---|---|---|---|---|---|---|---|---|---|
| <0 | 0–0.5 | 0.5–1 | 1–1.5 | 1.5–2 | 2–2.5 | 2.5–3 | 3–3.5 | 3.5–4 | 4–4.5 | >4.5 | |
| HRI | |||||||||||
| Ardino | 7 | 4 | 3 | 3 | 1 | 0 | 0 | 0 | 0 | 0 | 0 |
| Bistritsa | 0 | 2 | 5 | 1 | 2 | 1 | 0 | 0 | 0 | 0 | 0 |
| Perperek | 0 | 0 | 5 | 4 | 2 | 1 | 1 | 0 | 0 | 0 | 0 |
| Total | 7 | 6 | 13 | 8 | 5 | 2 | 1 | 0 | 0 | 0 | 0 |
| 61% | |||||||||||
| MRI | |||||||||||
| Ardino | 0 | 0 | 4 | 9 | 3 | 1 | 1 | 0 | 0 | 0 | 0 |
| Bistritsa | 0 | 0 | 0 | 0 | 4 | 6 | 0 | 0 | 0 | 0 | 0 |
| Perperek | 0 | 0 | 1 | 4 | 4 | 0 | 0 | 0 | 1 | 0 | 0 |
| Total | 0 | 0 | 5 | 13 | 11 | 7 | 1 | 0 | 1 | 0 | 0 |
| 81.6% | |||||||||||
| LRI | |||||||||||
| Ardino | 0 | 0 | 1 | 1 | 0 | 1 | 4 | 3 | 6 | 2 | 1 |
| Bistritsa | 0 | 0 | 0 | 1 | 0 | 5 | 5 | 0 | 0 | 0 | 0 |
| Perperek | 0 | 0 | 0 | 0 | 1 | 1 | 1 | 1 | 4 | 3 | 1 |
| Total | 0 | 0 | 1 | 2 | 1 | 7 | 10 | 4 | 10 | 5 | 2 |
| 73% | |||||||||||
Table 5.
Example of an error matrix for accuracy assessment of PFIR (LRI—low regrowth intensity; MRI—moderate regrowth intensity; HRI—high regrowth intensity; N—number of pixels). The diagonal elements in the error matrix represent the areas (pixels) that were correctly classified (N=). The off-diagonal elements of an error matrix represent the areas (pixels) that were not correctly classified (N?).
| Reference Data | |||||
|---|---|---|---|---|---|
| LRI | MRI | HRI | Total | ||
| Classified data | LRI | N= | N? | N? | N? |
| MRI | N? | N= | N? | N? | |
| HRI | N? | N? | N= | N? | |
| Total | N? | N? | N? | N= | |
Table 6.
Accuracy metrics, calculated for PFIR for the three test sites using VHR images as reference data. OA—overall accuracy; EO—error of omission; EC—error of commission; PA—producer’s accuracy; UA—user’s accuracy; HRI—high regrowth intensity; MRI—moderate regrowth intensity; LRI—low regrowth intensity.
| Test Site | OA | EO LRI | EO MRI | EO HRI | EC LRI | EC MRI | EC HRI | PA LRI | PA MRI | PA HRI | UA LRI | UA MRI | UA HRI |
|---|---|---|---|---|---|---|---|---|---|---|---|---|---|
| Ardino | 73.9 | 4.5 | 63.9 | 8.8 | 30.8 | 32.4 | 8.8 | 95.5 | 36.1 | 82.4 | 69.2 | 67.6 | 91.2 |
| Bistritsa | 63.9 | 32.9 | 41.9 | 63.0 | 60.3 | 4.0 | 63.0 | 67.1 | 58.1 | 100.0 | 39.7 | 96.0 | 37.0 |
| Perperek | 48.4 | 36.0 | 73.2 | 69.6 | 20.1 | 16.3 | 69.6 | 64.0 | 26.8 | 98.2 | 79.9 | 83.7 | 30.4 |
| Final | 62.1 | 24.5 | 59.7 | 47.1 | 37.1 | 17.6 | 47.1 | 75.5 | 40.3 | 93.5 | 62.9 | 82.4 | 52.9 |
Disclaimer/Publisher’s Note: The statements, opinions and data contained in all publications are solely those of the individual author(s) and contributor(s) and not of MDPI and/or the editor(s). MDPI and/or the editor(s) disclaim responsibility for any injury to people or property resulting from any ideas, methods, instructions or products referred to in the content. |
© 2024 by the authors. Licensee MDPI, Basel, Switzerland. This article is an open access article distributed under the terms and conditions of the Creative Commons Attribution (CC BY) license (https://creativecommons.org/licenses/by/4.0/).
Share and Cite
MDPI and ACS Style
Stankova, N.; Avetisyan, D. Postfire Forest Regrowth Algorithm Using Tasseled-Cap-Retrieved Indices. Remote Sens. 2024, 16, 597. https://0-doi-org.brum.beds.ac.uk/10.3390/rs16030597
AMA Style
Stankova N, Avetisyan D. Postfire Forest Regrowth Algorithm Using Tasseled-Cap-Retrieved Indices. Remote Sensing. 2024; 16(3):597. https://0-doi-org.brum.beds.ac.uk/10.3390/rs16030597
Chicago/Turabian StyleStankova, Nataliya, and Daniela Avetisyan. 2024. "Postfire Forest Regrowth Algorithm Using Tasseled-Cap-Retrieved Indices" Remote Sensing 16, no. 3: 597. https://0-doi-org.brum.beds.ac.uk/10.3390/rs16030597
Note that from the first issue of 2016, this journal uses article numbers instead of page numbers. See further details here.