Article

Amazon Forests’ Response to Droughts: A Perspective from the MAIAC Product

1
Department of Earth and Environment, Boston University, Boston, MA 02215, USA
2
Goddard Space Flight Center, National Aeronautics and Space Administration, Greenbelt, MD 20771, USA
*
Author to whom correspondence should be addressed.
Current Affiliation: Scripps Institution of Oceanography, University of California, San Diego, La Jolla, CA 92093, USA.
Submission received: 4 February 2016 / Revised: 13 April 2016 / Accepted: 20 April 2016 / Published: 23 April 2016
(This article belongs to the Special Issue Remote Sensing of Vegetation Structure and Dynamics)

Abstract

:
Amazon forests experienced two severe droughts at the beginning of the 21st century: one in 2005 and the other in 2010. How Amazon forests responded to these droughts is critical for the future of the Earth’s climate system. It is only possible to assess Amazon forests’ response to the droughts in large areal extent through satellite remote sensing. Here, we used the Multi-Angle Implementation of Atmospheric Correction (MAIAC) Moderate Resolution Imaging Spectroradiometer (MODIS) vegetation index (VI) data to assess Amazon forests’ response to droughts, and compared the results with those from the standard (Collection 5 and Collection 6) MODIS VI data. Overall, the MAIAC data reveal more realistic Amazon forests inter-annual greenness dynamics than the standard MODIS data. Our results from the MAIAC data suggest that: (1) the droughts decreased the greenness (i.e., photosynthetic activity) of Amazon forests; (2) the Amazon wet season precipitation reduction induced by El Niño events could also lead to reduced photosynthetic activity of Amazon forests; and (3) in the subsequent year after the water stresses, the greenness of Amazon forests recovered from the preceding decreases. However, as previous research shows droughts cause Amazon forests to reduce investment in tissue maintenance and defense, it is not clear whether the photosynthesis of Amazon forests will continue to recover after future water stresses, because of the accumulated damages caused by the droughts.

Graphical Abstract

1. Introduction

Amazon forests, which contain 100 billion tons of carbon [1], not only play an important role in maintaining the biodiversity of the Earth’s ecosystem, but also play an important role in the Earth’s climate system through exchanges of energy, momentum, and mass with the atmosphere. It is suspected that Amazon forests could degrade to savannas, release the large amount of stored carbon into the atmosphere, and hence accelerate global warming significantly, in the era of climate change [2,3,4]. Therefore, how Amazon forests respond to the variation of environmental factors (such as sunlight, temperature, and water), both seasonally and inter-annually, is of great concern to the research community.
Amazon forests have two seasons: wet season and dry season. The dry season generally lasts from July to September, and the wet season covers the remaining months of the year [5,6]. Amazon forests are adapted to water variations between the wet season and dry season, because of the forests’ deep roots, which can utilize water stored in deep soils [7,8]. In fact, reduced cloud cover accompanying the dry season results in amplified sunlight reaching the forests’ canopies, and this enhances the forests’ photosynthesis, as confirmed by both field measurements and satellite remote sensing [9,10,11,12,13,14]. In contrast to natural seasonal variation of water abundance, anomalously low water abundance in the dry season is called drought. According to field measurements and observations, drought can reduce Amazon forests’ photosynthesis [15], aboveground biomass [16], autotrophic respiration [17], and even cause large trees to die [18].
There were two severe droughts over Amazon in the first decade of the 21st century: one in 2005 [19] and the other more severe one in 2010 [20,21]. Both of these droughts happened in the dry season of the Amazon due to the anomalously high Atlantic sea surface temperature [19,20], instead of due to El Niño events, which usually decrease the wet season precipitation over the Amazon basin [22].
Because assessments based on field measurements and observations could be site specific and not representative of all the forests [15,16,17,18], it is only possible to assess the forests’ response to droughts through satellite remote sensing [23], for example, using vegetation index (VI) to indicate the greenness (i.e., photosynthetic activity) [24]. The most commonly used vegetation indices include: Normalized Difference Vegetation Index (NDVI), which is calculated using the near infrared and red reflectance measurements, and Enhanced Vegetation Index (EVI), which uses not only the near infrared and red reflectance, but also the blue reflectance to correct aerosol influences in the red band [25]. The optical sensors mostly used for large area monitoring of tropical rain forests are the Moderate resolution Imaging Spectra-radiometer (MODIS) onboard the Terra and Aqua satellites of National Aeronautics and Space Administration (NASA), because MODIS sensors have adequate spatial, temporal, and spectral resolutions for addressing the challenging atmospheric conditions of the Amazon basin (i.e., frequent cloud cover and heavy aerosol loadings) [26].
The assessment of Amazon forests’ response to the 2005 drought using satellite remote sensing was first documented in [27], which concluded that Amazon forests’ photosynthetic activities increased during the drought, probably because of the increased solar radiation. However, it turned out that the cloud [28,29] and aerosol quantity flags [30] of standard MODIS data matter considerably in these assessments—with atmospheric contamination excluded, [5] reassessed the impact of the 2005 drought on Amazon forests, and found that Amazon forests did not green up during the 2005 drought, which agrees with ground-based observations [16,18]. For the even more severe 2010 Amazon drought, Xu et al. [6] introduced additional quality screening to further mitigate the impact of residual atmospheric contamination, and showed wide spread greenness decline in Amazon forests using the Collection 5 (C5) MODIS vegetation index product. These findings from optical remote sensing also agree with those from active microwave remote sensing data, which show declines in canopy leaf abundance and moisture during and after the drought [31]. However, the findings of [32] showed that the Amazon forests’ greenness based on Collection 5 MODIS data has a decreasing trend after 2005, and the observed forests’ greenness in drought years was not particularly different from that in non-drought years, hence claiming that even if Amazon forests decreased their photosynthetic activities during the droughts, satellite remote sensing could not detect such responses.
To address this issue, we need more advanced processing of MODIS measurements. The Multi-Angle Implementation of Atmospheric Correction (MAIAC) MODIS products [33,34,35,36] use a more sophisticated atmospheric correction algorithm and a more accurate and less conservative cloud detection algorithm than the standard Collection 5 and Collection 6 MODIS products [37,38], and incorporate improved sensor calibration like in Collection 6 MODIS products [39]. In addition, the MAIAC algorithm also normalizes the sun-sensor geometry to nadir view and 45° solar zenith angle; hence, excludes the issue of sun-sensor geometry variation in standard MODIS VI products [13]. The aim of this paper is to evaluate the response of Amazon forests to droughts using the more advanced satellite optical remote sensing retrievals (i.e., MAIAC retrievals), and to resolve the confusion about the ability of satellite remote sensing in monitoring Amazon forests’ response to droughts.

2. Data and Methods

We used the Collection 5 MODIS land cover product [40] to identify the distribution of Amazon forests, Tropical Rainfall Measuring Mission (TRMM) precipitation data [41] from 2000 to 2012 to identify the drought condition, and MODIS Collection 5 [25], Collection 6, and MAIAC [33,34,35,36] vegetation index products from 2000 to 2012 to assess the dynamics of Amazon vegetation greenness.
The quality of retrieved vegetation index in the Collection 5 and Collection 6 MODIS vegetation index product is indicated by quality flags [25]. The quality flags indicate whether a pixel is a cloud pixel, a cloud shadow pixel, or a pixel with heavy aerosol loadings. Clouds and heavy aerosol loadings introduce errors to the retrieved Vegetation Index, so these atmospherically contaminated VI retrievals were excluded from the analysis. The excluding method we used was the same as in [5,6]. The MAIAC vegetation index product does not provide vegetation index retrievals for atmospherically contaminated pixels [35]; therefore, all the retrieved MAIAC vegetation index values were valid and included in our analysis.
Optical remote sensing of the Amazon basin is particularly challenging because of the limited number of valid observations due to the frequent cloud cover and heavy aerosol loadings [26]. Terra and Aqua satellites overpass Amazon forests in the morning and afternoon, respectively, and between the two overpasses on the same day, cloud and aerosol distributions could have changed. Therefore, we took advantage of the different overpass times to increase the number of valid observations by merging the vegetation index data from the Terra and Aqua platforms. The merging strategy is as follows. (1) From February 2000 to April 2002, valid vegetation indexes from Terra were used, because Aqua had not been launched until May 2002; (2) From May 2002 to December 2008, the average of the valid vegetation index from Terra and Aqua was used if both were available over the same 16-day time step; if only one platform provided a valid vegetation index, only one value was used; (3) From January 2009 onward, valid vegetation index data from Aqua were used preferentially—Terra VI were used only when Aqua VI were invalid, because Terra MODIS had a significant sensor degradation issue starting from 2009, especially impacting observations at large view zenith angles [39,42].
We calculated the dry season average (from July to September) vegetation index of each year from 2000 to 2012 following the method described in [5,6].
The standard MODIS vegetation index product is provided every 16 days, and there may be missing values in the product because of atmospheric contaminations, so there are at most six vegetation index values during the three months in the dry season. In order to obtain the dry season average greenness, we first calculate the monthly VI: when both 16-day VIs in a month exist, we take the average as the monthly VI; when only one 16-day VI exists in a month, we take the only available value as the monthly VI; when no 16-day VIs in a month exist, the monthly VI is unavailable. Then, the dry season mean VI is calculated only when all three monthly VIs are available. This calculating method reduced the biases caused by missing values of the standard MODIS VI product, because the Amazon dry season is also the growing season, during which VI increases [9].
The MAIAC vegetation indices data were provided every 8 days. We used the maximum compositing method to composite the 8-day MAIAC vegetation index data into 16-day data, following the compositing philosophy of standard MODIS VI products, and then used the same method to calculate the dry season mean greenness as we used for the standard MODIS VI data.
We calculated Amazon dry season average precipitation by directly averaging the monthly TRMM precipitation data in the dry season months from July to September, because the TRMM monthly precipitation data do not have missing values over the Amazon.
Dry season averages were used because the 2005 and 2010 droughts happened in the dry season [19,20], and because the cloud cover is less frequent during the Amazon dry season [9]. These dry season average precipitation and vegetation index data were used to calculate the long-term means and standard deviations, which were then used to obtain the standardized anomalies of dry season average precipitation and greenness for each year. Pixels with standardized anomalies less than −1 were identified as drought pixels or browning pixels. The standardized anomaly assessment method was also used in previous studies [5,6,27,32]. Detailed data and methods descriptions are provided in the supplementary material of this paper.

3. Results and Discussion

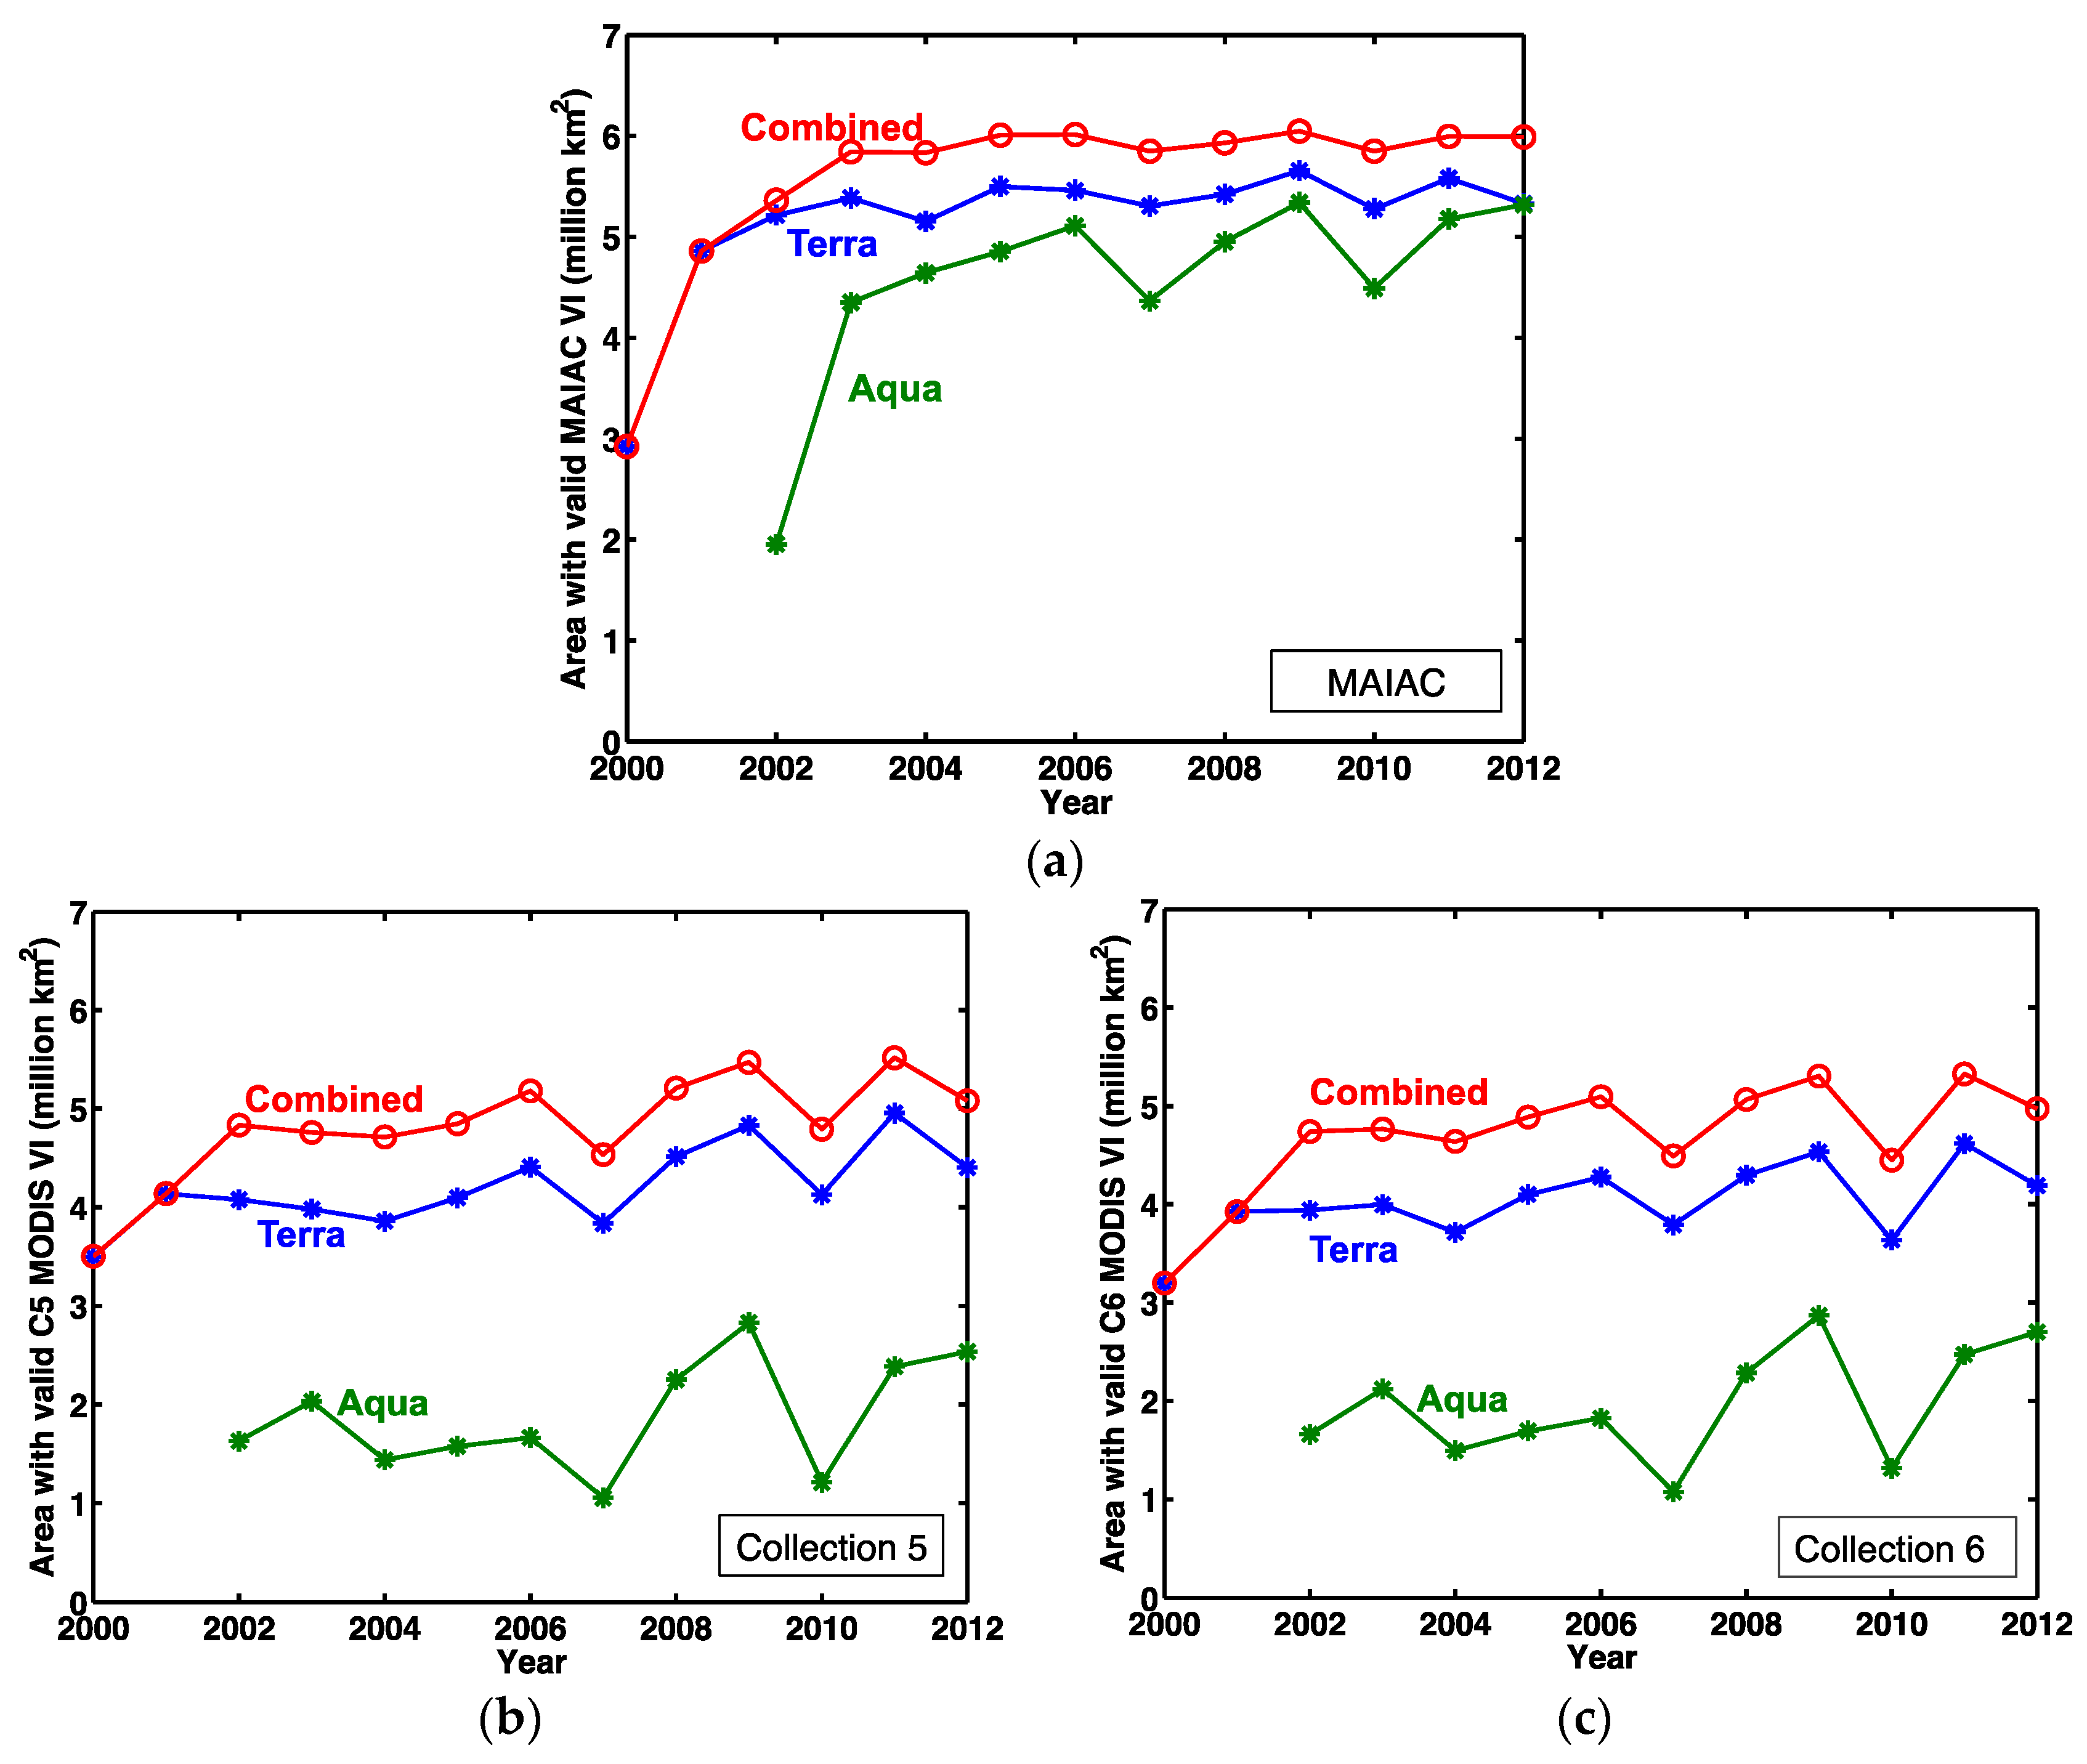
3.1. Area of Amazon Forests with Valid Dry-Season Mean VI Retrievals

Over the Amazon forests, the Terra VI products provide more valid dry-season VI retrievals than the Aqua products, and this is true for both MAIAC and standard MODIS products (Figure 1). This indicates that clouds and aerosols are less prevalent over the Amazon in the morning than in the afternoon, considering Terra overpasses the Amazon forests in the morning and Aqua in the afternoon. The combination of Terra and Aqua VI products results in more valid dry-season average VI retrievals, and hence a more complete assessment of the response of Amazon forests’ photosynthetic activity to droughts.
The area of forests with valid dry-season Terra-Aqua combined standard (Collection 5 and Collection 6) MODIS VI retrievals is around five million km2, which is ~80% of the area of the Amazon forests. When using the Terra product alone, we get valid dry season VI over only ~60% of the Amazon forests. The Terra-Aqua combined MAIAC VI product provides valid dry season VI covering around six million km2 forests, which is ~95% of the Amazon forests, in each year after 2003. The consistent high percentages of valid dry-season mean MAIAC VI retrievals over the Amazon forests allow a much more complete assessment of the response of Amazon forests’ photosynthetic activity to droughts than using standard MODIS VI products.

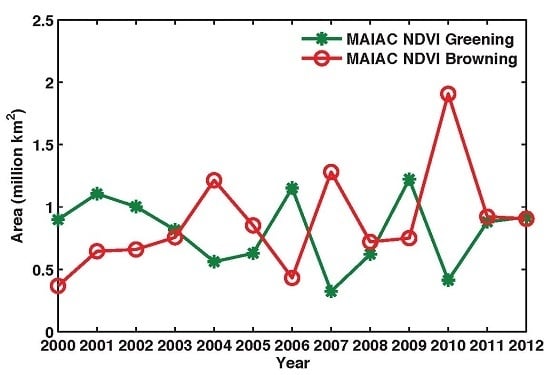
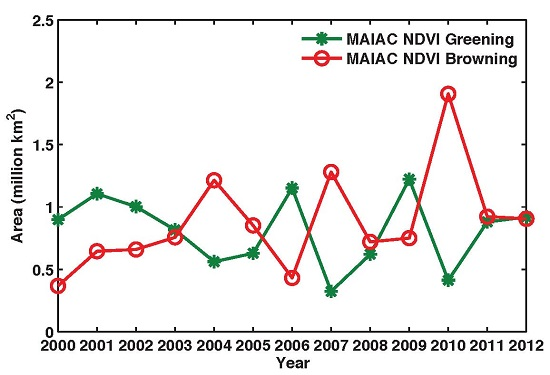
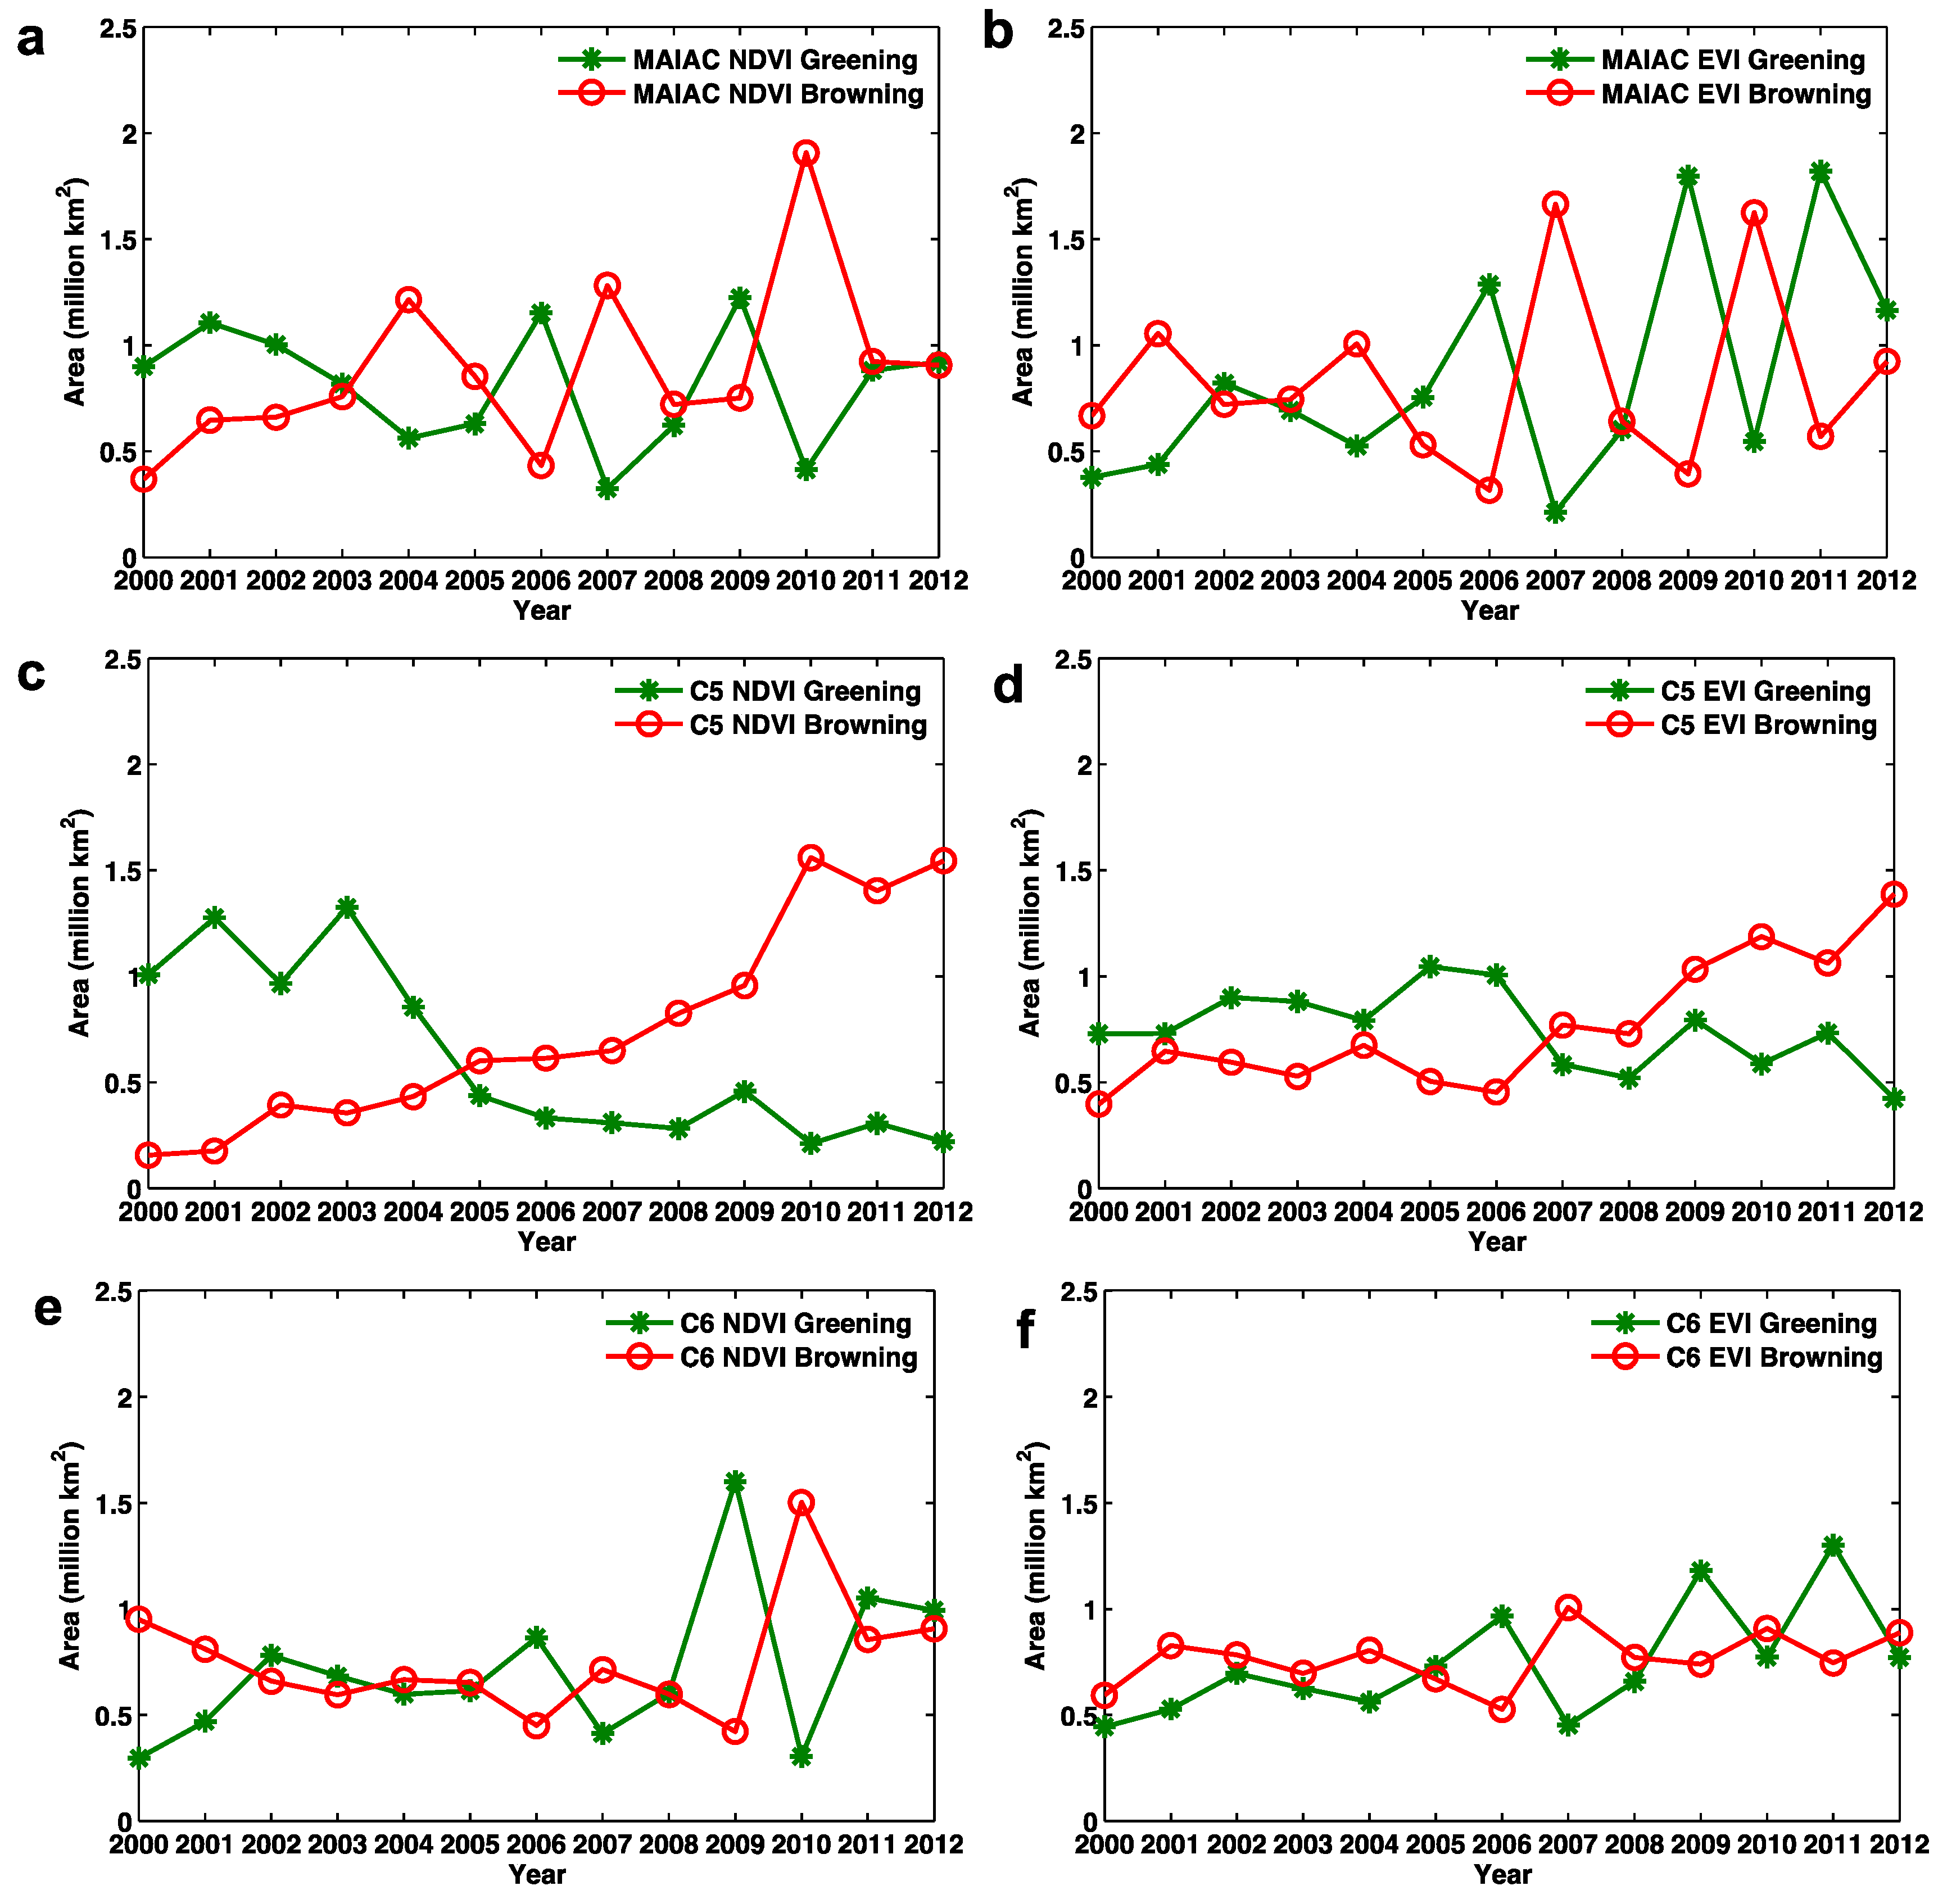
3.2. Time Series of the Area of Greening and Browning Amazon Forests

Collection 5 MODIS VI products have previously shown decreasing trends of Amazon forests’ greenness after 2005 irrespective of precipitation variations; therefore, Atkinson et al. [32] argued that even if the Amazon forests’ greenness decreased during the droughts, MODIS Collection 5 VI data were not able to show this response. Here, we re-performed the analysis using MAIAC, Collection 5, as well as Collection 6 MODIS data, and found that Collection 5 MODIS VI data did show an apparent increasing trend of forested area with dry-season average greenness standardized anomaly less than −1 (browning); however, neither MAIAC nor Collection 6 VI data showed such apparent trends (Figure 2).
The increasing trends of the area of Amazon forests showing browning (dry-season mean greenness standardized anomaly less than −1) based on Collection 5 MODIS VI products were caused by the Terra MODIS sensor degradation issue [42]. Therefore, the improved sensor calibration incorporated in both MAIAC and Collection 6 MODIS data is indispensable for the valid assessment of Amazon forests’ inter-annual greenness dynamics [38].
Both MAIAC NDVI and EVI data show large area of browning Amazon forests in 2010, and in the neighboring non-drought years 2008, 2009, 2011, and 2012, Amazon forests did not experience extensive browning (Figure 2a,b). The anomalously low Amazon forest greenness in the dry seasons of 2004 and 2007 (Figure 2a,b) could be caused by the anomalously low water storage before the dry seasons in these two years [43]. This suggests that the reduction of precipitation during wet seasons could also lead to decreased photosynthetic activities of Amazon forests in the following dry seasons. The anomalously low water storage in the wet seasons of 2004 and 2007 were related to the El Niño events in those two years [22,38]. This suggests that future El Niño events, which tend to reduce the wet season precipitation over the Amazon basin, might also decrease the photosynthetic activity of Amazon forests.
The Collection 6 MODIS VI data show a large areal extent of forest browning in 2010, and no decreasing trend in Amazon forests’ greenness (Figure 2e,f, Figures S6 and S9). This agrees with the MAIAC VI data; however, the Collection 6 MODIS VI data, especially the Collection 6 EVI data, show quite different absolute areal extents of forest greening and browning than the MAIAC VI data. For example, in 2010, over the drought impacted forests, the area of browning shown by C6 EVI is only ~50% of that shown by MAIAC EVI, and the area of greening is ~200% of that shown by MAIAC EVI (Table 1). This might be related to incomplete atmospheric correction of the C6 blue band reflectance. Further, the anomalously low C6 MODIS NDVI in 2000 and 2001 over the Amazon forests (Figure 2e, Figure S6) suggests there might be residual sensor calibration issues in those two years.
The distributions of MODIS view angles from different years are very similar, if not identical [13], so the impact of MODIS view angle variation is more prominent in intra-annual analysis [13] than in this inter-annual analysis. Nevertheless, observations from high view angles may still induce errors in the spatial patterns of greenness anomaly. Therefore, the greenness anomaly assessment using the MAIAC data, which normalizes the sun-sensor geometry, is more reliable than using the standard MODIS data.
Overall, the MAIAC VI data reveal more realistic Amazon forests inter-annual greenness dynamics than the standard MODIS data, due to improved sensor calibration (with regard to Collection 5 MODIS data), sun-sensor geometry normalization, as well as better cloud detection and atmospheric correction algorithms.

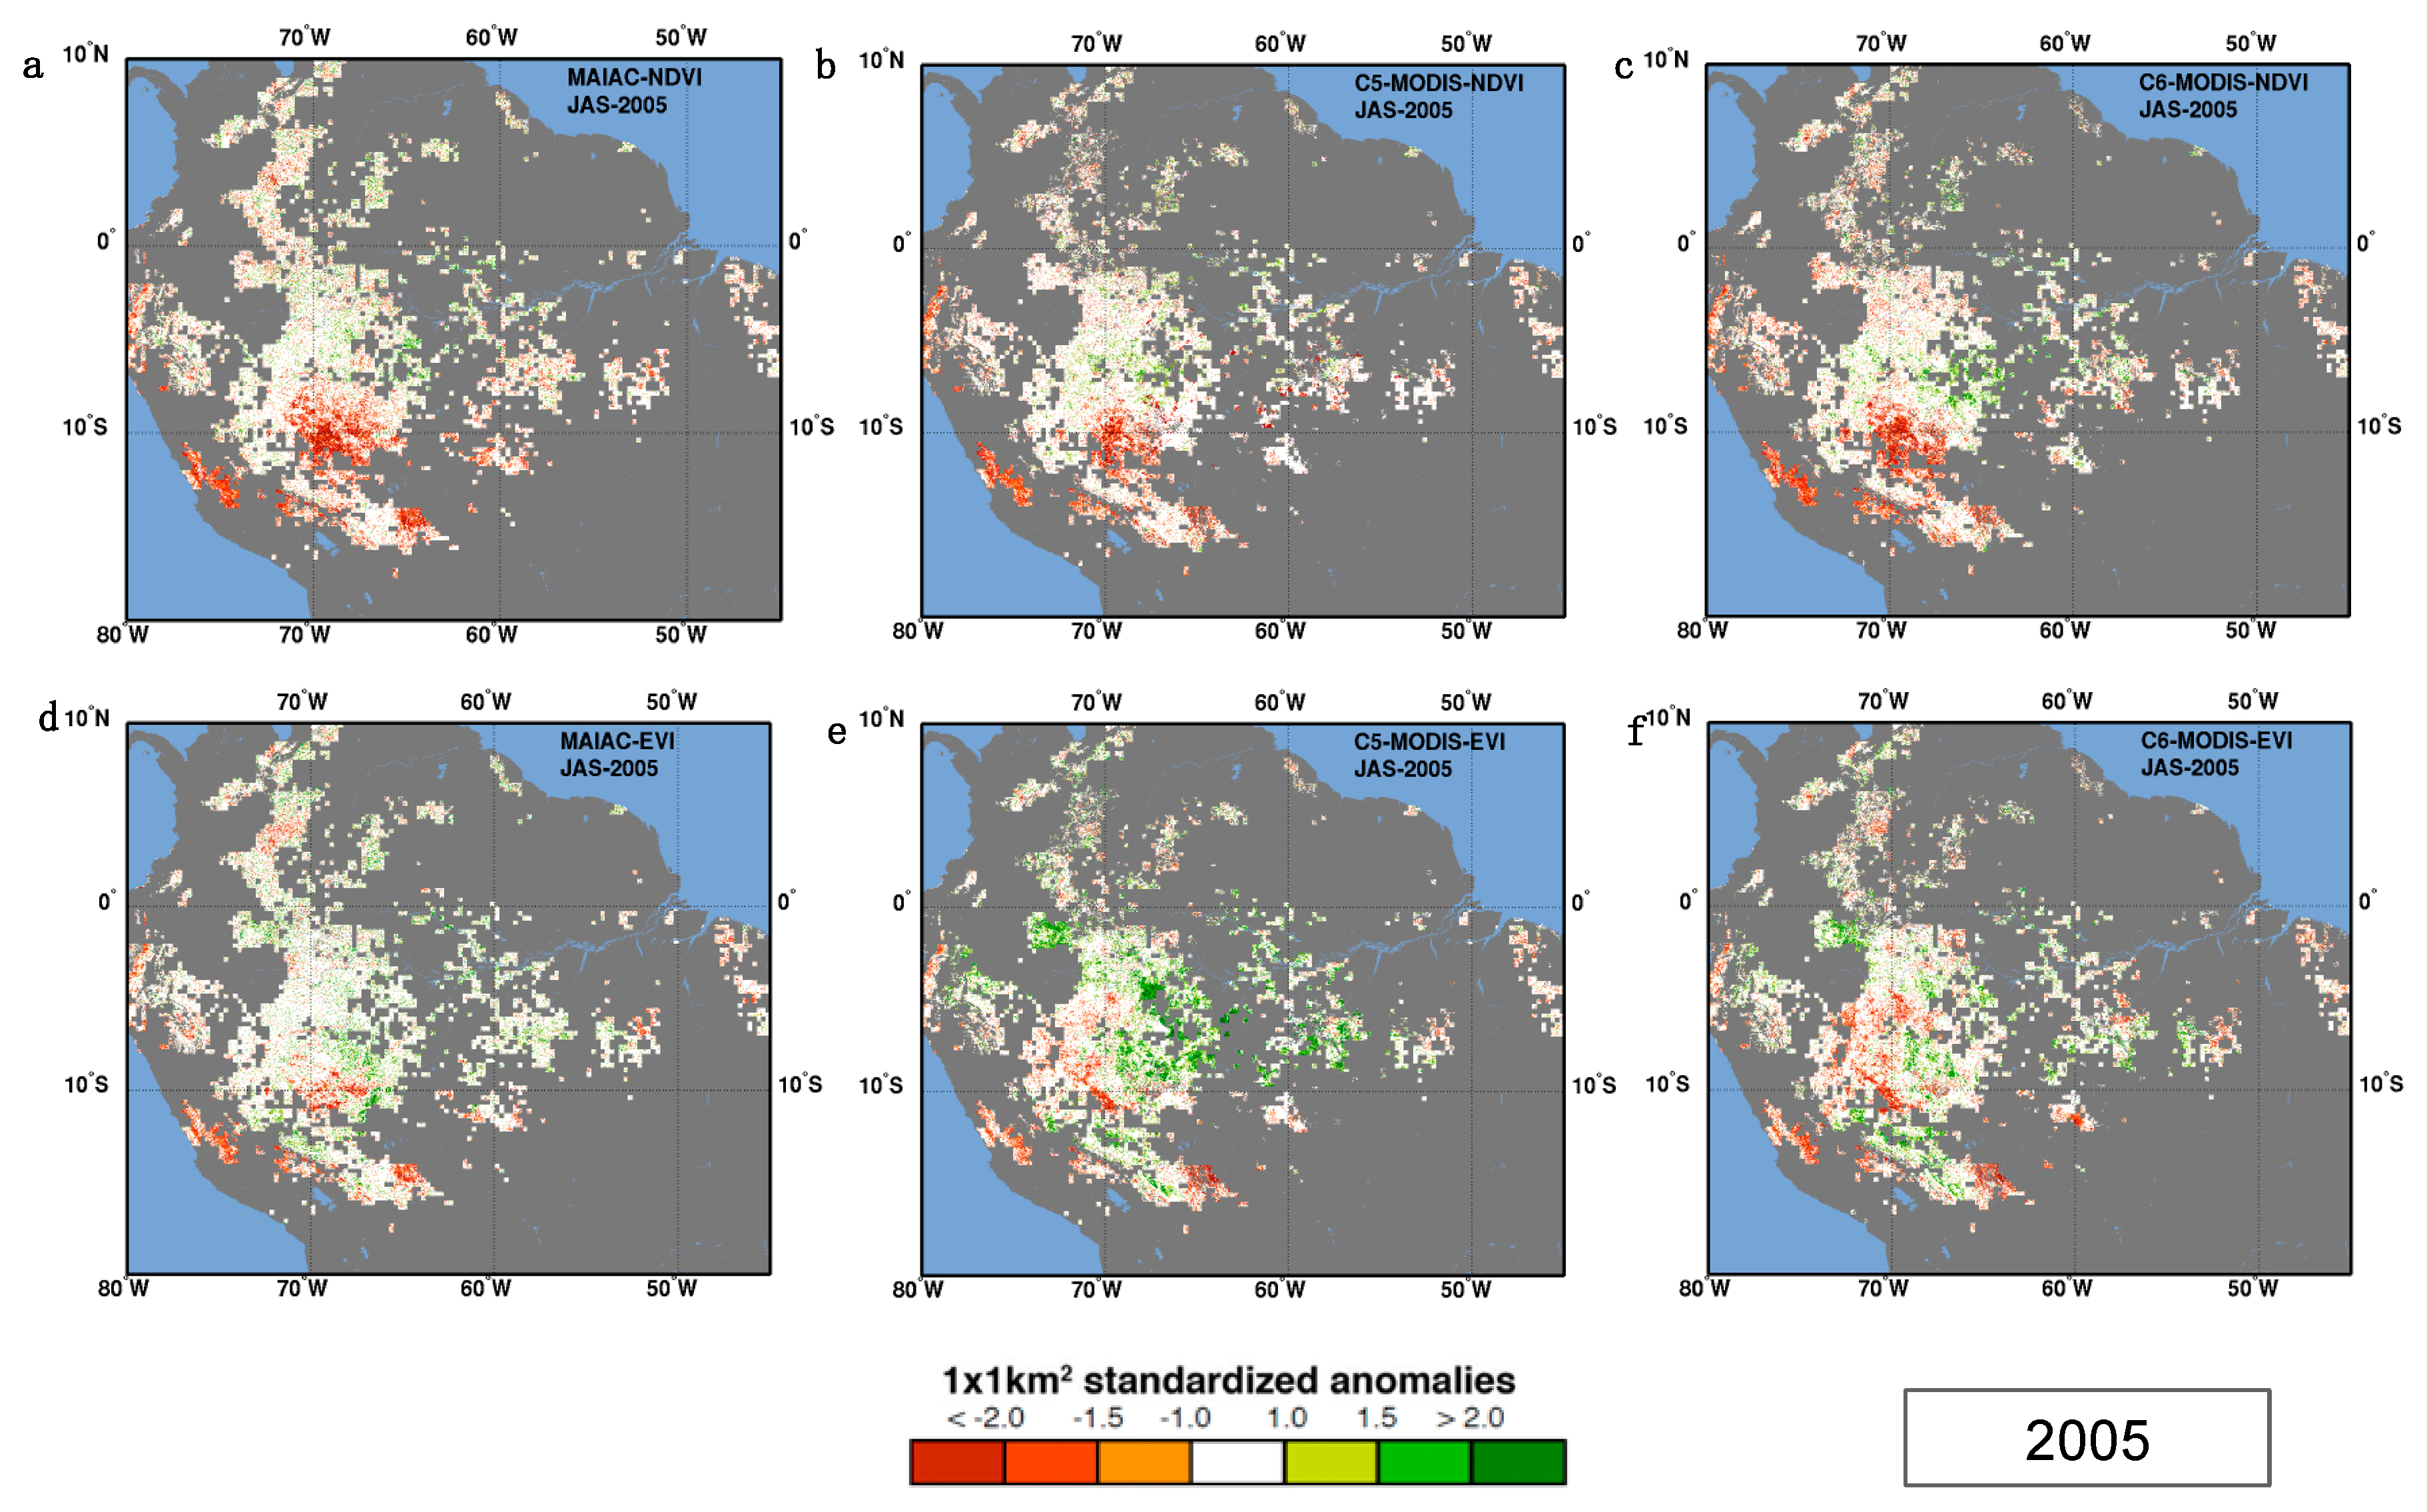
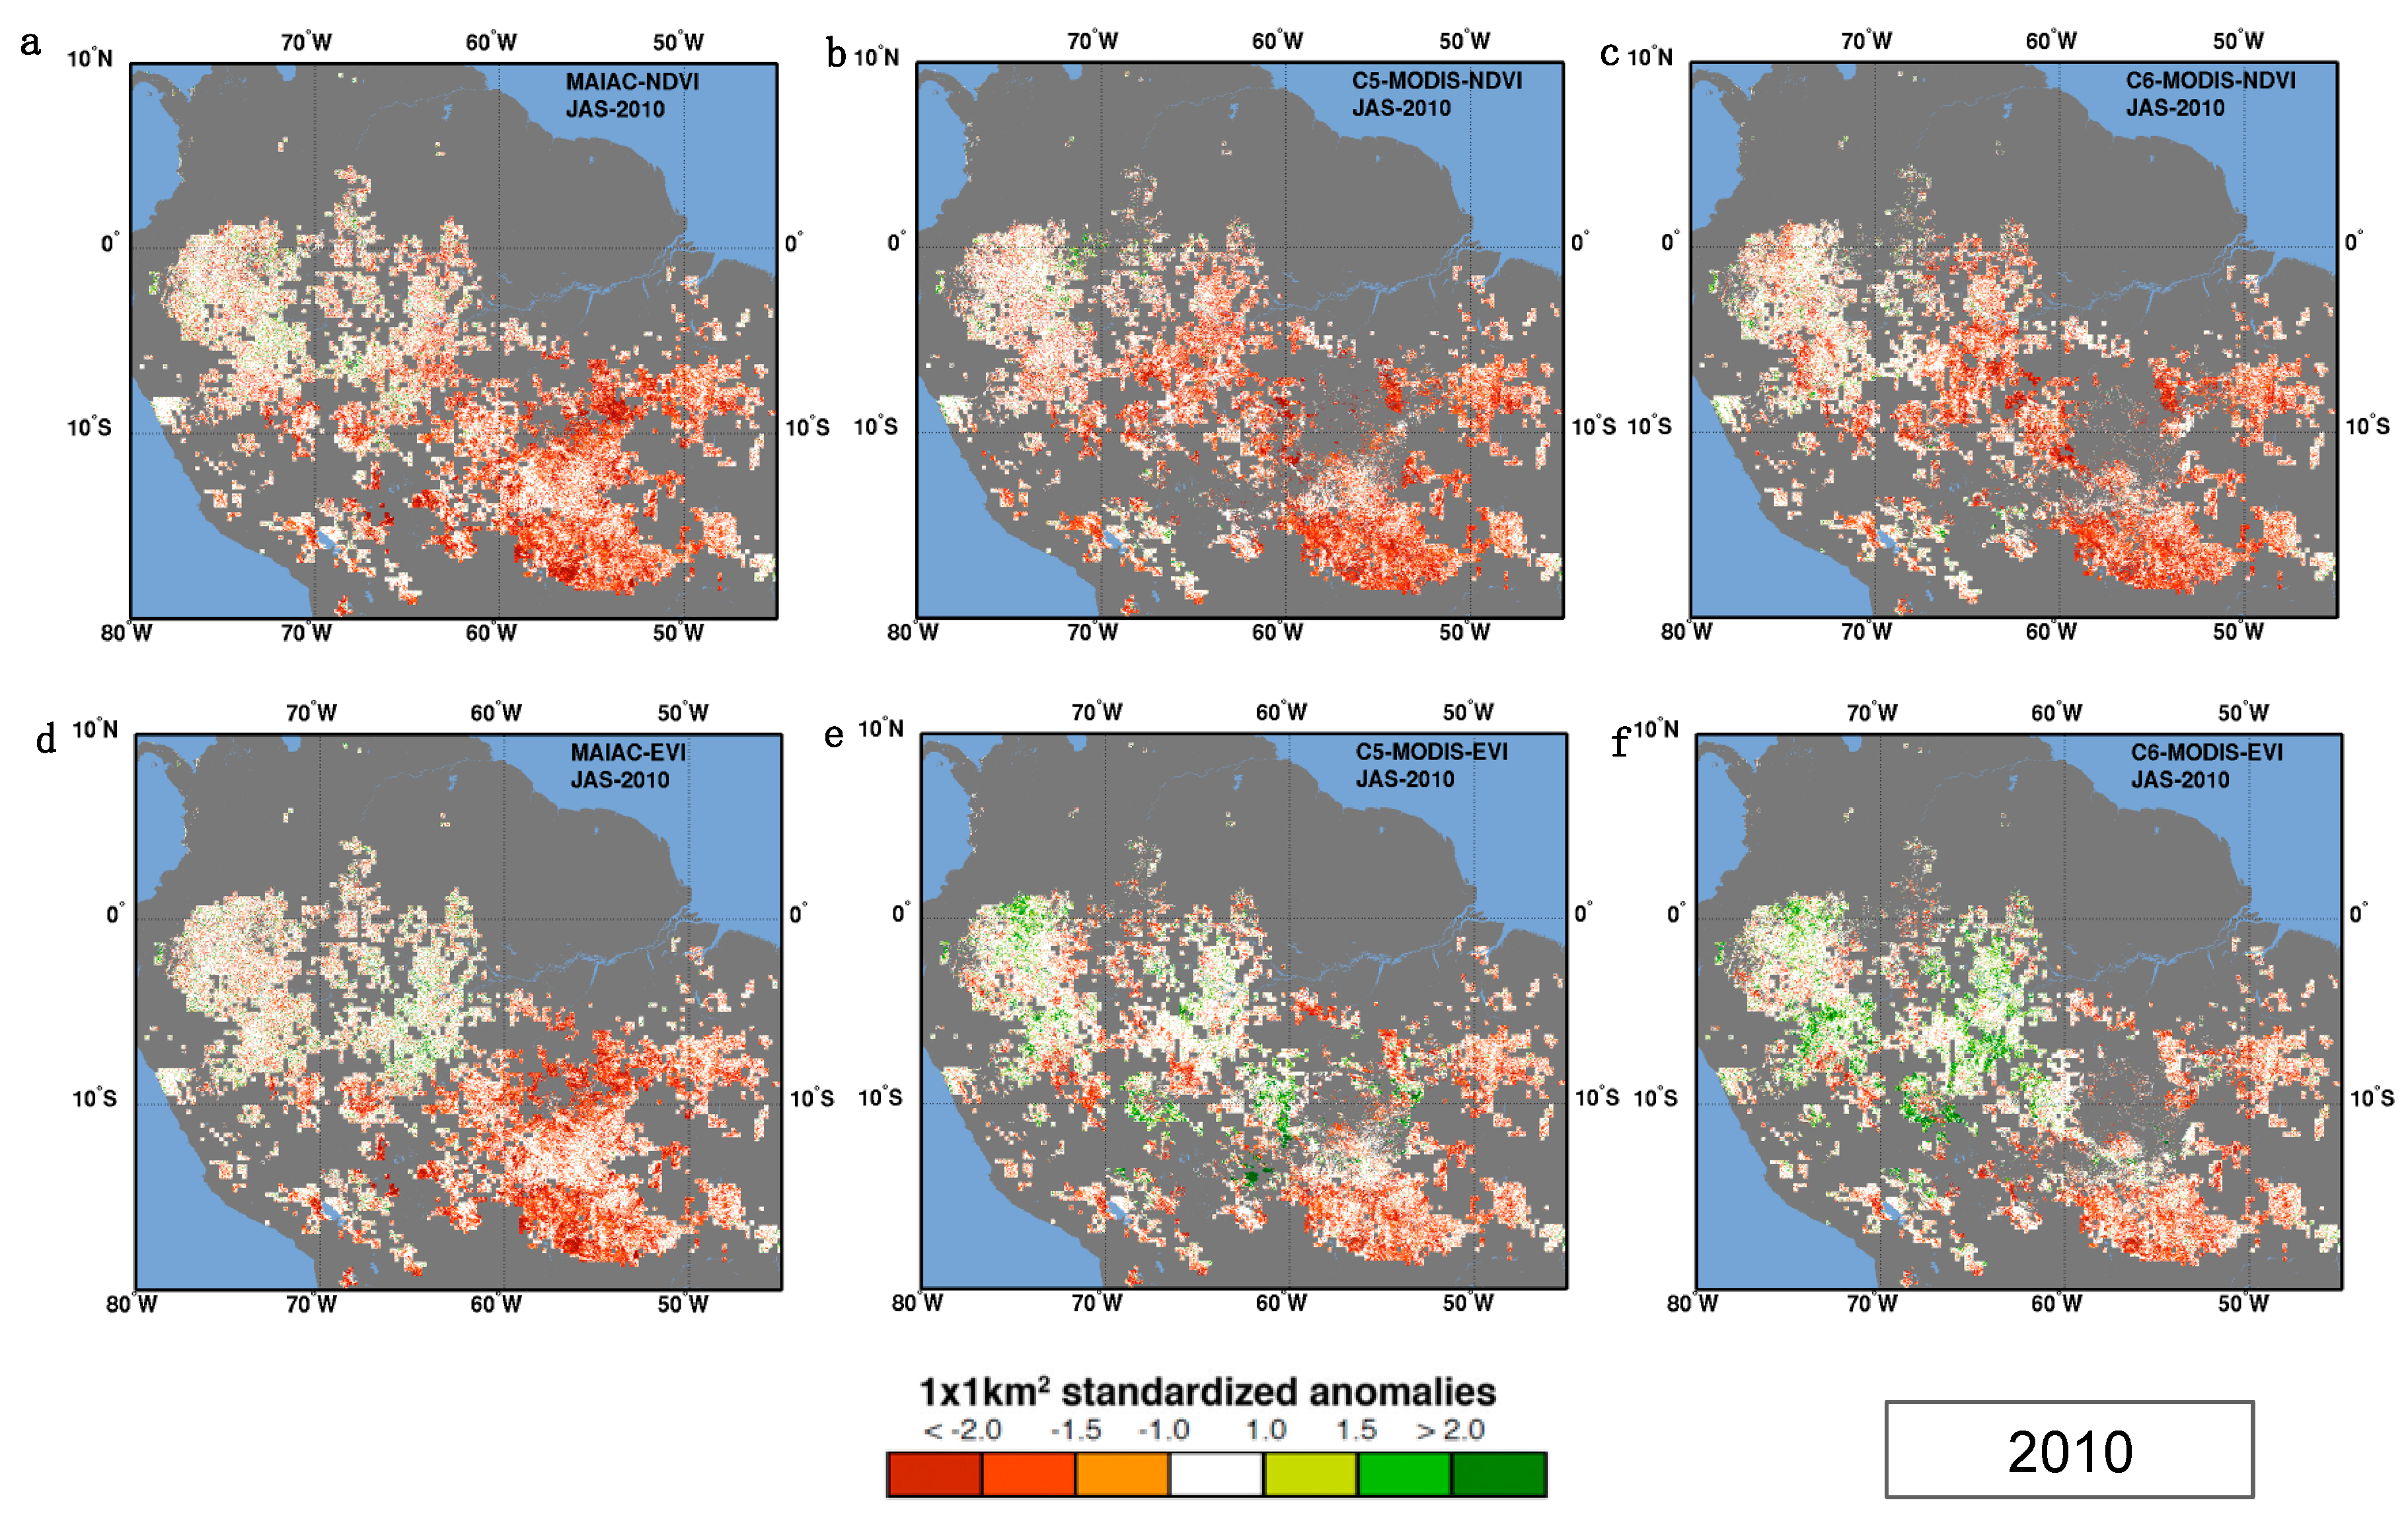
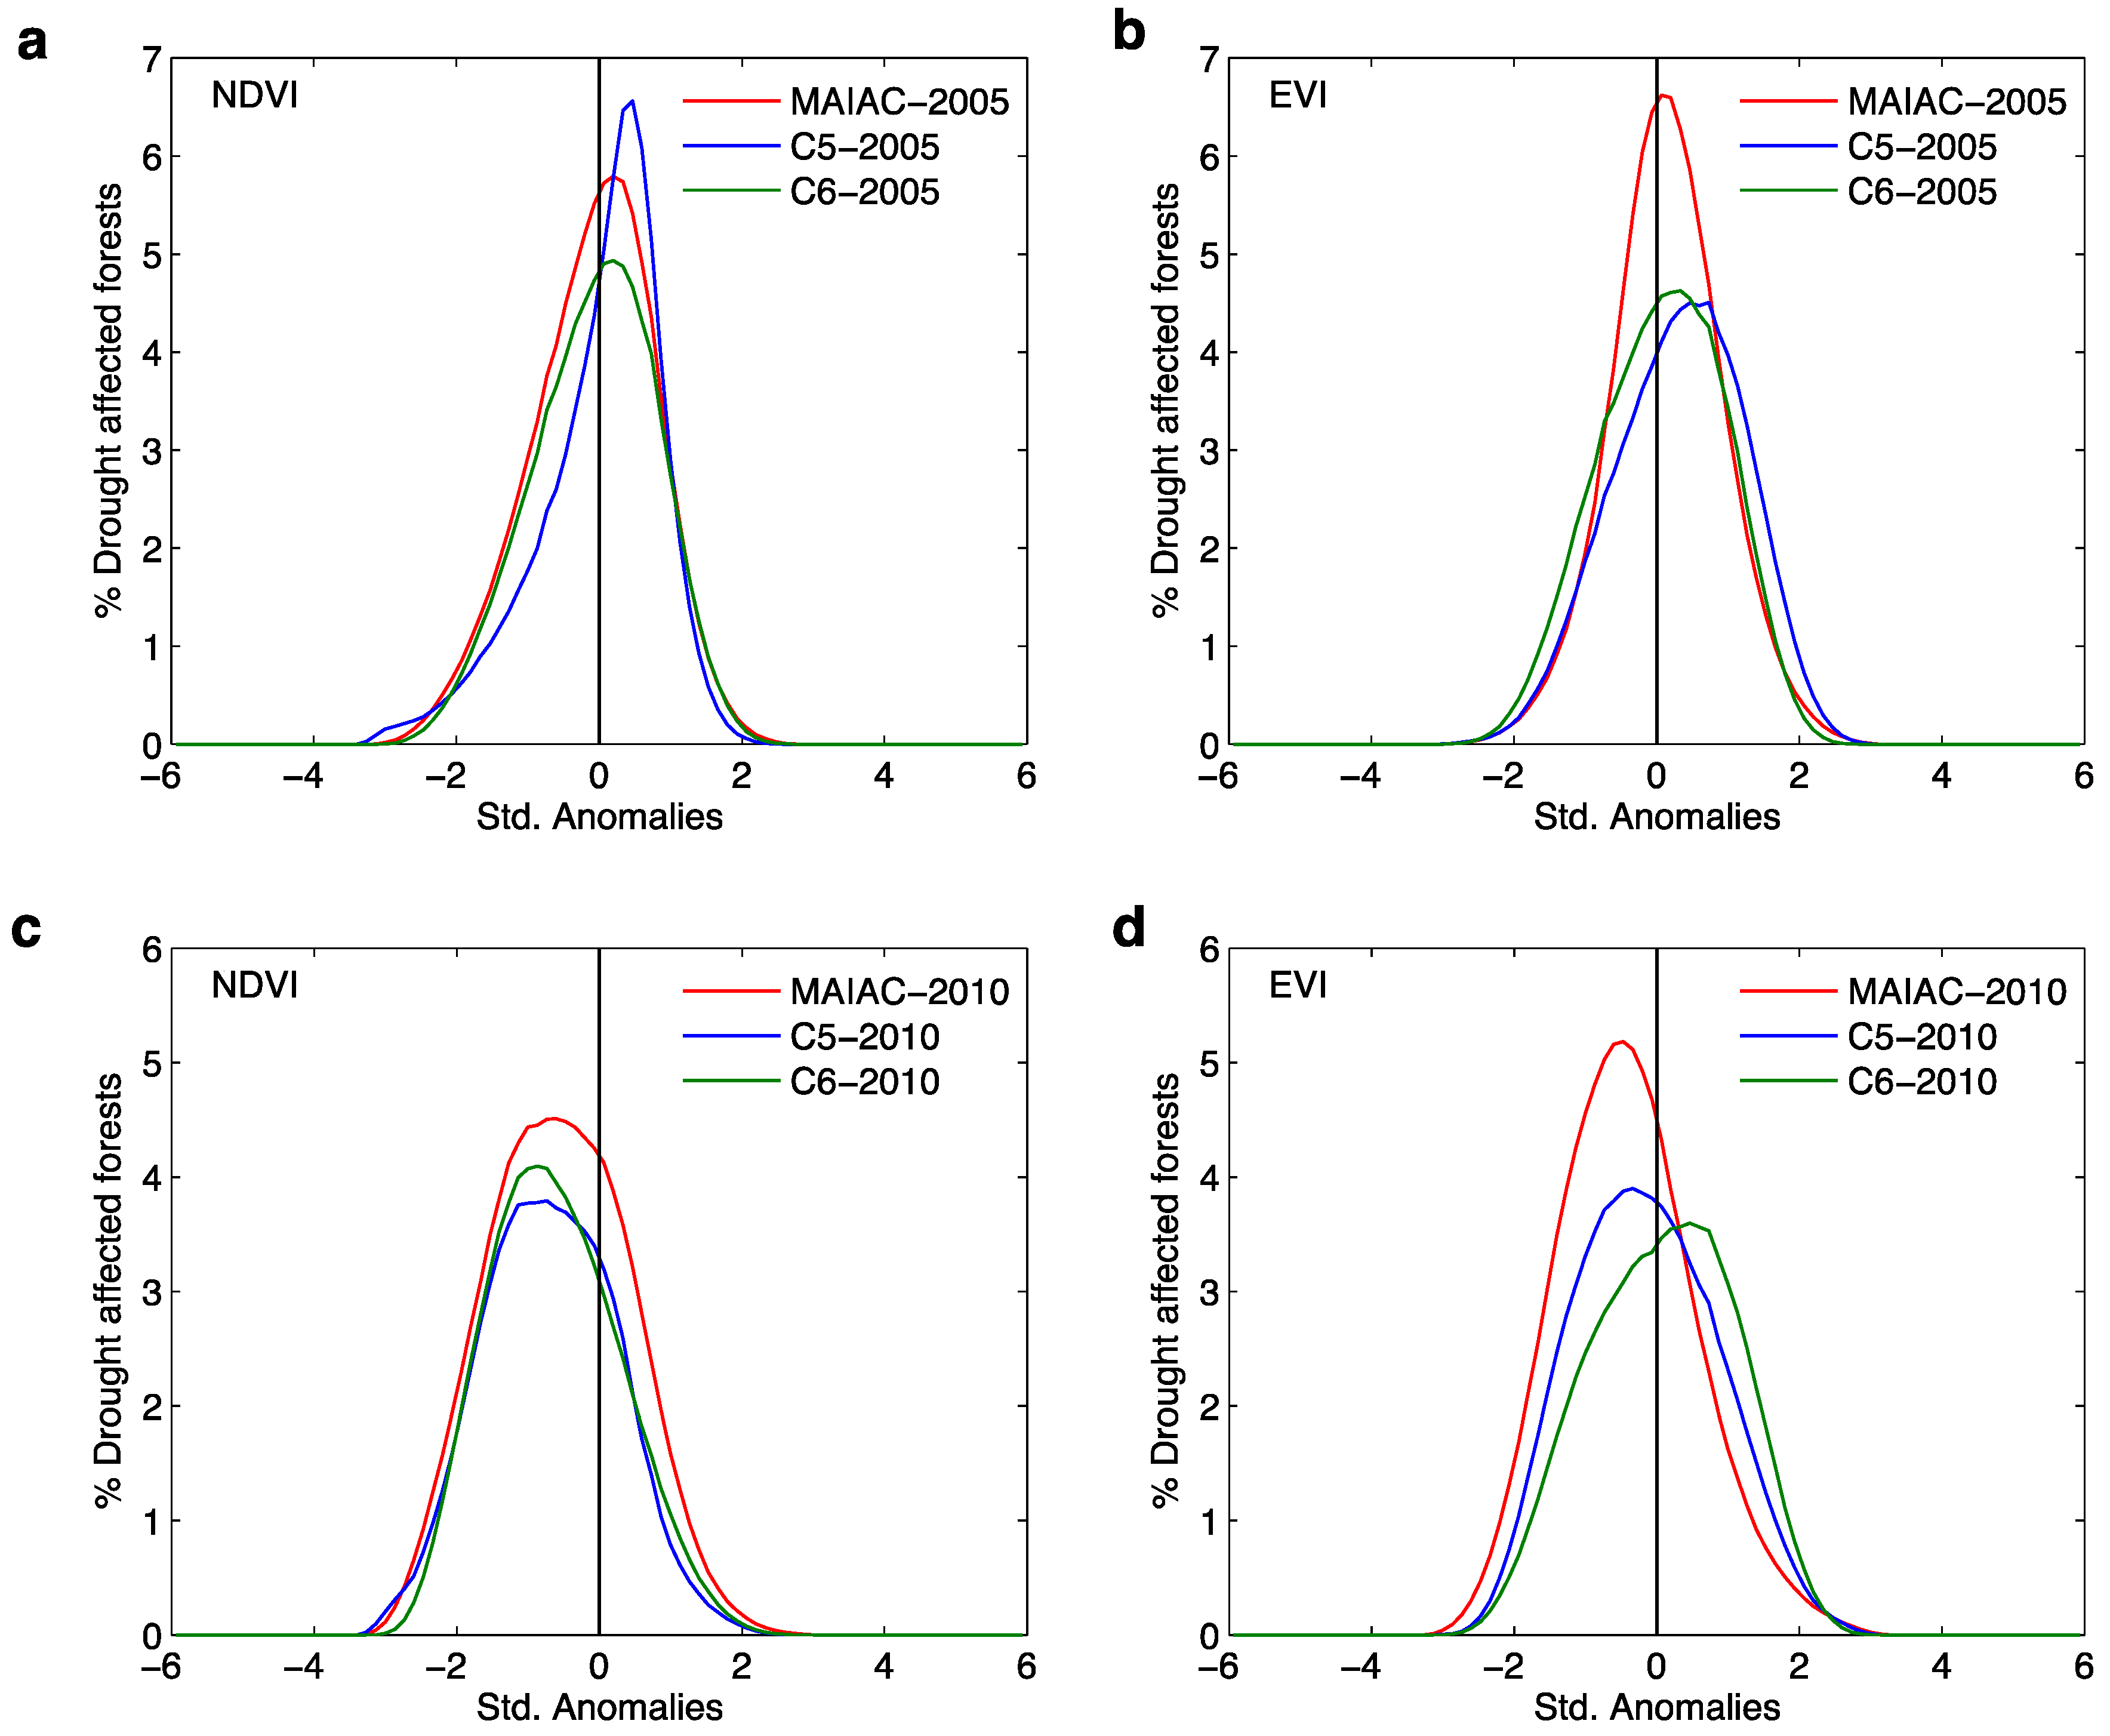
3.3. Impact of the 2005 and 2010 Droughts

The Amazon basin experienced two severe droughts in 2005 and in 2010, with the 2010 drought being more severe than the 2005 drought. The 2005 drought mostly impacted the western Amazon basin south of the equator; and the 2010 drought impacted all of Amazonia south of the equator (Figure S2). The responses of the Amazon forests to the 2005 and 2010 droughts as assessed by various remote sensing data are illustrated in Figure 3 and Figure 4.
For the 2005 drought, the NDVI data of MAIAC, Collection 5, and Collection 6 show greenness decline or no-change in most of the drought impacted regions (Figure 3a,b; Table 1), while the EVI data, especially the Collection 5 MODIS EVI data (Figure 3e), showed greenness increase in the drought impacted regions. The contradictory results between NDVI and EVI in C5 data could be due to their different retrieval algorithms. NDVI is calculated using just the red and near infrared bands, while EVI uses these two bands as well as the blue band. The blue band receives higher percentages of atmospheric radiation because of Rayleigh scattering than the red and near infrared bands. The Rayleigh scattering in blue band should have been corrected in MODIS products under ideal conditions, but the heavy and frequent aerosol loadings over Amazon during droughts [26] make the blue band atmospheric correction insufficient, which results in elevated blue band reflectance and consequently elevated EVI. Therefore, incomplete atmospheric correction elevates EVI values. Figure 3f suggests residual atmospheric contamination might also exist in the C6 MODIS EVI data.
The widespread spurious 2005 Amazon green-up shown in the Collection 5 MODIS EVI product is not present in the assessment using MAIAC EVI (compare Figure 3d with Figure 3e). Collection 5 MODIS EVI data show more greening areas in the 2005 drought in our analysis than in the analysis of [5], because the long-term mean dry season EVI in our analysis is lower—we used four more years of data starting from 2009, and MODIS Collection 5 Vegetation Index products have a decreasing trend of dry season greenness of Amazon forests [29]. Consequently, the Collection 5 MODIS vegetation index products show positively skewed distributions of greenness standardized anomalies in the drought impacted forests in 2005, but MAIAC data do not show such skewed distributions (Figure 5a,b).
Based on the MAIAC VI data, in 2005, approximately 70% of the drought impacted Amazon forests showed normal greenness as in non-drought years, and the greening and browning fractions were all less than 15% (Table 1). Therefore, as a whole, the 2005 Amazon drought did not affect the greenness of the Amazon forests significantly; but regionally, at the epicenter of the 2005 drought, which was located in the southwestern part of the Amazon basin (Figure S2), the greenness of Amazon forests decreased considerably (Figure 3a).
For the 2010 drought, NDVI data from the MAIAC, Collection 5, and Collection 6 MODIS products show extensive browning in the entire drought impacted vegetation, including forests (Figure 4a–c). These results agree with those presented in [6]. The contradictory 2010 greenness standardized anomaly patterns shown by the Collection 6 NDVI (Figure 4c, prevalent browning) and EVI (Figure 4f, extensive greening) also suggest residual atmospheric contamination may exist in C6 MODIS EVI data.
In the 2010 drought impacted forests, both the MAIAC and standard MODIS NDVI products show more browning than greening, and the MAIAC products provide more valid retrievals than the standard MODIS VI products (Table 1 and Figure 5c,d). Based on the MAIAC data, about 60% of the 2010 drought impacted forests showed no change (standardized anomaly within −1 and +1), about 30% showed browning (standardized anomaly less than −1), and less than 10% showed greening (standardized anomaly greater than +1). The extensive browning detected by MAIAC NDVI and EVI cannot be due to residual atmospheric contamination, because residual atmospheric contamination has opposite effects on NDVI and EVI—it suppresses NDVI but elevates EVI.
Even though the absolute anomalous VI difference could be very small and within the error range of the VI product [32], we believe that the standardized anomalies are indicative of real vegetation greenness dynamics, and are not just caused by error of the VI product, because random errors of VI cannot generate spatial patterns of browning that agree well with the drought area. For example, the browning Amazon forests in 2005 was clustered around the epicenter of the drought, but was not clustered over other regions.
Both severe droughts (in 2005 and 2010) and wet season precipitation reduction induced by El Niño events (in 2004 and 2007) decreased the dry season photosynthesis of Amazon forests, but in the subsequent year, the dry season photosynthesis recovered from the previous decreases (Figure 2). For example, 91.4%, 86.0%, and 81.5% of browning Amazon forests returned to normal or greening in the year after the 2005 drought, the 2007 El Niño event, and the 2010 drought, respectively, as indicated by the MAIAC NDVI data (Figure S4). However, this does not imply the Amazon forests’ photosynthesis recovery will continue to happen after future water stress events, because previous research [17] indicates that Amazon forests reduce the autotrophic respiration (i.e., reduce the investment in tissue maintenance and defense) to prioritize growth during droughts, compliant with eco-evolutionary theories—the accumulated reductions in autotrophic respiration might no longer support the photosynthesis recovery after future water stresses.

4. Conclusions

We assessed Amazon forests’ response to recent droughts using the MAIAC vegetation index product, and compared the results with those from the Collection 5 and Collection 6 MODIS vegetation index data. Overall, the MAIAC data reveal more realistic Amazon forest inter-annual greenness dynamics than the standard MODIS data, due to improved sensor calibration (with regard to Collection 5 MODIS data), sun-sensor geometry normalization, as well as better cloud detection and atmospheric correction algorithms. Our results from the MAIAC data suggest that: (1) the droughts decreased the greenness (i.e., photosynthetic activity) of the Amazon forests; (2) the Amazon wet season precipitation reduction induced by El Niño events could also decrease the photosynthetic activity of the Amazon forests; and (3) in the subsequent year after the water stresses, the greenness of the Amazon forests recovered from the preceding decreases. However, as previous research shows droughts cause Amazon forests to reduce investment in tissue maintenance and defense [17], it is not certain whether the photosynthesis of Amazon forests will continue to recover after future water stresses. Hence, it is important to keep monitoring the greenness of Amazon forests using satellite remote sensing.

Supplementary Materials

The supplementary materials of this paper are available online at www.mdpi.com/2072-4292/8/4/356/s1. Figure S1: Land cover types over Amazon. The land cover types were identified using the IGBP classification system in the MODIS land cover product MCD12Q1; Figure S2: Spatial patterns of standardized anomalies of dry-season precipitation over Amazon in the years from 2000 to 2012. The TRMM precipitation data were used to identify the dry season precipitation anomalies; Figure S3: Area of Amazonian forests with dry season precipitation standardized anomaly less than −1 in the years from 2000 to 2012; Figure S4: Spatial patterns of standardized anomalies of dry-season MAIAC NDVI over Amazon in the years from 2000 to 2012. Gray shaded areas are areas with missing data; Figure S5: Spatial patterns of standardized anomalies of dry-season Collection 5 NDVI over Amazon in the years from 2000 to 2012. Gray shaded areas are areas with missing data; Figure S6: Spatial patterns of standardized anomalies of dry-season Collection 6 NDVI over Amazon in the years from 2000 to 2012. Gray shaded areas are areas with missing data; Figure S7: Spatial patterns of standardized anomalies of dry-season MAIAC EVI over Amazon in the years from 2000 to 2012. Gray shaded areas are areas with missing data; Figure S8: Spatial patterns of standardized anomalies of dry-season Collection 5 EVI over Amazon in the years from 2000 to 2012. Gray shaded areas are areas with missing data; Figure S9: Spatial patterns of standardized anomalies of dry-season Collection 6 EVI over Amazon in the years from 2000 to 2012. Gray shaded areas are areas with missing data.

Acknowledgments

This research was funded by NASA Earth Science Division. J.B. also acknowledges support from the Aligned Research Program of UC Santa Cruz.

Author Contributions

J.B. and R.M. conceived and designed the experiments; J.B. performed the experiments; J.B., T.P., Y.K., and R.M. analyzed the data; A.L. and Y.W. contributed the MAIAC VI data; all authors contributed to the writing of the paper.

Conflicts of Interest

The authors declare no conflict of interest.

Abbreviations

The following abbreviations are used in this manuscript:
C5Collection 5
C6Collection 6
EVIEnhanced Vegetation Index
MAIACMulti-Angle Implementation of Atmospheric Correction
MODISModerate Resolution Imaging Spectroradiometer
NASANational Aeronautics and Space Administration
NDVINormalized Difference Vegetation Index
VIVegetation Index

References

  1. Malhi, Y.; Wood, D.; Baker, T.R.; Wright, J.; Phillips, O.L.; Cochrane, T.; Meir, P.; Chave, J.; Almeida, S.; Arroyo, L. The regional variation of aboveground live biomass in old-growth Amazonian forests. Glob. Chang. Biol. 2006, 12, 1107–1138. [Google Scholar] [CrossRef]
  2. Cox, P.M.; Betts, R.A.; Jones, C.D.; Spall, S.A.; Totterdell, I.J. Acceleration of global warming due to carbon-cycle feedbacks in a coupled climate model. Nature 2000, 408, 184–187. [Google Scholar] [CrossRef] [PubMed]
  3. Betts, R.; Cox, P.; Collins, M.; Harris, P.; Huntingford, C.; Jones, C. The role of ecosystem-atmosphere interactions in simulated Amazonian precipitation decrease and forest dieback under global climate warming. Theor. Appl. Climatol. 2004, 78, 157–175. [Google Scholar] [CrossRef]
  4. Salazar, L.F.; Nobre, C.A.; Oyama, M.D. Climate change consequences on the biome distribution in tropical South America. Geophys. Res. Lett. 2007, 34. [Google Scholar] [CrossRef]
  5. Samanta, A.; Ganguly, S.; Hashimoto, H.; Devadiga, S.; Vermote, E.; Knyazikhin, Y.; Nemani, R.R.; Myneni, R.B. Amazon forests did not green-up during the 2005 drought. Geophys. Res. Lett. 2010, 37. [Google Scholar] [CrossRef]
  6. Xu, L.; Samanta, A.; Costa, M.H.; Ganguly, S.; Nemani, R.R.; Myneni, R.B. Widespread decline in greenness of Amazonian vegetation due to the 2010 drought. Geophys. Res. Lett. 2011, 38. [Google Scholar] [CrossRef]
  7. Nepstad, D.C.; de Carvalho, C.R.; Davidson, E.A.; Jipp, P.H.; Lefebvre, P.A.; Negreiros, G.H.; da Silva, E.D.; Stone, T.A.; Trumbore, S.E.; Vieira, S. The role of deep roots in the hydrological and carbon cycles of Amazonian forests and pastures. Nature 1994, 372, 666–669. [Google Scholar] [CrossRef]
  8. Guan, K.; Pan, M.; Li, H.; Wolf, A.; Wu, J.; Medvigy, D.; Caylor, K.K.; Sheffield, J.; Wood, E.F.; Malhi, Y. Photosynthetic seasonality of global tropical forests constrained by hydroclimate. Nat. Geosci. 2015, 8, 284–289. [Google Scholar] [CrossRef]
  9. Huete, A.R.; Didan, K.; Shimabukuro, Y.E.; Ratana, P.; Saleska, S.R.; Hutyra, L.R.; Yang, W.; Nemani, R.R.; Myneni, R. Amazon rainforests green-up with sunlight in dry season. Geophys. Res. Lett. 2006, 33. [Google Scholar] [CrossRef]
  10. Myneni, R.B.; Yang, W.; Nemani, R.R.; Huete, A.R.; Dickinson, R.E.; Knyazikhin, Y.; Didan, K.; Fu, R.; Juárez, R.I.N.; Saatchi, S.S. Large seasonal swings in leaf area of Amazon rainforests. Proc. Natl. Acad. Sci. USA 2007, 104, 4820–4823. [Google Scholar] [CrossRef] [PubMed]
  11. Restrepo-Coupe, N.; da Rocha, H.R.; Hutyra, L.R.; da Araujo, A.C.; Borma, L.S.; Christoffersen, B.; Cabral, O.M.; de Camargo, P.B.; Cardoso, F.L.; da Costa, A.C.L. What drives the seasonality of photosynthesis across the Amazon basin? A cross-site analysis of eddy flux tower measurements from the Brasil flux network. Agric. For. Meteorol. 2013, 182, 128–144. [Google Scholar] [CrossRef]
  12. Doughty, C.E.; Metcalfe, D.; Girardin, C.; Amezquita, F.; Durand, L.; Huaraca Huasco, W.; Silva-Espejo, J.; Araujo-Murakami, A.; Costa, M.; Costa, A. Source and sink carbon dynamics and carbon allocation in the Amazon basin. Glob. Biogeochem. Cycles 2015, 29, 645–655. [Google Scholar] [CrossRef]
  13. Bi, J.; Knyazikhin, Y.; Choi, S.; Park, T.; Barichivich, J.; Ciais, P.; Fu, R.; Ganguly, S.; Hall, F.; Hilker, T.; et al. Sunlight mediated seasonality in canopy structure and photosynthetic activity of Amazonian rainforests. Environ. Res. Lett. 2015, 10, 064014. [Google Scholar] [CrossRef]
  14. Xu, L.; Saatchi, S.S.; Yang, Y.; Myneni, R.B.; Frankenberg, C.; Chowdhury, D.; Bi, J. Satellite observation of tropical forest seasonality: Spatial patterns of carbon exchange in Amazonia. Environ. Res. Lett. 2015, 10, 084005. [Google Scholar] [CrossRef]
  15. Gatti, L.; Gloor, M.; Miller, J.; Doughty, C.; Malhi, Y.; Domingues, L.; Basso, L.; Martinewski, A.; Correia, C.; Borges, V. Drought sensitivity of Amazonian carbon balance revealed by atmospheric measurements. Nature 2014, 506, 76–80. [Google Scholar] [CrossRef] [PubMed] [Green Version]
  16. Phillips, O.L.; Aragão, L.E.; Lewis, S.L.; Fisher, J.B.; Lloyd, J.; López-González, G.; Malhi, Y.; Monteagudo, A.; Peacock, J.; Quesada, C.A. Drought sensitivity of the Amazon rainforest. Science 2009, 323, 1344–1347. [Google Scholar] [CrossRef] [PubMed] [Green Version]
  17. Doughty, C.E.; Metcalfe, D.; Girardin, C.; Amézquita, F.F.; Cabrera, D.G.; Huasco, W.H.; Silva-Espejo, J.; Araujo-Murakami, A.; da Costa, M.; Rocha, W. Drought impact on forest carbon dynamics and fluxes in Amazonia. Nature 2015, 519, 78–82. [Google Scholar] [CrossRef] [PubMed] [Green Version]
  18. Nepstad, D.C.; Tohver, I.M.; Ray, D.; Moutinho, P.; Cardinot, G. Mortality of large trees and lianas following experimental drought in an Amazon forest. Ecology 2007, 88, 2259–2269. [Google Scholar] [CrossRef] [PubMed]
  19. Marengo, J.A.; Nobre, C.A.; Tomasella, J.; Oyama, M.D.; Sampaio de Oliveira, G.; De Oliveira, R.; Camargo, H.; Alves, L.M.; Brown, I.F. The drought of Amazonia in 2005. J. Clim. 2008, 21, 495–516. [Google Scholar] [CrossRef]
  20. Lewis, S.L.; Brando, P.M.; Phillips, O.L.; van der Heijden, G.M.; Nepstad, D. The 2010 Amazon drought. Science 2011, 331, 554–554. [Google Scholar] [CrossRef] [PubMed]
  21. Maeda, E.E.; Kim, H.; Aragão, L.E.; Famiglietti, J.S.; Oki, T. Disruption of hydroecological equilibrium in southwest Amazon mediated by drought. Geophys. Res. Lett. 2015, 42, 7546–7553. [Google Scholar] [CrossRef]
  22. Ropelewski, C.F.; Halpert, M.S. Global and regional scale precipitation patterns associated with the El Niño/Southern Oscillation. Mon. Weather Rev. 1987, 115, 1606–1626. [Google Scholar] [CrossRef]
  23. Asner, G.P.; Alencar, A. Drought impacts on the Amazon forest: The remote sensing perspective. New Phytol. 2010, 187, 569–578. [Google Scholar] [CrossRef] [PubMed]
  24. Myneni, R.B.; Hall, F.G.; Sellers, P.J.; Marshak, A.L. The interpretation of spectral vegetation indexes. IEEE Trans. Geosci. Remote Sens. 1995, 33, 481–486. [Google Scholar] [CrossRef]
  25. Huete, A.; Didan, K.; Miura, T.; Rodriguez, E.P.; Gao, X.; Ferreira, L.G. Overview of the radiometric and biophysical performance of the MODIS vegetation indices. Remote Sens. Environ. 2002, 83, 195–213. [Google Scholar] [CrossRef]
  26. Samanta, A.; Ganguly, S.; Vermote, E.; Nemani, R.R.; Myneni, R.B. Why is remote sensing of Amazon forest greenness so challenging? Earth Interact. 2012, 16, 1–14. [Google Scholar] [CrossRef]
  27. Saleska, S.R.; Didan, K.; Huete, A.R.; Da Rocha, H.R. Amazon forests green-up during 2005 drought. Science 2007, 318, 612–612. [Google Scholar] [CrossRef] [PubMed]
  28. Leinenkugel, P.; Kuenzer, C.; Dech, S. Comparison and enhancement of MODIS cloud mask products for Southeast Asia. Int. J. Remote Sens. 2013, 34, 2730–2748. [Google Scholar] [CrossRef]
  29. Wilson, A.M.; Parmentier, B.; Jetz, W. Systematic land cover bias in Collection 5 MODIS cloud mask and derived products—A global overview. Remote Sens. Environ. 2014, 141, 149–154. [Google Scholar] [CrossRef]
  30. Grogan, K.; Fensholt, R. Exploring patterns and effects of aerosol quantity flag anomalies in MODIS surface reflectance products in the tropics. Remote Sens. 2013, 5, 3495–3515. [Google Scholar] [CrossRef]
  31. Saatchi, S.; Asefi-Najafabady, S.; Malhi, Y.; Aragão, L.E.; Anderson, L.O.; Myneni, R.B.; Nemani, R. Persistent effects of a severe drought on Amazonian forest canopy. Proc. Natl. Acad. Sci. USA 2013, 110, 565–570. [Google Scholar] [CrossRef] [PubMed]
  32. Atkinson, P.; Dash, J.; Jeganathan, C. Amazon vegetation greenness as measured by satellite sensors over the last decade. Geophys. Res. Lett. 2011, 38, L19105. [Google Scholar] [CrossRef]
  33. Lyapustin, A.; Martonchik, J.; Wang, Y.; Laszlo, I.; Korkin, S. Multiangle implementation of atmospheric correction (MAIAC): 1. Radiative transfer basis and look-up tables. J. Geophys. Res. Atmos. 2011, 116. [Google Scholar] [CrossRef]
  34. Lyapustin, A.; Wang, Y.; Laszlo, I.; Kahn, R.; Korkin, S.; Remer, L.; Levy, R.; Reid, J. Multiangle implementation of atmospheric correction (MAIAC): 2. Aerosol algorithm. J. Geophys. Res. Atmos. 2011, 116. [Google Scholar] [CrossRef]
  35. Lyapustin, A.I.; Wang, Y.; Laszlo, I.; Hilker, T.; G Hall, F.; Sellers, P.J.; Tucker, C.J.; Korkin, S.V. Multi-angle implementation of atmospheric correction for MODIS (MAIAC): 3. Atmospheric correction. Remote Sens. Environ. 2012, 127, 385–393. [Google Scholar] [CrossRef]
  36. Lyapustin, A.; Wang, Y.; Frey, R. An automatic cloud mask algorithm based on time series of MODIS measurements. J. Geophys. Res. Atmos. 2008, 113. [Google Scholar] [CrossRef]
  37. Hilker, T.; Lyapustin, A.I.; Tucker, C.J.; Sellers, P.J.; Hall, F.G.; Wang, Y. Remote sensing of tropical ecosystems: Atmospheric correction and cloud masking matter. Remote Sens. Environ. 2012, 127, 370–384. [Google Scholar] [CrossRef]
  38. Hilker, T.; Lyapustin, A.I.; Tucker, C.J.; Hall, F.G.; Myneni, R.B.; Wang, Y.; Bi, J.; de Moura, Y.M.; Sellers, P.J. Vegetation dynamics and rainfall sensitivity of the Amazon. Proc. Natl. Acad. Sci. USA 2014, 111, 16041–16046. [Google Scholar] [CrossRef] [PubMed]
  39. Lyapustin, A.; Wang, Y.; Xiong, X.; Meister, G.; Platnick, S.; Levy, R.; Franz, B.; Korkin, S.; Hilker, T.; Tucker, J. Scientific impact of MODIS C5 calibration degradation and C6+ improvements. Atmos. Meas. Tech. 2014, 7, 4353–4365. [Google Scholar] [CrossRef]
  40. Friedl, M.A.; Sulla-Menashe, D.; Tan, B.; Schneider, A.; Ramankutty, N.; Sibley, A.; Huang, X. MODIS Collection 5 global land cover: Algorithm refinements and characterization of new datasets. Remote Sens. Environ. 2010, 114, 168–182. [Google Scholar] [CrossRef]
  41. Huffman, G.J.; Adler, R.F.; Rudolf, B.; Schneider, U.; Keehn, P.R. Global precipitation estimates based on a technique for combining satellite-based estimates, rain gauge analysis, and NWP model precipitation information. J. Clim. 1995, 8, 1284–1295. [Google Scholar] [CrossRef]
  42. Wang, D.; Morton, D.; Masek, J.; Wu, A.; Nagol, J.; Xiong, X.; Levy, R.; Vermote, E.; Wolfe, R. Impact of sensor degradation on the MODIS NDVI time series. Remote Sens. Environ. 2012, 119, 55–61. [Google Scholar] [CrossRef]
  43. Thomas, A.C.; Reager, J.T.; Famiglietti, J.S.; Rodell, M. A GRACE-based water storage deficit approach for hydrological drought characterization. Geophys. Res. Lett. 2014, 41, 1537–1545. [Google Scholar] [CrossRef]
Figure 1. MAIAC products provide more valid observations than both Collection 5 and Collection 6 MODIS products over the Amazon forests in the Amazonian dry season, and the Terra-Aqua combined products yield more valid observations than the Terra or Aqua product alone. (a) Area of Amazon forests with valid dry season mean vegetation index from MAIAC data; (b) Area of Amazon forests with valid dry season mean vegetation index from Collection 5 MODIS VI product; (c) Area of Amazon forests with valid dry season mean vegetation index from Collection 6 MODIS VI product. The vegetation index used for this figure is NDVI. The area of the Amazonian forests is 6.4 million km2.
Remotesensing 08 00356 g001
Figure 2. Time series of the area of greening and browning Amazon forests. Forests with greenness standardized anomalies greater than +1 are marked as greening forests; and forests with greenness standardized anomalies less than −1 are marked as browning forests. (a) Results from MAIAC NDVI data; (b) Results from MAIAC EVI data; (c) Results from Collection 5 MODIS NDVI data; (d) Results from Collection 5 MODIS EVI data; (e) Results from Collection 6 MODIS NDVI data; (f) Results from Collection 6 MODIS EVI data. Collection 5 MODIS vegetation index data show apparent increasing trends of browning area over the Amazon forests, but neither MAIAC nor Collection 6 data show such trends.
Remotesensing 08 00356 g002
Figure 3. Spatial patterns of remotely sensed Amazonian dry season greenness standardized anomalies of the drought-affected vegetation, including forests, over Amazon in the 2005 drought year. The Amazonian dry season generally lasts from July to September (JAS). (a) Results from MAIAC NDVI data; (b) Results from Collection 5 MODIS NDVI data; (c) Results from Collection 6 MODIS NDVI data; (d) Results from MAIAC EVI data; (e) Results from Collection 5 MODIS EVI data; (f) Results from Collection 6 MODIS EVI data.
Remotesensing 08 00356 g003
Figure 4. Spatial patterns of remotely sensed Amazonian dry season greenness standardized anomalies of the drought-affected vegetation, including forests, over Amazon in the 2010 drought year. The Amazonian dry season generally lasts from July to September (JAS). (a) Results from MAIAC NDVI data; (b) Results from Collection 5 MODIS NDVI data; (c) Results from Collection 6 MODIS NDVI data; (d) Results from MAIAC EVI data; (e) Results from Collection 5 MODIS EVI data; (f) Results from Collection 6 MODIS EVI data.
Remotesensing 08 00356 g004
Figure 5. Histograms of remotely sensed greenness standardized anomalies over drought impacted Amazon forests in 2005 and 2010. (a) Histograms of NDVI standardized anomalies in 2005; (b) Histograms of EVI standardized anomalies in 2005; (c) Histograms of NDVI standardized anomalies in 2010; (d) Histograms of EVI standardized anomalies in 2010.
Remotesensing 08 00356 g005
Table 1. Percentages of greening, browning, no-change, and valid areas within Amazon forests impacted by the 2005 and 2010 droughts, as shown by various remote sensing products.
Data SetGreening (%)Browning (%)No Change (%)Valid (%)
2005
MAIAC-NDVI9.0914.9069.7293.71
C5-NDVI7.0710.7563.1080.92
C6-NDVI8.8513.0461.3383.23
MAIAC-EVI12.796.8474.0293.65
C5-EVI20.187.2054.8882.25
C6-EVI13.2510.7259.9183.88
2010
MAIAC-NDVI5.6133.1655.9994.76
C5-NDVI2.6528.7642.8174.21
C6-NDVI3.6428.2143.6875.53
MAIAC-EVI7.7127.2859.7294.71
C5-EVI11.4018.0551.9281.37
C6-EVI15.5712.7148.7277.01

