Trans-Cinnamic Acid Stimulates White Fat Browning and Activates Brown Adipocytes

Department of Biotechnology, Daegu University, Gyeongsan, Gyeongbuk 38453, Korea
*
Author to whom correspondence should be addressed.
Nutrients 2019, 11(3), 577; https://0-doi-org.brum.beds.ac.uk/10.3390/nu11030577
Submission received: 2 February 2019
/
Revised: 26 February 2019
/
Accepted: 4 March 2019
/
Published: 8 March 2019
Abstract
:Recently, pharmacological activation of brown fat and induction of white fat browning (beiging) have been considered promising strategies to treat obesity. To search for natural products that could stimulate the process of browning in adipocytes, we evaluated the activity of trans-cinnamic acid (tCA), a class of cinnamon from the bark of Cinnamomum cassia, by determining genetic expression using real time reverse transcription polymerase chain reaction (RT-PCR) and protein expression by immunoblot analysis for thermogenic and fat metabolizing markers. In our study tCA induced brown like-phenotype in 3T3-L1 white adipocytes and activated HIB1B brown adipocytes. tCA increased protein content of brown-fat-specific markers (UCP1, PRDM16, and PGC-1α) and expression levels of beige-fat-specific genes (Cd137, Cidea, Cited1, Tbx1, and Tmen26) in 3T3-L1 white adipocytes, as well as brown-fat-specific genes (Lhx8, Ppargc1, Prdm16, Ucp1, and Zic1) in HIB1B brown adipocytes. Furthermore, tCA reduced expression of key adipogenic transcription factors C/EBPα and PPARγ in white adipocytes, but enhanced their expressions in brown adipocytes. In addition, tCA upregulates lipid catabolism. Moreover, mechanistic study revealed that tCA induced browning in white adipocytes by activating the β3-AR and AMPK signaling pathways. tCA can induce browning, increase fat oxidation, reduce adipogenesis and lipogenesis in 3T3-L1 adipocytes, and activate HIB1B adipocytes, suggesting its potential to treat obesity.
1. Introduction
Obesity is associated with numerous other metabolic complications including diabetes, hypertension, hyperlipidemia, atherosclerosis, and cardiovascular diseases [1]. Notably, obesity is caused by oversupply of energy provided by excess fat that is accumulated in the body without being consumed [2]. Besides exercise and calorie restriction, another alternative way to lose weight and reduce obesity is to increase energy expenditure by activating brown adipocytes [3].
There are three types of fat in humans: (1) white adipose tissue (WAT), which makes up nearly all fat in adults; (2) brown adipose tissue (BAT), which is involved in energy expenditure; and (3) brown in white fat (brite or beige fat), which converts from white adipocytes to brown-like adipocytes and contributes to energy expenditure in humans [4]. Targeting adipose tissue has potential therapeutic importance for the treatment of obesity and other metabolic disorders [5]. Recent discovery in the process of browning, or beiging, has heightened an interest in research for exhibiting this particular process to be an efficient technique in the conquest of obesity [6,7].
The fundamental factor leading to the process of adaptive thermogenesis is governed by uncoupling protein 1 (UCP1) [8], known to be expressed in brown and beige adipocytes [9]. UCP1 releases heat as a form of energy after uncoupling the electron transport chain for energy production [10]. It plays a critical role in energy balance and metabolic regulation of cold and diet-induced thermogenesis [11,12]. Recent studies have identified ectopic expression of other hallmark proteins, such as PGC-1α and PRDM16, as novel beige-fat-specific markers [13,14]. These proteins can be targets for the identification of brown fat-activation or browning/beiging agents [15,16,17]. Among the genetic markers, Cd137, Cited1, Tbx1, and Tmem26 have been reported for beige-specific markers, while genes, Eva1, Lhx8, and Zic have been specified for brown adipocytes [18,19].
Recently, advances have been made to understand the roles of pharmacological agents and dietary supplements that contribute to browning of white adipocytes [20]. To date, a variety of natural compounds have shown promise for regulating BAT activity and recruiting beige adipocytes, as well as enhancing lipolytic and catabolic potential of WAT [20,21,22,23].
Cinnamon (Cinnamomum cassia) is one of the most important spices used daily by many people all over the world. Cinnamon primarily contains essential oil (Cinnamomum vernum) and other derivatives such as cinnamaldehyde and cinnamic acid [24,25]. Among several analogs of cinnamon, trans-cinnamic acid (tCA) is known to exhibit various health-promoting properties, including anti-diabetic [26], anti-inflammatory, and anti-cancer activities [27]. Another important feature displayed by tCA is that it can reduce body weight of obese rats [28] by improving insulin sensitivity and blood lipids [29].
To date, little research has been done concerning regulatory roles of tCA in lipid metabolism, particularly in fat browning. Therefore, the objective of the present study was to examine physiological roles of tCA in lipid metabolism of 3T3-L1 white adipocytes and HIB1B brown adipocytes, focusing on browning.
2. Materials and Methods
2.1. Chemicals
Trans-cinnamic acid (99% purity, Figure 1A) was purchased from Sigma Chemical Co. (St. Louis, MO, USA). BRL 37344 and L-748.337 were purchased from Tocris Bioscience (Bristol, UK). AICAR was purchased from TCI (Chuo-ku, Tokyo, Japan). Dorsomorphin was purchased from Abcam (Cambridge, UK). All other chemicals used in this study were of analytical grade.
2.2. Cell Culture and Differentiation
3T3-L1 and HIB1B pre-adipocytes (ATCC, Manassas, VA, USA) were cultured in Dulbecco’s Modified Eagle’s Medium (DMEM, Thermo Fisher Scientific, Waltham, MA, USA), supplemented with 10% fetal bovine serum (FBS, PAA Laboratories, Pasching, Austria) and 100 µg/mL of penicillin-streptomycin (Invitrogen, Carlsbad, CA, USA) at 37 °C in a 5% CO2 incubator. Sufficiently confluent cells were maintained in differentiation induction medium consisting of 10 µg/mL of insulin (Sigma, St. Louis, MO, USA), 0.25 µM dexamethasone (Dex, Sigma), and 0.5 mM 3-isobutyl-1-methylxanthine (IBMX, Sigma) in DMEM, followed by culturing in maturation medium containing 10% FBS and 10 µg/mL of insulin. During treatments, unless otherwise stated, cells were maintained in complete medium containing 100 µM tCA (dissolved in dilute ethanol) for 6–8 days before further analysis. Maturation medium was changed every 2 days. Cytotoxicity of tCA was evaluated by MTT assay as described previously [30]. The cellular in vitro models used in this study were commercially available models. We did not use any kind of human samples to require the approval of the Ethics Committee.
2.3. Quantitative Real-Time Reverse Transcription Polymerase Chain Reaction (RT-PCR)
Total RNA was isolated from mature cells (4–8 days) using a total RNA isolation kit (RNA-spin, iNtRON Biotechnology, Seongnam, Korea). RNA (1 μg) was converted to cDNA using Maxime RT premix (iNtRON Biotechnology). Power SYBR Green (Roche Diagnostics Gmbh, Mannheim, Germany) was employed to quantitatively determine transcription levels of genes by quantitative RT-PCR (Stratagene 246 mix 3000p QPCR System, Agilent Technologies, Santa Clara, CA, USA). PCR reactions were run in duplicates for each sample. Transcription levels of all genes were normalized to the level of β-actin. Sequences of primer sets used in this study are listed in Table 1.
2.4. Oil Red O Staining
Cells were matured for 4–8 days followed by washing with phosphate-buffered saline (PBS), fixation with 10% formalin for 1 h at room temperature, and washing again three times with deionized water. A mixture of Oil Red O solution (0.6% Oil Red O dye in isopropanol) and water at a 6:4 ratio was layered onto cells for 20 min, followed by washing four times with deionized water. Images of the stained lipid droplets were visualized using an inverted microscope. Intracellular lipid content was quantified after extracting ORO bound to cells with 100% isopropanol, and absorbance at 500nm was determined in triplicate wells using a microplate reader.
2.5. Immunoblot Analysis
Cell lysates were prepared using RIPA buffer (Sigma) by homogenization and centrifugation at 13,000× g for 30 min. Cell extracts were diluted in 5X sample buffer (50 mM Tris at pH 6.8, 2% SDS, 10% glycerol, 5% β-mercaptoethanol, and 0.1% bromophenol blue) and heated at 95 °C for 5 min before 8%, 10%, or 12% SDS-polyacrylamide gel electrophoresis (PAGE). After electrophoresis, samples were transferred onto a poly vinylidene difluoride membrane (PVDF, ATTO Technology, Amherst, NY, USA) and then blocked for 1 h with TBS-T 10 mM Tris-HCl, 150 mM NaCl, and 0.1% Tween 20) containing 5% skim milk (Sigma) or BSA (Rocky Mountain Biologicals, Missoula, MT, USA). The membrane was rinsed three times consecutively with TBS-T buffer, followed by incubation at room temperature for 1 h with 1:1000 diluted primary polyclonal antibodies, including anti-ATGL, anti-ACC, anti-pACC, anti-β-actin, anti-PPARγ, anti-AMPK, anti-pAMPK, anti-UCP1, anti-PGC-1α, anti-CPT1, anti-ACOX1, anti-C/EBPα, anti-β3-AR, anti-PKA, anti-FAS (Santa Cruz Biotechnology, Santa Cruz, CA, USA), anti-PRDM16(Abcam, Cambridge, UK) and anti-pHSL (Cell Signaling Technology, Inc., Danvers, MA, USA), in TBS-T buffer containing 1% skim milk or BSA. After three washes, the membrane was incubated with horseradish peroxidase-conjugated anti-goat IgG, anti-rabbit IgG, or anti-mouse IgG secondary antibody (1:1000, Santa Cruz Biotechnology) in TBS-T buffer containing 1% skim milk or in BSA at room temperature for 1 h. Immunoblots were then developed with enhanced chemiluminescence and captured with ImageQuant LAS500 (GE Healthcare Life Sciences, Malborough, MA, USA). Every experiment was representative of three independent experiments. Protein band intensities were normalized using β-actin bands in each cell sample and band intensities were quantified using ImageJ software (NIH, Bethesda, MD, USA).
2.6. Immunocytochemistry
Immunocytochemistry was performed on formalin-fixed cells. These cells were incubated with anti-UCP1 (dilution 1:1000, Santa Cruz Biotechnology) primary antibody at 4 °C overnight, followed by incubation with appropriate FITC goat anti-mouse secondary antibody at room temperature for 4 h. For staining of mitochondria, MitoTracker®Red (1 mM, Cell Signaling Technology, Inc.) was directly added to PBB-T (PBS + 1%, BSA, and 0.1% Tween 20) at a concentration of 200 nM. Cells were then incubated at 37 °C for 2 h. After incubation, tissues were washed with PBS and subjected to immunostaining. Morphological findings were observed using a light microscope at 40× magnification.
2.7. Statistical Analysis
All data are presented as mean ± SD of at least three independent experiments. Statistical significance among multiple groups was determined by one-way analysis of variance (ANOVA) followed by Tukey’s post-hoc test or two-tailed Student’s t-test using Statistical Package of Social Science (SPSS) software version 17.0 (SPSS Inc., Chicago, IL, USA). Statistical significance was indicated as either p < 0.05 or p < 0.01.
3. Results
3.1. Trans-Cinnamic Acid (tCA) Induces Browning in 3T3-L1 White Adipocytes
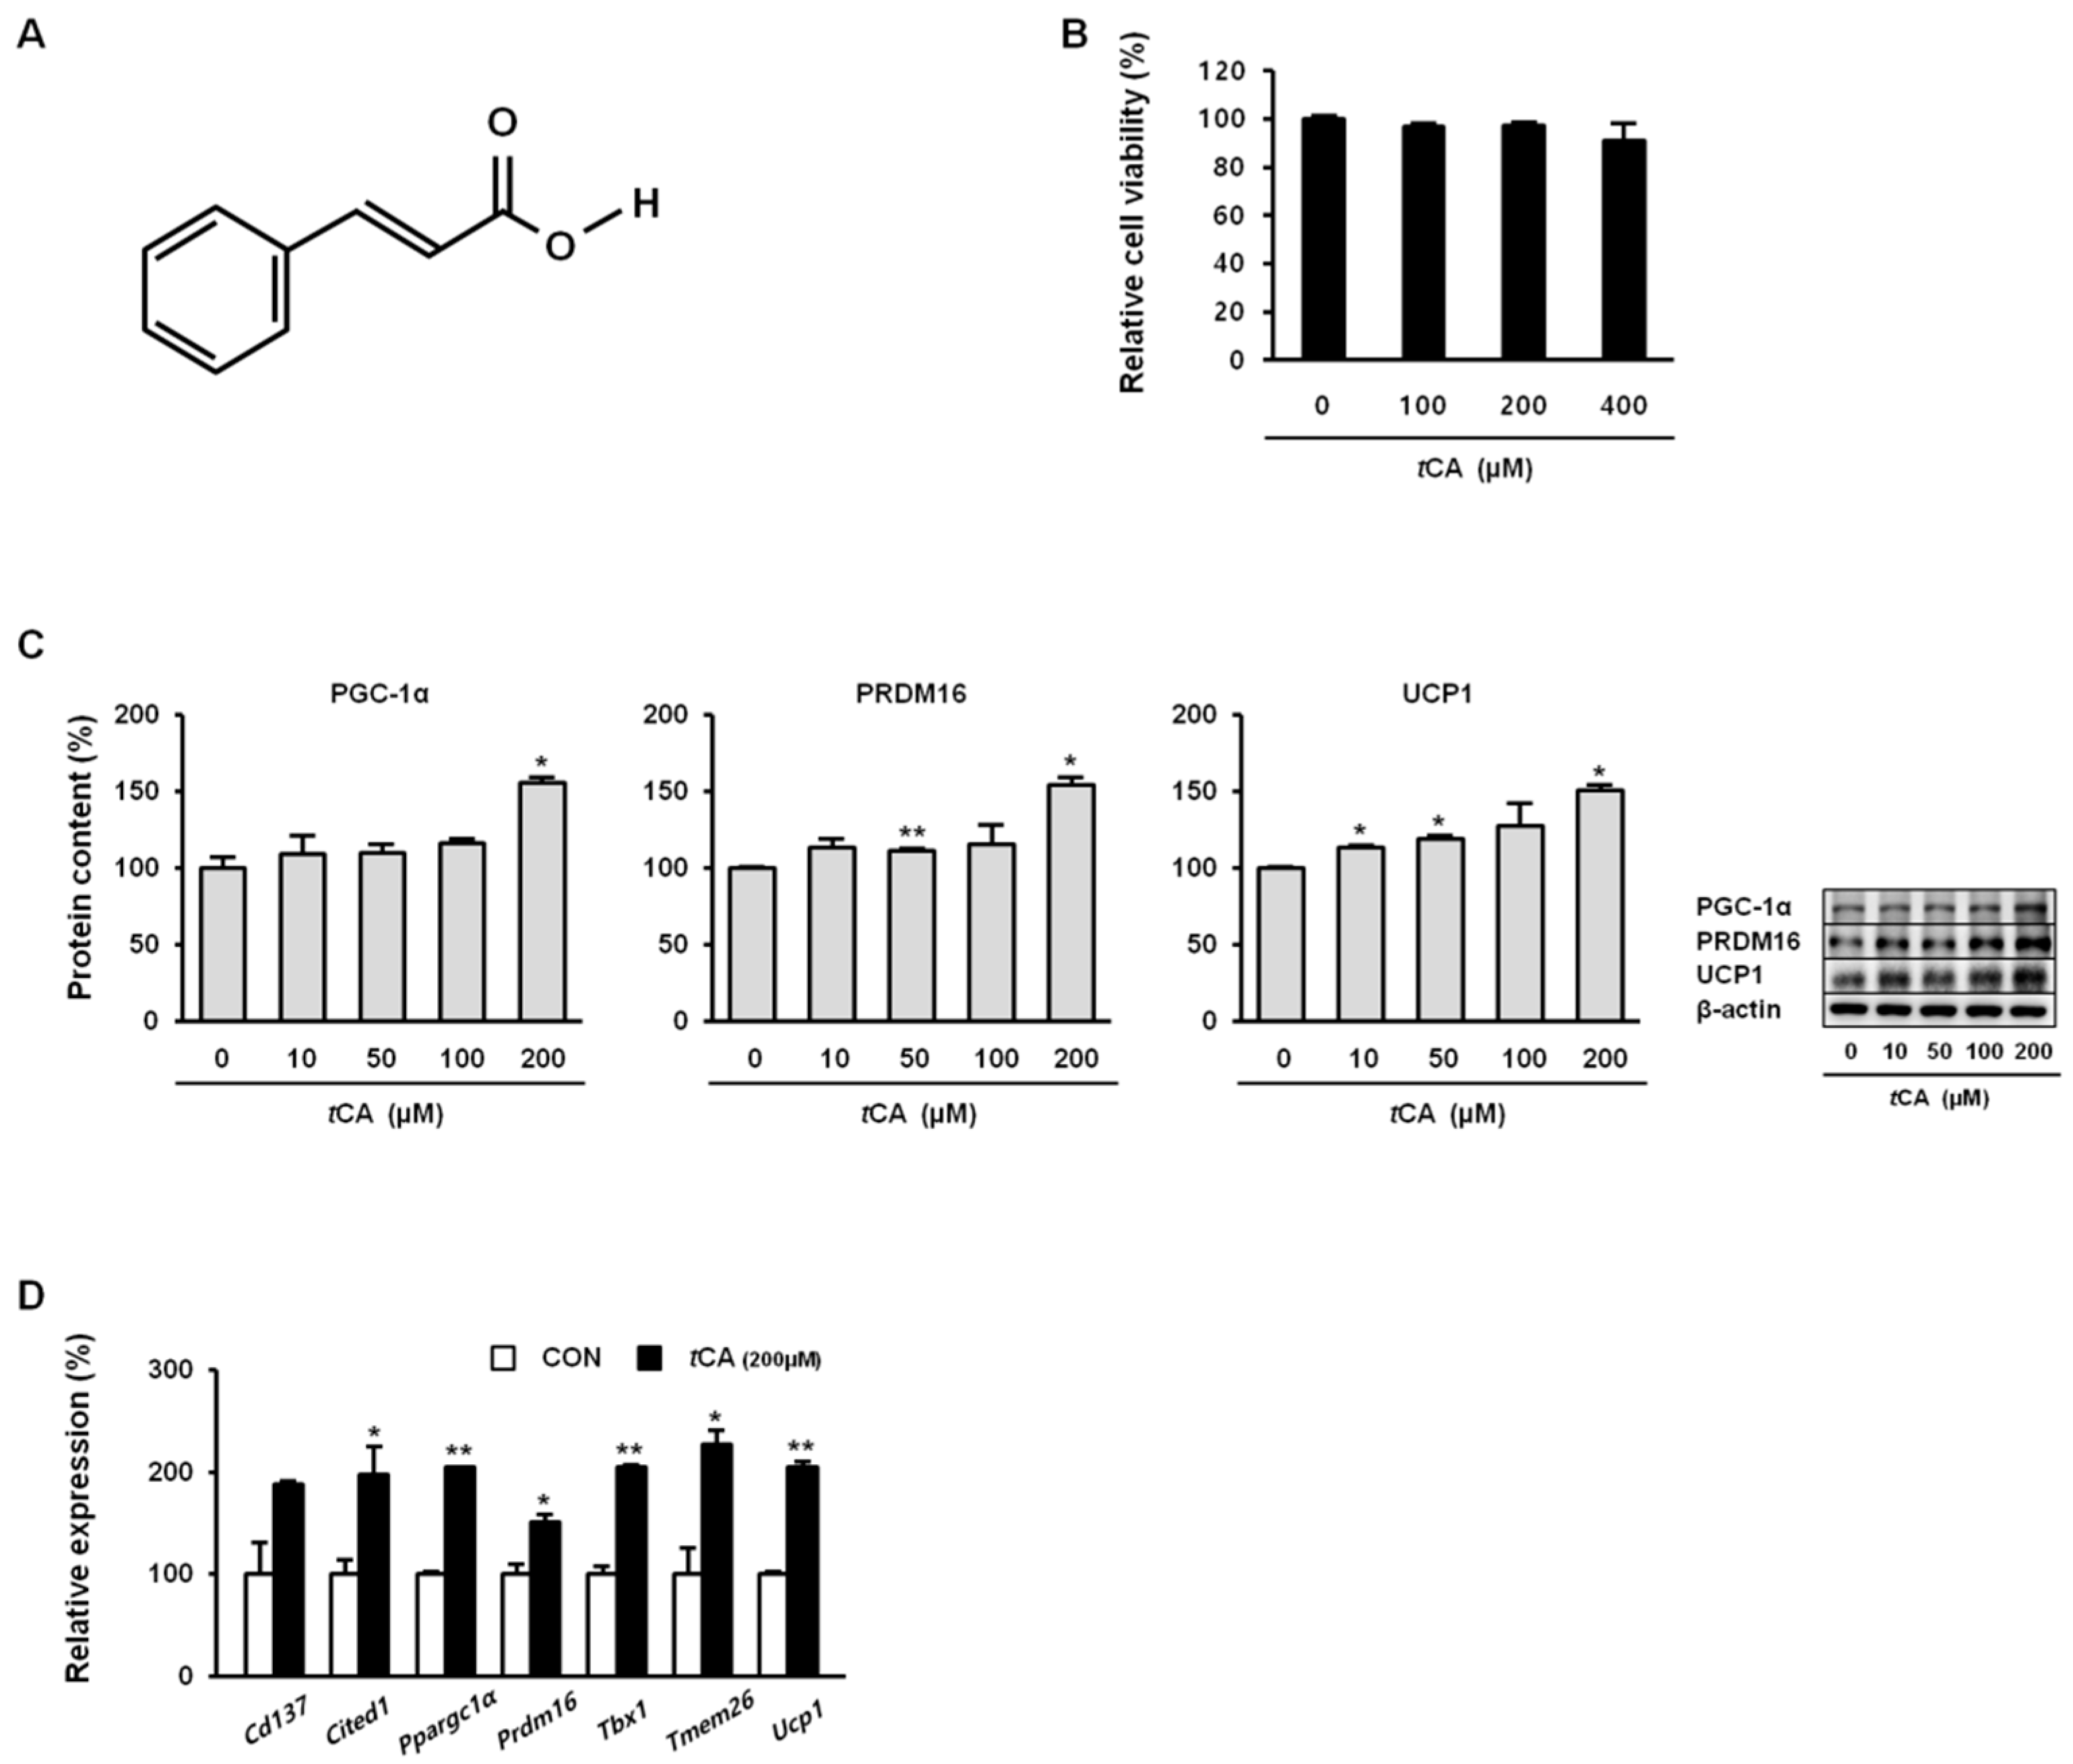
First, tCA cytotoxicity to 3T3-L1 preadipocytes was evaluated by MTT assay. As shown in Figure 1B, tCA resulted in no significant cytotoxicity at concentration up to 400 μM. Hence, unless otherwise stated, cells were treated with 200 μM tCA to investigate its browning effect. As shown in Figure 1C, tCA significantly upregulated the expression of brown-fat-specific proteins PGC-1α, PRDM16, and UCP1 in a dose-dependent manner. It also significantly upregulated genes Ppargc1a, Prdm16, and Ucp1 and beige-fat-specific genes Cd137, Cited1, Tbx1, and Trem26 (Figure 1D).
3.2. tCA Activates HIB1B Brown Adipocytes
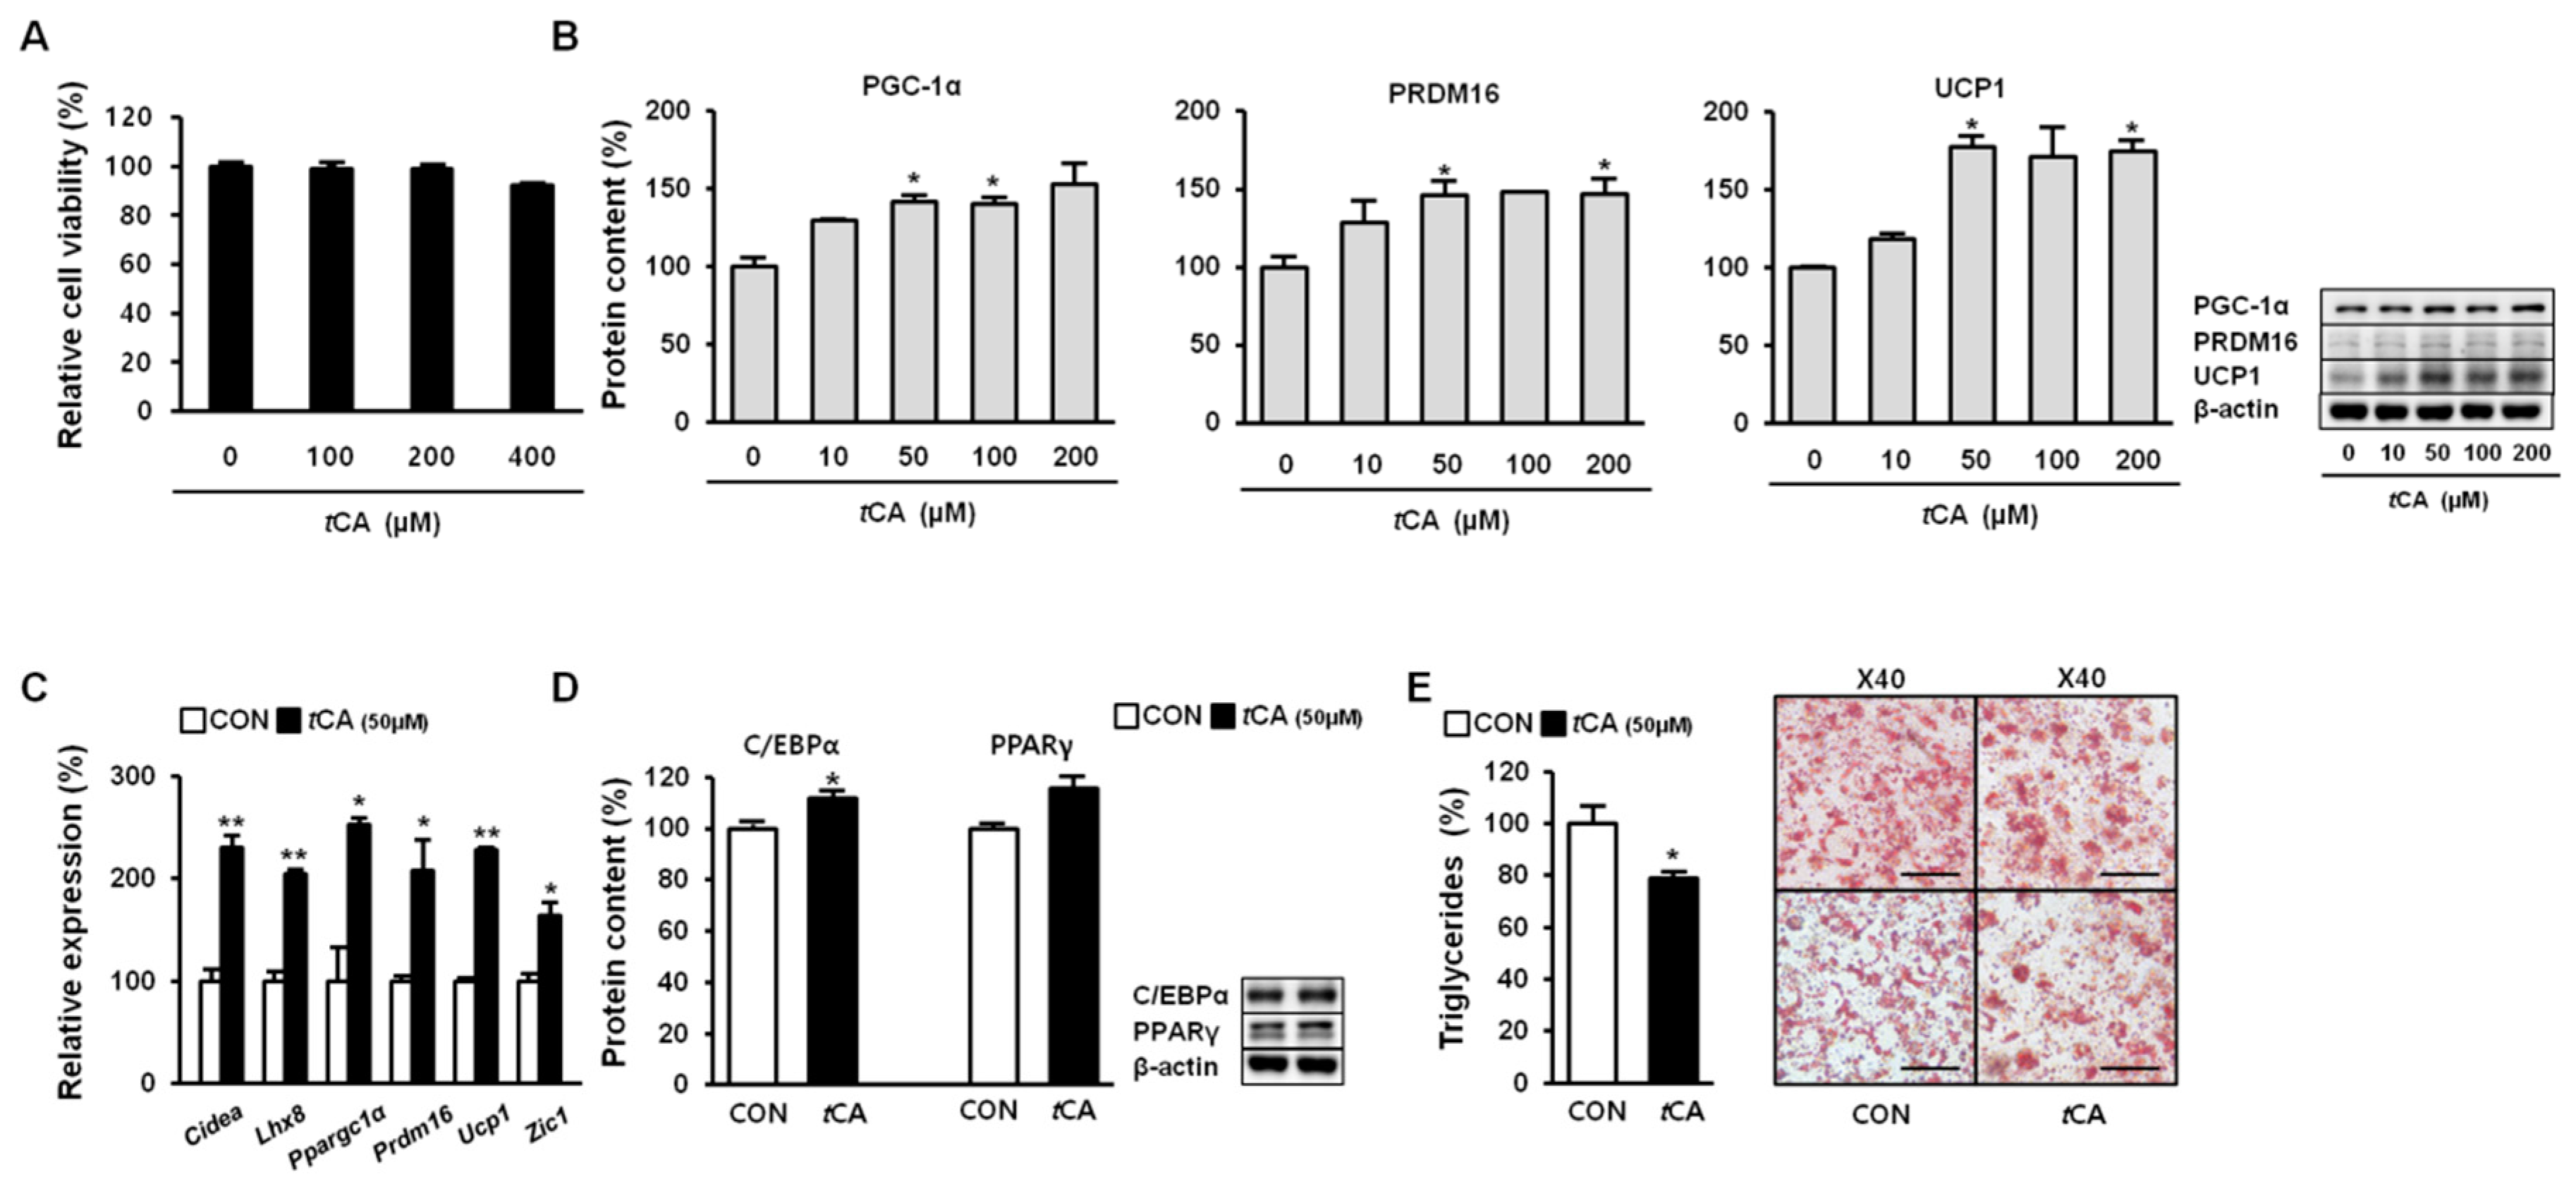
Since tCA showed no detectable cytotoxicity at concentrations up to 400 μM (Figure 2A), we further investigated whether tCA could activate HIB1B brown adipocytes. To this end, we allowed HIB1B adipocytes to differentiate in complete media containing different concentrations of tCA (0–200 μM). Our results demonstrated that tCA strikingly activated HIB1B brown adipocytes by enhancing expression levels of brown fat-specific proteins PGC-1α, PRDM16, and UCP1 in a dose-dependent manner (Figure 2B). It also significantly upregulated brown-fat signature genes Cidea, Lhx8, Ppargc1a, Prdm16, Ucp1, and Zic1 at concentration of 50 μM (Figure 2C). Next, we determined expression levels of key adipogenic transcription factors (e.g., C/EBPα and PPARγ) in HIB1B adipocytes. Their expression levels were remarkably elevated upon tCA treatment (50 μM) (Figure 2D), suggesting that tCA could stimulate adipogenesis in brown adipocytes. In addition, tCA treatment (50 μM) decreased intensity of Oil Red O staining (Figure 2E).
3.3. tCA Promotes Mitochondrial Biogenesis in White and Brown Adipocytes
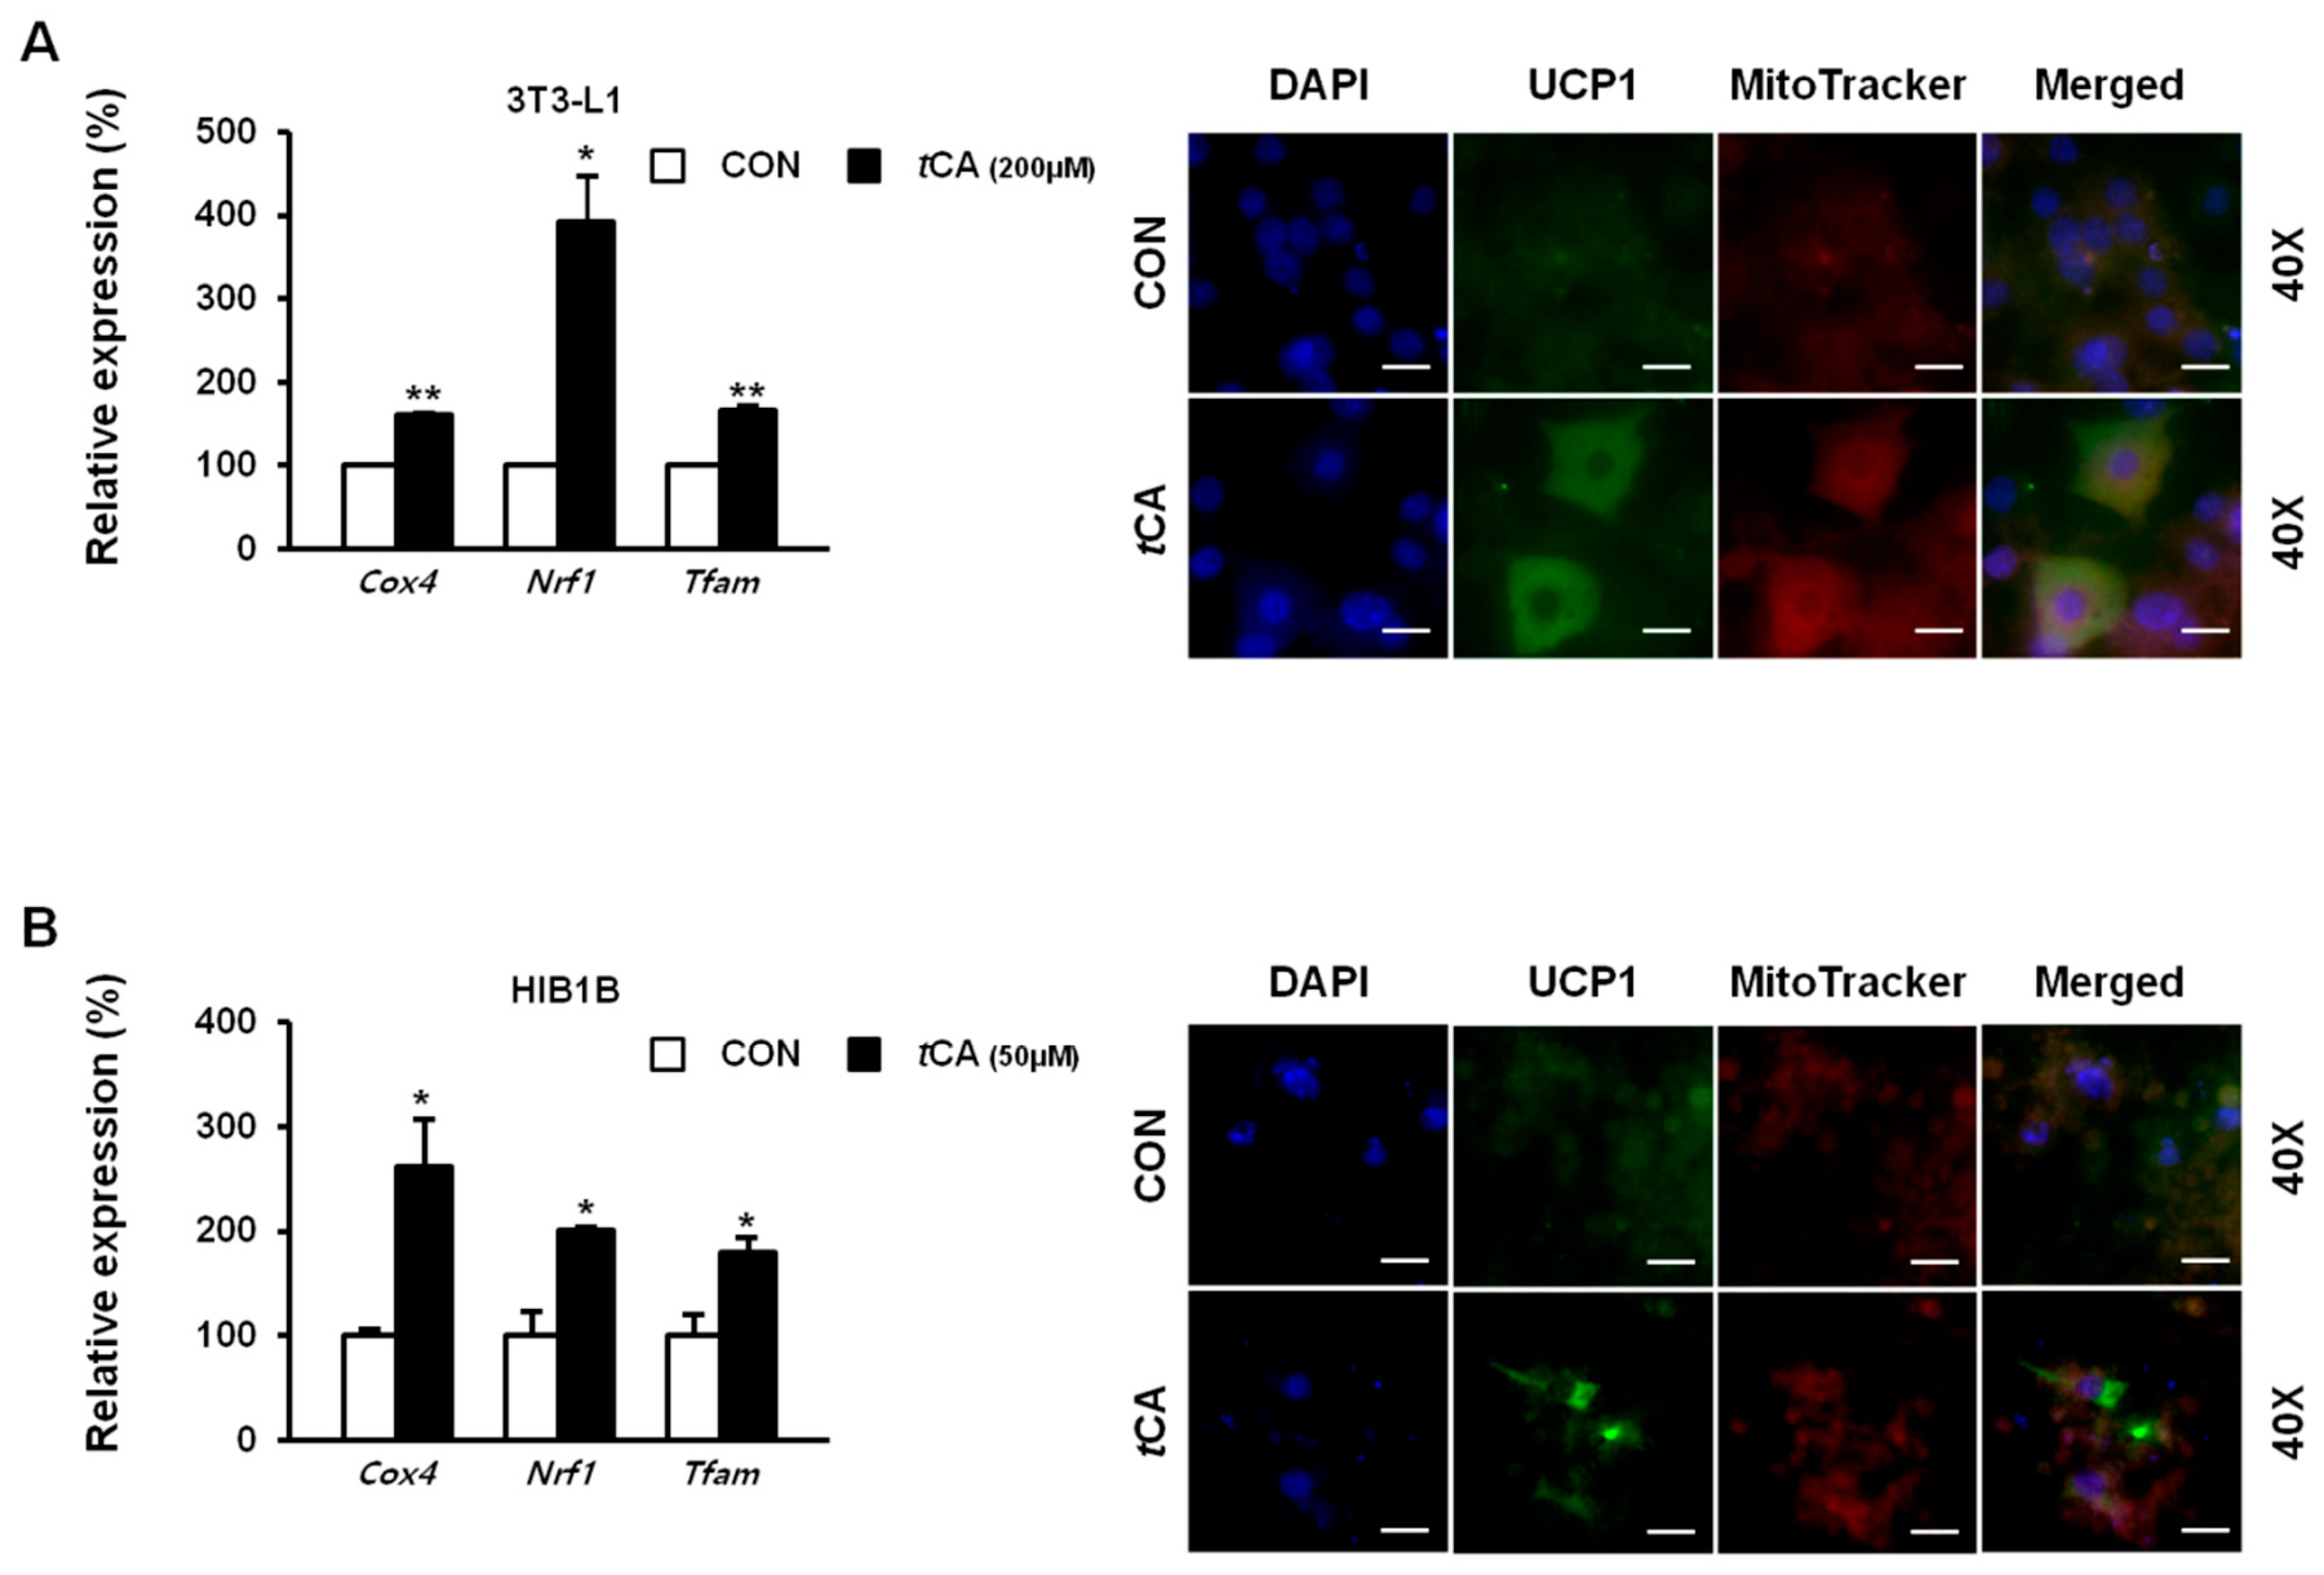
As mentioned previously, tCA activated thermogenic marker proteins in both white and brown adipocytes. To confirm this result at genetic level we verified the mitochondrial biogenic genes Cox4, Nrf1, MtDNA, and Tfam, which expressed an elevated expression as well as at cellular level, where we directly detected UCP1 protein levels in both differentiated adipocytes using immunofluorescent staining with MitoTracker®Red. Results revealed stronger signals in tCA-treated 3T3-L1 (Figure 3A) and HIB1B (Figure 3B) adipocytes compared to those in both control adipocytes.
3.4. tCA Regulates Lipid Metabolism in White Adipocytes
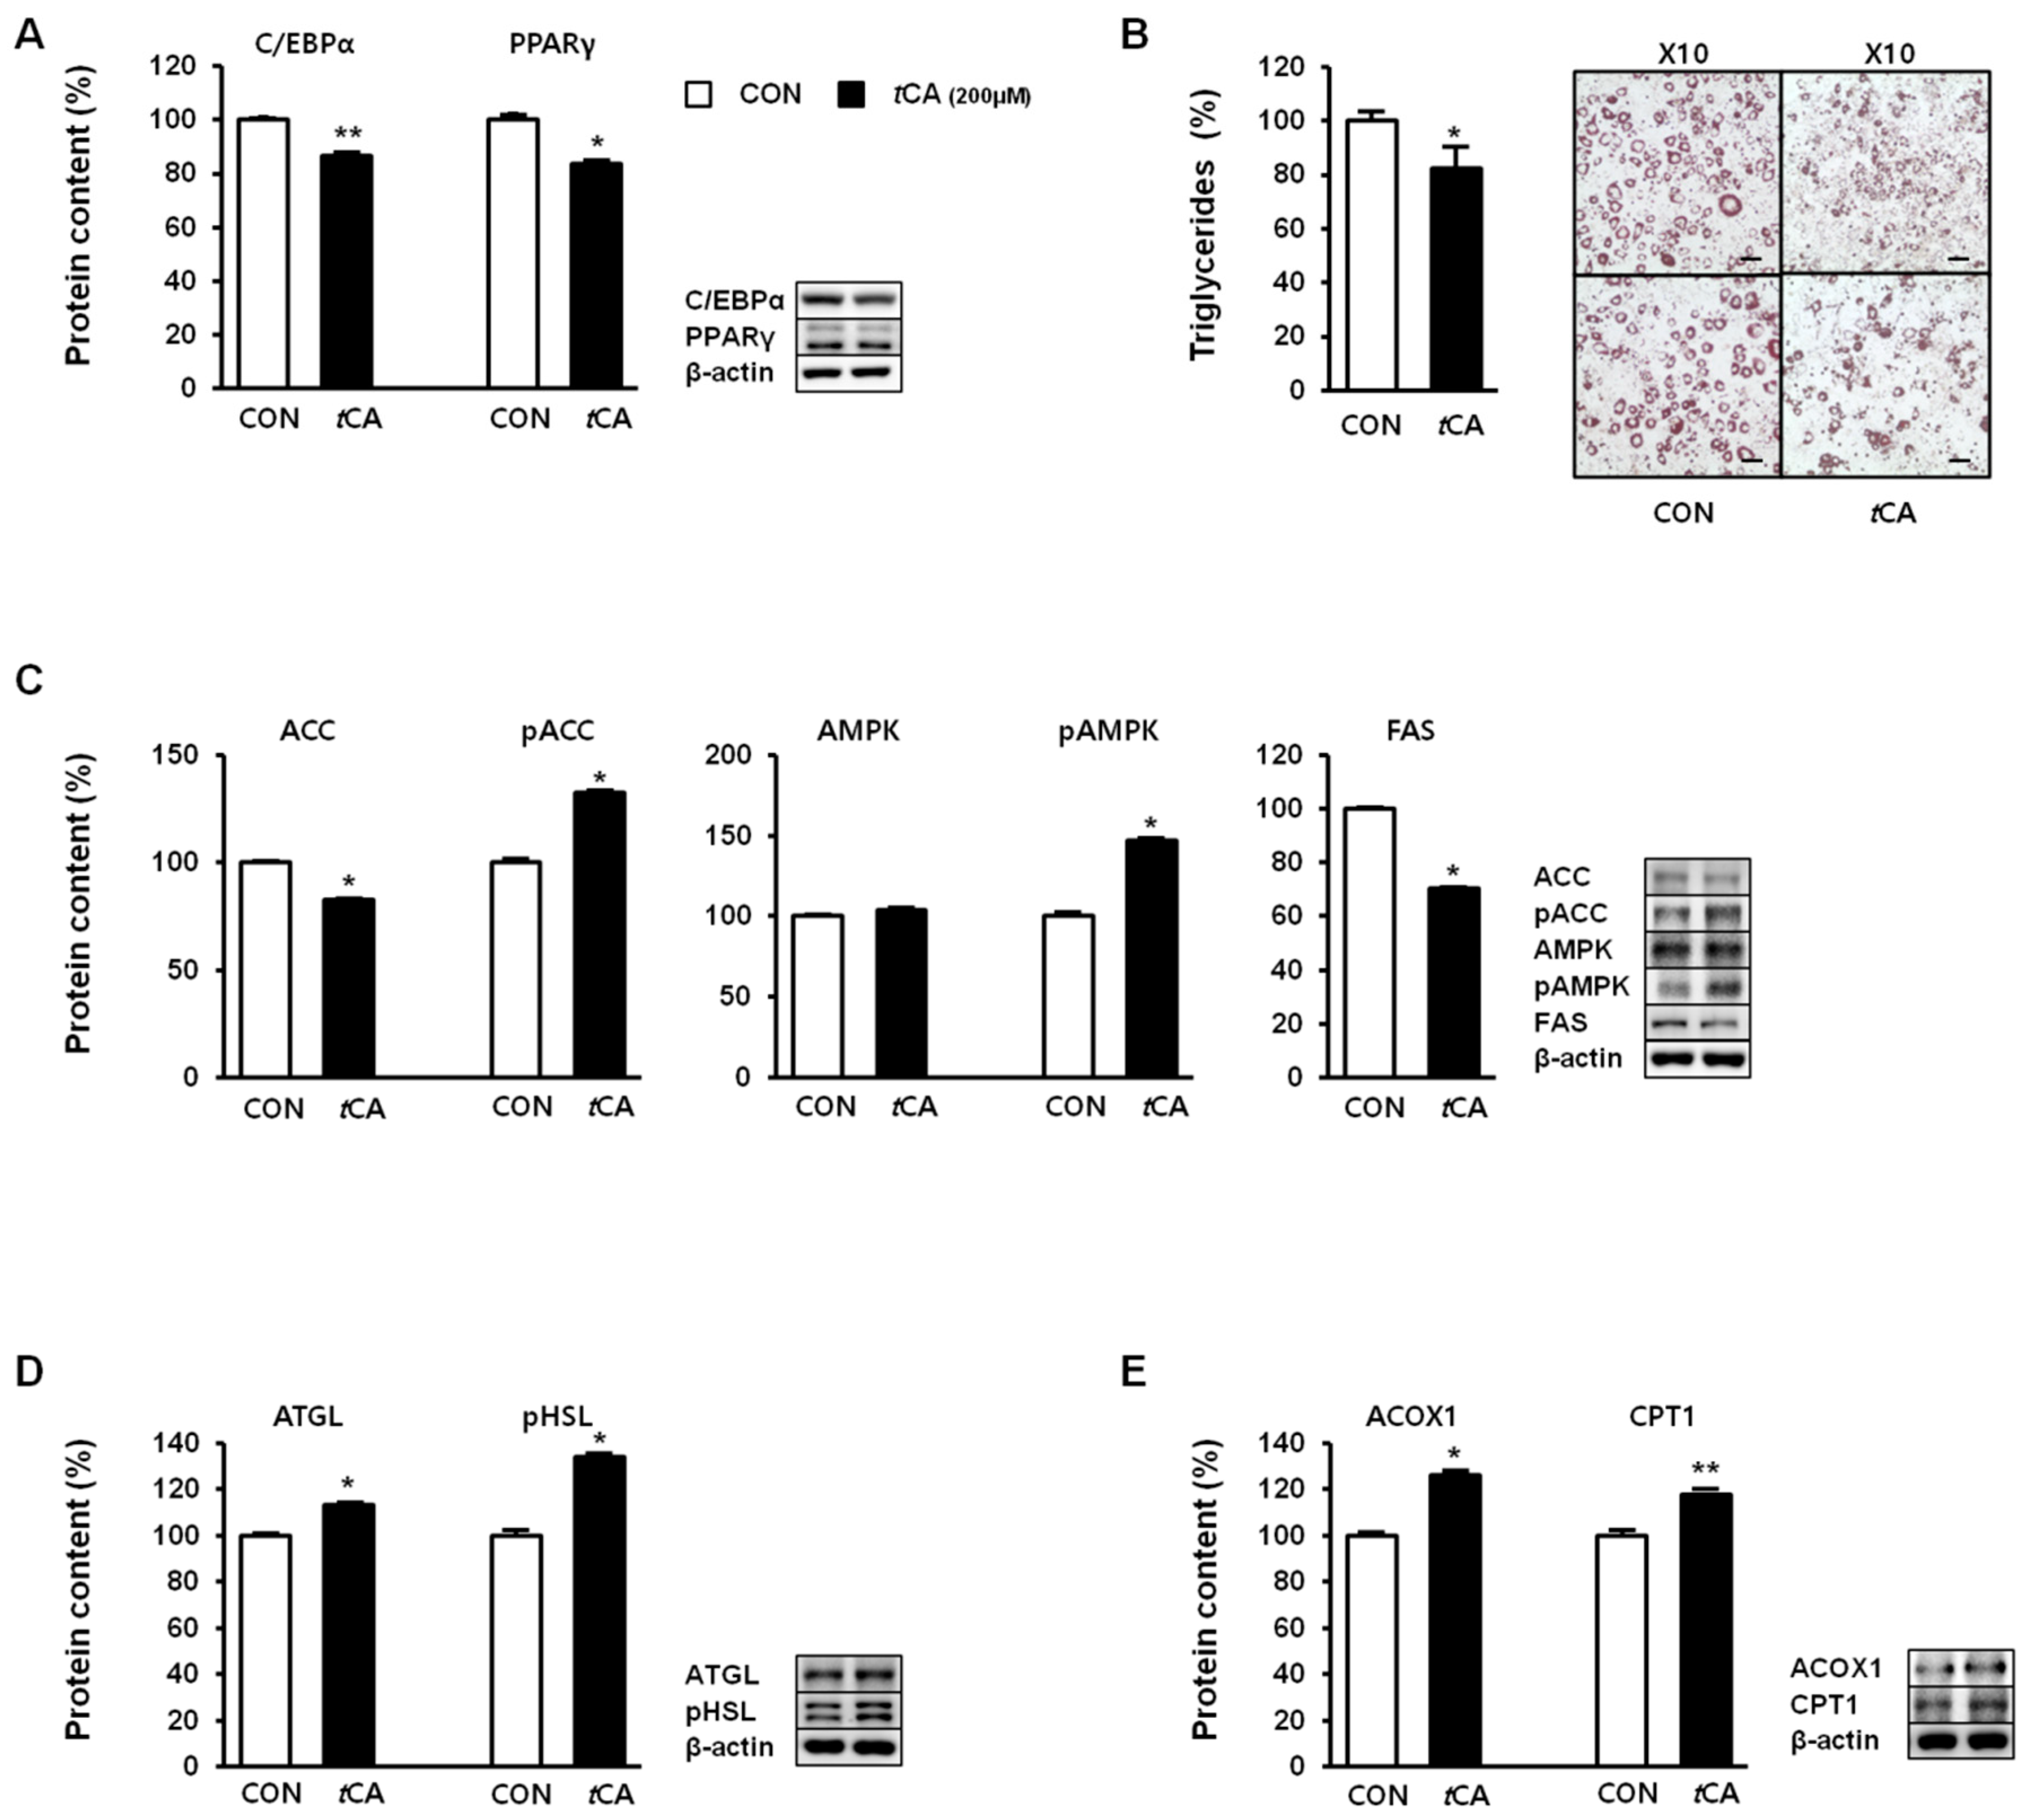
Next, we investigated the effect of tCA on lipid metabolism in white adipocytes. For this, we determined expression levels of key adipogenic transcription factors, such as C/EBPα and PPARγ, in white adipocytes upon induction of tCA in 3T3-L1 preadipocytes, before the initiation of the differentiation process. While the cells differentiated and developed into nature adipocytes, different results were observed in the adipocytes, and their expression levels were reduced upon tCA treatment, suggesting decreased adipogenesis (Figure 4A). Recruitment of beige cells in 3T3-L1 adipocytes consequently led to reduced fat accumulation, as evidenced by reduced triglycerides after tCA treatment (Figure 4B). Moreover, expression levels of acetyl-CoA carboxylase (ACC) and fatty acid synthase (FAS), as important lipogenic markers, were markedly reduced upon tCA treatment, along with an increased ratio of pACC to total ACC mediated by AMPK activation (Figure 4C). Next, we investigated expression levels of lipolysis-related proteins, including phosphorylated (activated) hormone-sensitive lipase (pHSL) and adipocyte triglyceride lipase (ATGL), before and after tCA treatment. As shown in Figure 4D, tCA enhanced lipolysis by increasing expression levels of pHSL and ATGL. tCA treatment also significantly increased mitochondrial protein levels of acyl-coenzyme A oxidase 1 (ACOX1) and carnitine palmitoyl transferase 1 (CPT1), suggesting augmented oxidative capacity upon tCA treatment (Figure 4E).
3.5. tCA Induces Browning of White Adipocytes via Activation of the β3-AR and AMPK Signaling Pathways
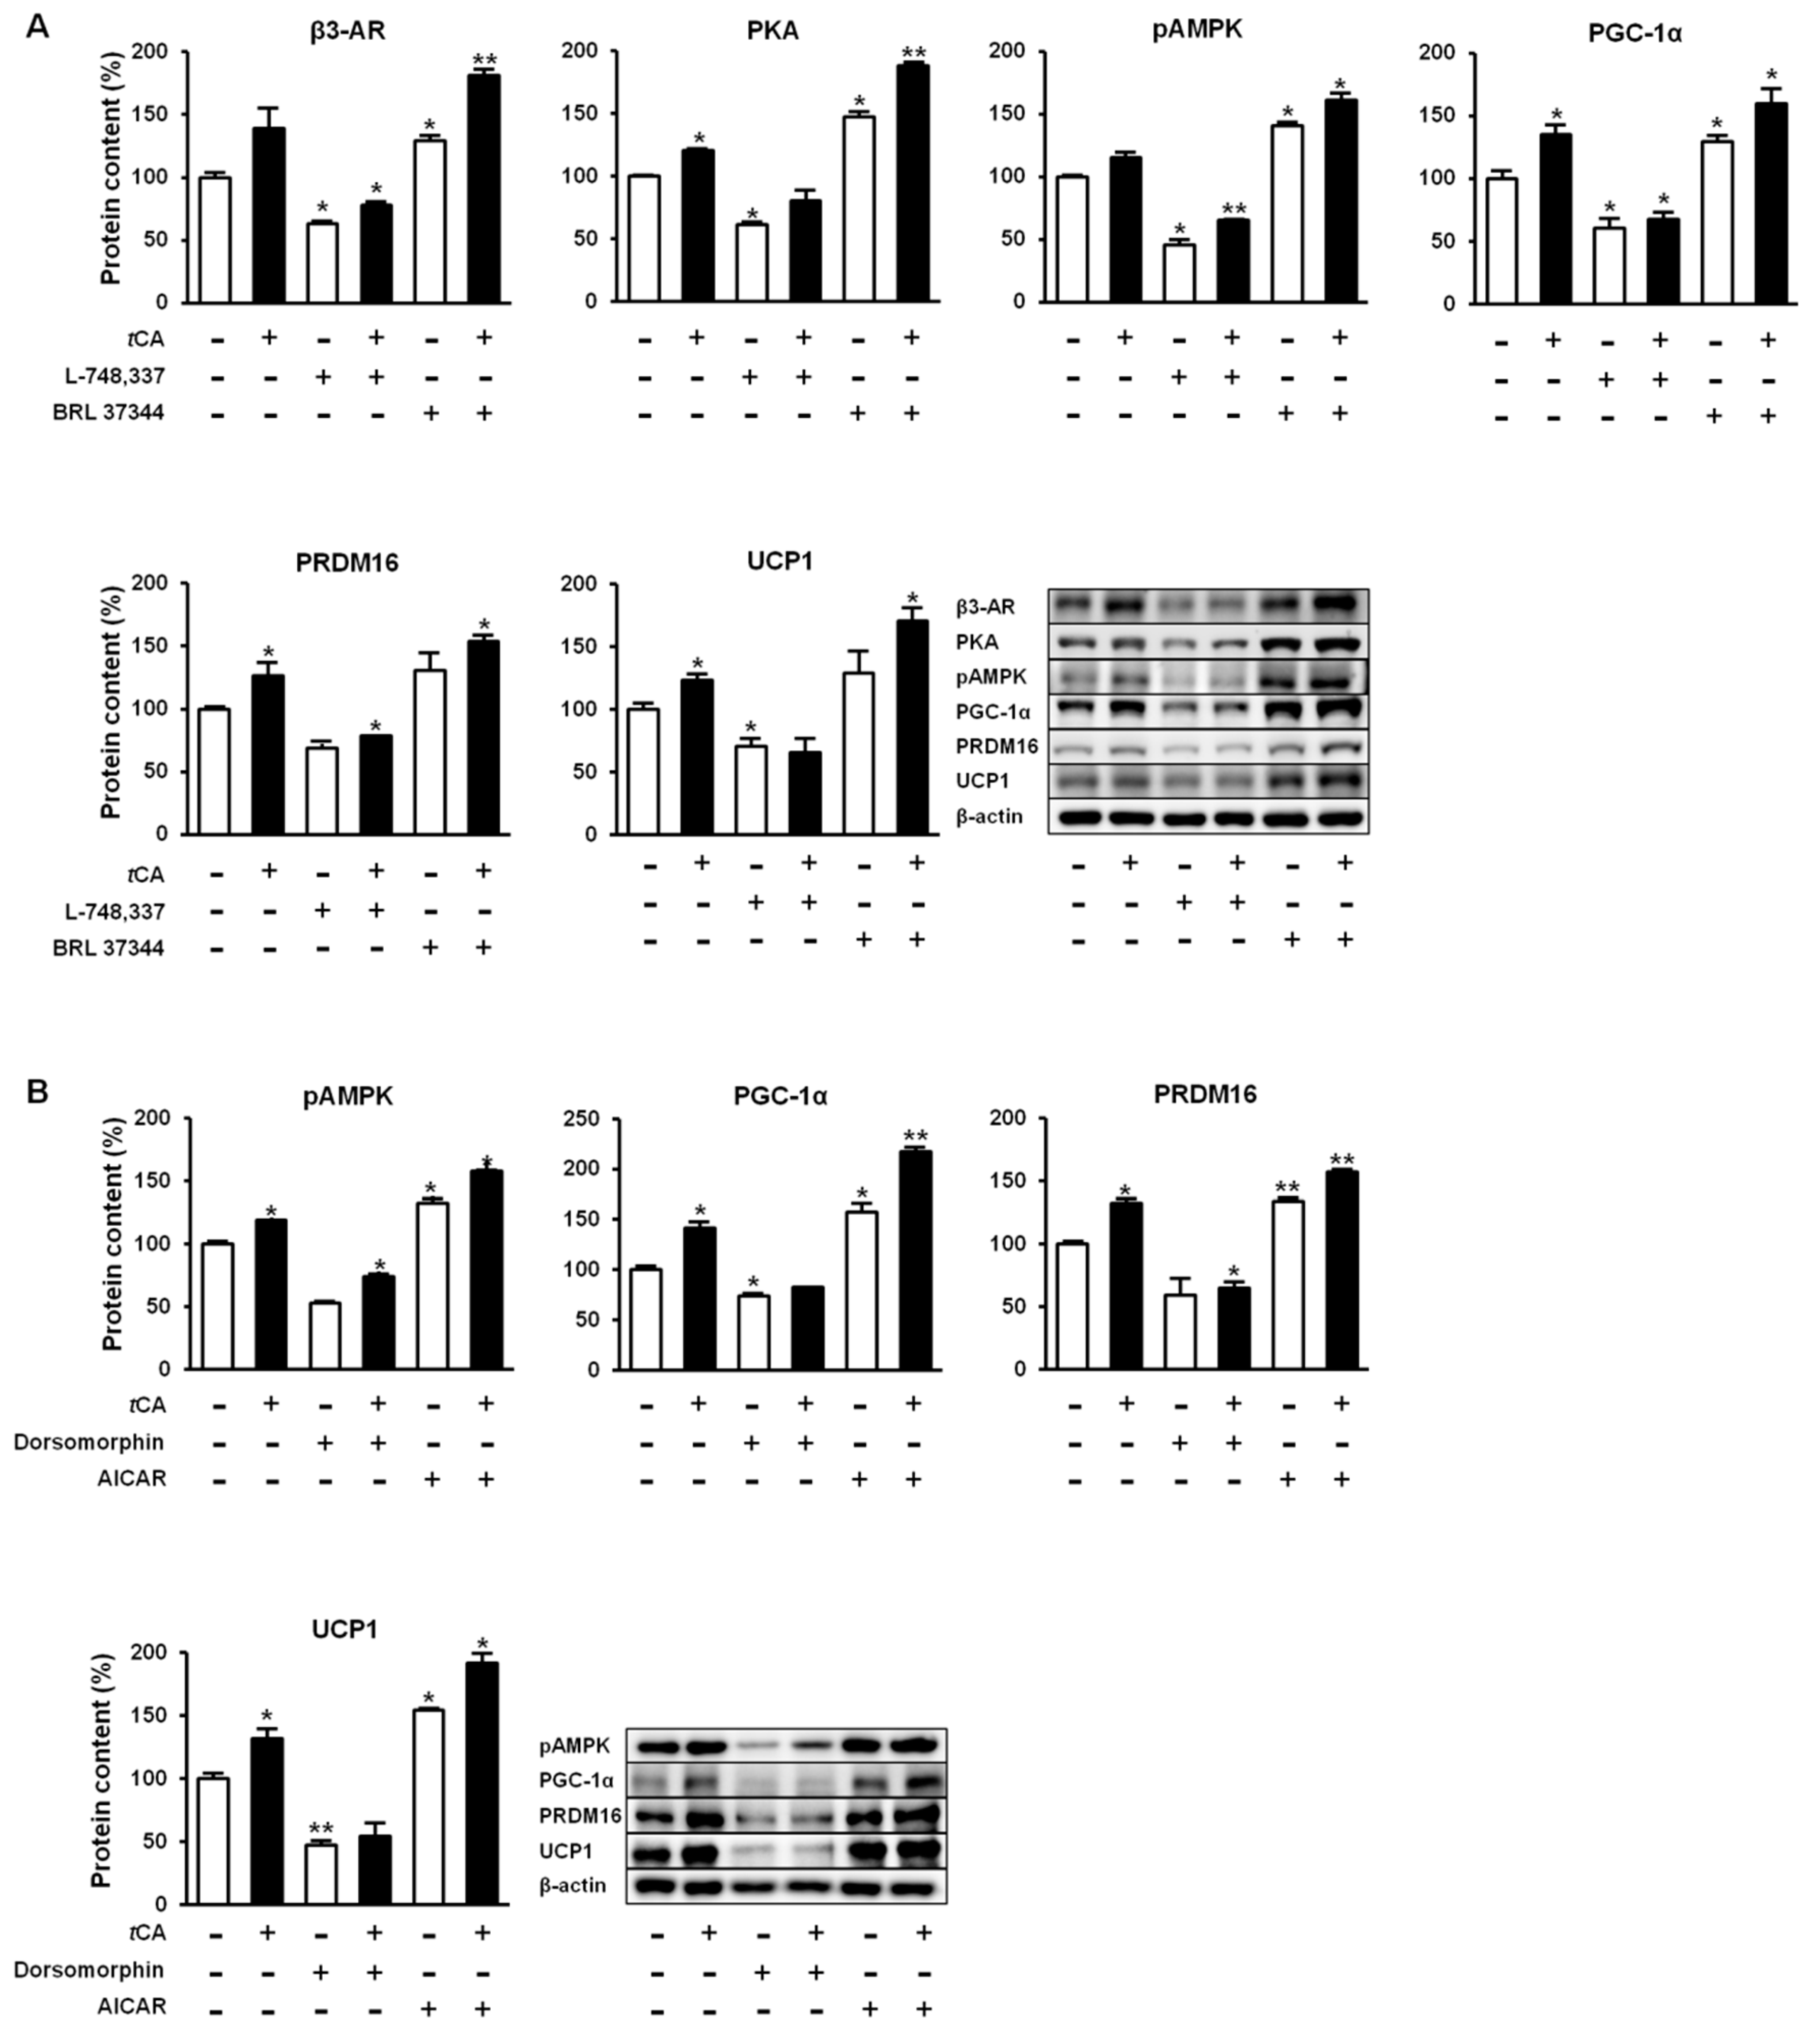
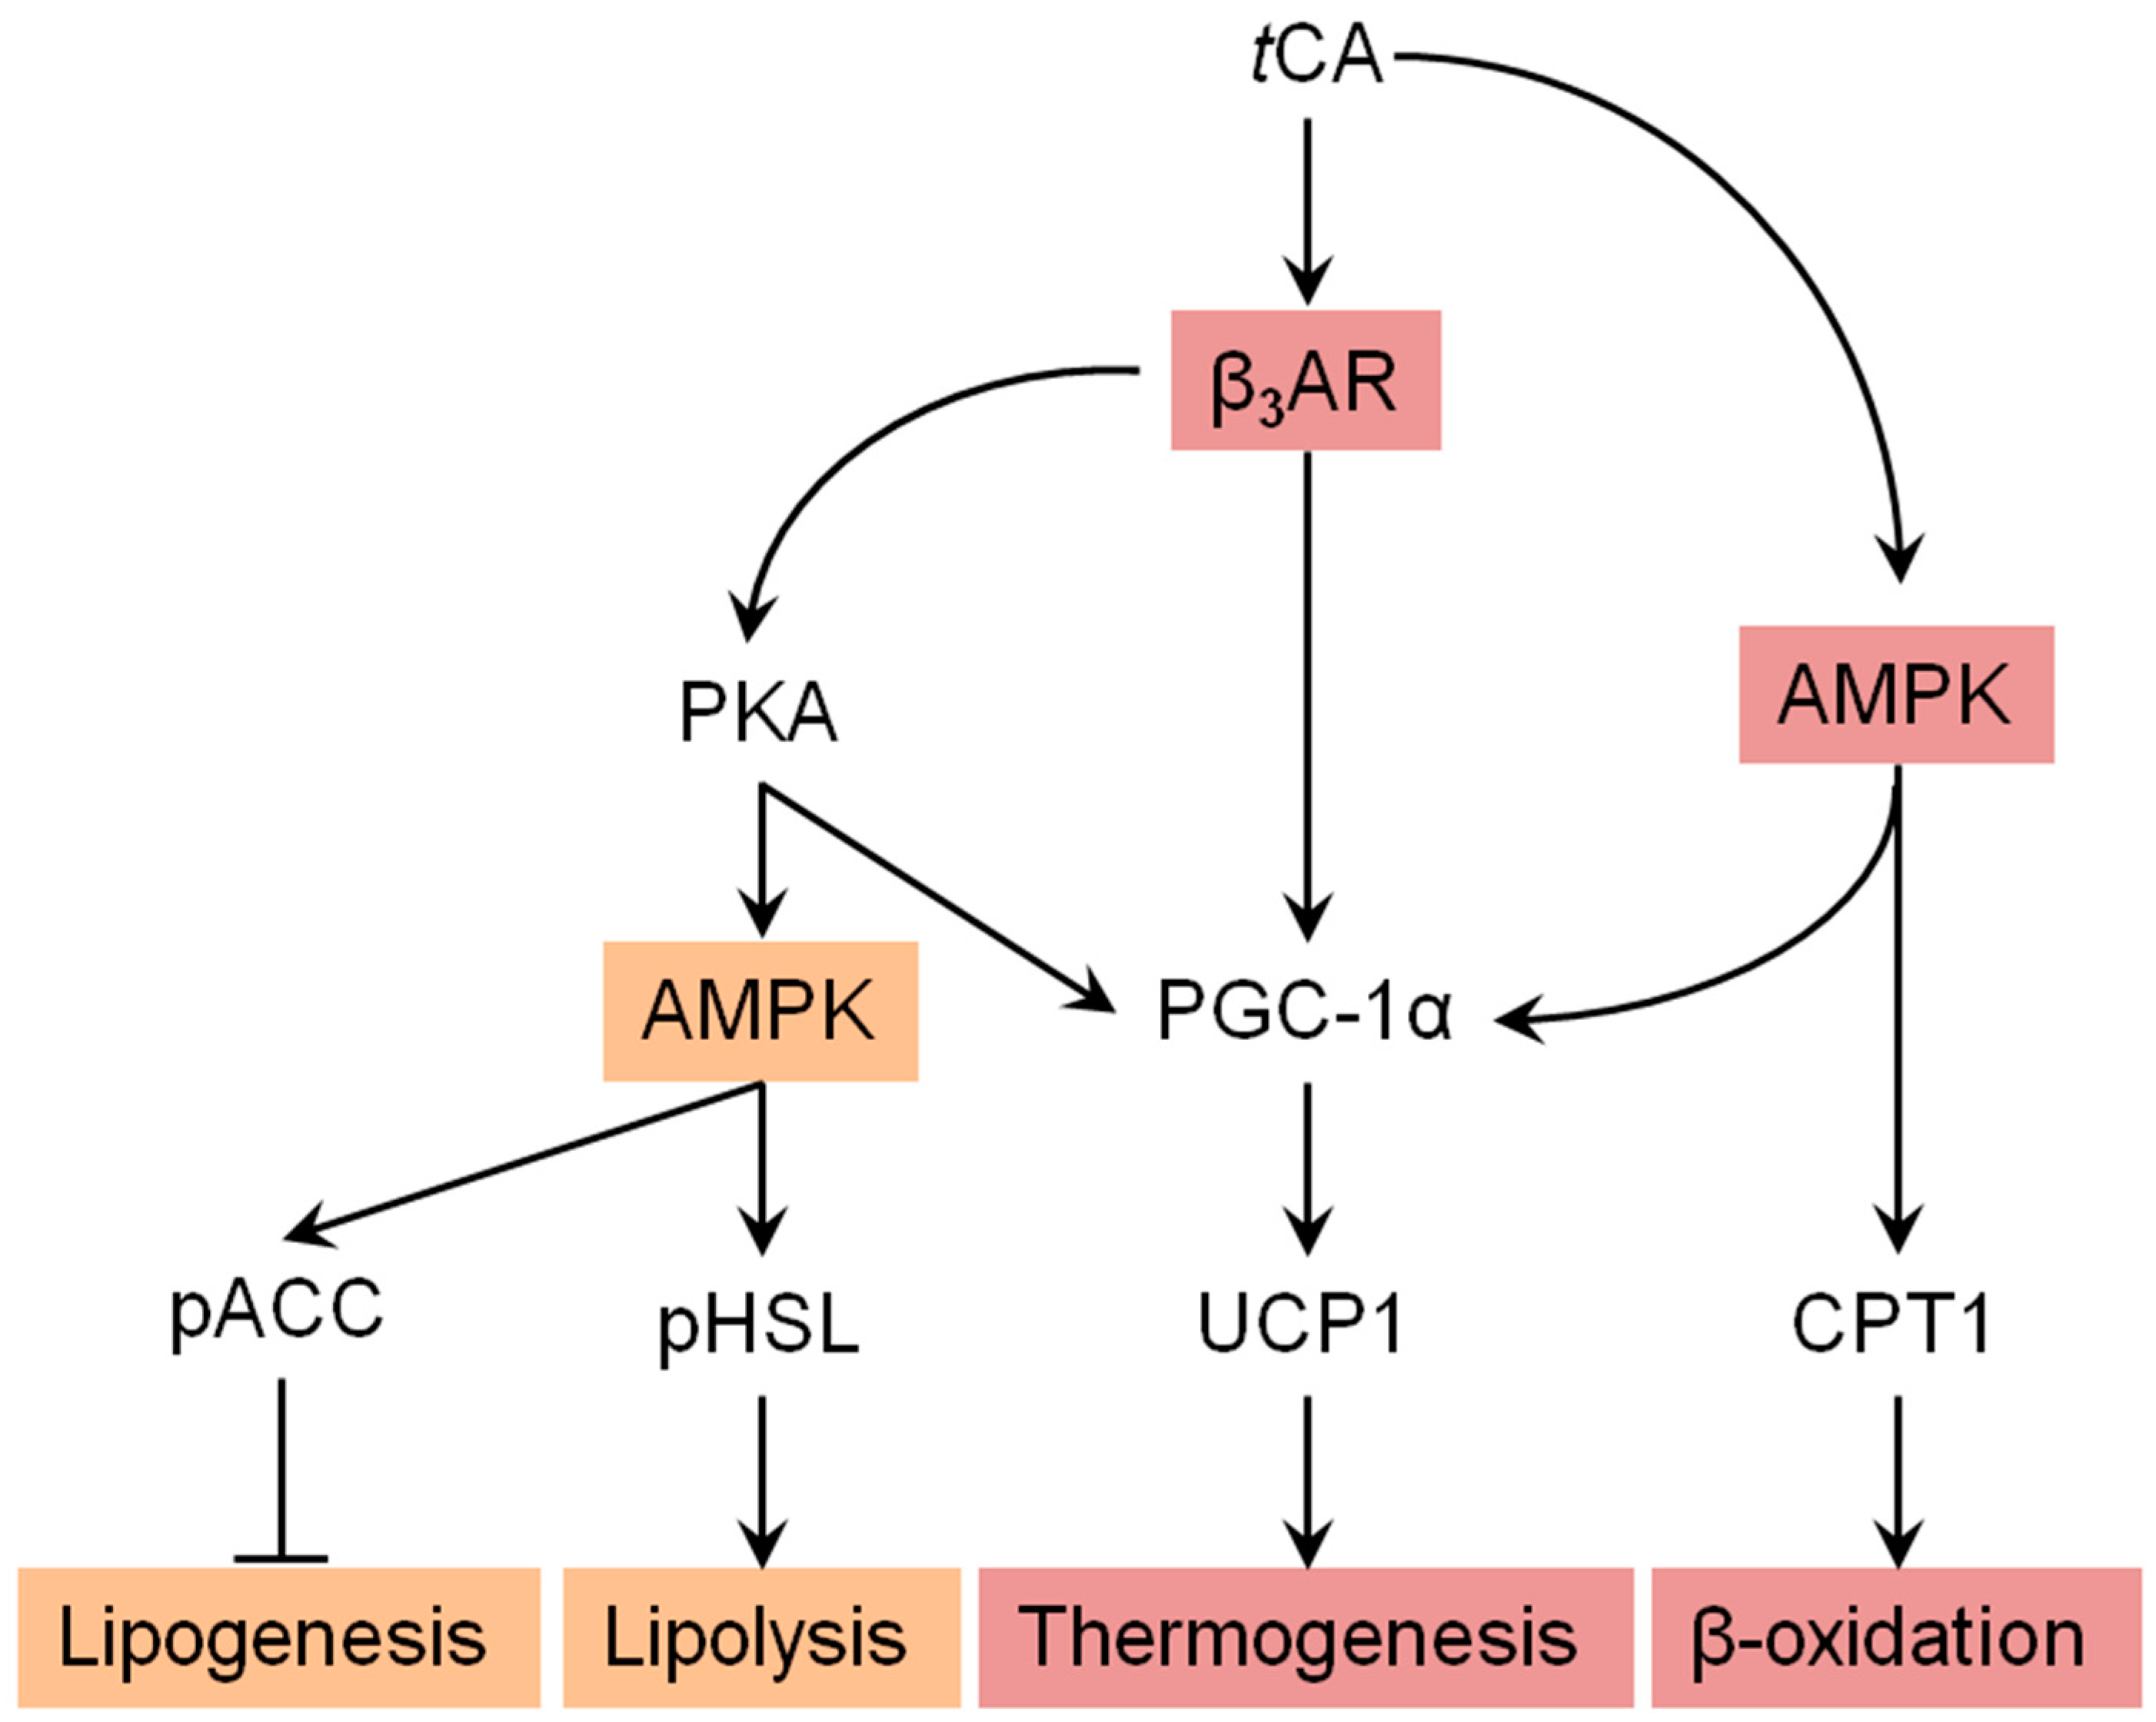
We further investigated molecular mechanisms involved in the browning activity of tCA. To this end, we separately treated 3T3-L1 cells with β3-adrenergic receptor (β3-AR) antagonist L-748.337 at 80 µM and β3-AR agonist BRL 37344 at 20 µM with or without tCA at 200 µM after 7 days of differentiation, after which expression levels of key signaling molecules (PGC-1α, PRDM16, and UCP1) responsible for browning were determined. Inhibition of β3-AR by antagonist L-748,337 resulted in reduced expression levels of PKA, pAMPK, and browning markers. It also abolished increment of β3-AR, PKA, pAMPK, and browning markers induced by tCA (Figure 5A). Treatment with β3-AR agonist BRL 37344 in combination with tCA synergistically increased expression levels of β3-AR, PKA, pAMPK, and browning marker proteins (Figure 5A). We also determined expression levels of browning marker proteins PRDM16, PGC-1α, and UCP1 after separate treatment of 3T3-L1 cells with AMPK antagonist dorsomorphin at 5 µM and AMPK agonist AICAR at 100 µM after 7 days of differentiation. Inhibited AMPK decreased expression levels of browning markers and abolished their increased levels induced by tCA. Browning markers were also synergistically elevated by a combination of AMPK agonist and tCA (Figure 5B). In addition, tCA elevated the expression levels up to two-fold for ATGL and p-HSL in the presence of β3-AR agonist, indicating its potential role of lipolysis mediated by β3-AR in white adipocytes (Figure S1). These results indicate that AMPK has a direct effect on browning induced by tCA through the β3-AR signaling pathway in 3T3-L1 white adipocytes (Figure 6).
4. Discussion and Conclusions
Results of the present study showed that tCA treatment could promote white fat browning and activate metabolic responses in 3T3-L1 white adipocytes, with a focus on the induction of beige adipocytes and elucidated the underlying molecular mechanism. Over many years, cinnamon and its derivatives have been used in traditional medicine to treat diabetes, obesity, and other metabolic diseases [29,31,32]. tCA is one of the active components of cinnamon, a spice produced from the bark of Cinnamomum. Numerous health benefits have been ascribed to cinnamon and cinnamon extract has been commercially sold to treat diabetes and other metabolic syndromes [33]. Despite a lot of reports about the beneficial roles of cinnamon and its derivatives in obesity, there is neither a consensus about bioactive constituents of cinnamon driving these effects nor molecular pathways responsible for its benefits [33,34,35]. Results obtained here contribute to the clarification of the active component in cinnamon and potential pathways involved in browning and other metabolic responses.
Recently, Kwan et al. have reported that cinnamon extract has browning effect in subcutaneous adipocytes of db/db and diet-induced obese mice via β3-AR signaling [36]. They have identified that components in cinnamon extract are protocatechuic acid, catechin, chlorogenic acid, and sesculetin. However, they did not specify which component was mainly involved in browning. Our data support that tCA might play an important role in the browning effect of cinnamon extract, although effects of other cinnamon components, such as cinnamadehyde and cinnamate, should be determined in the future. tCA-mediated browning also follows β-adrenergic signaling pathway through consequent activation of PKA and AMPK. However, possibility for TRPA1-agonistic action of tCA in browning effect cannot be excluded as cinnamaldehyde, one of the active components and 90% of the essential oil of cinnamon bark, can activate TRPA1 and increase thermogenesis [35,37]. Thermogenic activity of cinnamaldehyde needs to be determined, as it is easily oxidized to cinnamic acid. Cinnamaldehyde, an essential oil found in cinnamon, is also protective against obesity in mouse models by activating thermogenesis through the PKA-p38 MAPK signaling pathway [35,38]. Taken together, it is likely that cinnamon and its derivatives have thermogenic activity in adipocytes via the TRPA1 and/or β3AR-PKA signaling pathways.
In adipogenesis, two transcription factors, such as C/EBPα and PPARγ, tightly regulate the development of preadipocytes into mature adipocytes [39]. Suppressing these factors will reduce the accumulation of triglycerides [40]. Hsu et al. have reported that o-hydroxycinnamic acid can inhibit adipogenesis in 3T3-L1 adipocytes by inhibiting glycerol-3-phosphate dehydrogenase activity and down-regulating adipogenic transcription factors [41]. Similarly, p-hydroxycinnamic acid can suppresses adipogenesis in 3T3-L1 preadipocytes by inhibiting the MAPK/ERK signaling pathway [42]. Identical results are found with Esculetin derived from coumarin, which displayed reduced adipogenesis modulated by the AMPK pathway in 3T3-L1 adipocytes [43].
One of the important targets of AMPK is acetyl-CoA carboxylase (ACC), a key enzyme of lipogenesis, by converting acetyl-CoA to malonyl-CoA. When ACC is phosphorylated (activated), action of ACC is inhibited, thereby suppressing lipogenesis [44]. Phosphorylation of AMPK and ACC by tCA is related to increased mitochondrial fatty acid oxidation in adipocytes [45]. This finding is supported by increased expression of ACOX and CPT1, key players of fatty acid oxidation, upon tCA treatment. Work by Prabhakar and Doble and our current data support that tCA can reduce the expression of fatty acid synthase, thereby alleviating TG accumulation in adipocytes [46], moreover our experiments also suggested that tCA could decrease lipid accumulation in white adipocytes. Recent studies have demonstrated that lipogenesis and lipolysis are coupled in adipose tissue during chronic β3-AR stimulation [47]. Enhanced lipid catabolism by tCA is likely to be responsible for major metabolic adaptations during conversion of white to beige adipocytes [19]. Collectively, tCA and its derivatives could be effective compounds for improving adipocyte function.
It is well recognized that activated AMPK can switch on catabolic pathways, such as glycolysis and fatty acid oxidation, and inhibit anabolic processes, such as lipogenesis, in white adipocytes [44]. Another well-known importance of activated AMPK has been signified by inhibition of mTORC1 [48], which regulates white to beige adipogenesis, and the inhibition of mTORC1 leads to WAT browning [49]. Despite its importance in energy homeostasis, the role of AMPK in adipocyte lipolysis remains controversial. Yin and Birnbaum have demonstrated that AMPK activation is required for maximal increase in lipolysis induced by β–adrenergic stimulation [50]. In contrast, Daval et al. have argued that AMPK can block translocation of HSL to lipid droplets, thereby inhibiting lipolysis [51]. Our indirect evidence suggested that tCA-mediated AMPK activation could lead to stimulated lipolysis by increasing expression levels of ATGL and pHSL. The β-adrenergic signaling pathway represents a prime regulator of triglyceride breakdown by PKA-dependent phosphorylation of HSL. In the current study, tCA obviously activated β3-AR and consequently activated PKA, thereby phosphorylating HSL. An alternative way to activate AMPK in 3T3-L1 adipocytes has been reported by Kopp et al., demonstrating that tCA can activate AMPK by G-protein-coupled receptor (GPR) signaling [29].
Cold-mediated browning works practically only on beige fat depots, whereas classical brown adipocytes would be physiologically uninteresting for the browning process, as only a modest increase in UCP1 level has been detected as an effect of cold [51]. In contrast, many browning agents can induce white fat browning and activate classical brown adipocytes [52,53,54]. From this point of view, searching for agents, such as tCA, that can activate both white fat browning and brown fat would be a promising therapeutic strategy against obesity.
In summary, the anti-obesity effect of tCA was due to suppressed adipogenesis and lipogenesis as well as increased fat oxidation and enhanced thermogenesis in adipocytes, whereby the β3AR-PKA-AMPK, TRPA1, and GPR signaling pathways were responsible for thermogenic activity of tCA and its related components. Considering the long half-life of compounds in cinnamon [55] and good bioavailability [56] of 2.5 mmol/kg for rodents [57], consumption of tCA by oral administration may be a feasible way to activate thermogenesis and improve systematic lipid metabolism, thus ultimately protecting against obesity and other metabolic disorders in humans.
Supplementary Materials
The following are available online at https://0-www-mdpi-com.brum.beds.ac.uk/2072-6643/11/3/577/s1, Figure S1: tCA upregulates lipolysis.
Author Contributions
N.H.K. and S.M. carried out experiments, and J.W.Y. designed the study and wrote the manuscript.
Funding
This study was supported by the Daegu University Research Grant 2017.
Conflicts of Interest
The authors declare no conflicts of interest.
Abbreviations
| ACC | acyl-CoA carboxylase |
| ACO | acyl-coenzyme A oxidase 1 |
| AMPK | AMP-activated protein kinase |
| AR | adrenergic receptor |
| ATGL | adipose triglyceride lipase |
| BAT | brown adipose tissue |
| Beige | brown in white |
| Cd137 | tumor necrosis factor receptor superfamily, member 9 |
| Cidea | gene encoding cell death-inducing DFFA-like effector a |
| Cited1 | gene encoding Cbp/p300-interacting transactivator 1 |
| C/EBP/Cebp | CCAAT/enhancer-binding protein/encoding gene |
| Cox4 | cytochrome c oxidase subunit 4 |
| CPT1 | carnitine palmitoyltransferase 1 |
| FAS | fatty acid synthase |
| HSL | hormone-sensitive lipase |
| Lhx8 | gene encoding LIM/homeobox protein Lhx8 |
| NRF1 | nuclear respiratory factor 1 |
| PGC-1α/Ppargc1α | peroxisome proliferator-activated receptor gamma co-activator 1-alpha/encoding gene |
| PKA | protein kinase A |
| PPAR | peroxisome proliferator-activated receptor |
| PRDM16/Prdm16 | PR domain-containing 16/encoding gene |
| tCA | trans-cinnamic acid |
| Tbx1 | gene encoding T-box protein 1 |
| Tfam | transcription factor A, mitochondrial |
| Tmem26 | gene encoding transmembrane protein 26 |
| UCP1/Ucp1 | uncoupling protein 1/encoding gene |
| Zic1 | gene encoding zinc finger protein ZIC1 |
References
- Mnafgui, K.; Derbali, A.; Sayadi, S.; Gharsallah, N.; Elfeki, A.; Allouche, N. Anti-obesity and cardioprotective effects of cinnamic acid in high fat diet-induced obese rats. J. Food Sci. Technol. 2015, 52, 4369–4377. [Google Scholar] [CrossRef] [PubMed]
- Lei, F.; Zhang, X.N.; Wang, W.; Xing, D.M.; Xie, W.D.; Su, H.; Du, L.J. Evidence of anti-obesity effects of the pomegranate leaf extract in high-fat diet induced obese mice. Int. J. Obes (Lond.) 2007, 31, 1023–1029. [Google Scholar] [CrossRef] [PubMed] [Green Version]
- Tan, C.Y.; Ishikawa, K.; Virtue, S.; Vidal-Puig, A. Brown adipose tissue in the treatment of obesity and diabetes: Are we hot enough? J. Diabetes Investig. 2011, 2, 341–350. [Google Scholar] [CrossRef] [PubMed] [Green Version]
- Carey, A.L.; Vorlander, C.; Reddy-Luthmoodoo, M.; Natoli, A.K.; Formosa, M.F.; Bertovic, D.A.; Anderson, M.J.; Duffy, S.J.; Kingwell, B.A. Reduced UCP-1 content in in vitro differentiated beige/brite adipocytes derived from preadipocytes of human subcutaneous white adipose tissues in obesity. PLoS ONE 2014, 9, e91997. [Google Scholar] [CrossRef] [PubMed]
- Jang, M.H.; Kang, N.H.; Mukherjee, S.; Yun, J.W. Theobromine, a methylzanthine in cocoa bean, stimulates thermogenesis by inducing white fat browning and activating brown adipocytes. Biotechnol. Bioprocess Eng. 2018, 23, 617–626. [Google Scholar] [CrossRef]
- Claussnitzer, M.; Dankel, S.N.; Kim, K.H.; Quon, G.; Meuleman, W.; Haugen, C.; Glunk, V.; Sousa, I.S.; Beaudry, J.L.; Puviindran, V.; et al. FTO obesity variant circuitry and adipocyte browning in humans. N. Engl. J. Med. 2015, 373, 895–907. [Google Scholar] [CrossRef] [PubMed]
- Lee, P. Wasting energy to treat obesity. N. Engl. J. Med. 2016, 375, 2298–2300. [Google Scholar] [CrossRef]
- Sellayah, D.; Sikder, D. Orexin restores aging-related brown adipose tissue dysfunction in male mice. Endocrinology 2014, 155, 485–501. [Google Scholar] [CrossRef]
- Lim, S.; Honek, J.; Xue, Y.; Seki, T.; Cao, Z.; Andersson, P.; Yang, X.; Hosaka, K.; Cao, Y. Cold-induced activation of brown adipose tissue and adipose angiogenesis in mice. Nat. Protoc. 2012, 7, 606–615. [Google Scholar] [CrossRef]
- Ricquier, D. Uncoupling protein 1 of brown adipocytes, the only uncoupler: A historical perspective. Front. Endocrinol. (Lausanne) 2011, 2, 85. [Google Scholar] [CrossRef]
- Azzu, V.; Brand, M.D. The on-off switches of the mitochondrial uncoupling proteins. Trends. Biochem. Sci. 2010, 35, 298–307. [Google Scholar] [CrossRef] [PubMed] [Green Version]
- Parray, H.A.; Yun, J.W. Combined inhibition of autophagy protein 5 and galectin-1 by thiodigalactoside reduces diet-induced obesity through induction of white fat browning. IUBMB Life 2017, 69, 510–521. [Google Scholar] [CrossRef] [PubMed]
- Tiraby, C.; Tavernier, G.; Lefort, C.; Larrouy, D.; Bouillaud, F.; Ricquier, D.; Langin, D. Acquirement of brown fat cell features by human white adipocytes. J. Biol. Chem. 2003, 278, 33370–33376. [Google Scholar] [CrossRef] [PubMed]
- Sharp, L.Z.; Shinoda, K.; Ohno, H.; Scheel, D.W.; Tomoda, E.; Ruiz, L.; Hu, H.; Wang, L.; Pavlova, Z.; Gilsanz, V.; et al. Human BAT possesses molecular signatures that resemble beige/brite cells. PLoS ONE 2012, 7, e49452. [Google Scholar] [CrossRef] [PubMed]
- Lee, P.; Werner, C.D.; Kebebew, E.; Celi, F.S. Functional thermogenic beige adipogenesis is inducible in human neck fat. Int. J. Obes. (Lond.) 2014, 38, 170–176. [Google Scholar] [CrossRef] [PubMed]
- Fisher, F.M.; Kleiner, S.; Douris, N.; Fox, E.C.; Mepani, R.J.; Verdeguer, F.; Wu, J.; kharitonenkov, A.; Flier, J.S.; Maratos-Flier, E.; et al. FGF21 regulates PGC-1α and browning of white adipose tissues in adaptive thermogenesis. Genes 2012, 26, 271–281. [Google Scholar] [CrossRef] [PubMed]
- Seale, P.; Conroe, H.M.; Estall, J.; Kajimura, S.; Frontini, A.; Ishibashi, J.; Cohen, P.; Ciniti, S.; Spiegelman, B.M. Prdm16 determines the thermogenic program of subcutaneous white adipose tissue in mice. J. Clin. Investig. 2011, 121, 96–105. [Google Scholar] [CrossRef] [Green Version]
- Harms, M.; Seale, P. Brown and beige fat: Development, function and therapeutic potential. Nat. Med. 2013, 19, 1252–1263. [Google Scholar] [CrossRef]
- Barquissau, V.; Beuzelin, D.; Pisani, D.F.; Beranger, G.E.; Mairal, A.; Montagner, A.; Roussel, B.; Tavrnier, G.; Marques, M.A.; Moro, C.; et al. White-to-brite conversion in human adipocytes promotes metabolic reprogramming towards fatty acid anabolic and catabolic pathways. Mol. Metab. 2016, 5, 352–365. [Google Scholar] [CrossRef]
- Bonet, M.L.; Oliver, P.; Palou, A. Pharmacological and nutritional agents promoting browning of white adipose tissue. Biochim. Biophys. Acta. 2018, 1831, 969–985. [Google Scholar] [CrossRef]
- Azhar, Y.; Parmar, A.; Miller, C.N.; Samuels, J.S.; Rayalam, S. Phytochemicals as novel agents for the induction of browning in white adipose tissue. Nutr. Metab. (Lond.) 2016, 13, 89. [Google Scholar] [CrossRef] [PubMed]
- Kang, N.H.; Mukherjee, S.; Min, T.; Kang, S.C.; Yun, J.W. Trans-anethole ameliorates obesity via induction of browning in white adipocytes and activation of brown adipocytes. Biochimie 2018, 151, 1–13. [Google Scholar] [CrossRef] [PubMed]
- Lone, J.; Yun, J.W. Honokiol exerts dual effects on browning and apoptosis of adipocytes. Pharmacol. Rep. 2017, 69, 1357–1365. [Google Scholar] [CrossRef] [PubMed]
- Barceloux, D.G. Cinnamon (Cinnamomum Species) Medical Toxicology of Natural Substances; John Wiley & Sons: Hoboken, NJ, USA, 2009; pp. 327–335. [Google Scholar]
- Rao, P.V.; Gan, S.H. Cinnamon: A multifaceted medicinal plant. Evid. Based. Complement. Alternat. Med. 2014, 642942. [Google Scholar] [CrossRef] [PubMed]
- Anderson, R.A.; Broadhurst, C.L.; Polansky, M.M.; Schmidt, W.F.; Khan, A.; Flanagan, V.P.; Scgoene, N.W.; Graves, D.F. Isolation and characterization of polyphenol type-A polymers from cinnamon with insulin-like biological activity. J. Agric. Food. Chem. 2014, 52, 65–70. [Google Scholar] [CrossRef] [PubMed]
- Soliman, M.M.; Attia, H.F.; El-Shazly, A.; Saleh, O.M. Biomedical effects of cinnamon extract on obesity and diabetes relevance in wistar rats. AJMB 2012, 3, 133–145. [Google Scholar] [CrossRef]
- Jain, G.S.; Puri, S.; Misra, A.; Gulati, S.; Mani, K. Effect of oral cinnamon intervention on metabolic profile and body composition of Asian Indians with metabolic syndrome: A randomized double -blind control trial. Lipids Health Dis. 2017, 16, 113. [Google Scholar] [CrossRef]
- Kopp, C.; Singh, S.P.; Regenhard, P.; Müller, U.; Sauerwein, H.; Mielenz, M. Trans-cinnamic acid increases adiponectin and the phosphorylation of AMP-activated protein kinase through G-protein-coupled receptor signaling in 3T3-L1 adipocytes. Int. J. Mol. Sci. 2014, 15, 2906–2915. [Google Scholar] [CrossRef]
- Mosmann, T. Rapid colorimetric assay for cellular growth and survival: Application to proliferation and cytotoxicity assays. J. Immunol. Method 1983, 65, 55–63. [Google Scholar] [CrossRef]
- Qin, B.; Panickar, K.S.; Anderson, A.R. Cinnamon: Potential role in the prevention of insulin resistance, metabolic syndrome, and type 2 diabetes. J. Diabetes. Sci. Technol. 2010, 4, 685–693. [Google Scholar] [CrossRef]
- Adisakwattana, S. Cinnamic acid and its derivatives: Mechanisms for prevention and management of diabetes and its complications. Nutrients 2017, 9, 163. [Google Scholar] [CrossRef] [PubMed]
- Rafehi, H.; Ververis, K.; Karagiannis, T.C. Controversies surrounding the clinical potential of cinnamon for the management of diabetes. Diabetes. Obes. Metab. 2012, 14, 493–499. [Google Scholar] [CrossRef] [PubMed]
- Verspohl, E.J.; Bauer, K.; Neddermann, E. Antidiabetic effect of Cinnamomum cassia and Cinnamomum zeylanicum in vivo and in vitro. Phytother. Res. 2005, 1, 203–206. [Google Scholar] [CrossRef] [PubMed]
- Camacho, S.; Michlig, S.; de Senarclens-Bezençon, C.; Meylan, J.; Meystre, J.; Pezzoli, M.; Markram, H.; le Coutre, J. Anti-obesity and anti-hyperglycemic effects of cinnamaldehyde via altered ghrelin secretion and functional impact on food intake and gastric emptying. Sci. Rep. 2015, 5, 7919. [Google Scholar] [CrossRef] [PubMed]
- Kwan, H.Y.; Wu, J.; Su, T.; Chao, X.J.; Liu, B.; Fu, X.; Chan, C.L.; Lau, R.H.Y.; Tse, A.K.W.; Han, Q.B.; et al. Cinnamon induces browning in subcutaneous adipocytes. Sci. Rep. 2015, 7, 2447. [Google Scholar] [CrossRef] [PubMed]
- Tamura, Y.; Iwasaki, Y.; Narukawa, M.; Watanabe, T. Ingestion of cinnamaldehyde, a TRPA1 agonist, reduces visceral fats in mice fed a high-fat and high-sucrose diet. J. Nutr. Sci. Vitaminol (Tokyo) 2012, 58, 9–13. [Google Scholar] [CrossRef] [PubMed]
- Jiang, L.; Tang, Z. Expression and regulation of the ERK1/2 and p38 MAPK signaling pathways in periodontal tissue remodeling of orthodontic tooth movement. Mol. Med. Rep. 2018, 17, 1499–1506. [Google Scholar] [CrossRef] [PubMed]
- Rosen, E.D.; Hsu, C.H.; Wang, X.; Sakai, S.; Freeman, M.W.; Gonzalez, F.J.; Spiegelman, B.M. C/EBPα induces adipogenesis through PPARγ: A unified pathway. Genes. Dev. 2002, 16, 22–26. [Google Scholar] [CrossRef]
- Farmer, S.R. Transcriptional control of adipocyte formation. Cell Metab. 2006, 4, 263–273. [Google Scholar] [CrossRef] [Green Version]
- Hsu, C.L.; Yen, G.C. Effects of flavonoids and phenolic acids on the inhibition of adipogenesis in 3T3-L1 adipocytes. J. Agric. Food Chem. 2007, 55, 8404–8410. [Google Scholar] [CrossRef]
- Yamaguchi, M.; Baile, C.A.; Zhu, S.; Shoji, M. Bioactive flavonoid p-hydroxycinnamic acid stimulates osteoblastogenesis and suppresses adipogenesis in bone marrow culture. Cell Tissue Res. 2013, 354, 743–750. [Google Scholar] [CrossRef] [PubMed]
- Wang, T.Y.; Liu, C.; Wang, A.; Sun, Q. Intermittent cold exposure improves glucose homeostasis associated with brown and white adipose tissues in mice. Life Sci. 2015, 15, 153–159. [Google Scholar] [CrossRef] [PubMed]
- Daval, M.; Foufelle, F.; Ferré, P. Functions of AMP-activated protein kinase in adipose tissue. J. Physiol. 2006, 574, 55–62. [Google Scholar] [CrossRef] [PubMed] [Green Version]
- Fang, C.; Kim, H.; Noratto, G.; Sun, Y.; Talcott, S.T.; Mertens-Talcott, S.U. Gallotannin derivatives from mango (Mangifera indica L.) suppress adipogenesis and increase thermogenesis in 3T3-L1 adipocytes in part through the AMPK pathway. J. Funct. Foods 2018, 46, 101–109. [Google Scholar] [CrossRef]
- Prabhakar, P.K.; Doble, M. Interaction of cinnamic acid derivatives with commercial hypoglycemic drugs on 2-deoxyglucose uptake in 3T3-L1 adipocytes. J. Agric. Food Chem. 2011, 5, 9835–9844. [Google Scholar] [CrossRef] [PubMed]
- Mottillo, E.P.; Balasubramanian, P.; Lee, Y.H.; Weng, C.; Kershaw, E.E.; Granneman, J.G. Coupling of lipolysis and de novo lipogenesis in brown, beige, and white adipose tissues during chronic β3-adrenergic receptor activation. J. Lipid Res. 2014, 55, 2276–2286. [Google Scholar] [CrossRef] [PubMed]
- Cai, H.; Dong, L.; Liu, F. Recent advances in adipose mTOR signaling and function: Therapeutic prospects. Trends Pharmacol. Sci. 2016, 37, 303–317. [Google Scholar] [CrossRef] [PubMed]
- Zhang, X.; Luo, Y.; Wang, C.; Burge, M.; Yang, X.O.; Liu, M. Adipose mTORC1 suppresses prostaglandin signaling and beige adipogenesis via the CRTC2-COX-2 pathway. Cell Rep. 2018, 24, 3180–3193. [Google Scholar] [CrossRef]
- Yin, W.; Mu, J.; Birnbaum, M.J. Role of AMP-activated protein kinase in cyclic AMP-dependent lipolysis in 3T3-L1 adipocytes. J. Biol. Chem. 2003, 278, 43074–43080. [Google Scholar] [CrossRef]
- Daval, M.; Diot-Dupuy, F.; Bazin, R.; Hainault, I.; Viollet, B.; Vaulont, S.; Hajduch, E.; Ferré, P.; Foufelle, F. Anti-lipolytic action of AMP-activated protein kinase in rodent adipocytes. J. Biol. Chem. 2005, 280, 25250–25257. [Google Scholar] [CrossRef]
- Kalinovich, A.V.; de Jong, J.M.; Cannon, B.; Nedergaard, J. UCP1 in adipose tissues: Two steps to full browning. Biochimie 2017, 134, 127–137. [Google Scholar] [CrossRef] [PubMed]
- Lone, J.; Yun, J.W. Monoterpene limonene induces brown fat-like phenotype in 3T3-L1 white adipocytes. Life Sci. 2016, 15, 198–206. [Google Scholar] [CrossRef] [PubMed]
- Parray, H.A.; Yun, J.W. Cannabidiol promotes browning in 3T3L1 adipocytes. Mol. Cell Biochem. 2016, 46, 131–139. [Google Scholar] [CrossRef] [PubMed]
- Zhao, H.; Xie, Y.; Yang, Q.; Cao, Y.; Tu, H.; Cao, W.; Wang, S. Pharmacokinetic study of cinnamaldehyde in rats by GC-MS after oral and intravenous administration. J. Pharm. Biomed. Anal. 2014, 89, 150–157. [Google Scholar] [CrossRef] [PubMed]
- El-Seedi, H.R.; El-Said, A.M.; Khalifa, S.A.; Göransson, U.; Bohlin, L.; Borg-Karlson, A.K.; Verpoorte, R. Biosynthesis, natural sources, dietary intake, pharmacokinetic properties, and biological activities of hydroxycinnamic acids. J. Agric. Food Chem. 2012, 60, 10877–10895. [Google Scholar] [CrossRef] [PubMed]
- Nutley, B.P.; Farmer, P.; Caldwell, J. Metabolism of trans-cinnamic acid in the rat and the mouse and its variation with dose. Food Chem. Toxic. 1994, 32, 877–886. [Google Scholar] [CrossRef]
Figure 1.
Trans-cinnamic acid (tCA) induces browning in white adipocytes. Chemical structure of tCA (A) and cytotoxicity (B). tCA promotes increased protein content of core brown fat markers (C) in a dose-dependent manner as well as expression of beige fat-specific genes (D) at 200 μM in 3T3-L1 adipocytes. Data are presented as the mean ± SD, and differences between groups were determined using the Statistical Package of Social Science (SPSS, version 17.0; SPSS Inc., Chicago, IL, USA) program, followed by Tukey’s post-hoc tests or Student’s t-test. Statistical significance between control and tCA-treated 3T3-L1 cells are shown as * p < 0.05 or ** p < 0.01.

Figure 2.
Trans-cinnamic acid (tCA) activates brown adipocytes. Cytotoxicity of tCA upon induction in HIB1B cells (A). tCA elevates protein content of core brown fat markers (B) in a dose-dependent manner as well as expression of the genes encoding beige fat-specific activity (C) at 50 μM in HIB1B adipocytes and regulates adipogenesis (D). Representative images of Oil Red O staining of HIB1B cells taken at 40× magnification (scale bars = 50 μm), where lipid content was quantified by extracting Oil Red O stain bound to cells with 100% isopropanol in brown adipocytes (E). Data are presented as the mean ± SD, and differences between groups were determined using the Statistical Package of Social Science (SPSS, version 17.0; SPSS Inc., Chicago, IL, USA) program, followed by Tukey’s post-hoc tests or Student’s t-test. Statistical significance between control and tCA-treated HIB1B cells are shown as * p < 0.05 or ** p < 0.01.

Figure 3.
Activation of UCP1 by trans-cinnamic acid (tCA). Immunofluorescent staining of differentiated 3T3-L1 white adipocytes (scale bars = 50 μm) (A) and HIB1B brown adipocytes (scale bars = 20 μm) (B) with MitoTracker Red dye used for UCP1, when treated with tCA. Images were captured at 40× magnification, respectively. UCP1, uncoupling protein 1. Data are presented as mean ± S.D. Differences between groups were determined using Student’s t-test. Statistical significance between control and tCA-treated 3T3-L1 cells is shown as * p < 0.05 or ** p < 0.01.

Figure 4.
Trans-cinnamic acid (tCA) regulates lipid metabolism in white adipocytes. tCA regulates lipid metabolic regulators involved in adipogenesis (A). Representative images of Oil Red O staining of 3T3-L1 were taken at 10× magnification (scale bars = 100 μm), where lipid content was quantified by extracting Oil Red O stain bound to cells with 100% isopropanol in 3T3-L1 adipocytes (B), lipogenesis (C), lipolysis (D), and fatty acid oxidation (E). Data are presented as the mean ± SD, and differences between groups were determined using Student’s t-test. Statistical significance between control and tCA-treated 3T3-L1 cells are shown as * p < 0.05 or ** p < 0.01.

Figure 5.
Trans-cinnamic acid (tCA) induces browning via β3-AR as well as AMPK pathway in 3T3-L1 adipocytes. tCA activates β3-AR and promotes browning by elevating expression of browning markers PGC-1α, PRDM16, and UCP1 (A) as well as AMPK-mediated activation of β3-AR to pAMPK, resulting in higher expression levels of browning markers (B) in comparison to the effect of β3-AR. Data are presented as the mean ± SD, and differences between groups were determined using the Statistical Package of Social Science (SPSS, version 17.0; SPSS Inc., Chicago, IL, USA) program, followed by Tukey’s post-hoc tests. Statistical significance between control and tCA-treated 3T3-L1 cells are shown as * p < 0.05 or ** p < 0.01.

Figure 6.
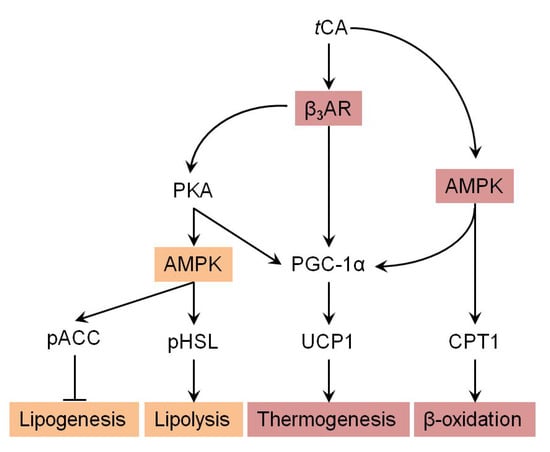
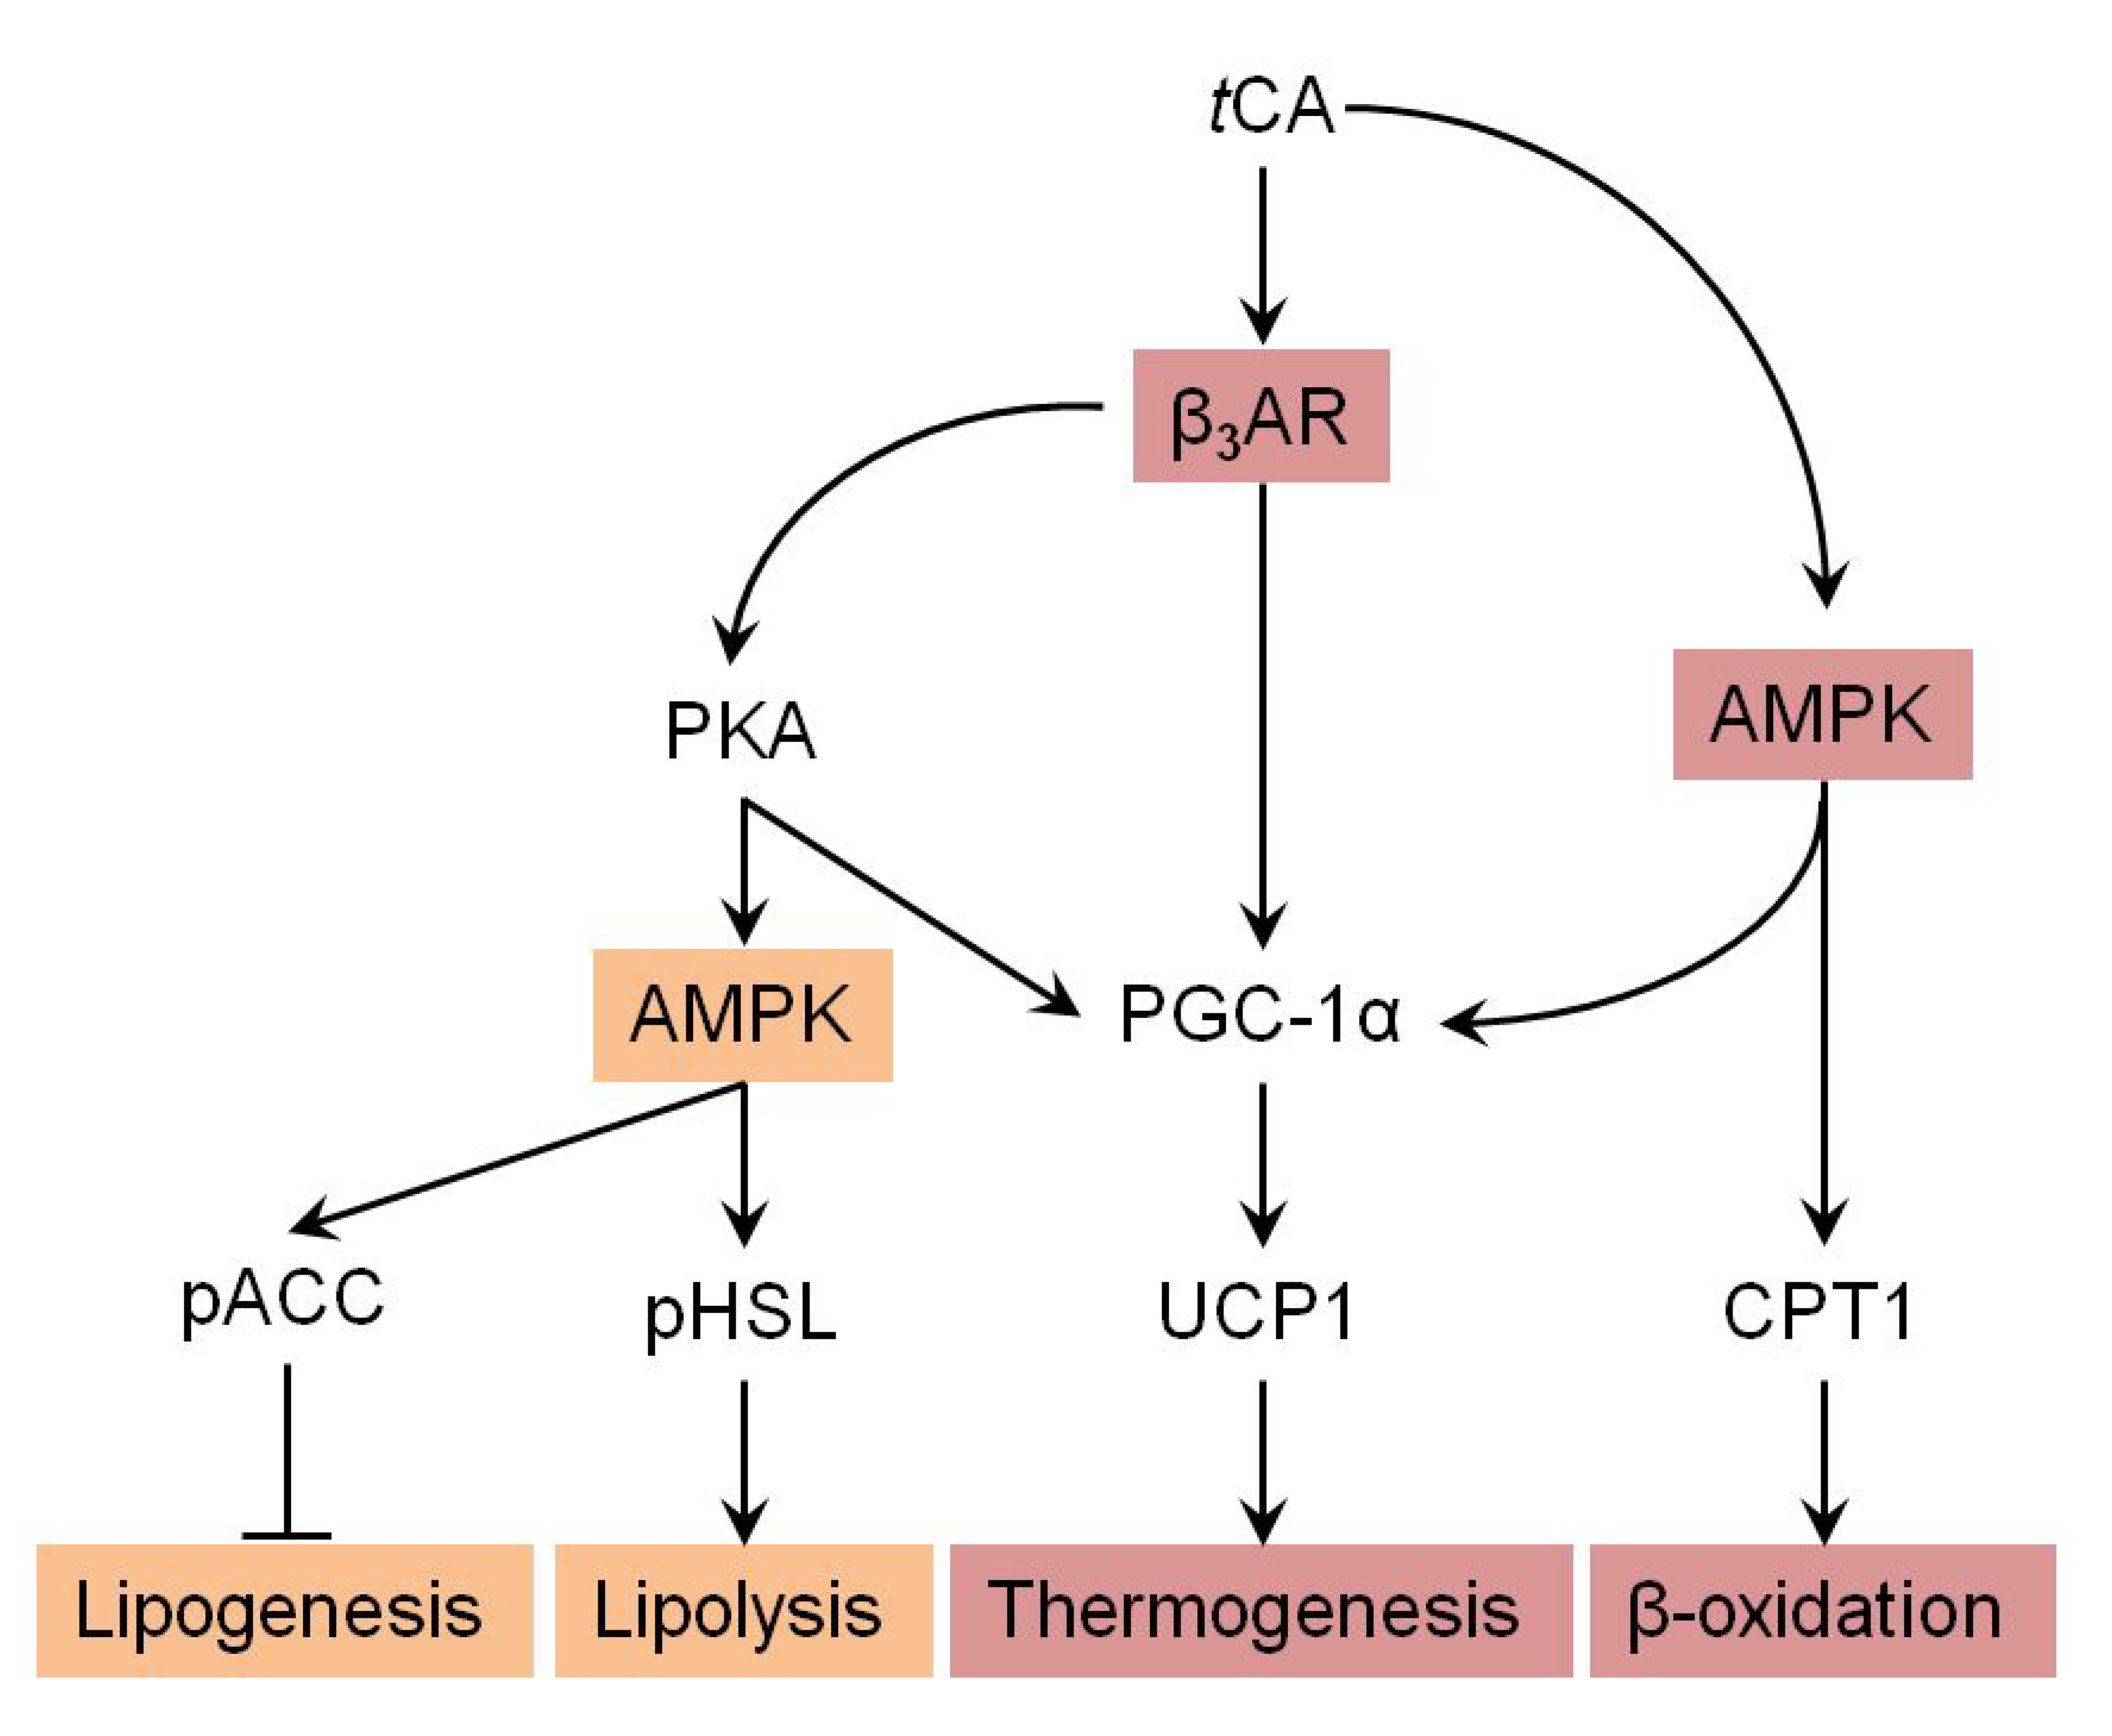
Suggested pathway for tCA-induced browning via AMPK-mediated β3-AR pathway. Arrow indicates stimulated regulation by tCA and T refers to suppressed regulation by tCA.
Figure 6.
Suggested pathway for tCA-induced browning via AMPK-mediated β3-AR pathway. Arrow indicates stimulated regulation by tCA and T refers to suppressed regulation by tCA.


Table 1.
List of primers used for real-time quantitative RT-PCR.
| Gene | Accession No. | Forward | Reverse |
|---|---|---|---|
| Cd137 | DQ832278.1 | GGTCTGTGCTTAAGACCGGG | TCTTAATAGCTGGTCCTCCCTC |
| Cidea | NM_007702.2 | CGGGAATAGCCAGAGTCACC | TGTGCATCGGATGTCGTAGG |
| Cited1 | NM_001276466.1 | GGAAGGCACAGCACCCACTC | GGAAGGCACAGCACCCACTC |
| Cox4 | NM_001293559.1 | TGACGGCCTTGGACGG | CGATCAGCGTAAGTGGGGA |
| Lhx8 | NM_010713.2 | CATCGCTGTTCTGCCTGTTAG | CTCGGGATTCAGCAGTCCTTC |
| Nrf1 | NM_010938.4 | GCTAATGGCCTGGTCCAGAT | CTGCGCTGTCCGATATCCTG |
| Ppargc1α | NM_008904.2 | ATGAATGCAGCGGTCTTAGC | AACAATGGCAGGGTTTGTTC |
| Prdm16 | NM_027504.3 | GATGGGAGATGCTGACGGAT | TGATCTGACACATGGCGAGG |
| Tbx1 | NM_001285472.1 | AGCGAGGCGGAAGGGA | CCTGGTGACTGTGCTGAAGT |
| Tfam | BC083084.1 | ATGTGGAGCGTGCTAAAAGC | GGATAGCTACCCATGCTGCTGGAA |
| Tmem26 | NM_177794.3 | CCATGGAAACCAGTATTGCAGC | ATTGGTGGCTCTGTGGGATG |
| Ucp1 | NM_009463.3 | CCTGCCTCTCTCGGAAACAA | GTAGCGGGGTTTGATCCCAT |
| Zic1 | NM_009573.3 | GCCACAAATCCGGGAAGAAG | CTCACTTTCTCGCCGCTCAG |
© 2019 by the authors. Licensee MDPI, Basel, Switzerland. This article is an open access article distributed under the terms and conditions of the Creative Commons Attribution (CC BY) license (http://creativecommons.org/licenses/by/4.0/).
Share and Cite
MDPI and ACS Style
Kang, N.H.; Mukherjee, S.; Yun, J.W. Trans-Cinnamic Acid Stimulates White Fat Browning and Activates Brown Adipocytes. Nutrients 2019, 11, 577. https://0-doi-org.brum.beds.ac.uk/10.3390/nu11030577
AMA Style
Kang NH, Mukherjee S, Yun JW. Trans-Cinnamic Acid Stimulates White Fat Browning and Activates Brown Adipocytes. Nutrients. 2019; 11(3):577. https://0-doi-org.brum.beds.ac.uk/10.3390/nu11030577
Chicago/Turabian StyleKang, Nam Hyeon, Sulagna Mukherjee, and Jong Won Yun. 2019. "Trans-Cinnamic Acid Stimulates White Fat Browning and Activates Brown Adipocytes" Nutrients 11, no. 3: 577. https://0-doi-org.brum.beds.ac.uk/10.3390/nu11030577
Note that from the first issue of 2016, this journal uses article numbers instead of page numbers. See further details here.