A Multi-Omics Approach Identifies Key Regulatory Pathways Induced by Long-Term Zinc Supplementation in Human Primary Retinal Pigment Epithelium

 , , ,
, , ,
Abstract
:
1. Introduction
2. Materials and Methods
2.1. Retinal Pigment Epithelial (RPE) Cell Culture
2.1.1. Immunofluorescence
2.1.2. Transmission Electron Microscopy
2.2. Genotyping
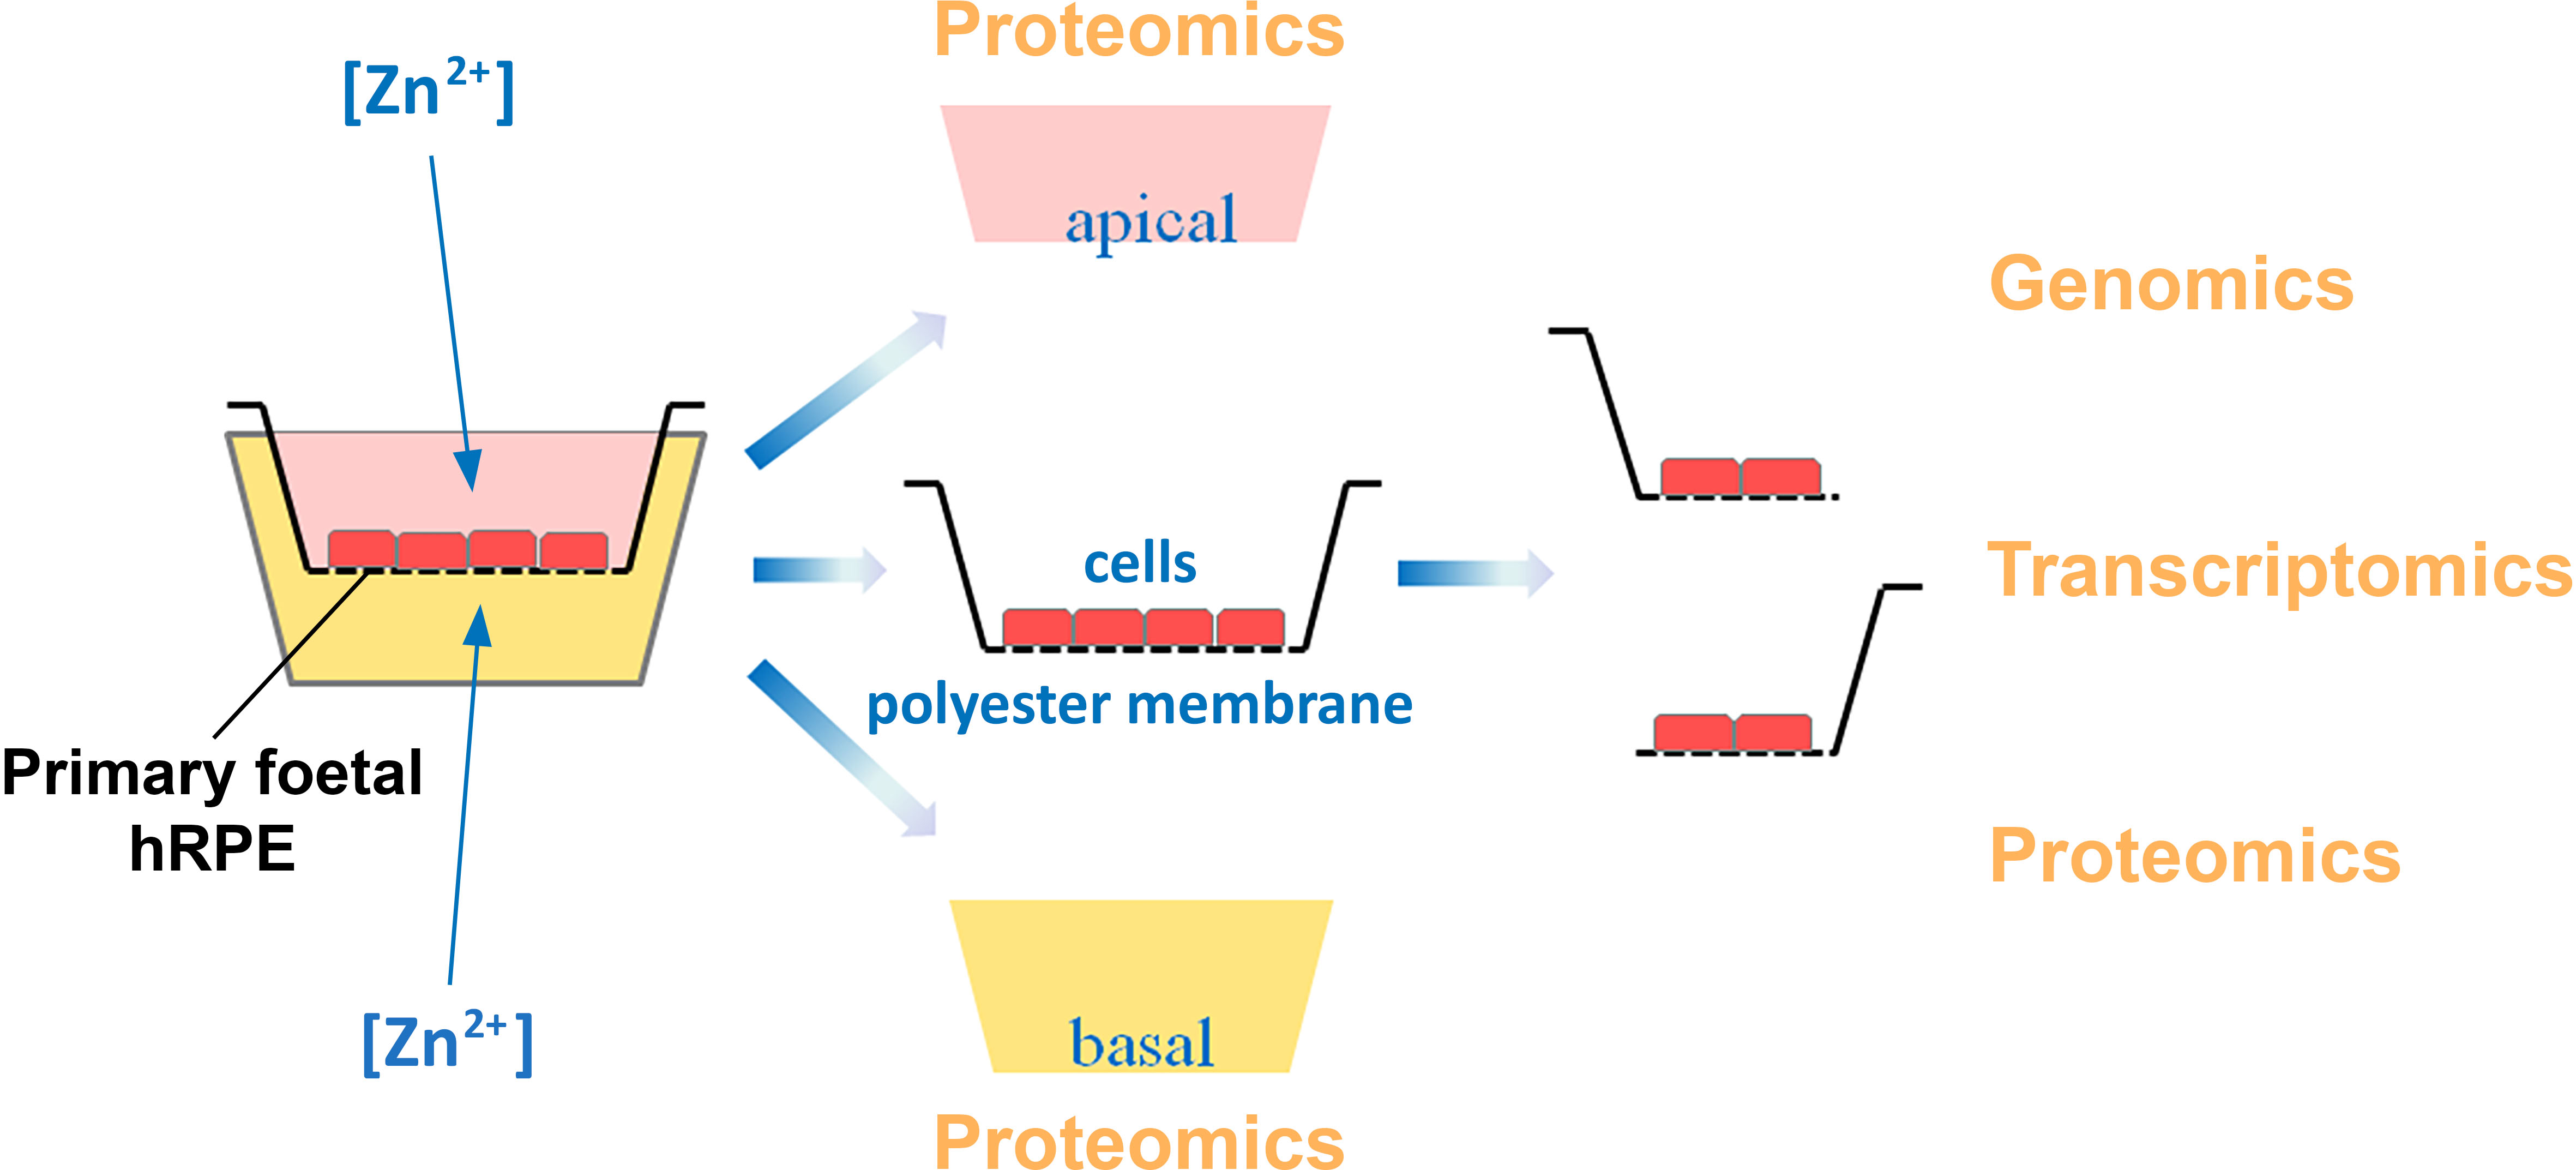
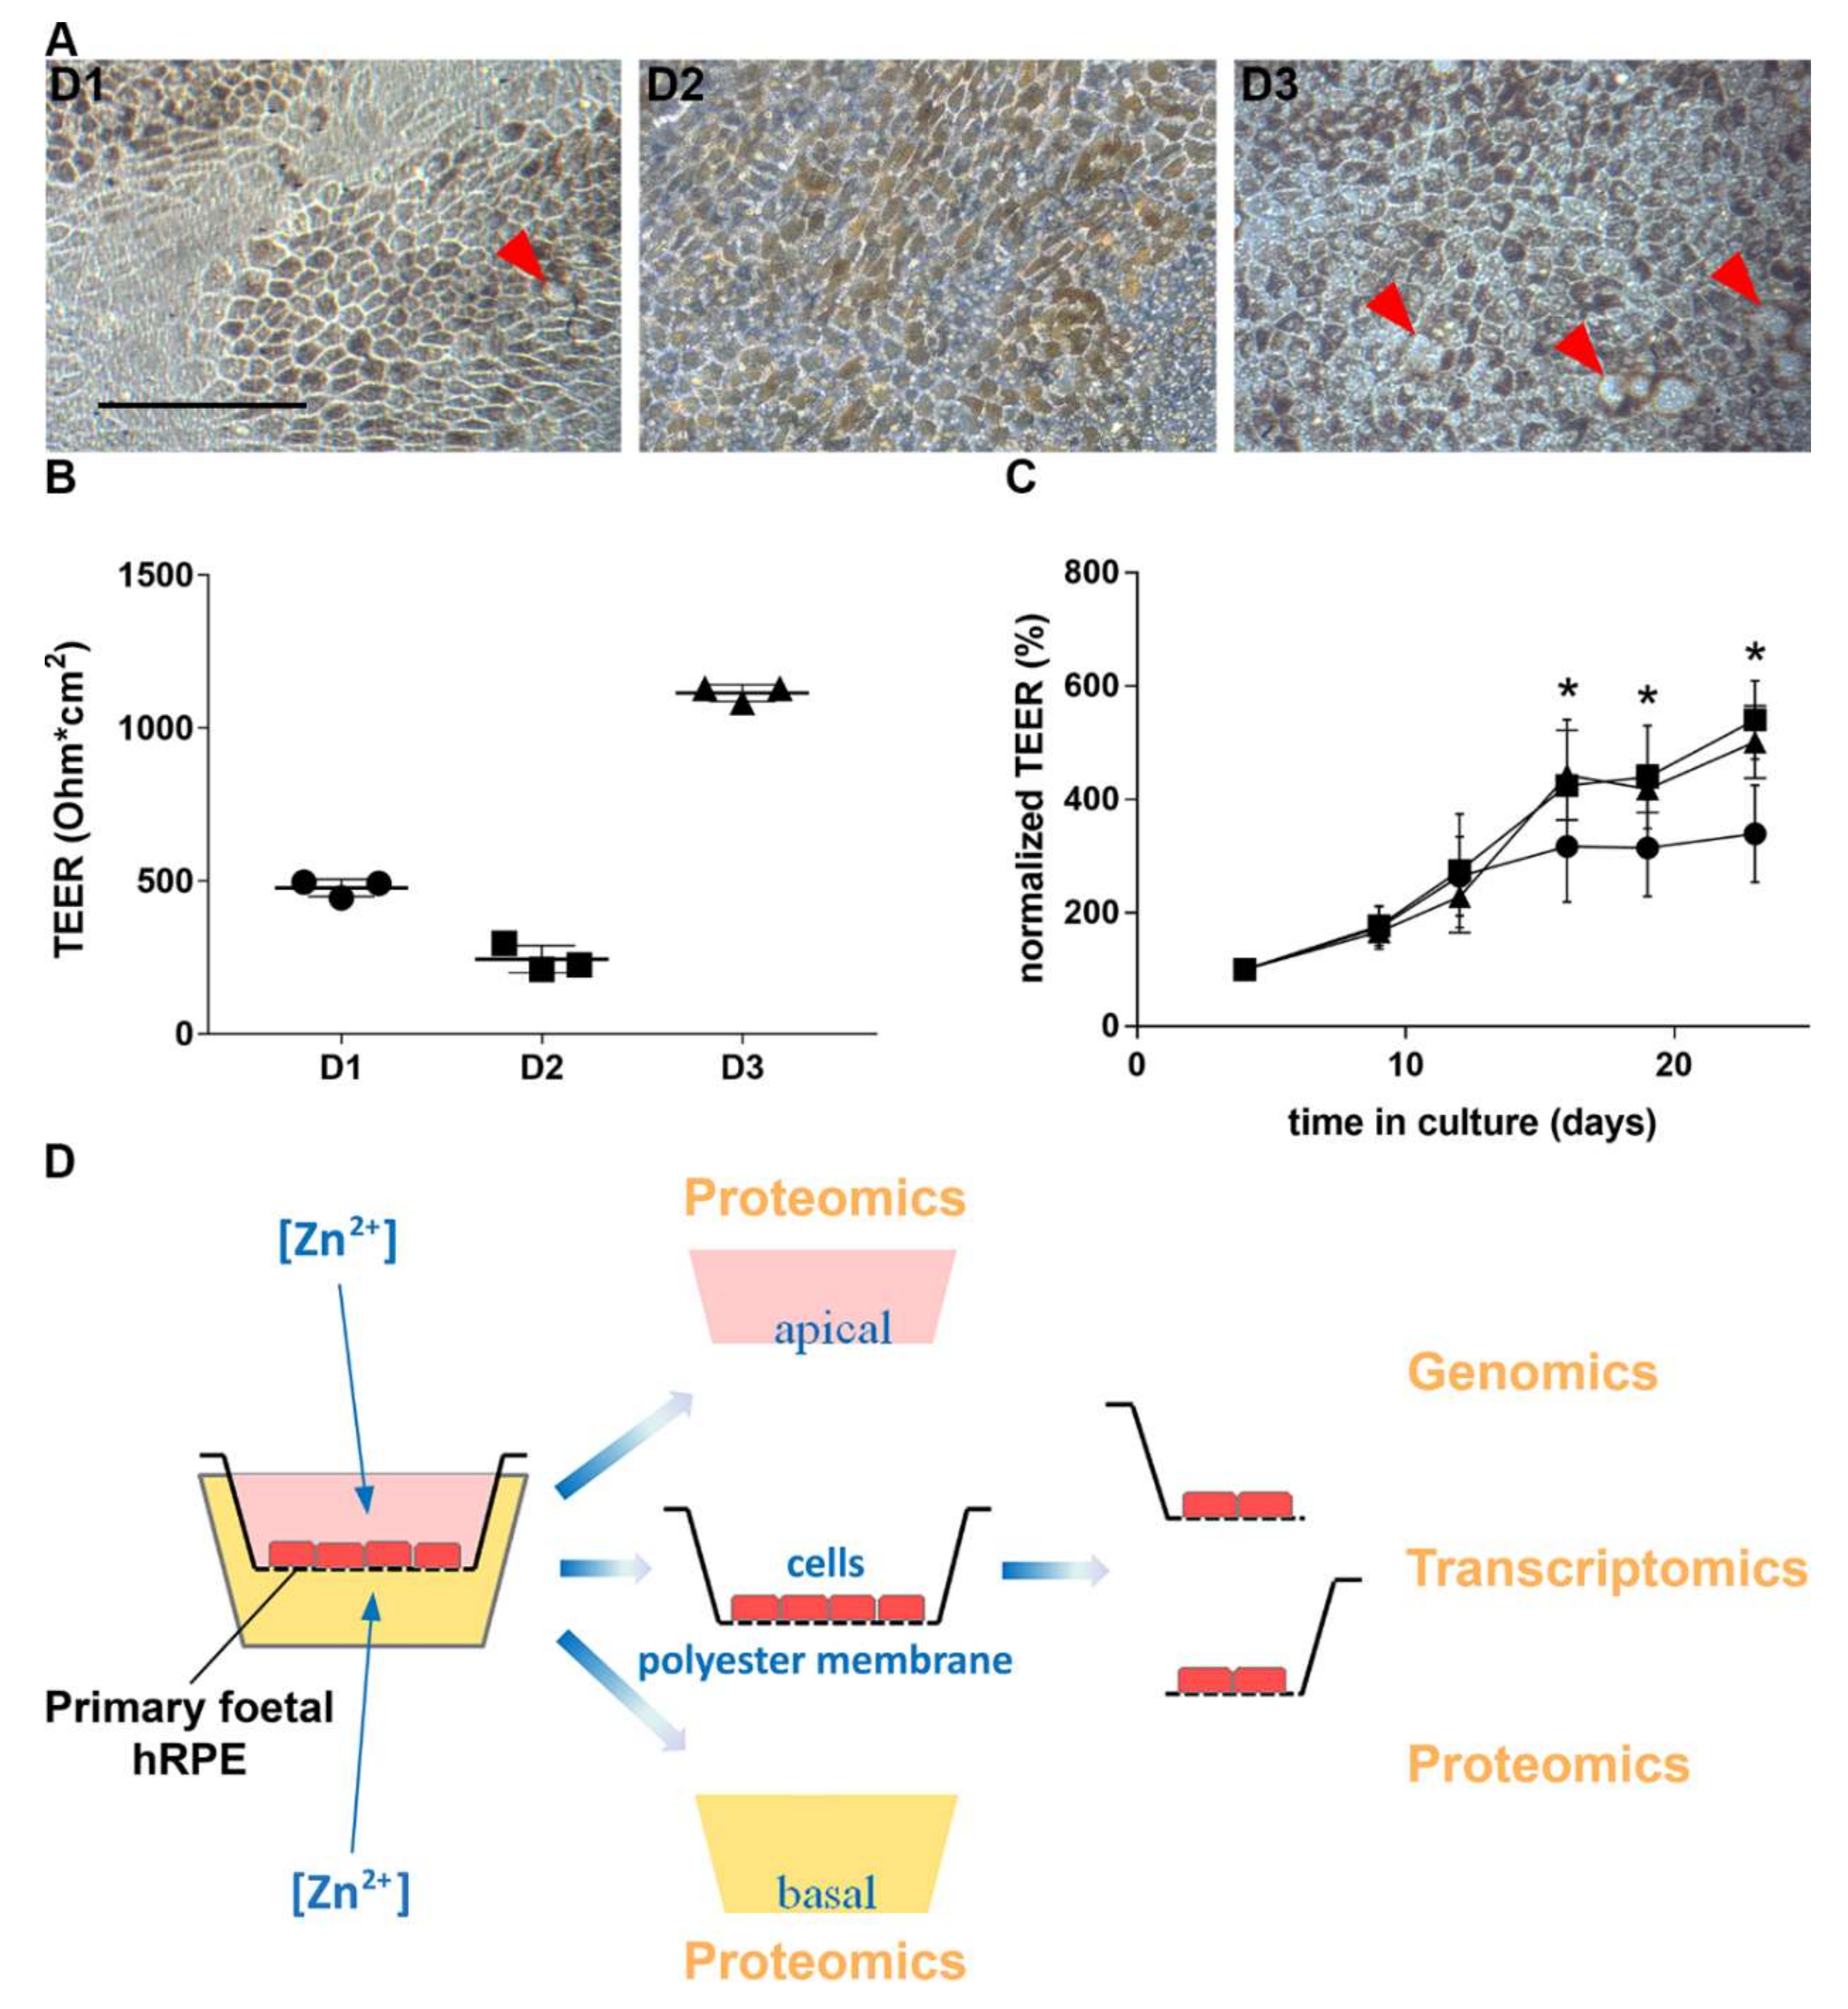
2.3. Multi-Omics Approach Development
2.3.1. Transcriptomics
2.3.2. Proteomic Sample Preparation
2.3.3. Proteome Analysis by Mass Spectrometry
2.3.4. Functional Classification Pathway and Network Analysis
3. Results
3.1. Characterization of Human Primary RPE Cell Culture
3.2. Zinc and RPE Barrier Function
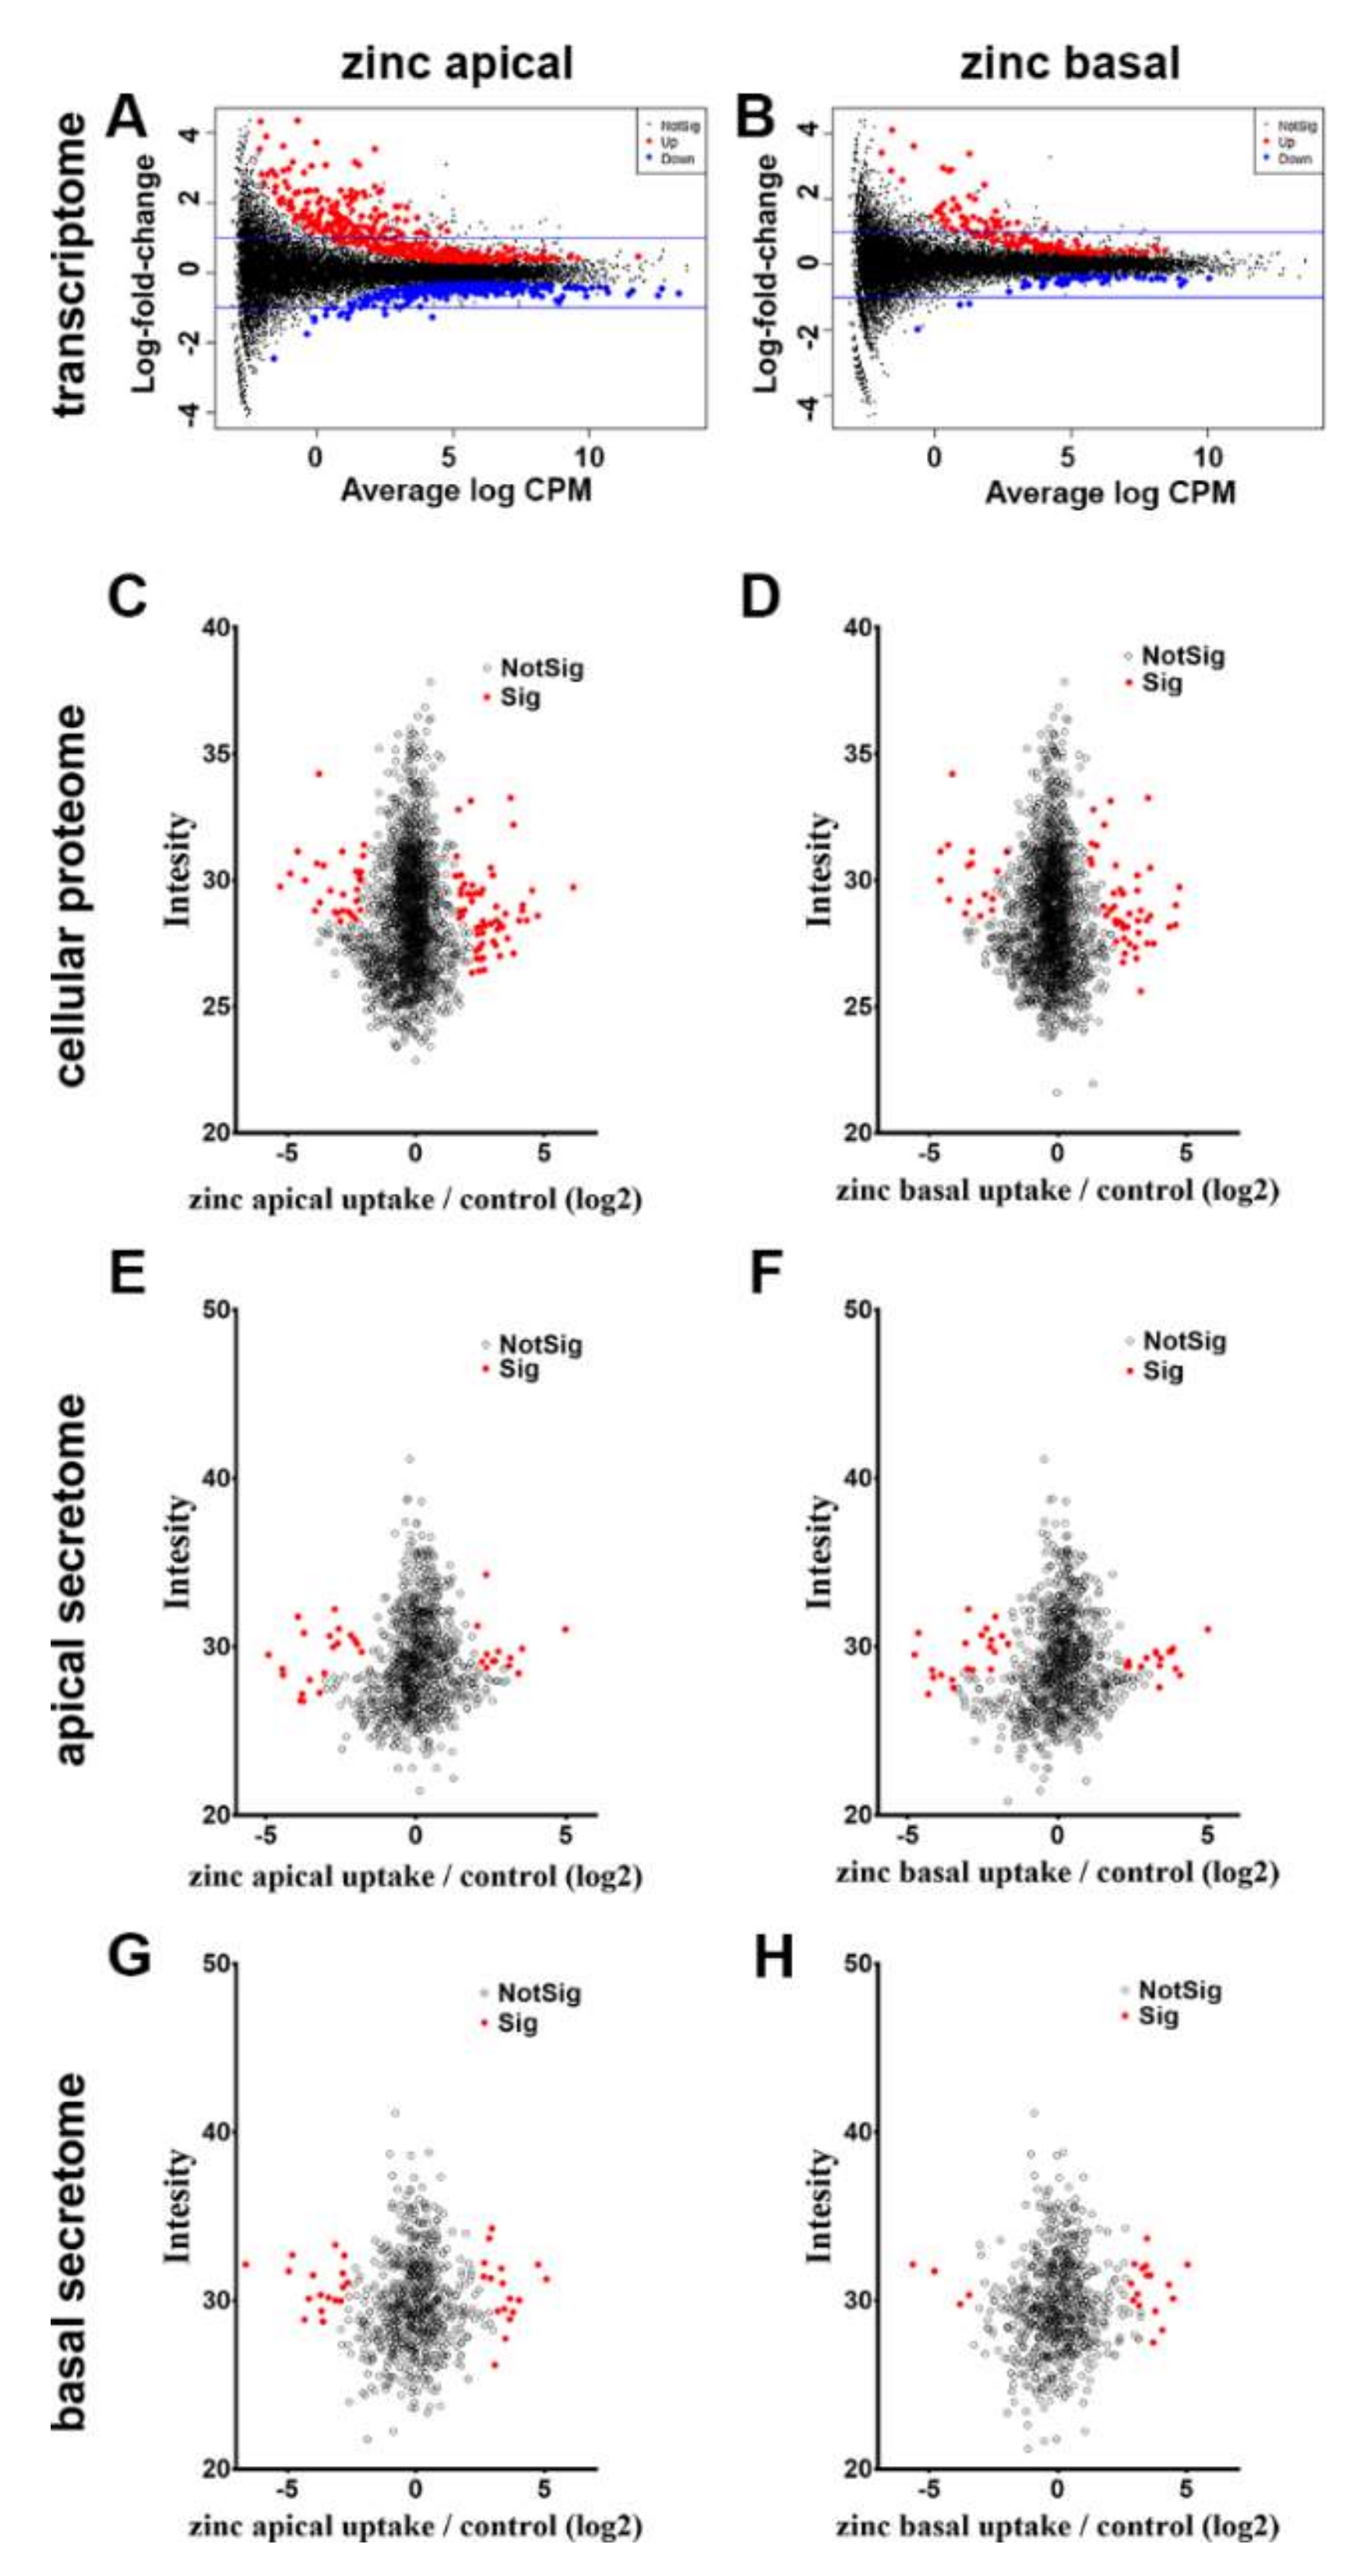
3.3. Multi-Omics Approach for the Effects of Zinc on RPE
3.3.1. Cellular Transcriptome
3.3.2. Cellular Proteome
3.3.3. Apical and Basal Secretomes
3.4. Pathway Identification
3.4.1. DAVID Gene Ontology (GO) and KEGG Pathway Analysis
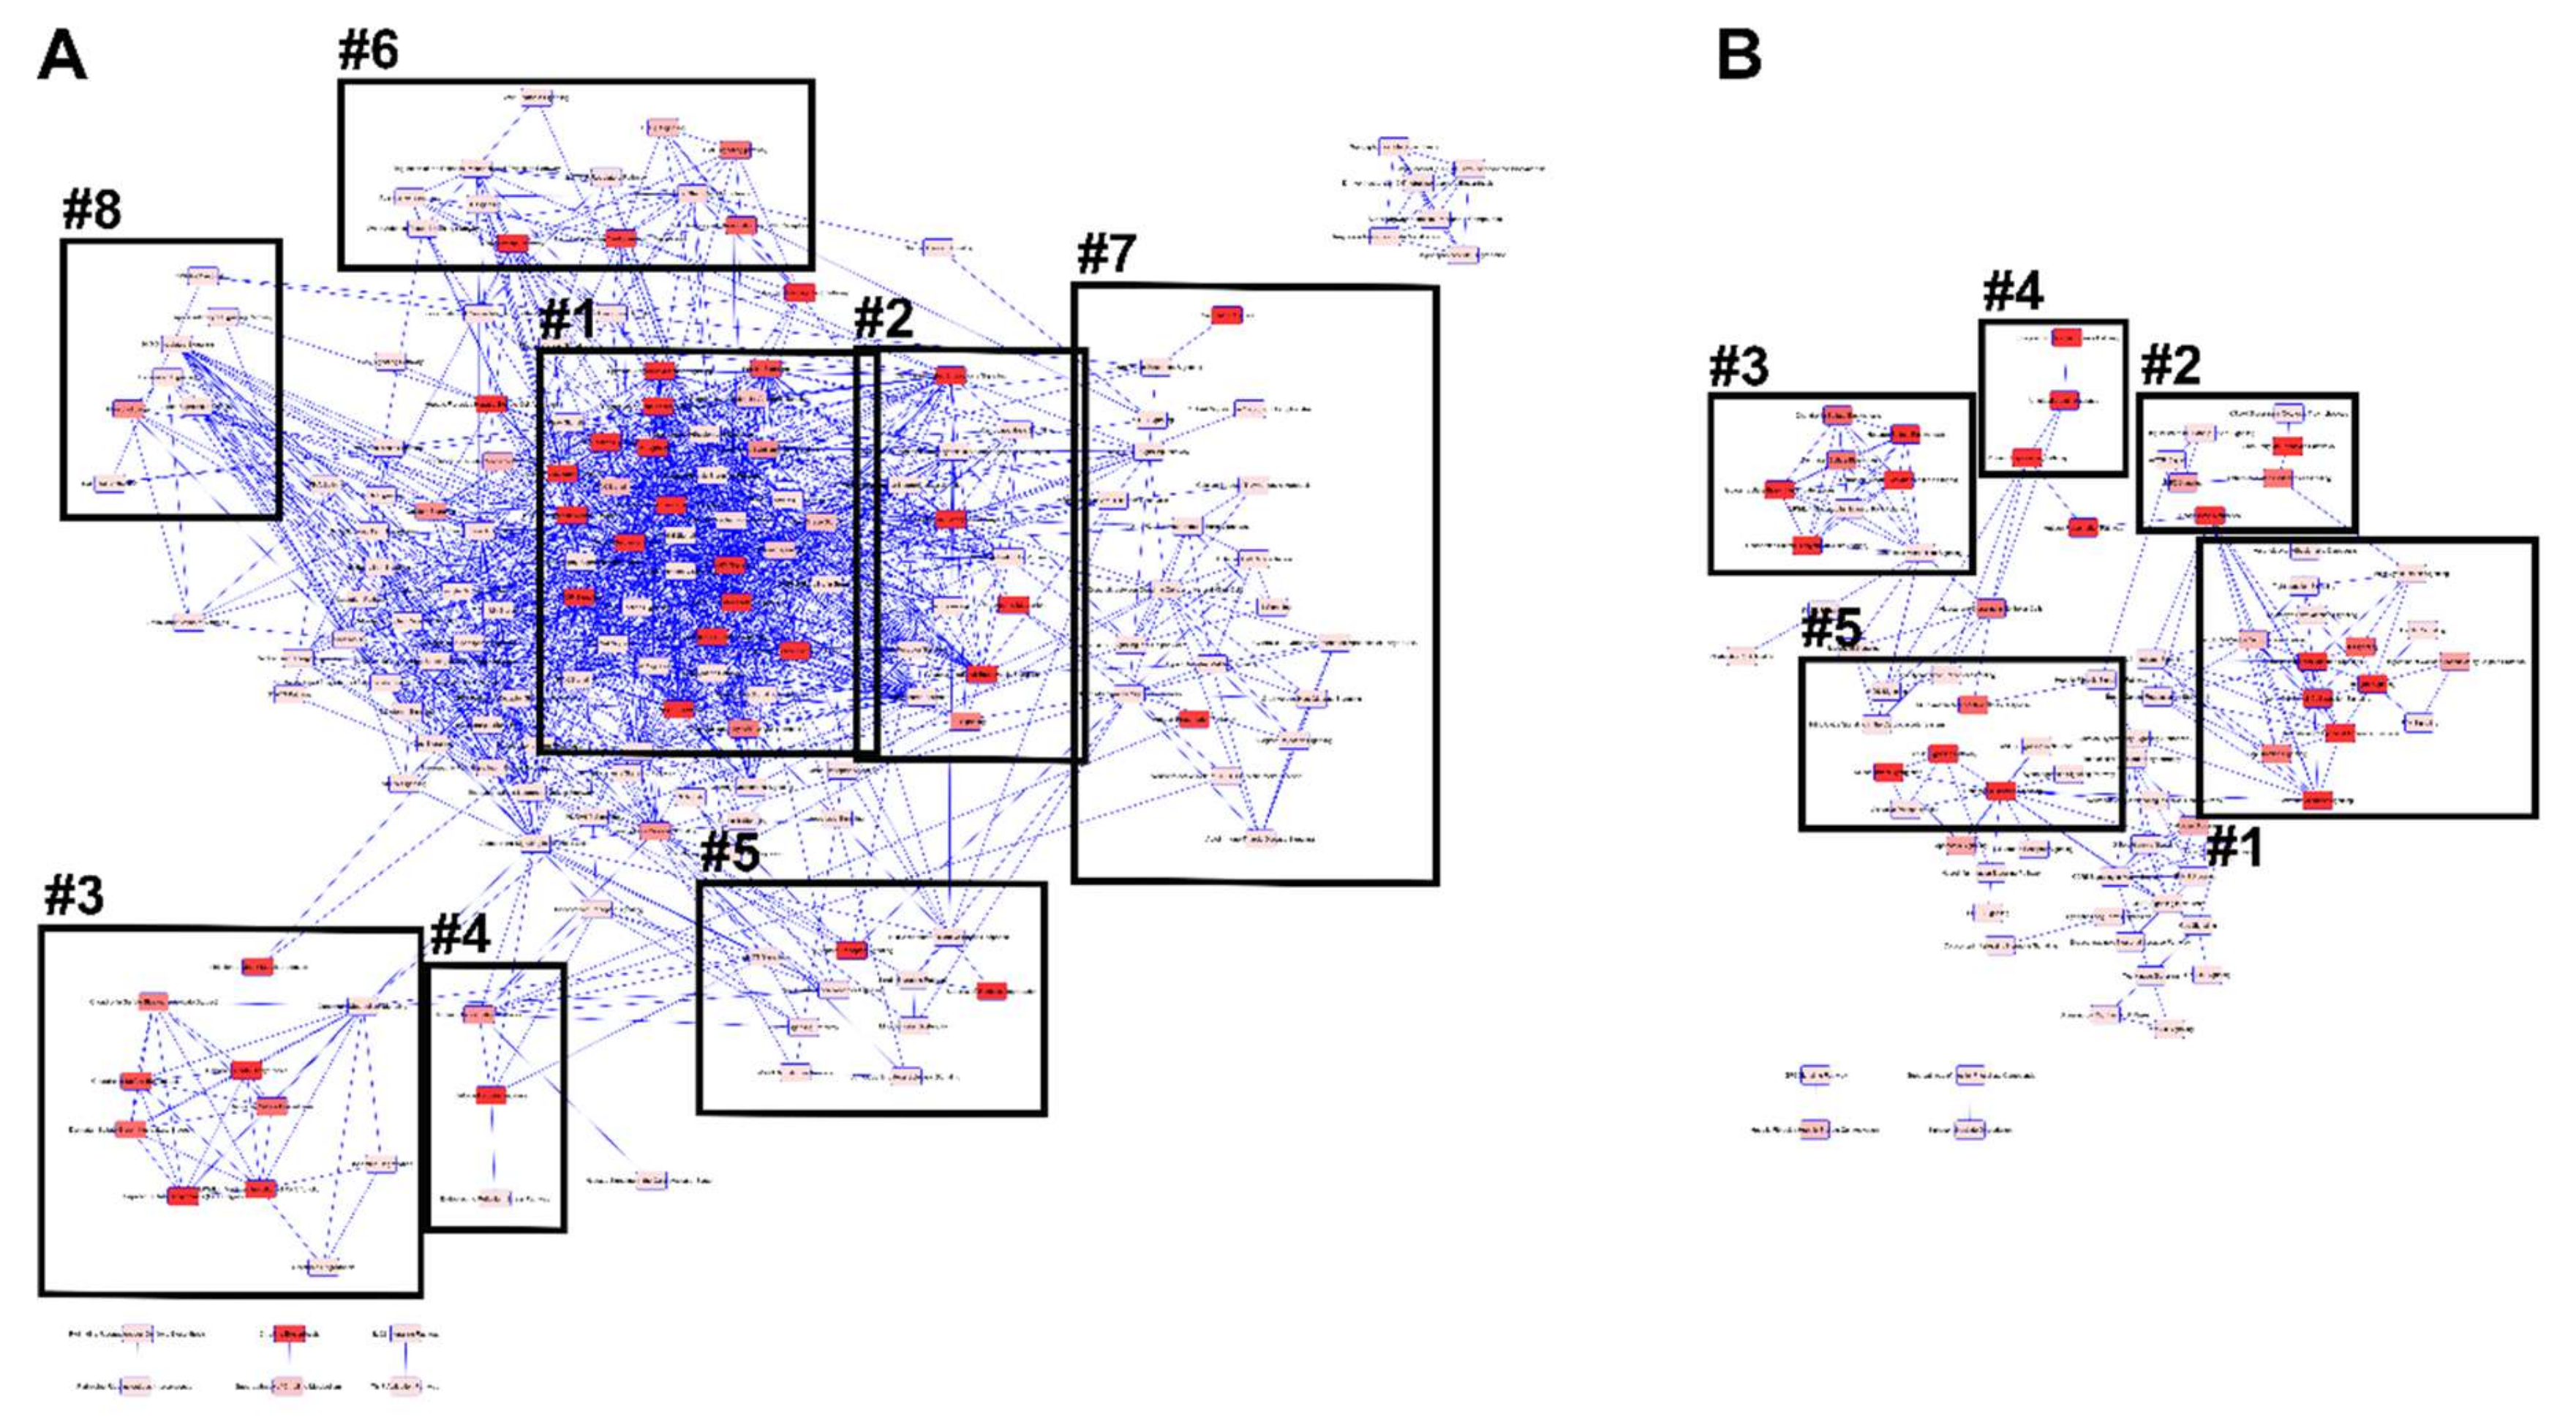
3.4.2. IPA Canonical Pathways and Regulatory Effect Networks
4. Discussion
5. Conclusions
Supplementary Materials
Author Contributions
Funding
Acknowledgments
Conflicts of Interest
References
- DeAngelis, M.M.; Owen, L.A.; Morrison, M.A.; Morgan, D.J.; Li, M.; Shakoor, A.; Vitale, A.; Iyengar, S.; Stambolian, D.; Kim, I.K.; et al. Genetics of age-related macular degeneration (AMD). Hum. Mol. Genet. 2017, 26, R246. [Google Scholar] [CrossRef] [PubMed] [Green Version]
- Fritsche, L.G.; Igl, W.; Bailey, J.N.; Grassmann, F.; Sengupta, S.; Bragg-Gresham, J.L.; Burdon, K.P.; Hebbring, S.J.; Wen, C.; Gorski, M.; et al. A large genome-wide association study of age-related macular degeneration highlights contributions of rare and common variants. Nat. Genet. 2016, 48, 134–143. [Google Scholar] [CrossRef] [PubMed] [Green Version]
- Lim, L.S.; Mitchell, P.; Seddon, J.M.; Holz, F.G.; Wong, T.Y. Age-related macular degeneration. Lancet 2012, 379, 1728–1738. [Google Scholar] [CrossRef]
- Bourne, R.R.; Stevens, G.A.; White, R.A.; Smith, J.L.; Flaxman, S.R.; Price, H.; Jonas, J.B.; Keeffe, J.; Leasher, J.; Naidoo, K.; et al. Causes of vision loss worldwide, 1990-2010: A systematic analysis. Lancet Glob. Health 2013, 1, e339–e349. [Google Scholar] [CrossRef] [Green Version]
- Van Leeuwen, R.; Boekhoorn, S.; Vingerling, J.R.; Witteman, J.C.; Klaver, C.C.; Hofman, A.; De Jong, P.T. Dietary intake of antioxidants and risk of age-related macular degeneration. JAMA 2005, 294, 3101–3107. [Google Scholar] [CrossRef] [Green Version]
- Age-Related Eye Disease Study Research Group. A randomized, placebo-controlled, clinical trial of high-dose supplementation with vitamins C and E, beta carotene, and zinc for age-related macular degeneration and vision loss: AREDS report no. 8. Arch. Ophthalmol. 2001, 119, 1417–1436. [Google Scholar] [CrossRef] [Green Version]
- Tan, J.S.; Wang, J.J.; Flood, V.; Rochtchina, E.; Smith, W.; Mitchell, P. Dietary antioxidants and the long-term incidence of age-related macular degeneration: The Blue Mountains Eye study. Ophthalmology 2008, 115, 334–341. [Google Scholar] [CrossRef]
- Prasad, A.S. Clinical, endocrinological and biochemical effects of zinc deficiency. Clin. Endocrinol. Metab. 1985, 14, 567–589. [Google Scholar] [CrossRef]
- Cousins, R.J. Zinc. Present Knowledge in Nutrition, 9th ed.; Brown Bowman, B.A., Russell, R.M., Eds.; International Life Science Institute (ILSI) Press: Washington, DC, USA, 2006; Volume 1, pp. 225–457. [Google Scholar]
- Ha, N.; Hellauer, K.; Turcotte, B. Mutations in target DNA elements of yeast HAP1 modulate its transcriptional activity without affecting DNA binding. Nucl. Acids Res. 1996, 24, 1453–1459. [Google Scholar] [CrossRef] [Green Version]
- Beyersmann, D.; Haase, H. Functions of zinc in signaling, proliferation and differentiation of mammalian cells. Biometals 2001, 14, 331–341. [Google Scholar] [CrossRef]
- Tate, D.J., Jr.; Miceli, M.V.; Newsome, D.A. Zinc protects against oxidative damage in cultured human retinal pigment epithelial cells. Free Radic. Biol. Med. 1999, 26, 704–713. [Google Scholar] [CrossRef]
- Henderson, L.M.; Chappell, J.B.; Jones, O.T. Superoxide generation by the electrogenic NADPH oxidase of human neutrophils is limited by the movement of a compensating charge. Biochem. J. 1988, 255, 285–290. [Google Scholar] [PubMed]
- Musset, B.; Decoursey, T. Biophysical properties of the voltage gated proton channel H(V)1. Wiley Interdiscip. Rev. Membr. Transp. Signal. 2012, 1, 605–620. [Google Scholar] [CrossRef] [PubMed] [Green Version]
- Cousins, R.J.; Liuzzi, J.P.; Lichten, L.A. Mammalian zinc transport, trafficking, and signals. J. Biol. Chem. 2006, 281, 24085–24089. [Google Scholar] [CrossRef] [Green Version]
- Cassandri, M.; Smirnov, A.; Novelli, F.; Pitolli, C.; Agostini, M.; Malewicz, M.; Melino, G.; Raschella, G. Zinc-finger proteins in health and disease. Cell Death Discov. 2017, 3, 17071. [Google Scholar] [CrossRef] [Green Version]
- Prasad, A.S. Effects of zinc deficiency on Th1 and Th2 cytokine shifts. J. Infect. Dis. 2000, 182 (Suppl. S1), S62–S68. [Google Scholar] [CrossRef] [Green Version]
- Ibs, K.H.; Rink, L. Zinc-altered immune function. J. Nutr. 2003, 133, 1452S–1456S. [Google Scholar] [CrossRef]
- Bogden, J.D. Influence of zinc on immunity in the elderly. J. Nutr. Health Aging 2004, 8, 48–54. [Google Scholar]
- Mocchegiani, E.; Giacconi, R.; Cipriano, C.; Malavolta, M. NK and NKT cells in aging and longevity: Role of zinc and metallothioneins. J. Clin. Immunol. 2009, 29, 416–425. [Google Scholar] [CrossRef]
- Barzegar-Befroei, N.; Cahyadi, S.; Gango, A.; Peto, T.; Lengyel, I. Zinc and eye diseases. In Zinc in Human Health; Rink, L., Ed.; IOS Press: Amsterdam, The Netherlands, 2011. [Google Scholar] [CrossRef]
- Ugarte, M.; Osborne, N.N. Zinc in the retina. Progr. Neurobiol. 2001, 64, 219–249. [Google Scholar] [CrossRef]
- Boulton, M.; Dayhaw-Barker, P. The role of the retinal pigment epithelium: Topographical variation and ageing changes. Eye (London) 2001, 15, 384–389. [Google Scholar] [CrossRef] [PubMed] [Green Version]
- Tan, A.C.S.; Pilgrim, M.G.; Fearn, S.; Bertazzo, S.; Tsolaki, E.; Morrell, A.P.; Li, M.; Messinger, J.D.; Dolz-Marco, R.; Lei, J.; et al. Calcified nodules in retinal drusen are associated with disease progression in age-related macular degeneration. Sci. Transl. Med. 2018, 10. [Google Scholar] [CrossRef] [PubMed] [Green Version]
- Gass, J.D. Drusen and disciform macular detachment and degeneration. 1972. Retina 2003, 23, 409–436. [Google Scholar] [PubMed]
- Ferris, F.L.; Davis, M.D.; Clemons, T.E.; Lee, L.Y.; Chew, E.Y.; Lindblad, A.S.; Milton, R.C.; Bressler, S.B.; Klein, R. A simplified severity scale for age-related macular degeneration: AREDS report No. 18. Arch. Ophthalmol. 2005, 123, 1570–1574. [Google Scholar] [PubMed]
- Ferris, F.L., III; Wilkinson, C.P.; Bird, A.; Chakravarthy, U.; Chew, E.; Csaky, K.; Sadda, S.R. Clinical classification of age-related macular degeneration. Ophthalmology 2013, 120, 844–851. [Google Scholar] [CrossRef]
- Gong, J.; Cai, H.; Noggle, S.; Paull, D.; Rizzolo, L.J.; Del Priore, L.V.; Fields, M.A. Stem cell-derived retinal pigment epithelium from patients with age-related macular degeneration exhibit reduced metabolism and matrix interactions. Stem Cells Transl Med. 2020, 9, 364–376. [Google Scholar] [CrossRef] [Green Version]
- Fernandez-Godino, R. Alterations in Extracellular Matrix/Bruch’s Membrane Can Cause the Activation of the Alternative Complement Pathway via Tick-Over. Adv. Exp. Med. Biol. 2018, 1074, 29–35. [Google Scholar] [CrossRef]
- Fernandez-Godino, R.; Pierce, E.A. C3a triggers formation of sub-retinal pigment epithelium deposits via the ubiquitin proteasome pathway. Sci. Rep. 2018, 8, 9679. [Google Scholar] [CrossRef] [Green Version]
- Fernandez-Godino, R.; Pierce, E.A.; Garland, D.L. Extracellular matrix alterations and deposit formation in AMD. Adv. Exp. Med. Biol. 2016, 854, 53–58. [Google Scholar] [CrossRef]
- Lakkaraju, A.; Umapathy, A.; Tan, L.X.; Daniele, L.; Philp, N.J.; Boesze-Battaglia, K.; Williams, D.S. The cell biology of the retinal pigment epithelium. Progr Retin. Eye Res. 2020, 100846. [Google Scholar] [CrossRef]
- Chen, X.; Singh, D.; Adelman, R.A.; Rizzolo, L.J. Unstimulated, serum-free cultures of retinal pigment epithelium excrete large mounds of drusen-like deposits. Curr. Eye Res. 2020, 1–5. [Google Scholar] [CrossRef] [PubMed]
- Pilgrim, M.G.; Lengyel, I.; Lanzirotti, A.; Newville, M.; Fearn, S.; Emri, E.; Knowles, J.C.; Messinger, J.D.; Read, R.W.; Guidry, C.; et al. Subretinal pigment epithelial deposition of drusen components including hydroxyapatite in a primary cell culture model. Investig. Ophthalmol. Vis. Sci. 2017, 58, 708–719. [Google Scholar] [CrossRef] [PubMed] [Green Version]
- Galloway, C.A.; Dalvi, S.; Hung, S.S.C.; MacDonald, L.A.; Latchney, L.R.; Wong, R.C.B.; Guymer, R.H.; Mackey, D.A.; Williams, D.S.; Chung, M.M.; et al. Drusen in patient-derived hiPSC-RPE models of macular dystrophies. Proc. Natl. Acad. Sci. USA 2017, 114, E8214–E8223. [Google Scholar] [CrossRef] [PubMed] [Green Version]
- Erie, J.C.; Good, J.A.; Butz, J.A.; Pulido, J.S. Reduced zinc and copper in the retinal pigment epithelium and choroid in age-related macular degeneration. Am. J. Ophthalmol. 2009, 147, 276–282. [Google Scholar] [CrossRef] [PubMed]
- Newsome, D.A.; Micelli, M.V.; Tate, D., Jr.; Alcock, N.W.; Oliver, P.D. Zinc content of human retinal pigment epithelium decreases with age and macular degeneration, but superoxide dismutase activity increases. J. Trace Elem. Exp. Med. 1996, 8, 193–199. [Google Scholar] [CrossRef]
- Pao, P.J.; Emri, E.; Abdirahman, S.B.; Soorma, T.; Zeng, H.H.; Hauck, S.M.; Thompson, R.B.; Lengyel, I. The effects of zinc supplementation on primary human retinal pigment epithelium. J. Trace Elem. Med. Biol. 2018, 49, 184–191. [Google Scholar] [CrossRef] [PubMed] [Green Version]
- Bozym, R.A.; Chimienti, F.; Giblin, L.J.; Gross, G.W.; Korichneva, I.; Li, Y.; Libert, S.; Maret, W.; Parviz, M.; Frederickson, C.J.; et al. Free zinc ions outside a narrow concentration range are toxic to a variety of cells in vitro. Exp. Biol. Med. (Maywood) 2010, 235, 741–750. [Google Scholar] [CrossRef] [Green Version]
- Yokoyama, M.; Koh, J.; Choi, D.W. Brief exposure to zinc is toxic to cortical neurons. Neurosci. Lett. 1986, 71, 351–355. [Google Scholar] [CrossRef]
- Weiss, J.H.; Hartley, D.M.; Koh, J.Y.; Choi, D.W. AMPA receptor activation potentiates zinc neurotoxicity. Neuron 1993, 10, 43–49. [Google Scholar] [CrossRef]
- Tate, D.J.; Miceli, M.V.; Newsome, D.A.; Alcock, N.W.; Oliver, P.D. Influence of zinc on selected cellular functions of cultured human retinal pigment epithelium. Curr. Eye Res. 1995, 14, 897–903. [Google Scholar] [CrossRef]
- Song, J.; Lee, S.C.; Kim, S.S.; Koh, H.J.; Kwon, O.W.; Kang, J.J.; Kim, E.K.; Shin, S.H.; Lee, J.H. Zn2+-induced cell death is mediated by the induction of intracellular ROS in ARPE-19 cells. Curr. Eye Res. 2004, 28, 195–201. [Google Scholar] [CrossRef] [PubMed]
- Bozym, R.; Hurst, T.K.; Westerberg, N.; Stoddard, A.; Fierke, C.A.; Frederickson, C.J.; Thompson, R.B. Determination of zinc using carbonic anhydrase-based fluorescence biosensors. Methods Enzymol. 2008, 450, 287–309. [Google Scholar] [CrossRef] [PubMed]
- Maminishkis, A.; Chen, S.; Jalickee, S.; Banzon, T.; Shi, G.; Wang, F.E.; Ehalt, T.; Hammer, J.A.; Miller, S.S. Confluent monolayers of cultured human fetal retinal pigment epithelium exhibit morphology and physiology of native tissue. Investig. Ophthalmol. Vis. Sci. 2006, 47, 3612–3624. [Google Scholar] [CrossRef] [PubMed] [Green Version]
- Sonoda, S.; Spee, C.; Barron, E.; Ryan, S.J.; Kannan, R.; Hinton, D.R. A protocol for the culture and differentiation of highly polarized human retinal pigment epithelial cells. Nat. Protoc. 2009, 4, 662–673. [Google Scholar] [CrossRef] [PubMed] [Green Version]
- De Breuk, A.; Acar, I.E.; Kersten, E.; Schijvenaars, M.V.A.P.; Colijn, J.M.; Haer-Wigman, L.; Bakker, B.; De Jong, S.; Meester-Smoor, M.A.; Verzijden, T.; et al. Development of a genotype assay for age-related macular degeneration: The EYE-RISK Consortium. Ophthalmology 2020, in press. [Google Scholar]
- Buitendijk, G.H.S.; Rochtchina, E.; Myers, C.; Van Duijn, C.M.; Lee, K.E.; Klein, B.E.K.; Meuer, S.M.; De Jong, P.; Holliday, E.G.; Tan, A.G.; et al. Prediction of age-related macular degeneration in the general population: The Three Continent AMD Consortium. Ophthalmology 2013, 120, 2644–2655. [Google Scholar] [CrossRef] [Green Version]
- Robinson, M.D.; McCarthy, D.J.; Smyth, G.K. edgeR: A bioconductor package for differential expression analysis of digital gene expression data. Bioinformatics 2010, 26, 139–140. [Google Scholar] [CrossRef] [Green Version]
- Coman, C.; Solari, F.A.; Hentschel, A.; Sickmann, A.; Zahedi, R.P.; Ahrends, R. Simultaneous metabolite, protein, lipid extraction (SIMPLEX): A combinatorial multimolecular omics approach for systems biology. Mol. Cell. Proteom. 2016, 15, 1453–1466. [Google Scholar] [CrossRef] [Green Version]
- Cox, J.; Mann, M. MaxQuant enables high peptide identification rates, individualized p.p.b.-range mass accuracies and proteome-wide protein quantification. Nat. Biotechnol. 2008, 26, 1367–1372. [Google Scholar] [CrossRef]
- Vizcaíno, J.A.; Csordas, A.; Del-Toro, N.; Dianes, J.A.; Griss, J.; Lavidas, I.; Mayer, G.; Perez-Riverol, Y.; Reisinger, F.; Ternent, T.; et al. 2016 update of the PRIDE database and its related tools. Nucl. Acids Res. 2016, 44, D447–D456. [Google Scholar] [CrossRef]
- Huang da, W.; Sherman, B.T.; Lempicki, R.A. Systematic and integrative analysis of large gene lists using DAVID bioinformatics resources. Nat. Protoc. 2009, 4, 44–57. [Google Scholar] [CrossRef] [PubMed]
- Huang da, W.; Sherman, B.T.; Lempicki, R.A. Bioinformatics enrichment tools: Paths toward the comprehensive functional analysis of large gene lists. Nucl. Acids Res. 2009, 37, 1–13. [Google Scholar] [CrossRef] [PubMed] [Green Version]
- Lorés-Motta, L.; Paun, C.C.; Corominas, J.; Pauper, M.; Geerlings, M.J.; Altay, L.; Schick, T.; Daha, M.R.; Fauser, S.; Hoyng, C.B.; et al. Genome-wide association study reveals variants in CFH and CFHR4 associated with systemic complement activation: Implications in age-related macular degeneration. Ophthalmology 2018, 125, 1064–1074. [Google Scholar] [CrossRef] [PubMed] [Green Version]
- Han, X.; Gharahkhani, P.; Mitchell, P.; Liew, G.; Hewitt, A.W.; MacGregor, S. Genome-wide meta-analysis identifies novel loci associated with age-related macular degeneration. J. Hum. Genet. 2020, 65, 657–665. [Google Scholar] [CrossRef]
- Johnson, L.V.; Forest, D.L.; Banna, C.D.; Radeke, C.M.; Maloney, M.A.; Hu, J.; Spencer, C.N.; Walker, A.M.; Tsie, M.S.; Bok, D.; et al. Cell culture model that mimics drusen formation and triggers complement activation associated with age-related macular degeneration. Proc. Natl. Acad. Sci. USA 2011, 108, 18277–18282. [Google Scholar] [CrossRef] [Green Version]
- Amin, S.; Chong, N.H.; Bailey, T.A.; Zhang, J.; Knupp, C.; Cheetham, M.E.; Greenwood, J.; Luthert, P.J. Modulation of Sub-RPE deposits in vitro: A potential model for age-related macular degeneration. Invest Ophthalmol. Vis. Sci. 2004, 45, 1281–1288. [Google Scholar] [CrossRef] [Green Version]
- Krämer, A.; Green, J.; Pollard, J., Jr.; Tugendreich, S. Causal analysis approaches in ingenuity pathway analysis. Bioinformatics 2014, 30, 523–530. [Google Scholar] [CrossRef]
- Age-Related Eye Disease Study Research Group. The age-related eye disease study (AREDS): Design implications. AREDS report no. 1. Control Clin. Trials 1999, 20, 573–600. [Google Scholar] [CrossRef]
- Hofman, A.; Grobbee, D.E.; De Jong, P.T.; Van den Ouweland, F.A. Determinants of disease and disability in the elderly: The Rotterdam Elderly Study. Eur. J. Epidemiol. 1991, 7, 403–422. [Google Scholar] [CrossRef] [Green Version]
- Mitchell, P.; Smith, W.; Wang, J.J. Iris color, skin sun sensitivity, and age-related maculopathy. The Blue Mountains Eye Study. Ophthalmology 1998, 105, 1359–1363. [Google Scholar] [CrossRef]
- Chew, E.Y.; Clemons, T.E.; Agron, E.; Sperduto, R.D.; Sangiovanni, J.P.; Kurinij, N.; Davis, M.D. Long-term effects of vitamins C and E, beta-carotene, and zinc on age-related macular degeneration: AREDS report no. 35. Ophthalmology 2013, 120, 1604–1611. [Google Scholar] [CrossRef] [PubMed] [Green Version]
- King, J.C.; Shames, D.M.; Woodhouse, L.R. Zinc homeostasis in humans. J. Nutr. 2000, 130, 1360S–1366S. [Google Scholar] [CrossRef] [PubMed] [Green Version]
- Gonzalez-Iglesias, H.; Alvarez, L.; García, M.; Petrash, C.; Sanz-Medel, A.; Coca-Prados, M. Metallothioneins (MTs) in the human eye: A perspective article on the zinc-MT redox cycle. Metallomics 2014, 6, 201–208. [Google Scholar] [CrossRef] [PubMed]
- Rodríguez-Menéndez, S.; García, M.; Fernández, B.; Álvarez, L.; Fernández-Vega-Cueto, A.; Coca-Prados, M.; Pereiro, R.; González-Iglesias, H. The zinc-metallothionein redox system reduces oxidative stress in retinal pigment epithelial cells. Nutrients 2018, 10, 1874. [Google Scholar] [CrossRef] [Green Version]
- Tate, D.J.; Newsome, D.A. A novel zinc compound (zinc monocysteine) enhances the antioxidant capacity of human retinal pigment epithelial cells. Curr. Eye Res. 2006, 31, 675–683. [Google Scholar] [CrossRef]
- Parat, M.O.; Richard, M.J.; Béani, J.C.; Favier, A. Involvement of zinc in intracellular oxidant/antioxidant balance. Biol. Trace Elem. Res. 1997, 60, 187–204. [Google Scholar] [CrossRef]
- Nakatani, T.; Tawaramoto, M.; Opare Kennedy, D.; Kojima, A.; Matsui-Yuasa, I. Apoptosis induced by chelation of intracellular zinc is associated with depletion of cellular reduced glutathione level in rat hepatocytes. Chem. Biol. Interact. 2000, 125, 151–163. [Google Scholar] [CrossRef]
- Bray, T.M.; Bettger, W.J. The physiological role of zinc as an antioxidant. Free Radic. Biol. Med. 1990, 8, 281–291. [Google Scholar] [CrossRef]
- Jarosz, M.; Olbert, M.; Wyszogrodzka, G.; Młyniec, K.; Librowski, T. Antioxidant and anti-inflammatory effects of zinc. Zinc-dependent NF-κB signaling. Inflammopharmacology 2017, 25, 11–24. [Google Scholar] [CrossRef] [Green Version]
- Oteiza, P.I. Zinc and the modulation of redox homeostasis. Free Radic. Biol. Med. 2012, 53, 1748–1759. [Google Scholar] [CrossRef] [Green Version]
- Vishwanathan, R.; Chung, M.; Johnson, E.J. A systematic review on zinc for the prevention and treatment of age-related macular degeneration. Investig. Ophthalmol. Vis. Sci. 2013, 54, 3985–3998. [Google Scholar] [CrossRef] [PubMed]
- Agron, E.; Mares, J.A.; Clemons, T.E.; Swaroop, A.; Chew, E.Y.; Keenan, T.D.L. AREDS and AREDS2 Research Groups. Dietary nutrient intake and progression to late age-related macular degeneration in the Age-Related Eye Disease studies 1 and 2. Ophthalmology 2020. [Google Scholar] [CrossRef] [PubMed]
- Thompson, R.B.; Reffatto, V.; Bundy, J.G.; Kortvely, E.; Flinn, J.M.; Lanzirotti, A.; Jones, E.A.; McPhail, D.S.; Fearn, S.; Boldt, K.; et al. Identification of hydroxyapatite spherules provides new insight into subretinal pigment epithelial deposit formation in the aging eye. Proc. Natl. Acad. Sci. USA 2015, 112, 1565–1570. [Google Scholar] [CrossRef] [PubMed] [Green Version]
- Zorlu, Y.; Brown, C.; Keil, C.; Ayhan, M.M.; Haase, H.; Thompson, R.B.; Lengyel, I.; Yücesan, G. Fluorescent arylphosphonic acids: Synergic interactions between bone and the fluorescent core. Chemistry 2020. [Google Scholar] [CrossRef] [PubMed]
- Szmacinski, H.; Hegde, K.; Zeng, H.H.; Eslami, K.; Puche, A.C.; Lengyel, I.; Thompson, R.B. Imaging hydroxyapatite in sub-retinal pigment epithelial deposits by fluorescence lifetime imaging microscopy with tetracycline staining. J. Biomed. Opt. 2020, 25, 1–11. [Google Scholar] [CrossRef] [PubMed] [Green Version]
- Bennis, A.; Jacobs, J.G.; Catsburg, L.A.E.; Ten Brink, J.B.; Koster, C.; Schlingemann, R.O.; Van Meurs, J.; Gorgels, T.; Moerland, P.D.; Heine, V.M.; et al. Stem cell derived retinal pigment epithelium: The role of pigmentation as maturation marker and gene expression profile comparison with human endogenous retinal pigment epithelium. Stem Cell Rev. Rep. 2017, 13, 659–669. [Google Scholar] [CrossRef] [PubMed] [Green Version]
- Balaratnasingam, C.; Yannuzzi, L.A.; Curcio, C.A.; Morgan, W.H.; Querques, G.; Capuano, V.; Souied, E.; Jung, J.; Freund, K.B. Associations between retinal pigment epithelium and drusen volume changes during the lifecycle of large drusenoid pigment epithelial detachments. Investig. Ophthalmol. Vis. Sci. 2016, 57, 5479–5489. [Google Scholar] [CrossRef] [PubMed]
- Curcio, C.A.; Zanzottera, E.C.; Ach, T.; Balaratnasingam, C.; Freund, K.B. Activated retinal pigment epithelium, an optical coherence tomography biomarker for progression in age-related macular degeneration. Investig. Ophthalmol. Vis. Sci. 2017, 58, BIO211–BIO226. [Google Scholar]
- Stojanovic, A.; Stitham, J.; Hwa, J. Critical role of transmembrane segment zinc binding in the structure and function of rhodopsin. J. Biol. Chem. 2004, 279, 35932–35941. [Google Scholar] [CrossRef] [PubMed] [Green Version]
- Gleim, S.; Stojanovic, A.; Arehart, E.; Byington, D.; Hwa, J. Conserved rhodopsin intradiscal structural motifs mediate stabilization: Effects of zinc. Biochemistry 2009, 48, 1793–1800. [Google Scholar] [CrossRef] [PubMed] [Green Version]
- Toledo, D.; Cordomi, A.; Proietti, M.G.; Benfatto, M.; Del Valle, L.J.; Perez, J.J.; Garriga, P.; Sepulcre, F. Structural characterization of a zinc high-affinity binding site in rhodopsin. Photochem. Photobiol. 2009, 85, 479–484. [Google Scholar] [CrossRef] [PubMed]
- Galin, M.A.; Nano, H.D.; Hall, T. Ocular zinc concentration. Investig. Ophthalmol. 1962, 1, 142–148. [Google Scholar]
- Leung, K.W.; Liu, M.; Xu, X.; Seiler, M.J.; Barnstable, C.J.; Tombran-Tink, J. Expression of ZnT and ZIP zinc transporters in the human RPE and their regulation by neurotrophic factors. Investig. Ophthalmol. Vis. Sci. 2008, 49, 1221–1231. [Google Scholar] [CrossRef]
- Leung, K.W.; Gvritishvili, A.; Liu, Y.; Tombran-Tink, J. ZIP2 and ZIP4 mediate age-related zinc fluxes across the retinal pigment epithelium. J. Mol. Neurosci. 2012, 46, 122–137. [Google Scholar] [CrossRef]
- Redenti, S.; Chappell, R.L. Müller cell zinc transporter-3 labeling suggests a role in outer retina zinc homeostasis. Mol. Med. 2007, 13, 376–379. [Google Scholar] [CrossRef]
- Ugarte, M.; Osborne, N.N. The localization of free zinc varies in rat photoreceptors during light and dark adaptation. Exp. Eye Res. 1999, 69, 459–461. [Google Scholar] [CrossRef] [PubMed]
- Hirayama, Y. Histochemical localization of zinc and copper in rat ocular tissues. Acta Histochem. 1990, 89, 107–111. [Google Scholar] [CrossRef]
- Pålsgård, E.; Ugarte, M.; Rajta, I.; Grime, G.W. The role of zinc in the dark-adapted retina studied directly using microPIXE. In Beam Interactions with Materials and Atoms, Proceedings of the 7th International Conference on Nuclear Microprobe Technology and Applications, Bordeaux, France, 10–15 September 2000; Elsevier: Amsterdam, The Netherlands, 2001; Volume 181, pp. 489–492. [Google Scholar] [CrossRef]
- Olsson, J.E.; Gordon, J.W.; Pawlyk, B.S.; Roof, D.; Hayes, A.; Molday, R.S.; Mukai, S.; Cowley, G.S.; Berson, E.L.; Dryja, T.P. Transgenic mice with a rhodopsin mutation (Pro23His): A mouse model of autosomal dominant retinitis pigmentosa. Neuron 1992, 9, 815–830. [Google Scholar] [CrossRef]
- Zhao, C.; Yasumura, D.; Li, X.; Matthes, M.; Lloyd, M.; Nielsen, G.; Ahern, K.; Snyder, M.; Bok, D.; Dunaief, J.L.; et al. mTOR-mediated dedifferentiation of the retinal pigment epithelium initiates photoreceptor degeneration in mice. J. Clin. Investig. 2011, 121, 369–383. [Google Scholar] [CrossRef] [Green Version]
- Gammoh, N.Z.; Rink, L. Zinc in Infection and inflammation. Nutrients 2017, 9, 624. [Google Scholar] [CrossRef] [Green Version]
- Anderson, D.H.; Mullins, R.F.; Hageman, G.S.; Johnson, L.V. A role for local inflammation in the formation of drusen in the aging eye. Am. J. Ophthalmol. 2002, 134, 411–431. [Google Scholar] [CrossRef]
- Gehrs, K.M.; Jackson, J.R.; Brown, E.N.; Allikmets, R.; Hageman, G.S. Complement, age-related macular degeneration and a vision of the future. Arch. Ophthalmol. 2010, 128, 349–358. [Google Scholar] [CrossRef] [PubMed] [Green Version]
- Hageman, G.S.; Luthert, P.J.; Victor Chong, N.H.; Johnson, L.V.; Anderson, D.H.; Mullins, R.F. An integrated hypothesis that considers drusen as biomarkers of immune-mediated processes at the RPE-Bruch’s membrane interface in aging and age-related macular degeneration. Progr. Retin. Eye Res. 2001, 20, 705–732. [Google Scholar] [CrossRef]
- Van Leeuwen, E.M.; Emri, E.; Merle, B.M.J.; Colijn, J.M.; Kersten, E.; Cougnard-Gregoire, A.; Dammeier, S.; Meester-Smoor, M.; Pool, F.M.; De Jong, E.K.; et al. A new perspective on lipid research in age-related macular degeneration. Progr. Retin. Eye Res. 2018, 67, 56–86. [Google Scholar] [CrossRef]
- Smailhodzic, D.; Van Asten, F.; Blom, A.M.; Mohlin, F.C.; Den Hollander, A.I.; Van de Ven, J.P.; Van Huet, R.A.; Groenewoud, J.M.; Tian, Y.; Berendschot, T.T.; et al. Zinc supplementation inhibits complement activation in age-related macular degeneration. PLoS ONE 2014, 9, e112682. [Google Scholar] [CrossRef] [Green Version]
- Awh, C.C.; Hawken, S.; Zanke, B.W. Treatment response to antioxidants and zinc based on CFH and ARMS2 genetic risk allele number in the Age-Related Eye Disease Study. Ophthalmology 2015, 122, 162–169. [Google Scholar] [CrossRef] [PubMed]
- Chew, E.Y.; Klein, M.L.; Clemons, T.E.; Agrón, E.; Ratnapriya, R.; Edwards, A.O.; Fritsche, L.G.; Swaroop, A.; Abecasis, G.R. No clinically significant association between CFH and ARMS2 genotypes and response to nutritional supplements: AREDS report number 38. Ophthalmology 2014, 121, 2173–2180. [Google Scholar] [CrossRef] [Green Version]
- Ma, W.; Silverman, S.M.; Zhao, L.; Villasmil, R.; Campos, M.M.; Amaral, J.; Wong, W.T. Absence of TGFβ signaling in retinal microglia induces retinal degeneration and exacerbates choroidal neovascularization. Elife 2019, 8, e42049. [Google Scholar] [CrossRef]
- Yang, X.; Zhao, L.; Campos, M.M.; Abu-Asab, M.; Ortolan, D.; Hotaling, N.; Bharti, K.; Wong, W.T. CSF1R blockade induces macrophage ablation and results in mouse choroidal vascular atrophy and RPE disorganization. Elife 2020, 9, e55564. [Google Scholar] [CrossRef]
- Tosi, G.M.; Orlandini, M.; Galvagni, F. The Controversial Role of TGF-β in Neovascular age-related macular degeneration pathogenesis. Int. J. Mol. Sci. 2018, 19, 3363. [Google Scholar] [CrossRef] [Green Version]
- Tanihara, H.; Yoshida, M.; Matsumoto, M.; Yoshimura, N. Identification of transforming growth factor-beta expressed in cultured human retinal pigment epithelial cells. Investig. Ophthalmol. Vis. Sci. 1993, 34, 413–419. [Google Scholar]
- Pérez-Sala, D.; Oeste, C.L.; Martínez, A.E.; Carrasco, M.J.; Garzón, B.; Cañada, F.J. Vimentin filament organization and stress sensing depend on its single cysteine residue and zinc binding. Nat. Commun. 2015, 6, 7287. [Google Scholar] [CrossRef] [Green Version]
- Ghosh, S.; Shang, P.; Terasaki, H.; Stepicheva, N.; Hose, S.; Yazdankhah, M.; Weiss, J.; Sakamoto, T.; Bhutto, I.A.; Xia, S.; et al. A role for βA3/A1-crystallin in type 2 EMT of RPE cells occurring in dry age-related macular degeneration. Investig. Ophthalmol. Vis. Sci. 2018, 59, AMD104–AMD113. [Google Scholar] [CrossRef] [PubMed] [Green Version]
- Guidry, C.; Medeiros, N.E.; Curcio, C.A. Phenotypic variation of retinal pigment epithelium in age-related macular degeneration. Investig. Ophthalmol. Vis. Sci. 2002, 43, 267–273. [Google Scholar]
- Sethi, C.S.; Bailey, T.A.; Luthert, P.J.; Chong, N.H. Matrix metalloproteinase biology applied to vitreoretinal disorders. Br. J. Ophthalmol. 2000, 84, 654–666. [Google Scholar] [CrossRef] [Green Version]
- Guo, L.; Hussain, A.A.; Limb, G.A.; Marshall, J. Age-dependent variation in metalloproteinase activity of isolated human Bruch’s membrane and choroid. Investig. Ophthalmol. Vis. Sci. 1999, 40, 2676–2682. [Google Scholar]
- Steen, B.; Sejersen, S.; Berglin, L.; Seregard, S.; Kvanta, A. Matrix metalloproteinases and metalloproteinase inhibitors in choroidal neovascular membranes. Investig. Ophthalmol. Vis. Sci. 1998, 39, 2194–2200. [Google Scholar]
- Nita, M.; Strzałka-Mrozik, B.; Grzybowski, A.; Mazurek, U.; Romaniuk, W. Age-related macular degeneration and changes in the extracellular matrix. Med. Sci. Monit. 2014, 20, 1003–1016. [Google Scholar]
- Lazzarini, R.; Nicolai, M.; Pirani, V.; Mariotti, C.; Di Primio, R. Effects of senescent secretory phenotype acquisition on human retinal pigment epithelial stem cells. Aging (Albany N.Y.) 2018, 10, 3173–3184. [Google Scholar] [CrossRef]
- Jiang, C.; Xie, P.; Sun, R.; Sun, X.; Liu, G.; Ding, S.; Zhu, M.; Yan, B.; Liu, Q.; Chen, X.; et al. c-Jun-mediated microRNA-302d-3p induces RPE dedifferentiation by targeting p21(Waf1/Cip1). Cell Death Dis. 2018, 9, 451. [Google Scholar] [CrossRef] [Green Version]
- Strnad, P.; McElvaney, N.G.; Lomas, D.A. Alpha(1)-Antitrypsin Deficiency. N. Engl. J. Med. 2020, 382, 1443–1455. [Google Scholar] [CrossRef] [PubMed]
- Crabb, J.W.; Miyagi, M.; Gu, X.; Shadrach, K.; West, K.A.; Sakaguchi, H.; Kamei, M.; Hasan, A.; Yan, L.; Rayborn, M.E.; et al. Drusen proteome analysis: An approach to the etiology of age-related macular degeneration. Proc. Natl. Acad. Sci. USA 2002, 99, 14682–14687. [Google Scholar] [CrossRef] [PubMed] [Green Version]
- Koss, M.J.; Hoffmann, J.; Nguyen, N.; Pfister, M.; Mischak, H.; Mullen, W.; Husi, H.; Rejdak, R.; Koch, F.; Jankowski, J.; et al. Proteomics of vitreous humor of patients with exudative age-related macular degeneration. PLoS ONE 2014, 9, e96895. [Google Scholar] [CrossRef] [PubMed]
- Szemraj, M.; Oszajca, K.; Szemraj, J.; Jurowski, P. MicroRNA Expression analysis in serum of patients with congenital hemochromatosis and age-related macular degeneration (AMD). Med. Sci. Monit. 2017, 23, 4050–4060. [Google Scholar] [CrossRef] [PubMed] [Green Version]
- Blasiak, J.; Watala, C.; Tuuminen, R.; Kivinen, N.; Koskela, A.; Uusitalo-Jarvinen, H.; Tuulonen, A.; Winiarczyk, M.; Mackiewicz, J.; Zmorzynski, S.; et al. Expression of VEGFA-regulating miRNAs and mortality in wet AMD. J. Cell. Mol. Med. 2019, 23, 8464–8471. [Google Scholar] [CrossRef] [PubMed] [Green Version]
- Gotte, M.; Mohr, C.; Koo, C.Y.; Stock, C.; Vaske, A.K.; Viola, M.; Ibrahim, S.A.; Peddibhotla, S.; Teng, Y.H.; Low, J.Y.; et al. miR-145-dependent targeting of junctional adhesion molecule A and modulation of fascin expression are associated with reduced breast cancer cell motility and invasiveness. Oncogene 2010, 29, 6569–6580. [Google Scholar] [CrossRef] [Green Version]
- Cho, Y.; Cao, X.; Shen, D.; Tuo, J.; Parver, L.M.; Rickles, F.R.; Chan, C.C. Evidence for enhanced tissue factor expression in age-related macular degeneration. Lab. Investig. 2011, 91, 519–526. [Google Scholar] [CrossRef]
- Hu, Z.; Cheng, J.; Xu, J.; Ruf, W.; Lockwood, C.J. Tissue factor is an angiogenic-specific receptor for factor VII-targeted immunotherapy and photodynamic therapy. Angiogenesis 2017, 20, 85–96. [Google Scholar] [CrossRef] [Green Version]
- Dunaief, J.L.; Dentchev, T.; Ying, G.S.; Milam, A.H. The role of apoptosis in age-related macular degeneration. Arch. Ophthalmol. 2002, 120, 1435–1442. [Google Scholar] [CrossRef] [Green Version]
- Tasharrofi, N.; Kouhkan, F.; Soleimani, M.; Soheili, Z.S.; Kabiri, M.; Mahmoudi Saber, M.; Dorkoosh, F.A. Survival improvement in human retinal pigment epithelial cells via fas receptor targeting by miR-374a. J. Cell. Biochem. 2017, 118, 4854–4861. [Google Scholar] [CrossRef]


| Zinc Apical Supplementation | Zinc Basal Supplementation | ||||||
|---|---|---|---|---|---|---|---|
| Category/Term | Count | p-Value | Benjamini–Hochberg | Term | Count | p-Value | Benjamini–Hochberg |
| Biological process | Biological process | ||||||
| GO:0030049~muscle filament sliding | 12 | 0 | 0.003 | GO:0030198~extracellular matrix organization | 14 | 0 | 0.0735 |
| GO:0051603~proteolysis involved in cellular protein catabolic process | 13 | 0 | 0.0027 | GO:0030334~regulation of cell migration | 9 | 0 | 0.0386 |
| GO:0001501~skeletal system development | 21 | 0 | 0.0075 | GO:0033627~cell adhesion mediated by integrin | 5 | 0.0001 | 0.0617 |
| GO:0030198~extracellular matrix organization | 25 | 0 | 0.0153 | GO:2000427~positive regulation of apoptotic cell clearance | 4 | 0.0002 | 0.0752 |
| GO:0090090~negative regulation of canonical Wnt signaling pathway | 22 | 0 | 0.0187 | GO:0051603~proteolysis involved in cellular protein catabolic process | 7 | 0.0002 | 0.0621 |
| Cellular component | Cellular component | ||||||
| GO:0070062~extracellular exosome | 232 | 0 | 0 | GO:0070062~extracellular exosome | 120 | 0 | 0 |
| GO:0031012~extracellular matrix | 48 | 0 | 0 | GO:0031012~extracellular matrix | 29 | 0 | 0 |
| GO:0005615~extracellular space | 119 | 0 | 0 | GO:0005615~extracellular space | 60 | 0 | 0 |
| GO:0005925~focal adhesion | 49 | 0 | 0 | GO:0005925~focal adhesion | 28 | 0 | 0 |
| GO:0005578~proteinaceous extracellular matrix | 38 | 0 | 0 | GO:0043209~myelin sheath | 17 | 0 | 0 |
| Molecular function | Molecular function | ||||||
| GO:0003779~actin binding | 33 | 0 | 0.0021 | GO:0005178~integrin binding | 11 | 0 | 0.0075 |
| GO:0005509~calcium ion binding | 61 | 0 | 0.0034 | GO:0001948~glycoprotein binding | 8 | 0.0001 | 0.0326 |
| GO:0001948~glycoprotein binding | 14 | 0 | 0.0024 | GO:0098641~cadherin binding involved in cell-cell adhesion | 16 | 0.0002 | 0.0306 |
| GO:0005200~structural constituent of cytoskeleton | 16 | 0.0002 | 0.04 | GO:0004298~threonine-type endopeptidase activity | 5 | 0.0004 | 0.051 |
| GO:0008083~growth factor activity | 20 | 0.0002 | 0.036 | GO:0051015~actin filament binding | 10 | 0.0005 | 0.0499 |
| INTERPRO domain | INTERPRO domain | ||||||
| IPR013098:Immunoglobulin I-set | 25 | 0 | 0 | IPR001781:Zinc finger, LIM type | 8 | 0.0002 | 0.1089 |
| IPR009030:Insulin-like growth factor binding protein, N-terminal | 20 | 0 | 0.0125 | IPR001353:Proteasome, subunit alpha/beta | 5 | 0.0002 | 0.0731 |
| IPR000867:Insulin-like growth factor-binding protein, IGFBP | 8 | 0 | 0.0086 | IPR003096:Smooth muscle protein/calponin | 4 | 0.0006 | 0.1373 |
| IPR024079:Metallopeptidase, catalytic domain | 14 | 0.0001 | 0.0246 | IPR016050:Proteasome, beta-type subunit, conserved site | 4 | 0.0008 | 0.1358 |
| IPR001353:Proteasome, subunit alpha/beta | 7 | 0.0001 | 0.0401 | IPR024079:Metallopeptidase, catalytic domain | 7 | 0.002 | 0.2475 |
| KEGG_PATHWAY | KEGG_PATHWAY | ||||||
| hsa04978:Mineral absorption | 12 | 0 | 0.0038 | hsa04141:Protein processing in endoplasmic reticulum | 12 | 0.0008 | 0.1423 |
| hsa04145:Phagosome | 20 | 0.0004 | 0.0526 | hsa04145:Phagosome | 11 | 0.0012 | 0.1044 |
| hsa04350:TGF-beta signaling pathway | 12 | 0.0053 | 0.3585 | hsa04978:Mineral absorption | 6 | 0.0022 | 0.1251 |
| hsa03050:Proteasome | 8 | 0.0086 | 0.4214 | hsa05410:Hypertrophic cardiomyopathy (HCM) | 7 | 0.0058 | 0.2364 |
| hsa04670:Leukocyte transendothelial migration | 14 | 0.0089 | 0.3623 | hsa05414:Dilated cardiomyopathy | 7 | 0.0083 | 0.2655 |
| Zinc Apical Supplementation | Zinc Basal Supplementation | ||||
|---|---|---|---|---|---|
| Canonical Pathways | p-value | Overlap | Canonical Pathways | p-value | Overlap |
| ILK Signaling | 6.00 × 10⁷ | 13.5% 25/185 | Huntington’s Disease Signaling | 4.48 × 10⁶ | 6.4% 15/234 |
| Axonal Guidance Signaling | 1.80 × 10⁶ | 9.4% 44/467 | Unfolded Protein Response | 2.27 × 10⁵ | 12.7% 7/55 |
| Hepatic Fibrosis/Hepatic Stellate Cell Activation | 5.33 × 10⁶ | 12.6% 23/182 | Epithelial Adherens Junction Signaling | 1.28 × 10⁴ | 6.7% 10/150 |
| Epithelial Adherens Junction Signaling | 5.33 × 10⁶ | 13.3% 20/150 | Antigen Presentation Pathway | 2.97 × 10⁴ | 13.2% 5/38 |
| Actin Cytoskeleton Signaling | 2.38 × 10⁵ | 11.3% 24/213 | Protein Ubiquitination Pathway | 3.25 × 10⁴ | 4.9% 13/268 |
| Upstream Regulators | p-value | Predicted activation | Upstream Regulators | p-value | Predicted Activation |
| IgG | 1.17 × 10⁸ | MRTFB | 5.96 × 10⁷ | ||
| FSH | 1.06 × 10⁶ | TP63 | 1.88 × 10⁶ | ||
| MRTFB | 3.47 × 10⁶ | Activated | FSH | 2.66 × 10⁶ | |
| TEAD1 | 3.65 × 10⁶ | TEAD2 | 2.39 × 10⁵ | ||
| TEAD4 | 3.65 × 10⁶ | TEAD3 | 2.79 × 10⁵ | ||
| Diseases and Disorders | p-value range | # Molecules | Diseases and Disorders | p-value range | # Molecules |
| Neurological Disease | 7.89 × 10⁴–4.57 × 10¹⁸ | 315 | Endocrine System Disorders | 6.67 × 10⁴–1.30 × 10¹¹ | 235 |
| Cancer | 7.89 × 10⁴–4.69 × 10¹⁵ | 862 | Organismal Injury and Abnormalities | 7.23 × 10⁴–1.30 × 10¹¹ | 312 |
| Organismal Injury and Abnormalities | 7.89 × 10⁴–4.69 × 10¹⁵ | 873 | Hereditary Disorder | 7.23 × 10⁴–1.58 × 10¹⁰ | 95 |
| Gastrointestinal Disease | 7.70 × 10⁴–9.48 × 10¹⁴ | 774 | Neurological Disease | 6.61 × 10⁴–1.58 × 10¹⁰ | 102 |
| Cardiovascular Disease | 6.50 × 10⁴–3.14 × 10¹³ | 203 | Skeletal and Muscular Disorders | 7.23 × 10⁴–1.58 × 10¹⁰ | 116 |
| Molecular and Cellular Functions | p-value range | # Molecules | Molecular and Cellular Functions | p-value range | # Molecules |
| Cellular Movement | 4.19 × 10⁴–7.88 × 10¹⁹ | 189 | Cellular Movement | 2.47 × 10⁴–1.06 × 10⁹ | 64 |
| Molecular Transport | 7.25 × 10⁴–6.55 × 10⁹ | 108 | Protein Synthesis | 1.31 × 10⁶–6.82 × 10⁸ | 40 |
| Cellular Assembly and Organization | 5.34 × 10⁴–3.26 × 10⁸ | 105 | Cellular Compromise | 7.45 × 10⁶–2.64 × 10⁷ | 29 |
| Protein Synthesis | 1.12 × 10⁵–4.12 × 10⁷ | 81 | Molecular Transport | 5.71 × 10⁴–2.64 × 10⁷ | 44 |
| Cell Death and Survival | 6.87 × 10⁴–9.45 × 10⁷ | 132 | Cell Death and Survival | 4.86 × 10⁴–3.59 × 10⁷ | 58 |
| Physiological System Development and Function | p-value range | Physiological System Development and Function | p-value range | # Molecules | |
| Cardiovascular System Development and Function | 6.97 × 10⁴–2.19 × 10¹⁰ | 94 | Cardiovascular System Development and Function | 1.58 × 10⁴–1.74 × 10⁷ | 42 |
| Organismal Development | 6.97 × 10⁴–2.19 × 10¹⁰ | 118 | Organismal Development | 5.68 × 10⁴–1.74 × 10⁷ | 41 |
| Tissue Development | 6.97 × 10⁴–4.23 × 10⁷ | 132 | Organ Morphology | 1.20 × 10⁴–6.53 × 10⁷ | 9 |
| Skeletal and Muscular System Development and Function | 5.80 × 10⁴–4.99 × 10⁶ | 31 | Tissue Development | 5.68 × 10⁴–2.49 × 10⁴ | 26 |
| Tissue Morphology | 1.93 × 10⁵–1.93 × 10⁵ | 12 | Connective Tissue Development and Function | 5.68 × 10⁴–2.84 × 10⁴ | 19 |
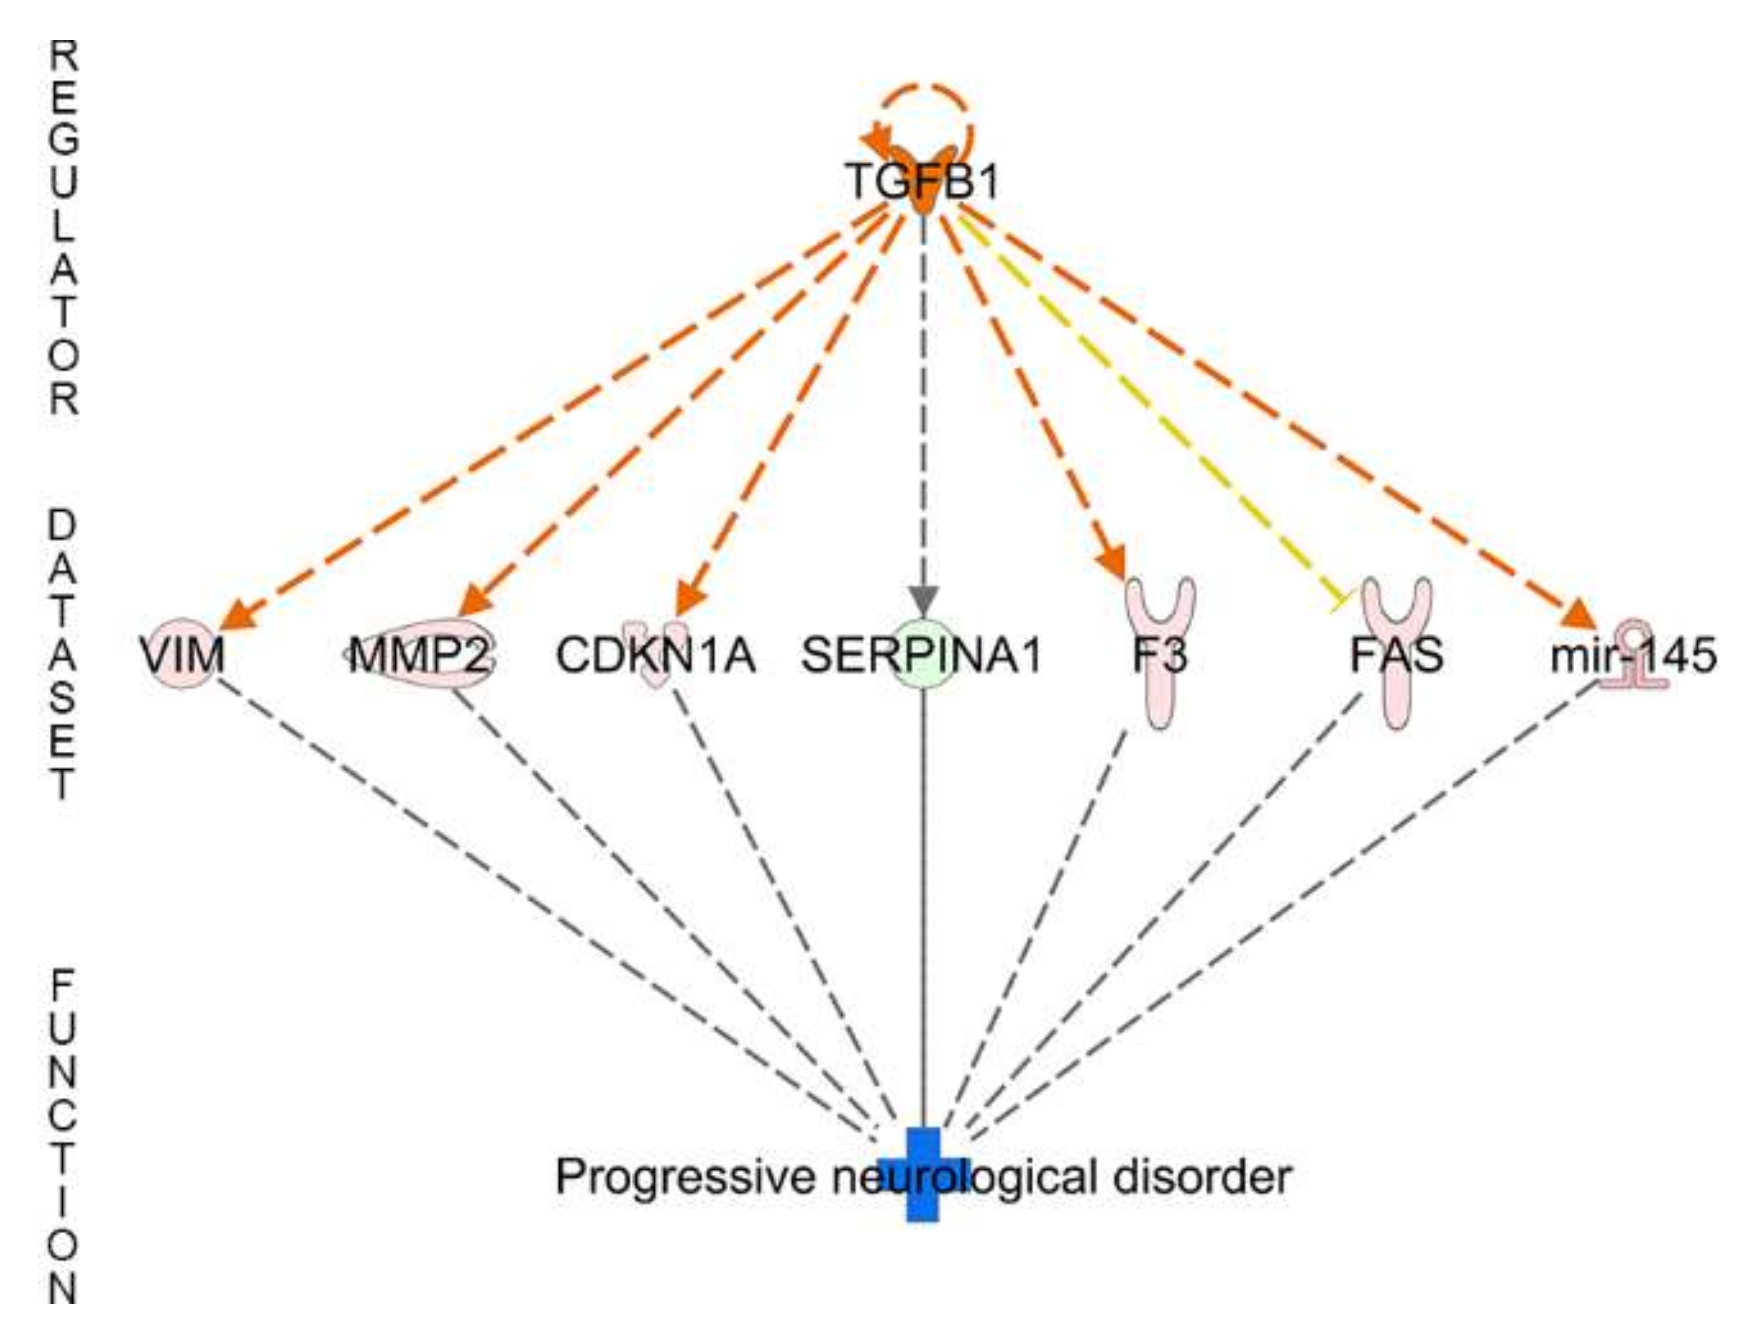
| Regulator Effect Networks | Disease and Functions | Consistency Score | Regulator Effect Networks | disease and functions | Consistency Score |
| TGFB1 | Progressive neurological disorder | 0 | - | ||
| Networks | Score | Networks | Score | ||
| Cellular Movement, Immune Cell Trafficking | 33 | Amino Acid Metabolism, Post-Translational Modification, Small Molecule Biochemistry | 41 | ||
| Cell Cycle, Cellular Development | 33 | Cellular Movement, Cell Death and Survival, Cell-To-Cell Signaling and Interaction | 37 | ||
| Cell Death and Survival, Molecular Transport | 31 | Cardiovascular System Development and Function, Organ Development, Organ Morphology | 32 | ||
| Cancer, Organismal Injury and Abnormalities, Reproductive System Disease | 31 | Cellular Movement, Cell-To-Cell Signaling and Interaction | 18 | ||
| Cellular Development, Cellular Growth and Proliferation | 27 | Endocrine System Disorders, Gastrointestinal Disease, Metabolic Disease | 16 | ||
© 2020 by the authors. Licensee MDPI, Basel, Switzerland. This article is an open access article distributed under the terms and conditions of the Creative Commons Attribution (CC BY) license (http://creativecommons.org/licenses/by/4.0/).
Share and Cite
Emri, E.; Kortvely, E.; Dammeier, S.; Klose, F.; Simpson, D.; Consortium, E.-R.; den Hollander, A.I.; Ueffing, M.; Lengyel, I. A Multi-Omics Approach Identifies Key Regulatory Pathways Induced by Long-Term Zinc Supplementation in Human Primary Retinal Pigment Epithelium. Nutrients 2020, 12, 3051. https://0-doi-org.brum.beds.ac.uk/10.3390/nu12103051
Emri E, Kortvely E, Dammeier S, Klose F, Simpson D, Consortium E-R, den Hollander AI, Ueffing M, Lengyel I. A Multi-Omics Approach Identifies Key Regulatory Pathways Induced by Long-Term Zinc Supplementation in Human Primary Retinal Pigment Epithelium. Nutrients. 2020; 12(10):3051. https://0-doi-org.brum.beds.ac.uk/10.3390/nu12103051
Chicago/Turabian StyleEmri, Eszter, Elod Kortvely, Sascha Dammeier, Franziska Klose, David Simpson, EYE-RISK Consortium, Anneke I. den Hollander, Marius Ueffing, and Imre Lengyel. 2020. "A Multi-Omics Approach Identifies Key Regulatory Pathways Induced by Long-Term Zinc Supplementation in Human Primary Retinal Pigment Epithelium" Nutrients 12, no. 10: 3051. https://0-doi-org.brum.beds.ac.uk/10.3390/nu12103051