Characteristic-Grouped Adiposity Indicators for Identifying Metabolic Syndrome in Adolescents: Develop and Valid Risk Screening Tools Using Dual Population

 , , , , , and
Abstract
:1. Introduction
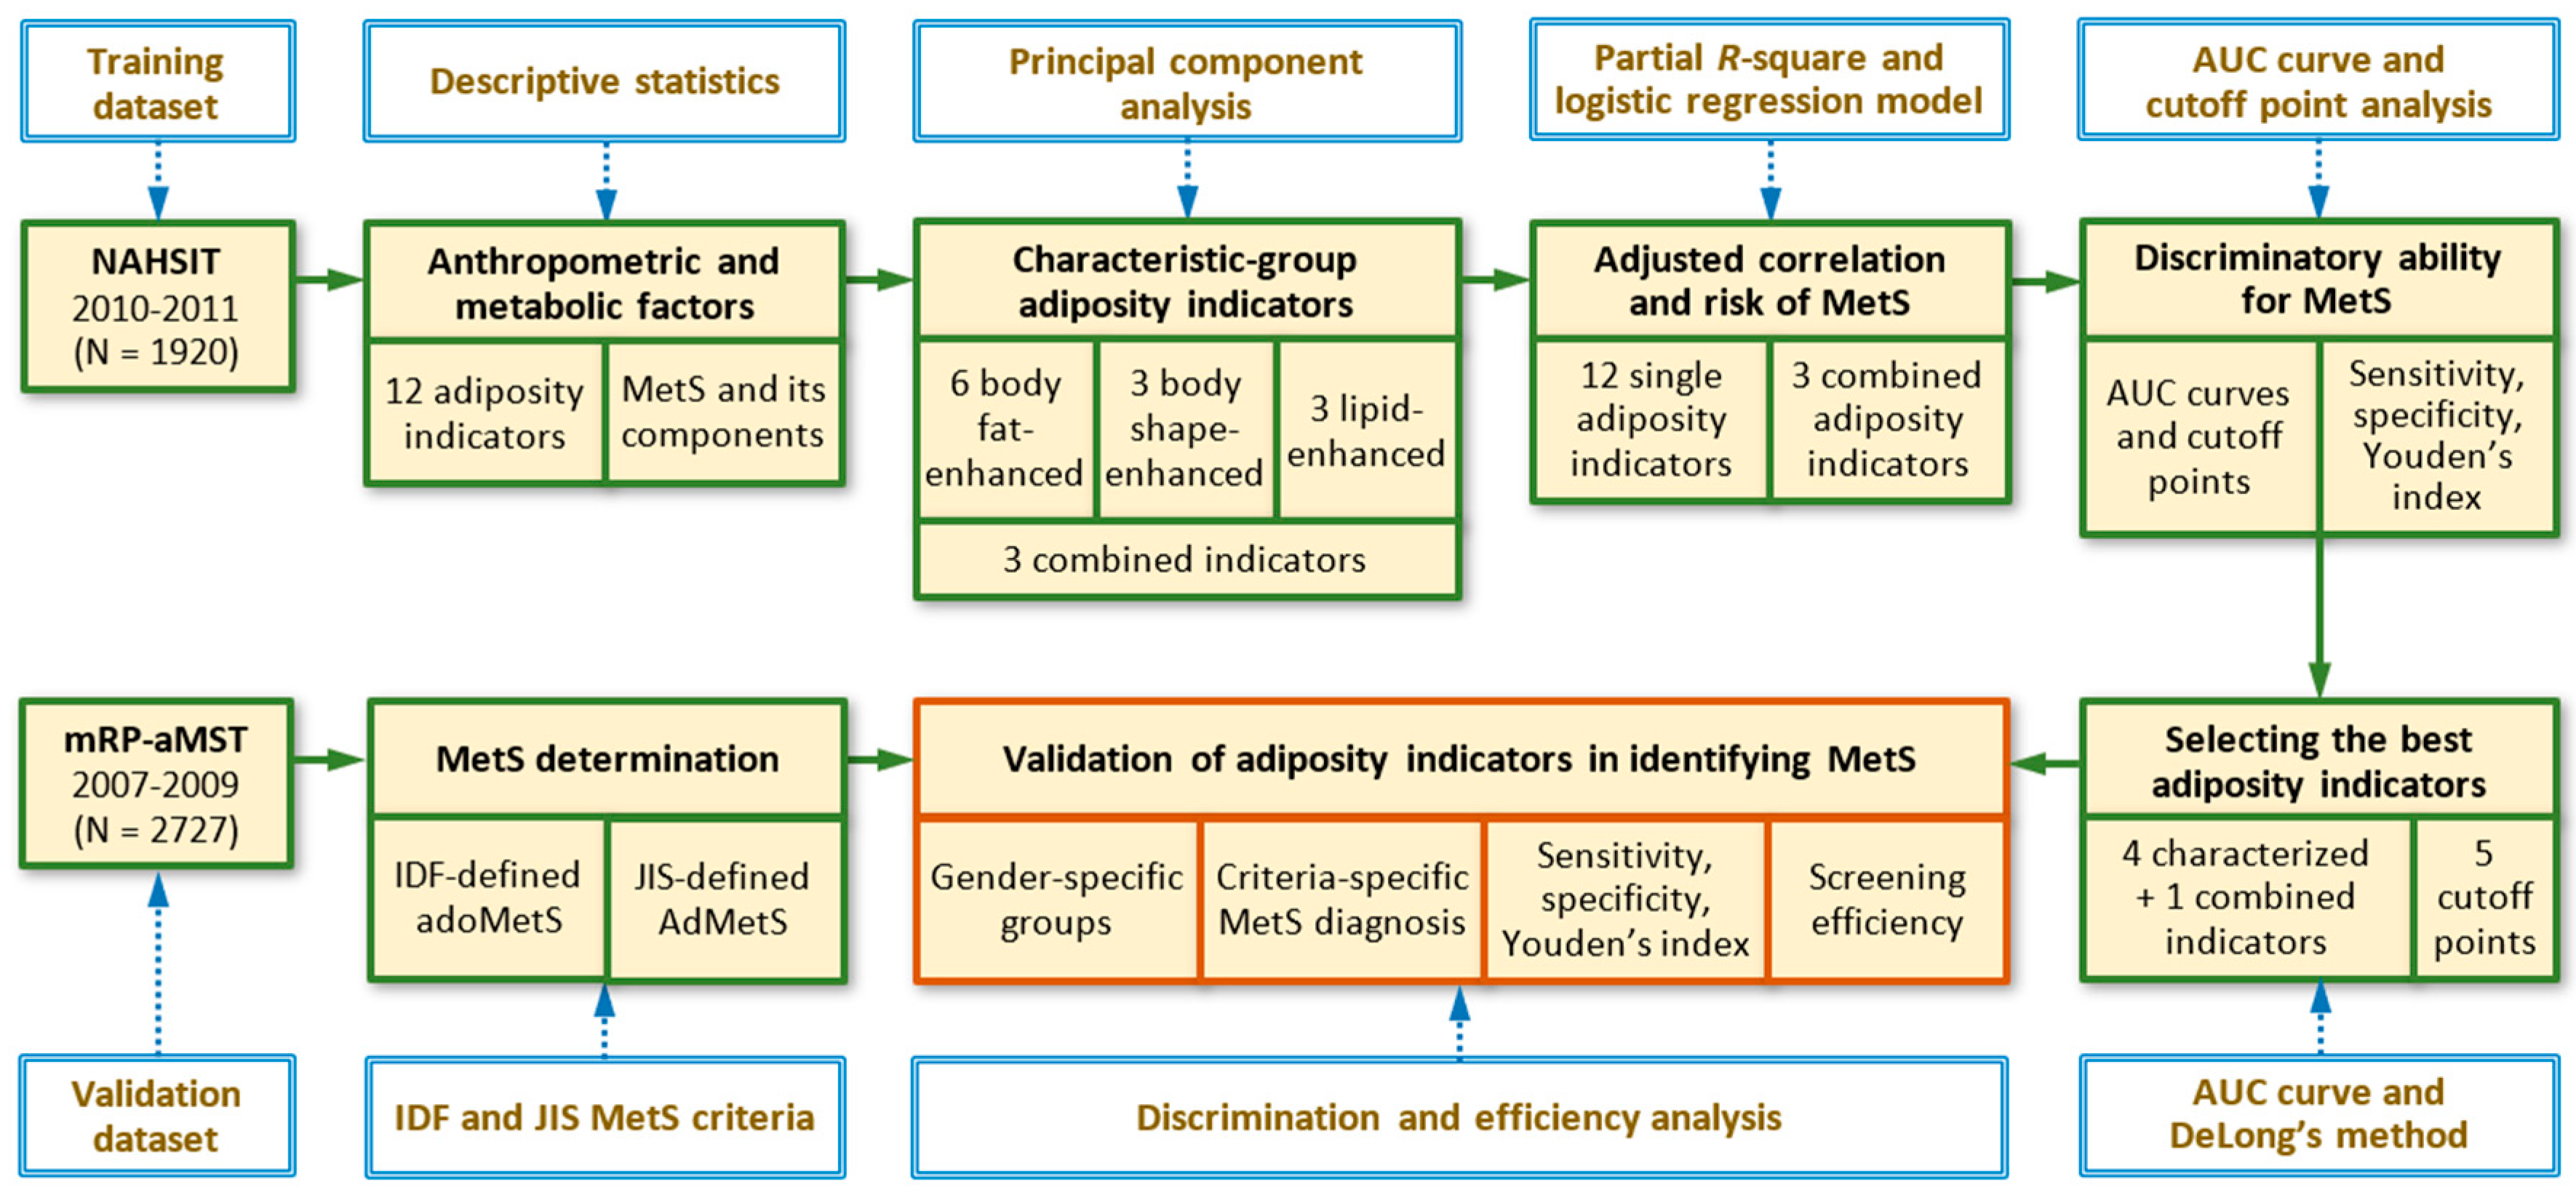
2. Materials and Methods
2.1. Study Participants
2.2. The Adolescent Nutrition and Health Survey in Taiwan (ado-NAHSIT)
2.3. The Multilevel Risk Profiles for Adolescent Metabolic Syndrome (mRP-aMS) Study
2.4. Diagnosis of Metabolic Syndrome
2.5. Single Adiposity Indicators
2.6. Combined Adiposity Indicators
2.7. Statistical Analysis
3. Results
4. Discussion
5. Conclusions
Supplementary Materials
Author Contributions
Funding
Acknowledgments
Conflicts of Interest
Abbreviations
References
- DeBoer, M.D. Assessing and managing the metabolic syndrome in children and adolescents. Nutrients 2019, 11, 1788. [Google Scholar] [CrossRef] [Green Version]
- Morrison, J.A.; Friedman, L.A.; Gray-McGuire, C. Metabolic syndrome in childhood predicts adult cardiovascular disease 25 years later: The Princeton Lipid Research Clinics Follow-up Study. Pediatrics 2007, 120, 340–345. [Google Scholar] [CrossRef]
- Morrison, J.A.; Friedman, L.A.; Wang, P.; Glueck, C.J. Metabolic syndrome in childhood predicts adult metabolic syndrome and type 2 diabetes mellitus 25 to 30 years later. J. Pediatr. 2008, 152, 201–206. [Google Scholar] [CrossRef]
- DeBoer, M.D.; Gurka, M.J.; Woo, J.G.; Morrison, J.A. Severity of metabolic syndrome as a predictor of cardiovascular disease between childhood and adulthood: The Princeton Lipid Research Cohort Study. J. Am. Coll. Cardiol. 2015, 66, 755–757. [Google Scholar] [CrossRef] [Green Version]
- Stanley, T.L.; Chen, M.L.; Goodman, E. The typology of metabolic syndrome in the transition to adulthood. J. Clin. Endocrinol. Metab. 2014, 99, 1044–1052. [Google Scholar] [CrossRef] [Green Version]
- De Larochelliere, E.; Cote, J.; Gilbert, G.; Bibeau, K.; Ross, M.K.; Dion-Roy, V.; Pibarot, P.; Despres, J.P.; Larose, E. Visceral/epicardial adiposity in nonobese and apparently healthy young adults: Association with the cardiometabolic profile. Atherosclerosis 2014, 234, 23–29. [Google Scholar] [CrossRef]
- Bergman, R.N.; Stefanovski, D.; Buchanan, T.A.; Sumner, A.E.; Reynolds, J.C.; Sebring, N.G.; Xiang, A.H.; Watanabe, R.M. A better index of body adiposity. Obesity 2011, 19, 1083–1089. [Google Scholar] [CrossRef]
- Thomas, D.M.; Bredlau, C.; Bosy-Westphal, A.; Mueller, M.; Shen, W.; Gallagher, D.; Maeda, Y.; McDougall, A.; Peterson, C.M.; Ravussin, E.; et al. Relationships between body roundness with body fat and visceral adipose tissue emerging from a new geometrical model. Obesity 2013, 21, 2264–2271. [Google Scholar] [CrossRef] [Green Version]
- Ashwell, M.; Gunn, P.; Gibson, S. Waist-to-height ratio is a better screening tool than waist circumference and BMI for adult cardiometabolic risk factors: Systematic review and meta-analysis. Obes. Rev. 2012, 13, 275–286. [Google Scholar] [CrossRef]
- Ashwell, M.; Mayhew, L.; Richardson, J.; Rickayzen, B. Waist-to-height ratio is more predictive of years of life lost than body mass index. PLoS ONE 2014, 9, e103483. [Google Scholar] [CrossRef] [Green Version]
- Guerrero-Romero, F.; Rodriguez-Moran, M. Abdominal volume index. An anthropometry-based index for estimation of obesity is strongly related to impaired glucose tolerance and type 2 diabetes mellitus. Arch. Med. Res. 2003, 34, 428–432. [Google Scholar] [CrossRef]
- Chadid, S.; Kreger, B.E.; Singer, M.R.; Loring Bradlee, M.; Moore, L.L. Anthropometric measures of body fat and obesity-related cancer risk: Sex-specific differences in Framingham Offspring Study adults. Int. J. Obes. 2020, 44, 601–608. [Google Scholar] [CrossRef] [PubMed]
- Zhu, Q.; Wang, X.B.; Yao, Y.; Ning, C.X.; Chen, X.P.; Luan, F.X.; Zhao, Y.L. Association between anthropometric measures and cardiovascular disease (CVD) risk factors in Hainan centenarians: Investigation based on the Centenarian’s health study. BMC Cardiovasc. Disord. 2018, 18, 73. [Google Scholar] [CrossRef] [PubMed]
- Krakauer, N.Y.; Krakauer, J.C. A new body shape index predicts mortality hazard independently of body mass index. PLoS ONE 2012, 7, e39504. [Google Scholar] [CrossRef]
- Valdez, R. A simple model-based index of abdominal adiposity. J. Clin. Epidemiol. 1991, 44, 955–956. [Google Scholar] [CrossRef]
- Motamed, N.; Perumal, D.; Zamani, F.; Ashrafi, H.; Haghjoo, M.; Saeedian, F.S.; Maadi, M.; Akhavan-Niaki, H.; Rabiee, B.; Asouri, M. Conicity index and waist-to-hip ratio are superior obesity indices in predicting 10-year cardiovascular risk among men and women. Clin. Cardiol. 2015, 38, 527–534. [Google Scholar] [CrossRef]
- Simental-Mendia, L.E.; Rodriguez-Moran, M.; Guerrero-Romero, F. The product of fasting glucose and triglycerides as surrogate for identifying insulin resistance in apparently healthy subjects. Metab. Syndr. Relat. Disord. 2008, 6, 299–304. [Google Scholar] [CrossRef]
- Amato, M.C.; Giordano, C.; Galia, M.; Criscimanna, A.; Vitabile, S.; Midiri, M.; Galluzzo, A.; AlkaMeSy Study, G. Visceral adiposity index: A reliable indicator of visceral fat function associated with cardiometabolic risk. Diabetes Care 2010, 33, 920–922. [Google Scholar] [CrossRef] [Green Version]
- Kahn, H.S. The “lipid accumulation product” performs better than the body mass index for recognizing cardiovascular risk: A population-based comparison. BMC Cardiovasc. Disord. 2005, 5, 26. [Google Scholar] [CrossRef] [Green Version]
- Alberti, K.G.; Eckel, R.H.; Grundy, S.M.; Zimmet, P.Z.; Cleeman, J.I.; Donato, K.A.; Fruchart, J.C.; James, W.P.; Loria, C.M.; Smith, S.C., Jr. Harmonizing the metabolic syndrome: A joint interim statement of the International Diabetes Federation Task Force on Epidemiology and Prevention; National Heart, Lung, and Blood Institute; American Heart Association; World Heart Federation; International Atherosclerosis Society; and International Association for the Study of Obesity. Circulation 2009, 120, 1640–1645. [Google Scholar] [CrossRef] [Green Version]
- Niklowitz, P.; Rothermel, J.; Lass, N.; Barth, A.; Reinehr, T. Link between chemerin, central obesity, and parameters of the Metabolic Syndrome: Findings from a longitudinal study in obese children participating in a lifestyle intervention. Int. J. Obes. 2018, 42, 1743–1752. [Google Scholar] [CrossRef] [PubMed]
- Hsu, F.C.; Kritchevsky, S.B.; Liu, Y.; Kanaya, A.; Newman, A.B.; Perry, S.E.; Visser, M.; Pahor, M.; Harris, T.B.; Nicklas, B.J.; et al. Association between inflammatory components and physical function in the health, aging, and body composition study: A principal component analysis approach. J. Gerontol. Ser. A Biol. Sci. Med. Sci. 2009, 64, 581–589. [Google Scholar] [CrossRef] [PubMed]
- Lin, W.T.; Lin, P.C.; Lee, C.Y.; Chen, Y.L.; Chan, T.F.; Tsai, S.; Huang, H.L.; Wu, P.W.; Chin, Y.T.; Lin, H.Y.; et al. Effects of insulin resistance on the association between the circulating retinol-binding protein 4 level and clustering of pediatric cardiometabolic risk factors. Pediatr. Diabetes 2018, 611–621. [Google Scholar] [CrossRef] [PubMed]
- Lin, W.T.; Lee, C.Y.; Tsai, S.; Huang, H.L.; Wu, P.W.; Chin, Y.T.; Seal, D.W.; Chen, T.; Chao, Y.Y.; Lee, C.H. Clustering of metabolic risk components and associated lifestyle factors: A nationwide adolescent study in Taiwan. Nutrients 2019, 11, 584. [Google Scholar] [CrossRef] [PubMed] [Green Version]
- National Health Research Institutes. Nutrition and Health Survey in Taiwan. Available online: https://www.hpa.gov.tw/EngPages/Detail.aspx?nodeid=1077&pid=6201 (accessed on 1 July 2020).
- National Health Research Institutes. Nutrition and Health Survey in Taiwan, 2010–2011: Study Materials and Methods. Available online: https://www.hpa.gov.tw/Pages/Detail.aspx?nodeid=1774&pid=9996 (accessed on 1 July 2020).
- Chen, C.M.; Lou, M.F.; Gau, B.S. Prevalence of impaired fasting glucose and analysis of related factors in Taiwanese adolescents. Pediatr. Diabetes 2014, 15, 220–228. [Google Scholar] [CrossRef]
- Lin, W.T.; Huang, H.L.; Huang, M.C.; Chan, T.F.; Ciou, S.Y.; Lee, C.Y.; Chiu, Y.W.; Duh, T.H.; Lin, P.L.; Wang, T.N.; et al. Effects on uric acid, body mass index and blood pressure in adolescents of consuming beverages sweetened with high-fructose corn syrup. Int. J. Obes. 2013, 37, 532–539. [Google Scholar] [CrossRef] [Green Version]
- Chan, T.F.; Lin, W.T.; Huang, H.L.; Lee, C.Y.; Wu, P.W.; Chiu, Y.W.; Huang, C.C.; Tsai, S.; Lin, C.L.; Lee, C.H. Consumption of sugar-sweetened beverages is associated with components of the metabolic syndrome in adolescents. Nutrients 2014, 6, 2088–2103. [Google Scholar] [CrossRef] [Green Version]
- Lin, W.T.; Chan, T.F.; Huang, H.L.; Lee, C.Y.; Tsai, S.; Wu, P.W.; Yang, Y.C.; Wang, T.N.; Lee, C.H. Fructose-rich beverage intake and central adiposity, uric acid, and pediatric insulin resistance. J. Pediatr. 2016, 171, 90–96.e1. [Google Scholar] [CrossRef] [Green Version]
- Lee, C.Y.; Lin, W.T.; Tsai, S.; Hung, Y.C.; Wu, P.W.; Yang, Y.C.; Chan, T.F.; Huang, H.L.; Weng, Y.L.; Chiu, Y.W.; et al. Association of parental overweight and cardiometabolic diseases and pediatric adiposity and lifestyle factors with cardiovascular risk factor clustering in adolescents. Nutrients 2016, 8, 567. [Google Scholar] [CrossRef]
- Zimmet, P.; Alberti, K.G.; Kaufman, F.; Tajima, N.; Silink, M.; Arslanian, S.; Wong, G.; Bennett, P.; Shaw, J.; Caprio, S.; et al. The metabolic syndrome in children and adolescents—An IDF consensus report. Pediatr. Diabetes 2007, 8, 299–306. [Google Scholar] [CrossRef]
- Nishida, C.; Ko, G.T.; Kumanyika, S. Body fat distribution and noncommunicable diseases in populations: Overview of the 2008 WHO Expert Consultation on Waist Circumference and Waist-Hip Ratio. Eur. J. Clin. Nutr. 2010, 64, 2–5. [Google Scholar] [CrossRef] [PubMed] [Green Version]
- Du, T.; Yuan, G.; Zhang, M.; Zhou, X.; Sun, X.; Yu, X. Clinical usefulness of lipid ratios, visceral adiposity indicators, and the triglycerides and glucose index as risk markers of insulin resistance. Cardiovasc. Diabetol. 2014, 13, 146. [Google Scholar] [CrossRef] [PubMed]
- Leal-Witt, M.J.; Ramon-Krauel, M.; Samino, S.; Llobet, M.; Cuadras, D.; Jimenez-Chillaron, J.C.; Yanes, O.; Lerin, C. Untargeted metabolomics identifies a plasma sphingolipid-related signature associated with lifestyle intervention in prepubertal children with obesity. Int. J. Obes. 2018, 42, 72–78. [Google Scholar] [CrossRef] [PubMed]
- DeLong, E.R.; DeLong, D.M.; Clarke-Pearson, D.L. Comparing the areas under two or more correlated receiver operating characteristic curves: A nonparametric approach. Biometrics 1988, 44, 837–845. [Google Scholar] [CrossRef] [PubMed]
- Ofstad, A.P.; Sommer, C.; Birkeland, K.I.; Bjorgaas, M.R.; Gran, J.M.; Gulseth, H.L.; Johansen, O.E. Comparison of the associations between non-traditional and traditional indices of adiposity and cardiovascular mortality: An observational study of one million person-years of follow-up. Int. J. Obes. 2019, 43, 1082–1092. [Google Scholar] [CrossRef] [PubMed] [Green Version]
- Ajala, O.; Mold, F.; Boughton, C.; Cooke, D.; Whyte, M. Childhood predictors of cardiovascular disease in adulthood. A systematic review and meta-analysis. Obes. Rev. 2017, 18, 1061–1070. [Google Scholar] [CrossRef] [Green Version]
- Perona, J.S.; Schmidt Rio-Valle, J.; Ramirez-Velez, R.; Correa-Rodriguez, M.; Fernandez-Aparicio, A.; Gonzalez-Jimenez, E. Waist circumference and abdominal volume index are the strongest anthropometric discriminators of metabolic syndrome in Spanish adolescents. Eur. J. Clin. Investig. 2019, 49, e13060. [Google Scholar] [CrossRef]
- Vasquez, F.; Correa-Burrows, P.; Blanco, E.; Gahagan, S.; Burrows, R. A waist-to-height ratio of 0.54 is a good predictor of metabolic syndrome in 16-year-old male and female adolescents. Pediatr. Res. 2019, 85, 269–274. [Google Scholar] [CrossRef]
- Oliveira, R.G.; Guedes, D.P. Performance of anthropometric indicators as predictors of metabolic syndrome in Brazilian adolescents. BMC Pediatr. 2018, 18, 33. [Google Scholar] [CrossRef] [Green Version]
- Arellano-Ruiz, P.; Garcia-Hermoso, A.; Garcia-Prieto, J.C.; Sanchez-Lopez, M.; Vizcaino, V.M.; Solera-Martinez, M. Predictive ability of waist circumference and waist-to-height ratio for cardiometabolic risk screening among Spanish children. Nutrients 2020, 12, 415. [Google Scholar] [CrossRef] [Green Version]
- Guo, S.X.; Zhang, X.H.; Zhang, J.Y.; He, J.; Yan, Y.Z.; Ma, J.L.; Ma, R.L.; Guo, H.; Mu, L.T.; Li, S.G.; et al. Visceral adiposity and anthropometric indicators as screening tools of metabolic syndrome among low income rural adults in Xinjiang. Sci. Rep. 2016, 6, 36091. [Google Scholar] [CrossRef]
- Haslam, D.W.; James, W.P. Obesity. Lancet 2005, 366, 1197–1209. [Google Scholar] [CrossRef]
- Carsley, S.; Tu, K.; Parkin, P.C.; Pullenayegum, E.; Birken, C.S. Overweight and obesity in preschool aged children and risk of mental health service utilization. Int. J. Obes. 2019, 43, 1325–1333. [Google Scholar] [CrossRef] [PubMed]
- Shen, Y.C.; Kung, S.C.; Chang, E.T.; Hong, Y.L.; Wang, L.Y. The impact of obesity in cognitive and memory dysfunction in obstructive sleep apnea syndrome. Int. J. Obes. 2019, 43, 355–361. [Google Scholar] [CrossRef] [PubMed]
- Perona, J.S.; Schmidt-RioValle, J.; Fernandez-Aparicio, A.; Correa-Rodriguez, M.; Ramirez-Velez, R.; Gonzalez-Jimenez, E. Waist circumference and abdominal volume index can predict metabolic syndrome in adolescents, but only when the criteria of the International Diabetes Federation are employed for the diagnosis. Nutrients 2019, 11, 1370. [Google Scholar] [CrossRef] [PubMed] [Green Version]


| ado-NAHSIT | mRP-aMS | |||||
|---|---|---|---|---|---|---|
| Variables 1 | Girls | Boys | p2 | Girls | Boys | p2 |
| (n = 971) | (n = 949) | Value | (n = 1399) | (n = 1328) | Value | |
| Age, year | 15.13 ± 1.86 | 15.18 ± 1.85 | 0.593 | 13.43 ± 1.02 | 13.43 ± 1.04 | 0.934 |
| Weight, Kg | 52.60 ± 10.50 | 62.39 ± 15.64 | <0.001 | 50.92 ± 11.39 | 57.97 ± 15.84 | <0.001 |
| Height, cm | 158.18 ± 5.81 | 168.02 ± 8.37 | <0.001 | 156.20 ± 5.96 | 162.03 ± 8.85 | <0.001 |
| Hip circumference, cm | 93.56 ± 7.81 | 94.13 ± 10.14 | 0.208 | 89.98 ± 8.45 | 91.16 ± 10.52 | 0.001 |
| Adiposity indicators | ||||||
| Body mass index | 20.97 ± 3.68 | 21.96 ± 4.71 | <0.001 | 20.79 ± 4.06 | 21.88 ± 4.92 | <0.001 |
| Body adiposity index | 29.07 ± 3.79 | 25.24 ± 4.10 | <0.001 | 28.11 ± 3.98 | 26.23 ± 4.47 | <0.001 |
| Body roundness index | 2.97 ± 1.01 | 2.76 ± 1.28 | <0.001 | 2.46 ± 1.06 | 2.71 ± 1.32 | <0.001 |
| Waist-to-hip ratio | 0.80 ± 0.05 | 0.82 ± 0.06 | <0.001 | 0.77 ± 0.06 | 0.81 ± 0.07 | <0.001 |
| Waist-to-height ratio | 0.48 ± 0.05 | 0.46 ± 0.07 | <0.001 | 0.45 ± 0.06 | 0.46 ± 0.07 | <0.001 |
| Abdominal volume index | 11.72 ± 2.80 | 12.54 ± 3.99 | <0.001 | 10.18 ± 2.88 | 11.57 ± 3.92 | <0.001 |
| A body shape index, 10−1 | 0.79 ± 0.03 | 0.77 ± 0.03 | <0.001 | 0.74 ± 0.05 | 0.75 ± 0.05 | <0.001 |
| Conicity index | 1.20 ± 0.05 | 1.17 ± 0.06 | <0.001 | 1.12 ± 0.08 | 1.15 ± 0.08 | <0.001 |
| Triglyceride-glucose index | 8.04 ± 0.38 | 8.07 ± 0.42 | 0.054 | 8.03 ± 0.43 | 8.04 ± 0.48 | 0.602 |
| Visceral adiposity index | 2.52 ± 1.72 | 1.90 ± 1.33 | <0.001 | 2.38 ± 1.40 | 1.73 ± 1.14 | <0.001 |
| Lipid accumulation product | 72.14 ± 67.53 | 61.23 ± 78.42 | 0.001 | 53.38 ± 62.13 | 53.35 ± 77.21 | 0.986 |
| Components of MetS | ||||||
| Waist circumference, cm | 75.23 ± 8.71 | 77.60 ± 12.01 | <0.001 | 69.56 ± 9.72 | 74.31 ± 12.31 | <0.001 |
| Systolic blood pressure, mmHg | 98.88 ± 8.71 | 108.86 ± 10.72 | <0.001 | 106.54 ± 11.52 | 112.03 ± 13.24 | <0.001 |
| Diastolic blood pressure, mmHg | 59.70 ± 7.68 | 60.25 ± 8.15 | 0.127 | 64.45 ± 9.02 | 64.61 ± 10.02 | 0.668 |
| Triglyceride, mg/dL | 71.50 ± 30.18 | 72.96 ± 34.48 | 0.327 | 75.18 ± 33.46 | 75.40 ± 39.15 | 0.874 |
| High-density lipoprotein, mg/dL | 57.43 ± 12.54 | 52.02 ± 11.60 | <0.001 | 58.32 ± 13.35 | 55.79 ± 13.51 | <0.001 |
| Fasting plasma glucose, mg/dL | 93.41 ± 10.45 | 96.51 ± 8.78 | <0.001 | 89.55 ± 8.71 | 92.29 ± 8.32 | <0.001 |
| IDF-adoMetS (SE), % | 2.37 (0.49) | 4.11 (0.64) | 0.034 | 1.43 (0.32) | 3.16 (0.48) | 0.003 |
| JIS-AdMetS (SE), % | 3.30 (0.57) | 4.53 (0.68) | 0.163 | 2.72 (0.43) | 3.46 (0.50) | 0.262 |
| Variables | Factor Loadings for Girls (n = 971) | Factor Loadings for Boys (n = 949) | ||||
|---|---|---|---|---|---|---|
| PC1g | PC2g | PC3g | PC1b | PC2b | PC3b | |
| Adiposity indicators | ||||||
| Body mass index | 0.419 | −0.170 | −0.004 | 0.414 | −0.019 | −0.193 |
| Body adiposity index | 0.399 | −0.256 | −0.062 | 0.383 | −0.037 | −0.165 |
| Body roundness index | 0.385 | 0.052 | −0.012 | 0.366 | −0.026 | 0.044 |
| Waist-to-height ratio | 0.387 | 0.056 | −0.020 | 0.367 | −0.025 | 0.046 |
| Abdominal volume index | 0.369 | 0.076 | 0.001 | 0.367 | −0.003 | −0.007 |
| Waist circumference | 0.366 | 0.100 | −0.010 | 0.365 | −0.005 | 0.003 |
| A body shape index | −0.124 | 0.656 | −0.019 | −0.081 | 0.004 | 0.767 |
| Conicity index | 0.135 | 0.526 | −0.027 | 0.200 | −0.008 | 0.449 |
| Waist-to-hip ratio | 0.161 | 0.416 | 0.036 | 0.215 | −0.025 | 0.377 |
| Triglyceride-glucose index | −0.058 | −0.048 | 0.650 | −0.034 | 0.682 | −0.004 |
| Visceral adiposity index | −0.005 | 0.018 | 0.630 | 0.003 | 0.658 | 0.003 |
| Lipid accumulation product | 0.188 | 0.041 | 0.417 | 0.228 | 0.314 | 0.012 |
| Eigenvalue | 6.319 | 2.487 | 2.281 | 7.168 | 2.140 | 1.951 |
| Proportion of variance explained | 52.7% | 20.7% | 19.0% | 59.7% | 17.8% | 16.3% |
| Cumulative proportion | 52.7% | 73.4% | 92.4% | 59.7% | 77.6% | 93.8% |
| Factor characteristic of PC score | Bodyfat-enhanced factor | Body-shape enhanced factor | Lipid-enhanced factor | Bodyfat-enhanced factor | Lipid-enhanced factor | Body-shape enhanced factor |
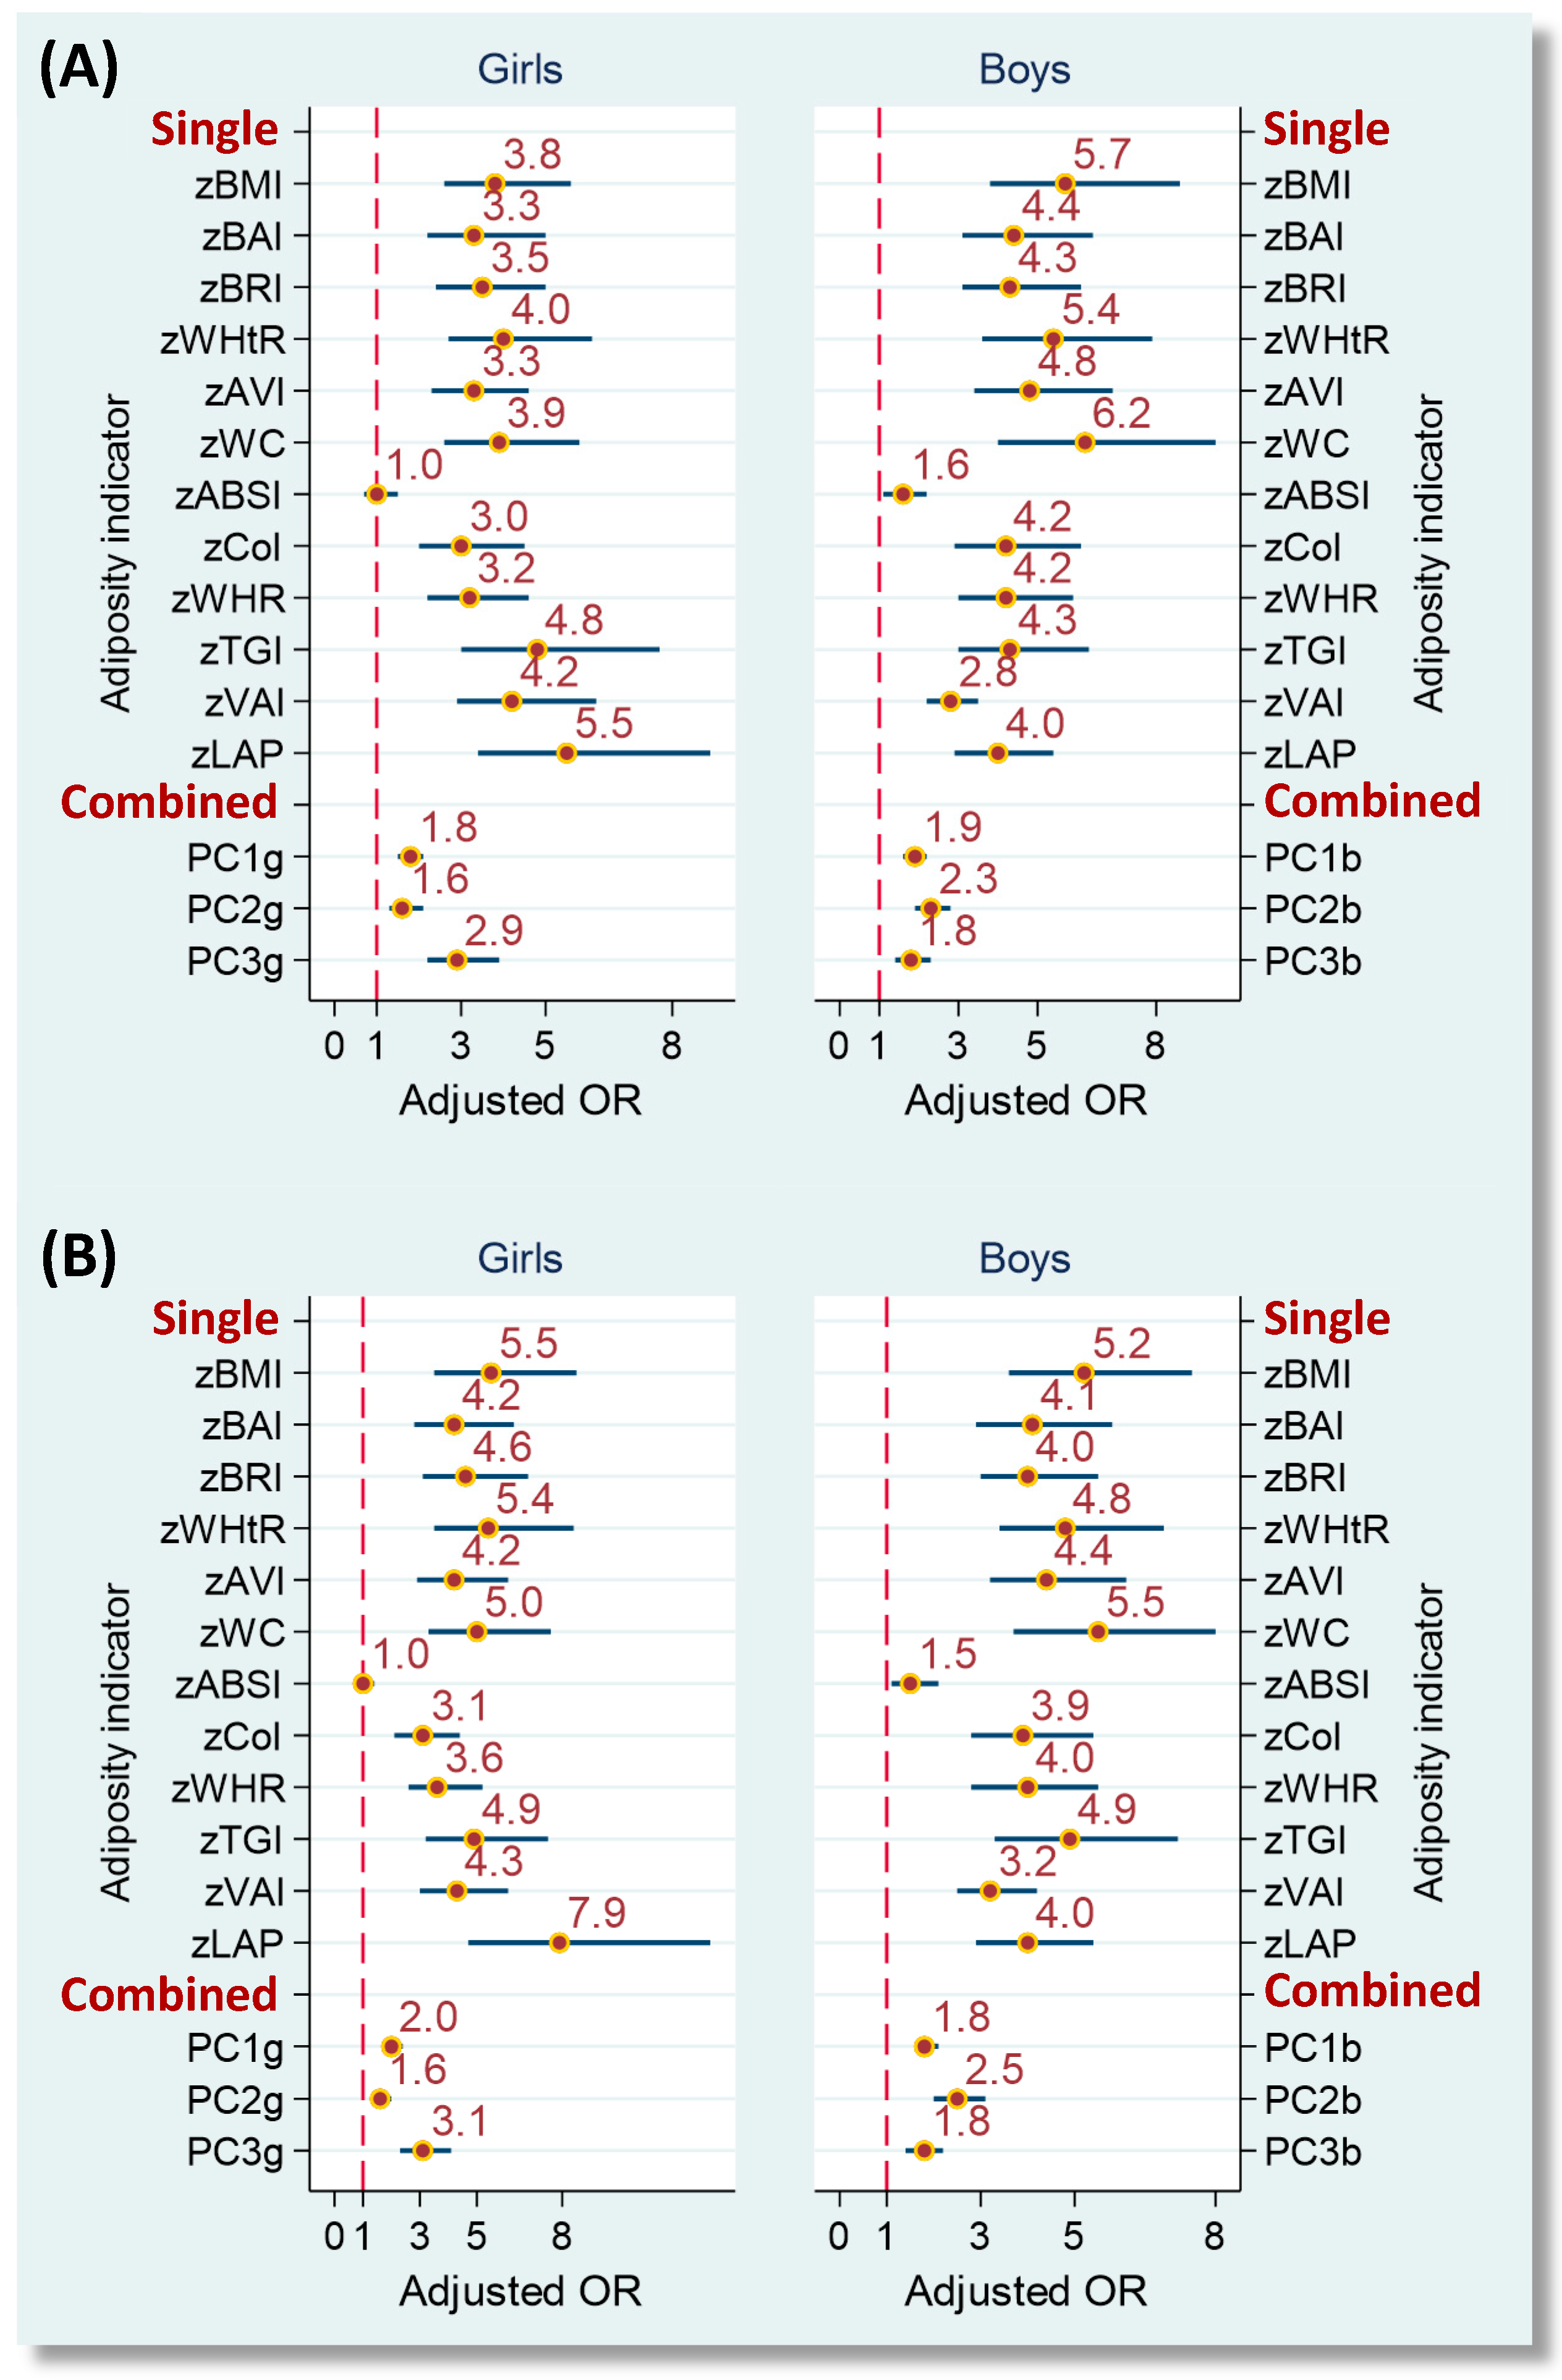
| IDF-adoMetS | JIS-AdMetS | |||||||
|---|---|---|---|---|---|---|---|---|
| Variables | Girls | Boys | Girls | Boys | ||||
| pCorr 1 | pR2 | pCorr 1 | pR2 | pCorr 1 | pR2 | pCorr 1 | pR2 | |
| Single indicator | ||||||||
| Bodyfat-enhanced group | ||||||||
| Body mass index | 0.596 * | 35.5% | 0.618 * | 38.2% | 0.601 * | 36.2% | 0.618 * | 38.2% |
| Body adiposity index | 0.471 * | 22.2% | 0.525 * | 27.6% | 0.479 * | 23.0% | 0.525 * | 27.6% |
| Body roundness index | 0.606 * | 36.7% | 0.611 * | 37.4% | 0.607 * | 36.9% | 0.611 * | 37.4% |
| Waist-to-height ratio | 0.605 * | 36.6% | 0.601 * | 36.2% | 0.607 * | 36.9% | 0.601 * | 36.2% |
| Abdominal volume index | 0.613 * | 37.6% | 0.623 * | 38.8% | 0.611 * | 37.3% | 0.623 * | 38.8% |
| Waist circumference | 0.612 * | 37.5% | 0.610 * | 37.2% | 0.611 * | 37.4% | 0.610 * | 37.2% |
| Body-shape-enhanced group | ||||||||
| A body shape index | 0.022 | 0.1% | 0.127 * | 1.6% | 0.006 | 0.0% | 0.127 * | 1.6% |
| Conicity index | 0.376 * | 14.1% | 0.471 * | 22.2% | 0.364 * | 13.3% | 0.471 * | 22.2% |
| Waist-to-hip ratio | 0.443 * | 19.6% | 0.502 * | 25.2% | 0.437 * | 19.1% | 0.502 * | 25.2% |
| Lipid-enhanced group | ||||||||
| Triglyceride-glucose index | 0.402 * | 16.2% | 0.482 * | 23.3% | 0.414 * | 17.1% | 0.482 * | 23.3% |
| Visceral adiposity index | 0.544 * | 29.6% | 0.555 * | 30.8% | 0.565 * | 31.9% | 0.555 * | 30.8% |
| Lipid accumulation product | 0.613 * | 37.6% | 0.648 * | 42.1% | 0.606 * | 36.7% | 0.648 * | 42.1% |
| Combined indicator (score) 2 | ||||||||
| PC1 | 0.621 * | 38.6% | 0.622 * | 38.7% | 0.623 * | 38.8% | 0.622 * | 38.7% |
| PC2 | 0.230 * | 5.3% | 0.558 * | 31.1% | 0.215 * | 4.6% | 0.558 * | 31.1% |
| PC3 | 0.535 * | 28.6% | 0.254 * | 6.5% | 0.547 * | 29.9% | 0.254 * | 6.5% |
| IDF-adoMetS | JIS-AdMetS | |||||||||||||||||||
|---|---|---|---|---|---|---|---|---|---|---|---|---|---|---|---|---|---|---|---|---|
| Girls | Boys | Girls | Boys | |||||||||||||||||
| Variables | AUC | Cutoff Point | Sen. % | Spe. % | YI | AUC | Cutoff Point | Sen. % | Spe. % | YI | AUC | Cutoff Point | Sen. % | Spe. % | YI | AUC | Cutoff Point | Sen. % | Spe. % | YI |
| Single indicator | ||||||||||||||||||||
| Bodyfat-enhanced group | ||||||||||||||||||||
| BMI | 0.937 * | 23.34 | 95.7 | 81.4 | 0.771 | 0.954* | 27.10 | 97.4 | 89.0 | 0.864 | 0.913 * | 23.34 | 93.8 | 82.1 | 0.759 | 0.925 * | 27.10 | 88.4 | 89.0 | 0.773 |
| BAI | 0.841 * | 29.94 | 91.3 | 65.4 | 0.567 | 0.904 * | 27.39 | 97.4 | 75.8 | 0.733 | 0.830 * | 31.12 | 81.3 | 76.4 | 0.576 | 0.876 * | 27.39 | 93.0 | 75.9 | 0.690 |
| BRI | 0.924 * | 3.60 | 95.7 | 82.4 | 0.780 | 0.943 * | 3.60 | 100.0 | 82.7 | 0.827 | 0.907 * | 3.60 | 93.8 | 83.1 | 0.768 | 0.912 * | 3.60 | 93.0 | 82.8 | 0.758 |
| WHtR | 0.924 * | 0.51 | 95.7 | 82.4 | 0.780 | 0.943 * | 0.51 | 100.0 | 82.7 | 0.827 | 0.907 * | 0.51 | 93.8 | 83.1 | 0.768 | 0.912 * | 0.51 | 93.0 | 82.8 | 0.758 |
| AVI | 0.941 * | 13.96 | 95.7 | 86.7 | 0.824 | 0.955 * | 16.57 | 100.0 | 88.4 | 0.884 | 0.916 * | 13.96 | 93.8 | 87.4 | 0.812 | 0.922 * | 16.57 | 90.7 | 88.3 | 0.790 |
| WC | 0.941 * | 82.7 | 95.7 | 86.3 | 0.819 | 0.955 * | 90.5 | 100.0 | 88.2 | 0.882 | 0.916 * | 82.7 | 93.8 | 87.0 | 0.808 | 0.922 * | 90.5 | 90.7 | 88.2 | 0.789 |
| Body-shape-enhanced group | ||||||||||||||||||||
| ABSI | 0.492 | 0.082 | 30.4 | 79.5 | 0.100 | 0.632 * | 0.076 | 84.6 | 44.8 | 0.295 | 0.489 | 0.083 | 15.6 | 90.1 | 0.057 | 0.614 * | 0.076 | 81.4 | 44.8 | 0.262 |
| CoI | 0.767 * | 1.26 | 52.2 | 89.8 | 0.419 | 0.896 * | 1.22 | 92.3 | 83.1 | 0.754 | 0.758 * | 1.26 | 53.1 | 90.2 | 0.433 | 0.864* | 1.22 | 86.0 | 83.1 | 0.692 |
| WHR | 0.826 * | 0.82 | 82.6 | 70.6 | 0.532 | 0.898 * | 0.85 | 92.3 | 80.0 | 0.723 | 0.833 * | 0.82 | 81.3 | 71.0 | 0.523 | 0.871 * | 0.85 | 88.4 | 80.1 | 0.685 |
| Lipid-enhanced group | ||||||||||||||||||||
| TGI | 0.849 * | 8.55 | 73.9 | 92.4 | 0.663 | 0.860 * | 8.24 | 87.2 | 70.4 | 0.576 | 0.853 * | 8.55 | 71.9 | 93.0 | 0.648 | 0.872 * | 8.40 | 79.1 | 80.7 | 0.598 |
| VAI | 0.915 * | 4.21 | 73.9 | 92.7 | 0.666 | 0.877 * | 2.60 | 76.9 | 82.6 | 0.596 | 0.910 * | 3.60 | 78.1 | 88.4 | 0.665 | 0.887 * | 2.60 | 79.1 | 83.0 | 0.621 |
| LAP | 0.942 * | 91.67 | 95.7 | 79.3 | 0.750 | 0.956 * | 93.33 | 100.0 | 82.0 | 0.820 | 0.921 * | 137.87 | 78.1 | 93.6 | 0.717 | 0.938 * | 93.33 | 97.7 | 82.2 | 0.799 |
| Combined indicator 1 | ||||||||||||||||||||
| PC1 score | 0.939 * | 1.61 | 95.7 | 81.9 | 0.775 | 0.953 * | 2.54 | 100.0 | 86.4 | 0.864 | 0.918 * | 2.69 | 87.5 | 89.8 | 0.773 | 0.922 * | 2.54 | 93.0 | 86.4 | 0.794 |
| PC2 score | 0.669 * | 1.56 | 52.2 | 85.9 | 0.380 | 0.883 * | 0.81 | 79.5 | 80.8 | 0.603 | 0.673 * | 1.06 | 56.3 | 78.5 | 0.347 | 0.893 * | 0.81 | 81.4 | 81.1 | 0.625 |
| PC3 score | 0.887 * | 1.97 | 73.9 | 93.7 | 0.676 | 0.732 * | 0.23 | 79.5 | 62.5 | 0.420 | 0.887 * | 1.42 | 78.1 | 90.2 | 0.683 | 0.710 * | 0.23 | 74.4 | 62.5 | 0.369 |
| Girls (n = 1399) | Boys (n = 1328) | |||||||||||||||||||
|---|---|---|---|---|---|---|---|---|---|---|---|---|---|---|---|---|---|---|---|---|
| Factors | IDF-adoMetS Proportion = 1.43% | JIS-AdMetS Proportion = 2.72% | IDF-adoMetS Proportion = 3.16% | JIS-AdMetS Proportion = 3.46% | ||||||||||||||||
| AVI | WC | WHR | LAP | PC1 | AVI | WC | WHR | LAP | PC1 | AVI | WC | WHR | LAP | PC1 | AVI | WC | WHR | LAP | PC1 | |
| Cutoff point | 13.96 | 82.7 | 0.82 | 91.67 | 1.61 | 13.96 | 82.7 | 0.82 | 137.87 | 2.69 | 16.57 | 90.5 | 0.85 | 93.33 | 2.54 | 16.57 | 90.5 | 0.85 | 93.33 | 2.54 |
| Discrimination | ||||||||||||||||||||
| Sensitivity (SE), % | 90.0 | 90.0 | 85.0 | 85.0 | 95.0 | 81.6 | 81.6 | 84.2 | 76.3 | 92.1 | 95.2 | 97.6 | 95.2 | 92.9 | 97.6 | 87.0 | 89.1 | 89.1 | 93.5 | 91.3 |
| (6.7) | (6.7) | (8.0) | (8.0) | (4.9) | (6.3) | (6.3) | (5.9) | (6.9) | (4.4) | (3.3) | (2.4) | (3.3) | (4.0) | (2.4) | (5.0) | (4.6) | (4.6) | (3.6) | (4.2) | |
| Specificity (SE), % | 91.6 | 91.4 | 79.8 | 85.7 | 82.2 | 92.4 | 92.3 | 80.7 | 94.1 | 90.4 | 90.7 | 90.7 | 75.9 | 83.4 | 87.4 | 90.7 | 90.7 | 75.9 | 83.7 | 87.4 |
| (0.7) | (0.8) | (1.1) | (0.9) | (1.0) | (0.7) | (0.7) | (1.1) | (0.6) | (0.8) | (0.8) | (0.8) | (1.2) | (1.0) | (0.9) | (0.8) | (0.8) | (1.2) | (1.0) | (0.9) | |
| Youden’s index | 0.816 | 0.814 | 0.648 | 0.707 | 0.772 | 0.740 | 0.739 | 0.649 | 0.704 | 0.826 | 0.860 | 0.884 | 0.711 | 0.763 | 0.850 | 0.777 | 0.798 | 0.650 | 0.772 | 0.787 |
| No. of positive test per case identified | 7.4 | 7.6 | 17.4 | 12.6 | 13.9 | 4.3 | 4.4 | 9.2 | 3.8 | 4.7 | 4.0 | 3.9 | 8.8 | 6.5 | 5.0 | 4.0 | 3.9 | 8.5 | 5.9 | 4.8 |
| Total no. of test per case identified | 77.7 | 77.7 | 82.3 | 82.3 | 73.6 | 45.1 | 45.1 | 43.7 | 48.2 | 40.0 | 33.2 | 32.4 | 33.2 | 34.1 | 32.4 | 33.2 | 32.4 | 32.4 | 30.9 | 31.6 |
Publisher’s Note: MDPI stays neutral with regard to jurisdictional claims in published maps and institutional affiliations. |
© 2020 by the authors. Licensee MDPI, Basel, Switzerland. This article is an open access article distributed under the terms and conditions of the Creative Commons Attribution (CC BY) license (http://creativecommons.org/licenses/by/4.0/).
Share and Cite
Chin, Y.-T.; Lin, W.-T.; Wu, P.-W.; Tsai, S.; Lee, C.-Y.; Seal, D.W.; Chen, T.; Huang, H.-L.; Lee, C.-H. Characteristic-Grouped Adiposity Indicators for Identifying Metabolic Syndrome in Adolescents: Develop and Valid Risk Screening Tools Using Dual Population. Nutrients 2020, 12, 3165. https://0-doi-org.brum.beds.ac.uk/10.3390/nu12103165
Chin Y-T, Lin W-T, Wu P-W, Tsai S, Lee C-Y, Seal DW, Chen T, Huang H-L, Lee C-H. Characteristic-Grouped Adiposity Indicators for Identifying Metabolic Syndrome in Adolescents: Develop and Valid Risk Screening Tools Using Dual Population. Nutrients. 2020; 12(10):3165. https://0-doi-org.brum.beds.ac.uk/10.3390/nu12103165
Chicago/Turabian StyleChin, Yu-Ting, Wei-Ting Lin, Pei-Wen Wu, Sharon Tsai, Chun-Ying Lee, David W. Seal, Ted Chen, Hsiao-Ling Huang, and Chien-Hung Lee. 2020. "Characteristic-Grouped Adiposity Indicators for Identifying Metabolic Syndrome in Adolescents: Develop and Valid Risk Screening Tools Using Dual Population" Nutrients 12, no. 10: 3165. https://0-doi-org.brum.beds.ac.uk/10.3390/nu12103165