Efficacy of “High in” Nutrient Specific Front of Package Labels—A Retail Experiment with Canadians of Varying Health Literacy Levels

 ,
,
Abstract
:1. Introduction
2. Materials and Methods
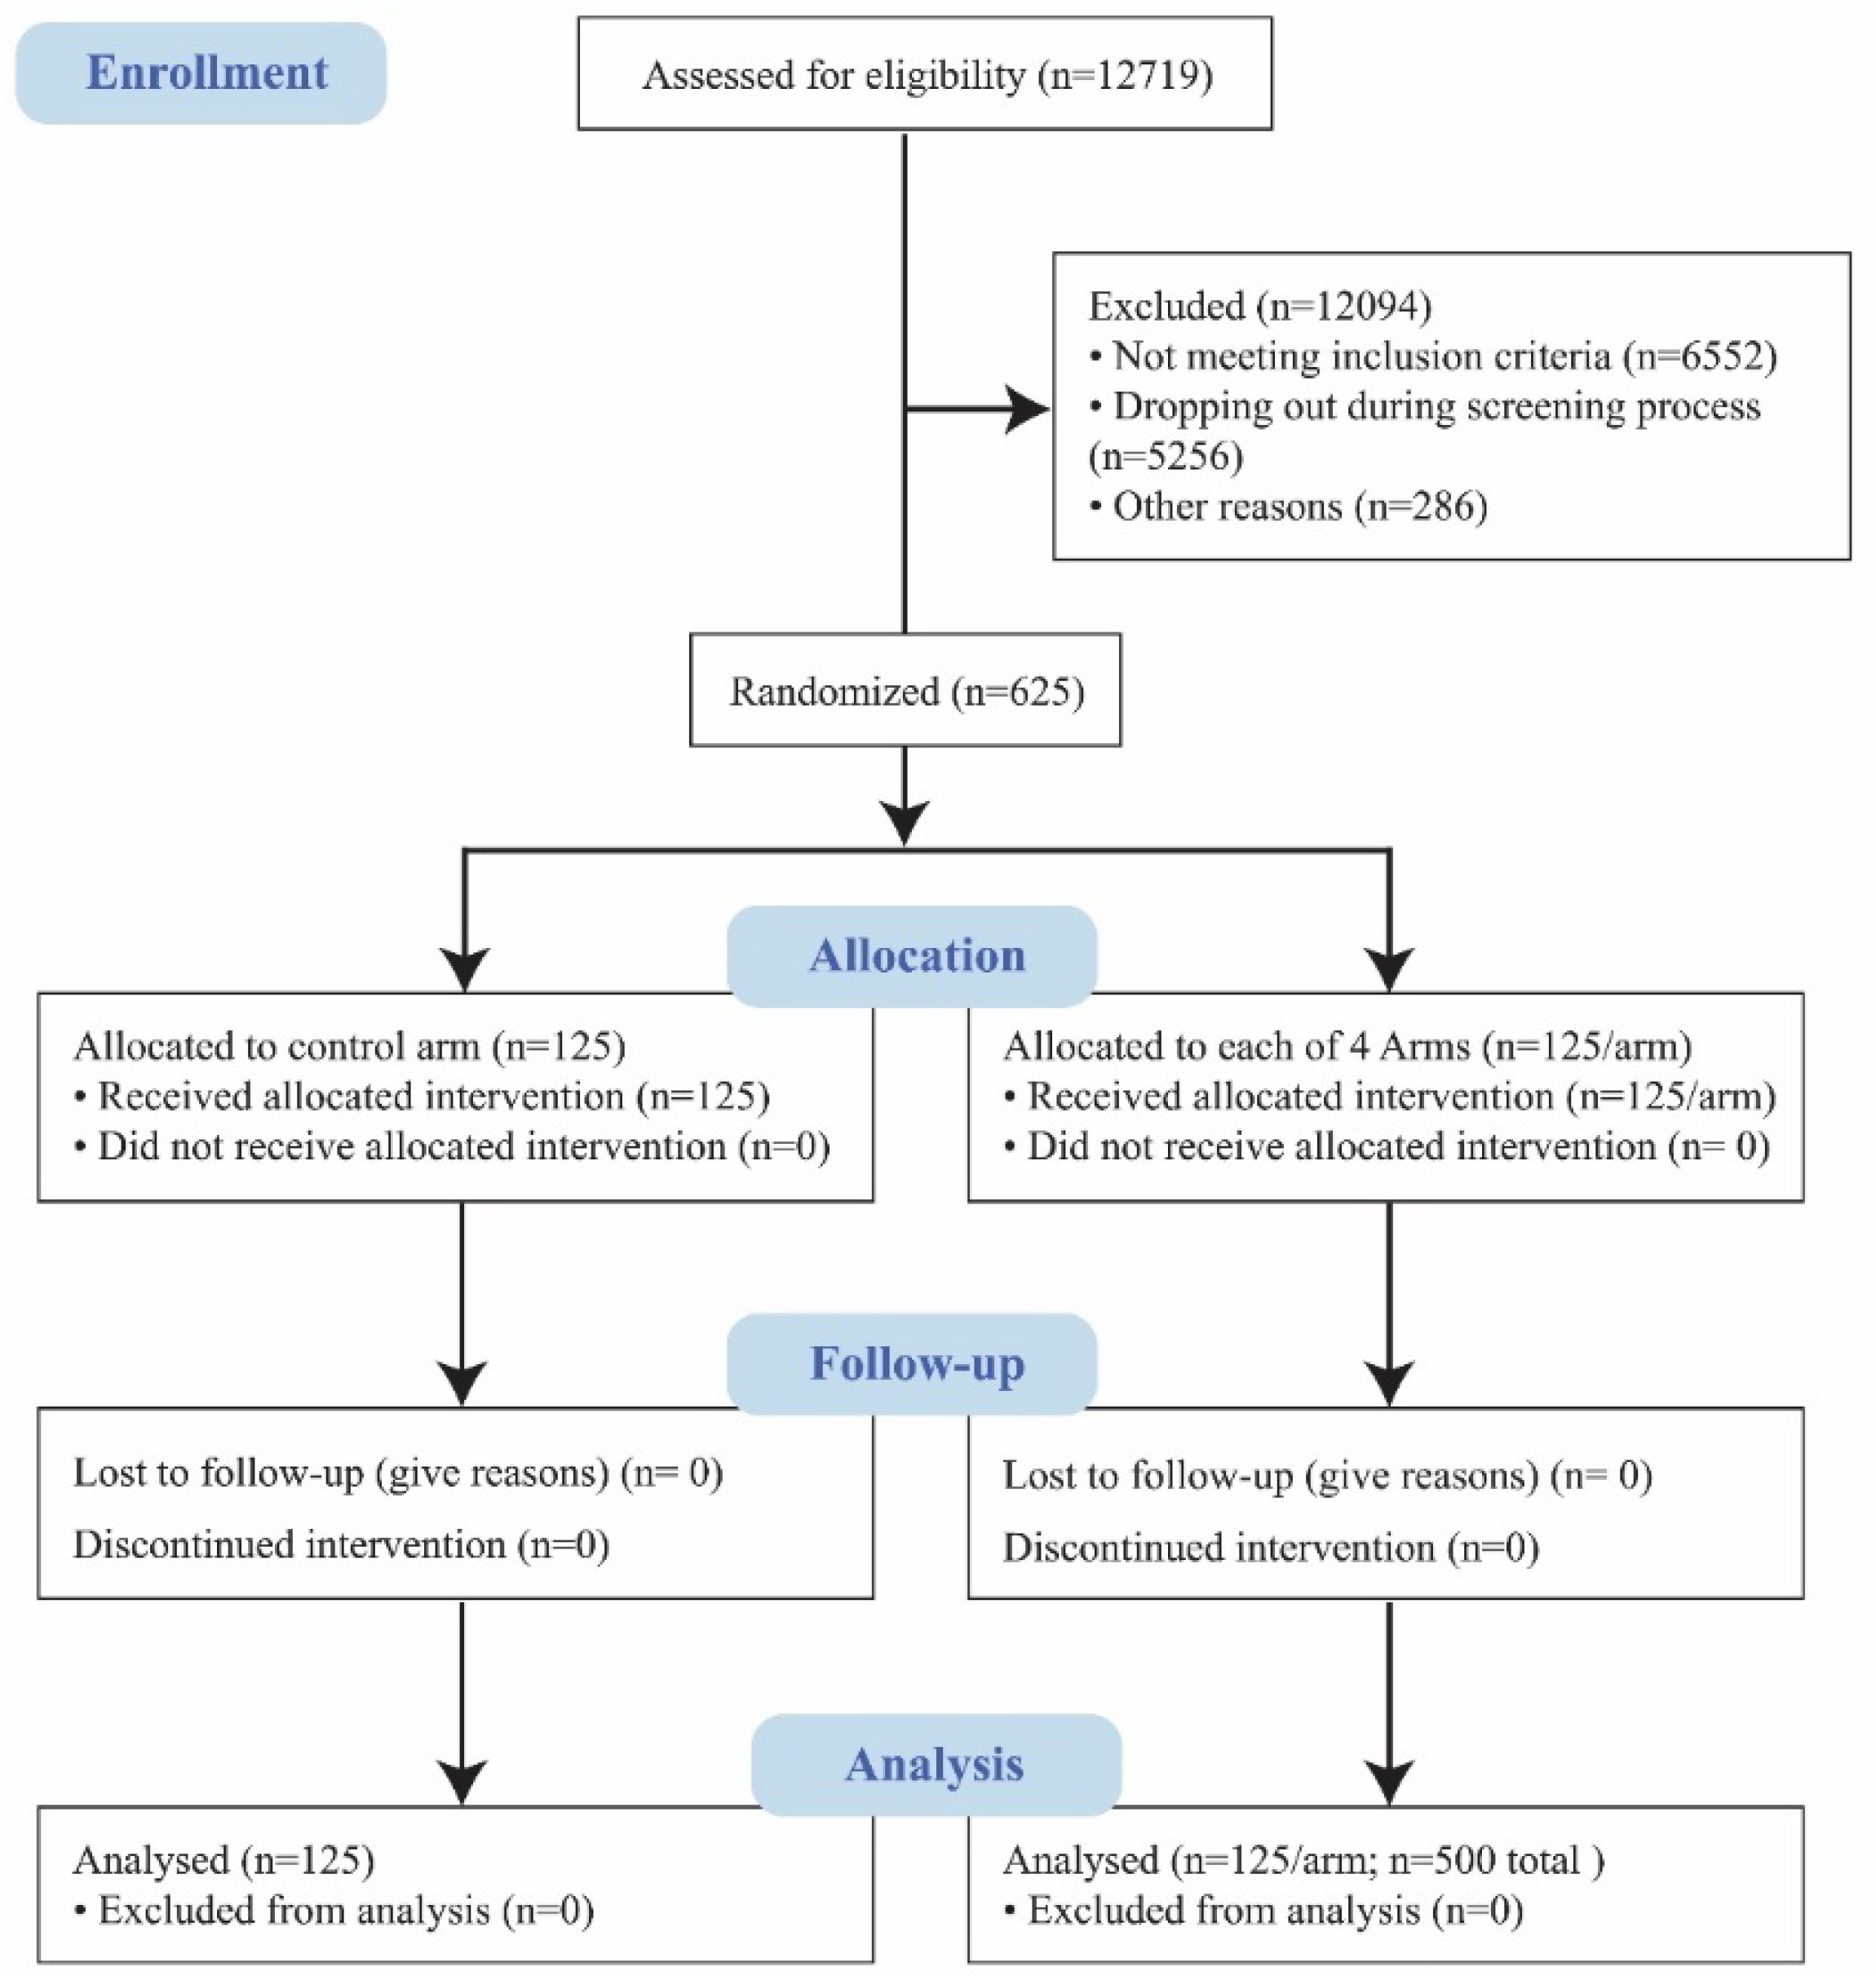
2.1. Study Sample and Recruitment
2.2. Research Ethics and Consent
2.3. Study Design
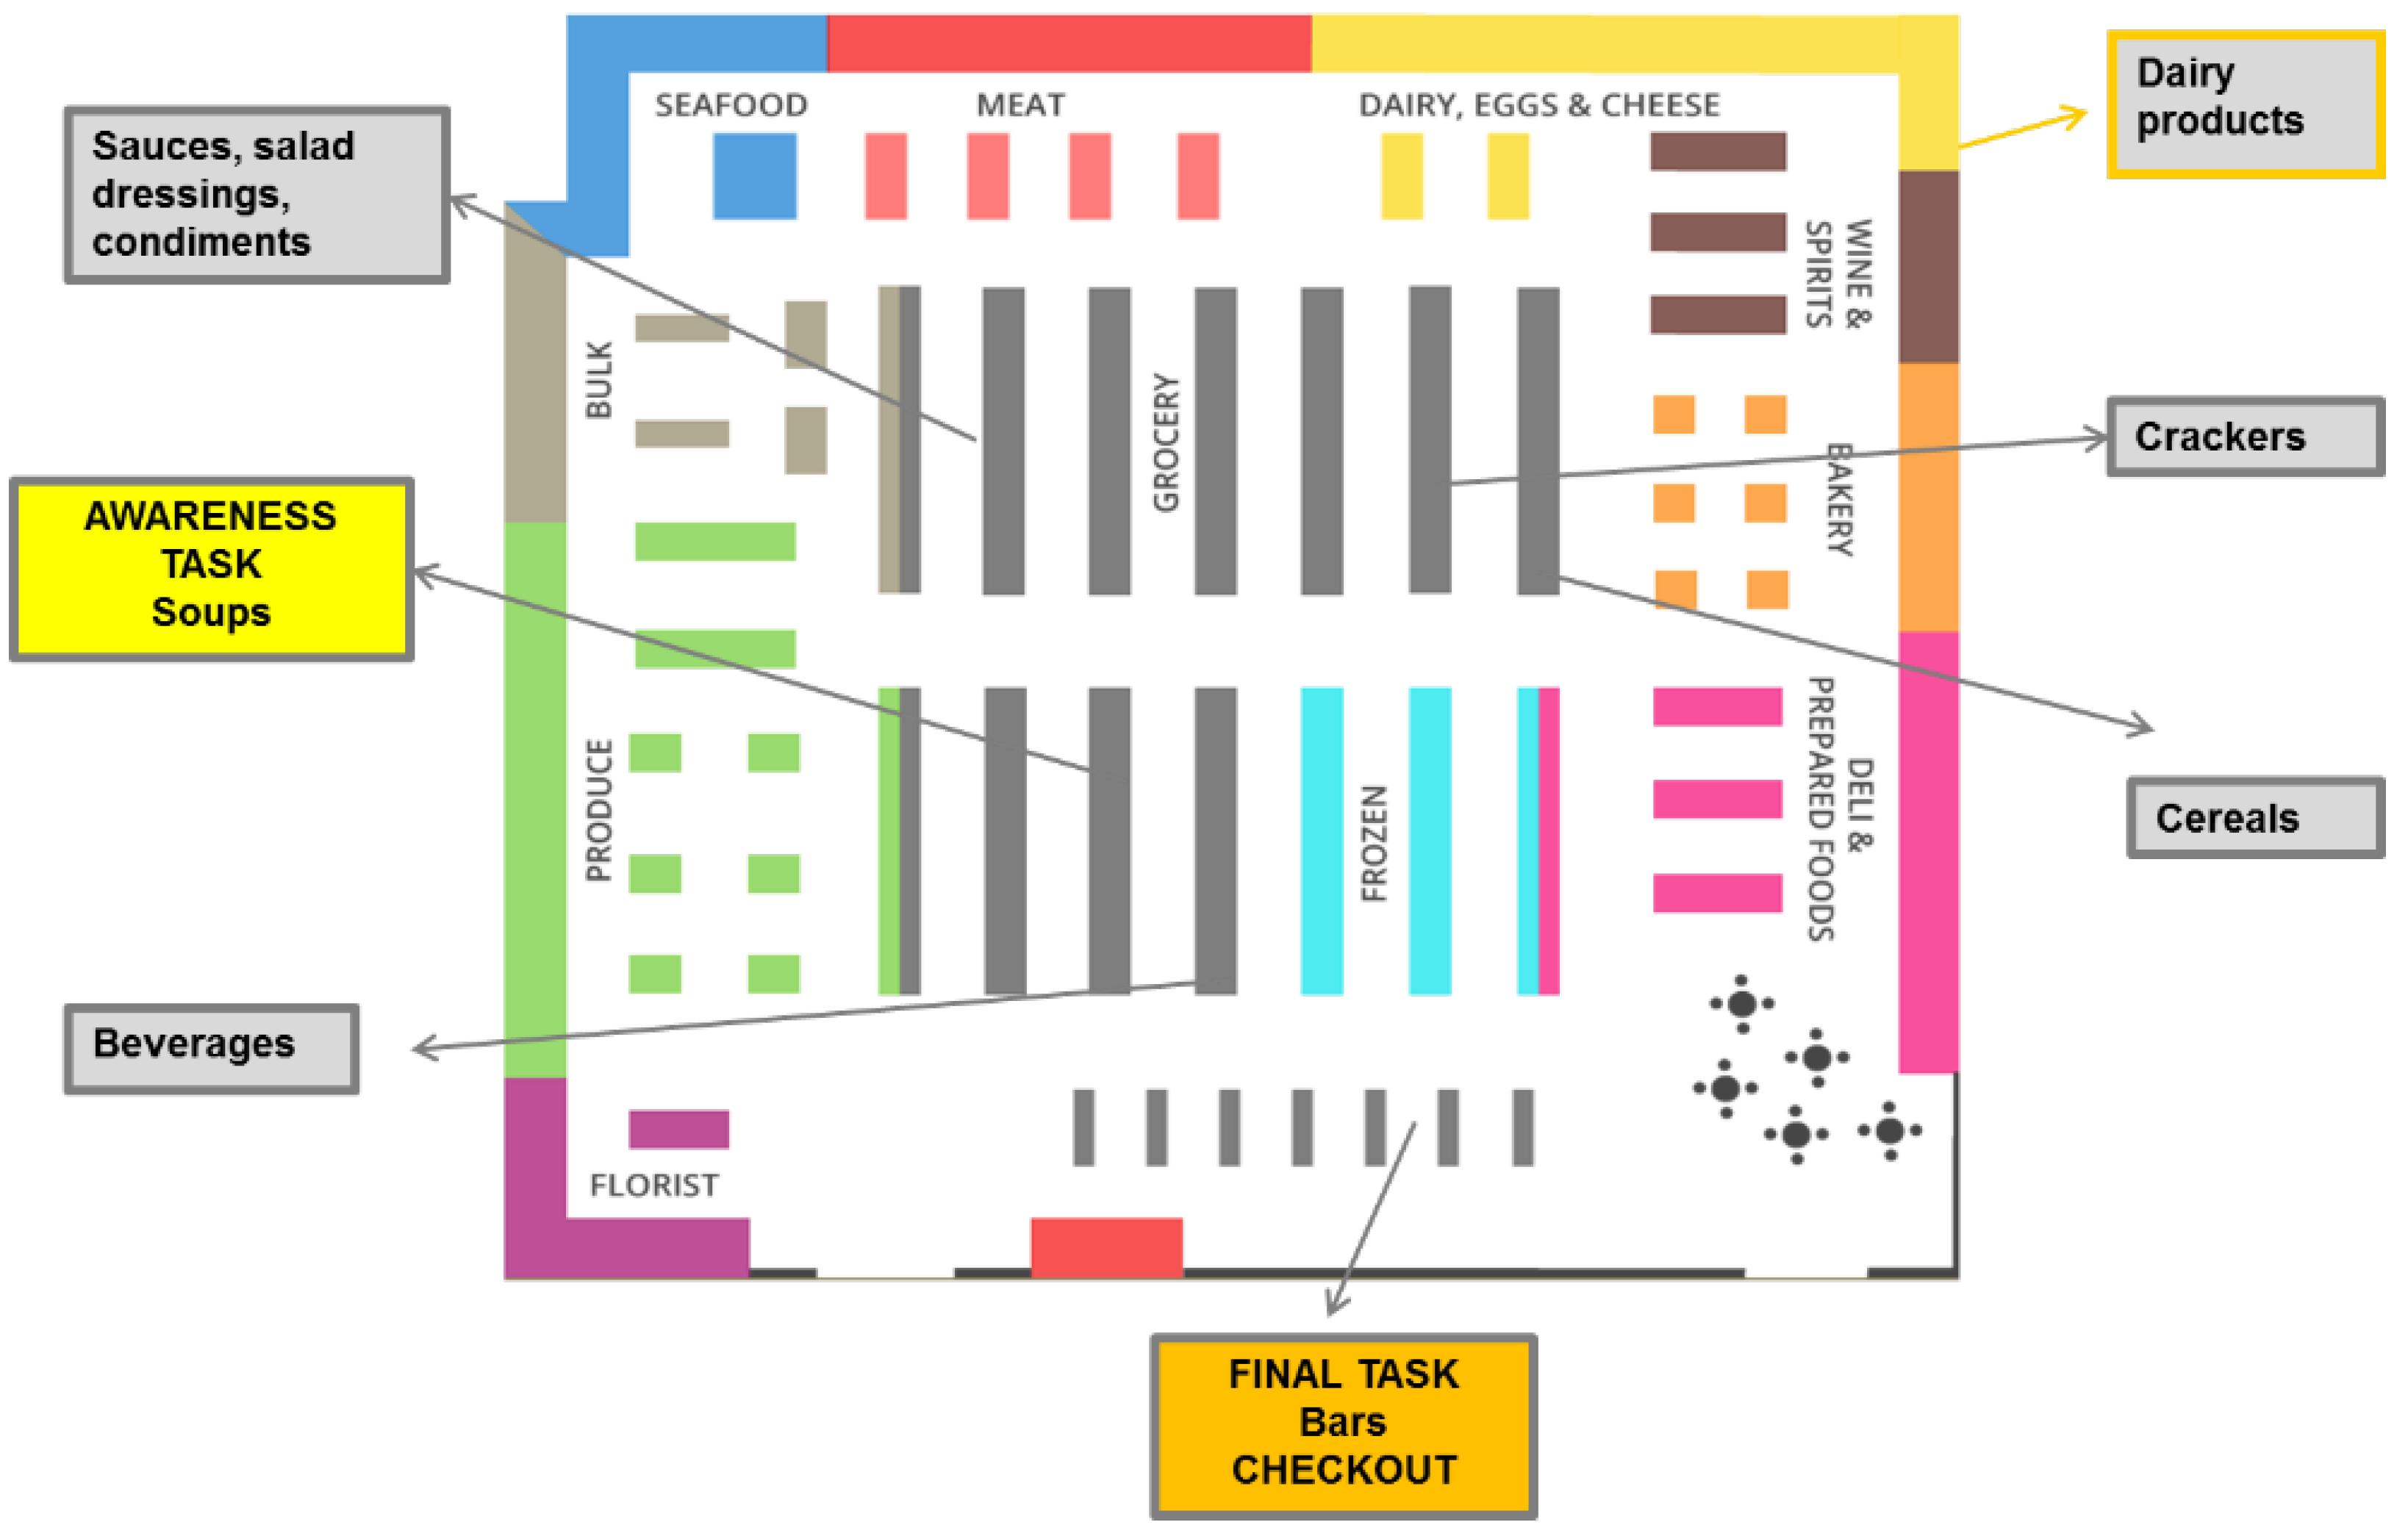
2.4. Study Setting
2.5. Study Procedures
2.6. Outcomes
2.7. Sample Size
2.8. Data Analysis
2.8.1. Shopping Experiment Data Analysis
2.8.2. Eye Tracking Data Analysis
2.8.3. Interview Data Analysis
3. Results
3.1. Sample
3.2. Objective #1: Efficacy of FOPL Compared to Current Labeling
3.3. Objective #2: Efficacy of Specific FOPL Designs
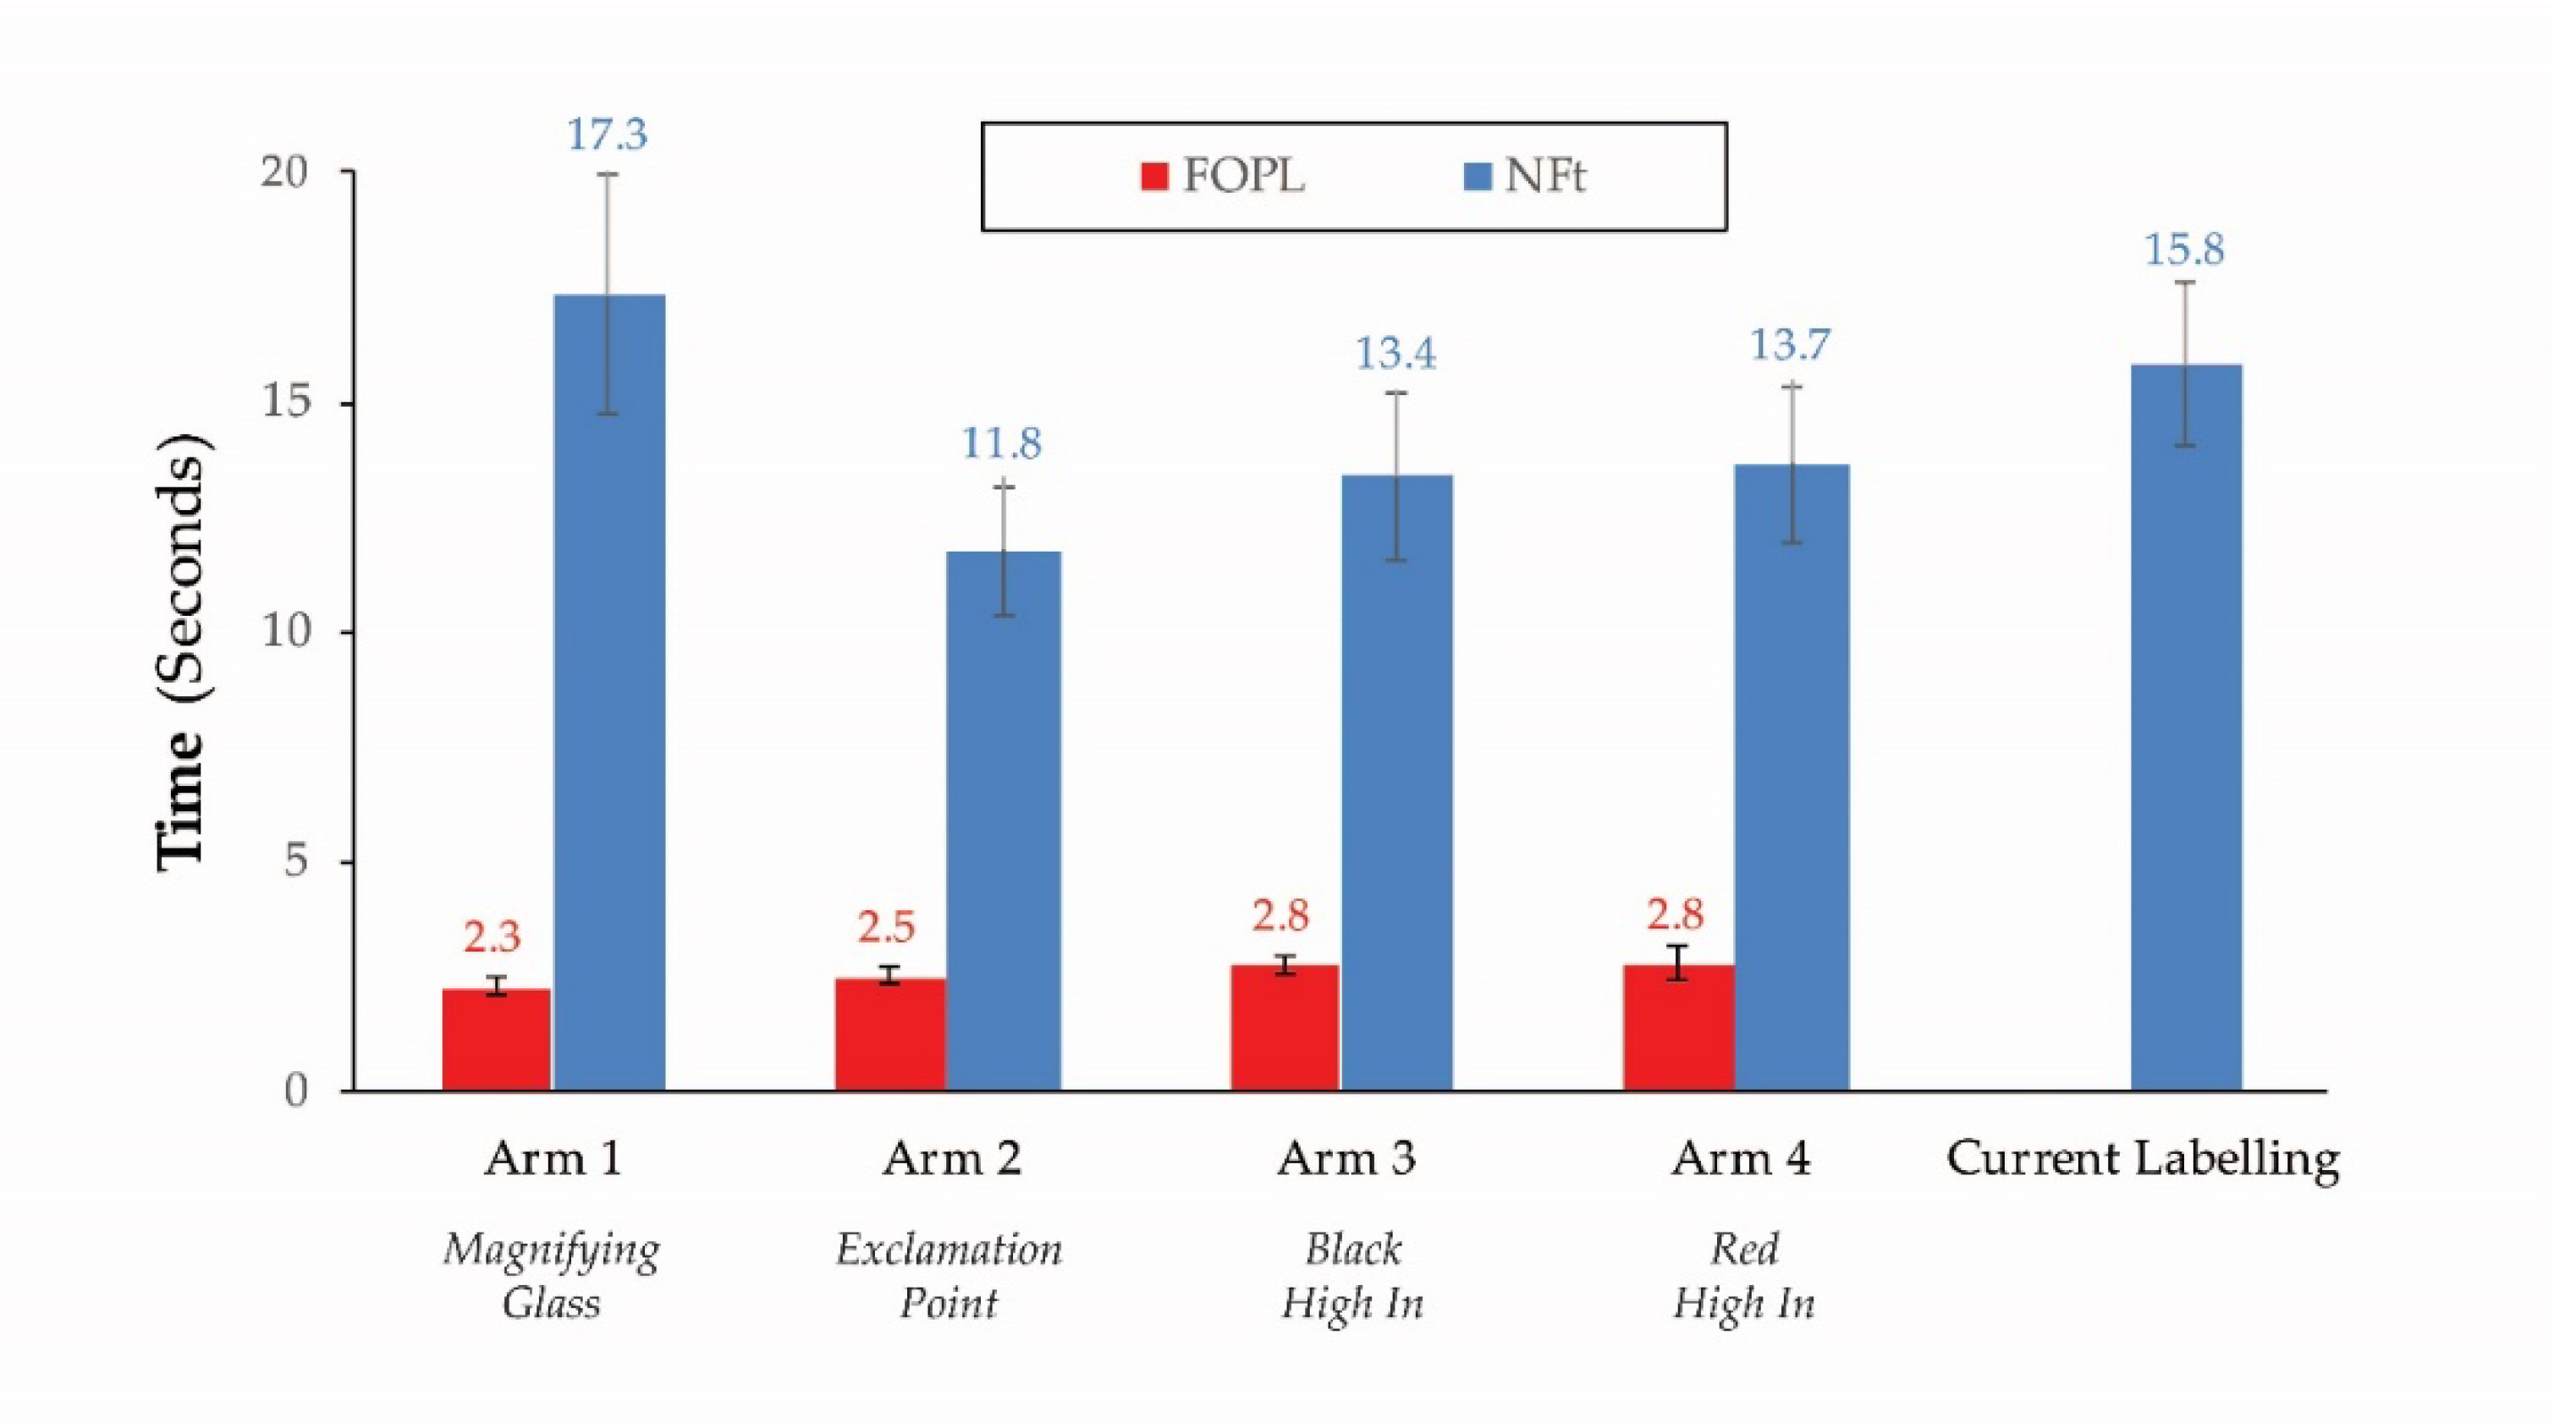
3.4. Attentional Capture of FOPL Designs
3.5. Food Decision-Making and Use of FOPL
4. Discussion
Strengths and Limitations
5. Conclusions
Supplementary Materials
Author Contributions
Funding
Acknowledgments
Conflicts of Interest
Abbreviations
| AOI | Areas of Interest |
| FOPL | Front of Package Label |
| HL | Health Literacy |
| GTA | Greater Toronto Area |
| HES | Healthy Eating Strategy |
| LOI | List of Ingredients |
| NFT | Nutrition Facts Table |
| TCPS | Tri-Council Policy Statement |
| TTTFF | Time to First Fixation |
| WHO | World Health Organization |
References
- Statistics Canada. Leading Causes of Death, Total Population, by Age Group and Sex; Statistics Canada: Ottawa, ON, Canada, 2015. [Google Scholar]
- Institute for Health Metrics and Evaluation. Life Expectancy Globally and in Canada, 1990–2013. Available online: http://www.healthdata.org/canada (accessed on 9 October 2018).
- Government of Canada. Food and Drug Regulations Government of Canada; Minister of Justice: Ottawa, ON, Canada, 2019. [Google Scholar]
- Goodman, S.; Hammond, D.; Pillo-Blocka, F.; Glanville, T.; Jenkins, R. Use of nutritional information in Canada: National trends between 2004 and 2008. J. Nutr. Educ. Behav. 2011, 43, 356–365. [Google Scholar] [CrossRef] [PubMed]
- Campos, S.; Doxey, J.; Hammond, D. Nutrition labels on pre-packaged foods: A systematic review. Public Health Nutr. 2011, 14, 1496–1506. [Google Scholar] [CrossRef] [Green Version]
- Hobin, E.; Shen-Tu, G.; Sacco, J.; White, C.; Bowman, C.; Sheeshka, J.; McVey, G.; O’Brien, M.F.; Vanderlee, L.; Hammond, D. Comprehension and use of nutrition facts tables among adolescents and young adults in Canada. Can. J. Diet. Pract. Res. 2016, 77, 59–65. [Google Scholar] [CrossRef] [PubMed]
- Strategic Counsel. Canadians’ Understanding and Use of the Nutrition Facts Table: Baseline National Survey Results; Strategic Counsel: Ottawa, ON, Canada, 2011. [Google Scholar]
- Emrich, T.E.; Arcand, J.; L’Abbé, M.R. Front-of-package nutrition labelling systems: A missed opportunity? Can. J. Public Health 2012, 103. [Google Scholar] [CrossRef]
- Mansfield, E.W.R.; De Grandpré, E. Integrating a health literacy lens into nutrition labelling policy in Canada. Int. J. Environ. Res. Public Health 2020, 17, 4130. [Google Scholar] [CrossRef] [PubMed]
- The World Health Organization. Report of the Commission on Ending Childhood Obesity; The World Health Organization: Geneva, Switzerland, 2016. [Google Scholar]
- Feunekes, G.I.J.; Gortemaker, I.A.; Willems, A.A.; Lion, R.; van den Kommer, M. Front-of-pack nutrition labelling: Testing effectiveness of different nutrition labelling formats front-of-pack in four European countries. Appetite 2008, 50, 57–70. [Google Scholar] [CrossRef]
- van Herpen, E.; Trijp, H.C.M.V. Front-of-pack nutrition labels. Their effect on attention and choices when consumers have varying goals and time constraints. Appetite 2011, 57, 148–160. [Google Scholar] [CrossRef]
- Nutbeam, D. The evolving concept of health literacy. Soc. Sci. Med. 2008, 67. [Google Scholar] [CrossRef]
- Nutbeam, D. Health literacy as a public health goal: A challenge for contemporary health education and communication strategies into the 21st century. Health Promot. Int. 2000, 15, 259–267. [Google Scholar] [CrossRef] [Green Version]
- Cowburn, G.; Stockley, L. Consumer understanding and use of nutrition labelling: A systematic review. Public Health Nutr. 2007, 8, 21–28. [Google Scholar] [CrossRef] [Green Version]
- Julia, C.; Kesse-Guyot, E.; Ducrot, P.; Péneau, S.; Touvier, M.; Méjean, C.; Hercberg, S. Performance of a five category front-of-pack labelling system–the 5-colour nutrition label–to differentiate nutritional quality of breakfast cereals in France. BMC Public Health 2015, 15. [Google Scholar] [CrossRef] [PubMed]
- Mhurchu, C.N.; Eyles, H.; Choi, Y.-H. Effects of a voluntary front-of-pack nutrition labelling system on packaged food reformulation: The health star rating system in New Zealand. Nutrients 2017, 9, 918. [Google Scholar] [CrossRef] [PubMed]
- Food and Drink Federation. Front of Pack Labelling. Available online: http://www.foodlabel.org.uk/label/front-of-pack-labelling.aspx (accessed on 28 September 2020).
- UK Department of Health; Food Standard Agency; British Retail Consortium. Guide to Creating a Front of Pack Nutrition Label for Pre-Packaged Prodicts Sold through Retail Outlets; Government of United Kingdom: London, UK, 2016.
- Hersey, J.C.; Wohlgenant, K.C.; Arsenault, J.E.; Kosa, K.M.; Muth, M.K. Effects of front-of-package and shelf nutrition labeling systems on consumers. Nutr. Rev. 2013, 71, 1–14. [Google Scholar] [CrossRef] [PubMed]
- Institute of Medicine (US) Committee on Examination of Front-of-Package Nutrition Rating Sytems and Symbols. Front-of-Package Nutritional Rating Systems and Symbols; National Academies Press: Washington, DC, USA, 2012. [Google Scholar]
- Institute de Nutricien y Technologie de los Alimentos, Universidad de Chile. Ley de Etiquetado: Cambios en Composición de Alimentos y de Conductas Tras su Implementación; IN: Macul, Chile, 2018. [Google Scholar]
- Acton, R.B.; Hammond, D. The impact of price and nutrition labelling on sugary drink purchases: Results from an experimental marketplace study. Appetite 2018, 121, 129–137. [Google Scholar] [CrossRef] [PubMed] [Green Version]
- Acton, R.B.; Hammond, D. Do consumers think front-of-package “high in” warnings are harsh or reduce their control? A test of food industry concerns. Obesity 2018, 26, 1687–1691. [Google Scholar] [CrossRef] [PubMed] [Green Version]
- Ministerio de Salud. Decreto número 13, de 2015; Diario Oficial de la Republica de Chile, Ministerio del Interior y Seguridad Pública Salud: Santiago de Chile, Chile, 2019. [Google Scholar]
- Corvalán, C.; Reyes, M.; Garmendia, M.L.; Uauy, R. Structural responses to the obesity and non-communicable diseases epidemic: The Chilean law of food labeling and advertising. Obes. Rev. 2013, 14, 79–87. [Google Scholar] [CrossRef] [PubMed]
- State of Israel Ministry of Health. Food Label and Nutrition Labeling. Available online: https://www.health.gov.il/English/Topics/FoodAndNutrition/Nutrition/Adequate_nutrition/Pages/labeling.aspx (accessed on 27 July 2020).
- Khandpur, N.; Sato, P.; Mais, L.; Martins, A.; Spinillo, C.; Garcia, M.; Rojas, C.; Jaime, P. Are front-of-package warning labels more effective at communicating nutrition information than traffic-light labels? A randomized controlled experiment in a Brazilian sample. Nutrients 2018, 10, 688. [Google Scholar] [CrossRef] [Green Version]
- Lima, F. Peru Publishes Warning Manual for Processed Product Food Labels; Office of Agricultural Affairs: Lima, Peru, 2017. [Google Scholar]
- Ares, G.; Aschemann-Witzel, J.; Curutchet, M.R.; Antunez, L.; Moratorio, X.; Bove, I. A citizen perspective on nutritional warnings as front-of-pack labels: Insights for the design of accompanying policy measures. Public Health Nutr. 2018, 21, 3450–3461. [Google Scholar] [CrossRef] [Green Version]
- Ministerio de Salud Pública. Decreto N°272/18. Modificacion del Reglamento Bromatologico Nacional, Relativo al Rotulado de Alimentos; Published 31/08/2018; Ministerio de Salud Pública: Montevideo, Uruguay, 2018. [Google Scholar]
- Health Canada. Healthy Eating Strategy; Cat.: H164-196/2016E-PDF; Government of Canada: Ottawa, ON, Canada, October 2016. Available online: https://www.canada.ca/content/dam/canada/health-canada/migration/publications/eating-nutrition/healthy-eating-strategy-canada-strategie-saine-alimentation/alt/pub-eng.pdf (accessed on 24 October 2019).
- Government of Canada. Consultation on Front-of-Package Labelling. Available online: https://www.canada.ca/en/health-canada/programs/consultation-front-of-package-nutrition-labelling-cgi.html (accessed on 20 December 2018).
- Grunert, K.G.; Wills, J.M. A review of European research on consumer response to nutrition information on food labels. J. Public Health 2007, 15, 385–399. [Google Scholar] [CrossRef] [Green Version]
- Kanter, R.; Vanderlee, L.; Vandevijvere, S. Front-of-package nutrition labelling policy: Global progress and future directions. Public Health Nutr. 2018, 21, 1399–1408. [Google Scholar] [CrossRef] [Green Version]
- Canadian Council on Learning. Health Literacy in Canada; Canadian Council on Learning: Ottawa, ON, Canada, 2008. [Google Scholar]
- Health Canada. Toward Front-of-Package Nutrition Labels for Canadians. Available online: https://www.canada.ca/en/health-canada/programs/front-of-package-nutrition-labelling/consultation-document.html (accessed on 24 October 2019).
- Langlois, K.D.G.; Gonzalez, A.; Sinclair, S.; Colapinto, C.K. Change in Total Sugars Consumption among Canadian Children and Adults; Statistics Canada: Ottawa, ON, Canada, 2019. [Google Scholar]
- Canada Health. Sodium Intake of Canadians in 2017; H164–233/2018E-PDF; Canada Health: Ottawa, ON, Canada, 2017. [Google Scholar]
- Mansfield, E.D.; Wahba, R.; Gillis, D.E.; Weiss, B.D.; L’Abbé, M. Canadian adaptation of the Newest Vital Sign©, a health literacy assessment tool. Public Health Nutr. 2018, 21, 1–8. [Google Scholar] [CrossRef] [PubMed] [Green Version]
- Acton, R.B.; Jones, A.C.; Kirkpatrick, S.I.; Roberto, C.A.; Hammond, D. Taxes and front-of-package labels improve the healthiness of beverage and snack purchases: A randomized experimental marketplace. Int. J. Behav. Nutr. Phys. Act. 2019, 16, 46. [Google Scholar] [CrossRef] [PubMed]
- Ares, G.; Varela, F.; Machin, L.; Antúnez, L.; Giménez, A.; Curutchet, M.R.; Aschemann-Witzel, J. Comparative performance of three interpretative front-of-pack nutrition labelling schemes: Insights for policy making. Food Qual. Prefer. 2018, 68, 215–225. [Google Scholar] [CrossRef]
- Arrúa, A.; Curutchet, M.R.; Rey, N.; Barreto, P.; Golovchenko, N.; Sellanes, A.; Velazco, G.; Winokur, M.; Giménez, A.; Ares, G. Impact of front-of-pack nutrition information and label design on children’s choice of two snack foods: Comparison of warnings and the traffic-light system. Appetite 2017, 116, 139–146. [Google Scholar] [CrossRef] [PubMed]
- Arrúa, A.; Machín, L.; Curutchet, M.R.; Martínez, J.; Antúnez, L.; Alcaire, F.; Giménez, A.; Ares, G. Warnings as a directive front-of-pack nutrition labelling scheme: Comparison with the guideline daily amount and traffic-light systems. Public Health Nutr. 2017, 20, 2308–2317. [Google Scholar] [CrossRef] [PubMed]
- Machín, L.; Aschemann-Witzel, J.; Curutchet, M.R.; Giménez, A.; Ares, G. Does front-of-pack nutrition information improve consumer ability to make healthful choices? Performance of warnings and the traffic light system in a simulated shopping experiment. Appetite 2018, 121, 55–62. [Google Scholar] [CrossRef] [PubMed]
- Lima, M.; Ares, G.; Deliza, R. How do front of pack nutrition labels affect healthfulness perception of foods targeted at children? Insights from Brazilian children and parents. Food Qual. Prefer. 2018, 64, 111–119. [Google Scholar] [CrossRef]
- Ares, G.; Aschemann-Witzel, J.; Curutchet, M.R.; Antúnez, L.; Machín, L.; Vidal, L.; Martínez, J.; Giménez, A. Nutritional warnings and product substitution or abandonment: Policy implications derived from a repeated purchase simulation. Food Qual. Prefer. 2018, 65, 40–48. [Google Scholar] [CrossRef]
- Ang, F.J.L.; Agrawal, S.; Finkelstein, E.A. Pilot randomized controlled trial testing the influence of front-of-pack sugar warning labels on food demand. BMC Public Health 2019, 19, 164. [Google Scholar] [CrossRef]
- Acton, R.B.; Hammond, D. Impact of sugar taxes and front-of-package nutrition labels on purchases of protein, calcium and fibre. Prev. Med. 2020, 136, 106091. [Google Scholar] [CrossRef]
- Aliaga-Ortega, L.; Adasme-Berríos, C.; Méndez, C.; Soto, C.; Schnettler, B. Processed food choice based on the theory of planned behavior in the context of nutritional warning labels. Br. Food J. 2019, 121, 3266–3280. [Google Scholar] [CrossRef]
- Gentry, M. World Cancer Research Fund International (WCRF). Impact 2017, 2017, 32–33. [Google Scholar] [CrossRef]


| Type of Shopping Tasks | Shopping Task Objectives | Details of Shopping Task | Task Example |
|---|---|---|---|
| Introductory task (1 task—soup) | To introduce participants to the eye-tracking technology. It also introduced participants in the FOPL arms to the FOPL. | In this introductory task, ALL participants were asked to shop for a soup for their household. | Choose a soup for your household. |
| Non-specific shopping task (1 task) | (1) To determine if FOPL on pre-packaged foods are more effective than current labeling when relying on consumers’ intrinsic motivation for making healthier food choices. (2) To compare efficacy between FOPL arms. | Participants shopped in an assigned food category and chose a food for their household. | Choose a yoghurt for your household. |
| Specific shopping task (2 tasks) | (1) To determine if FOPL on pre-packaged foods are more effective than current labeling when choosing foods to reduce intakes of saturated fat, sugars, and/or sodium. (2) To compare efficacy between FOPL arms. | Participants shopped in an assigned food category and chose a food for their household to reduce intakes of saturated fat, sugars, and/or sodium. | Choose cereal for someone trying to cut down on their sugar intake. |
| Findability task (2 tasks) | (1) To determine if FOPL on pre-packaged foods are more effective than current labeling at helping consumers identify foods high in saturated fat, sugars, and/or sodium. (2) To compare efficacy between FOPL arms. | Participants shopped in an assigned food category to find a food high in saturated fat, sugars, and/or sodium. | Find any cracker high in sodium and saturated fat. |
| Food Categories | TASK TYPE | ||
| Selection of Food without Replacement from Task 1 Onwards | |||
| Tasks 1 and 2 | Tasks 3 and 4 | Tasks 5 and 6 | |
| 2 Non-Specific Task | 2 Specific Task | 2 Findability Task | |
| Options | Options | Options | |
| Task 1 | |||
| Introductory | |||
| Soup | Soup | ||
| Task 2 | |||
| Non-Specific Task | |||
| Cereal | Cereal | Low sugar | High sugar |
| Yogurt | Yogurt | Low sugar | High satfat |
| Low (sugar + satfat) | High (sugar + satfat) | ||
| Crackers OR | Cracker | Cracker | Cracker |
| Low sodium/Low satfat | |||
| Crackers with Cheese | Cracker with Cheese | High sodium/High satfat | |
| Low satfat | |||
| Salad Dressing | Salad dressing | Low sodium | High satfat |
| Low (sodium + satfat) | High (sodium + satfat) | ||
| Beverage | Beverage | Low sugar | High sugar |
| Bar | High sugar | ||
| High satfat | |||
| High (sugar + satfat) | |||
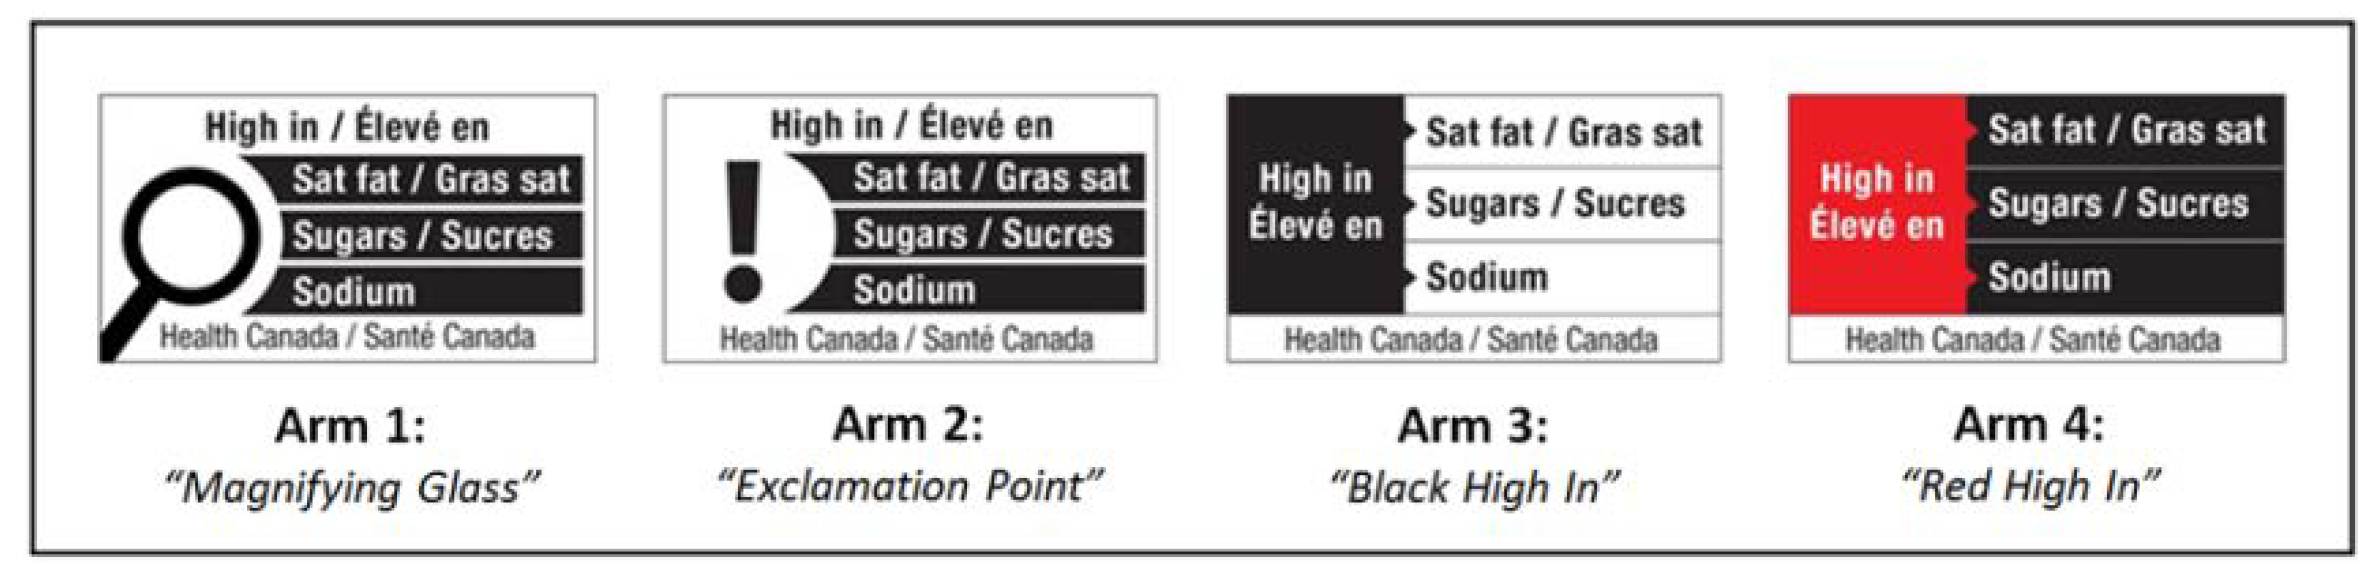
| Control Current Labeling | Arm 1 Magnifying Glass | Arm 2 Exclamation Point | Arm 3 Black High In | Arm 4 Red High In | ||
|---|---|---|---|---|---|---|
| # of Participants: | n = 125 | n = 125 | n = 125 | n = 125 | n = 125 | |
| Gender | Male | 62 | 62 | 58 | 59 | 62 |
| Female | 63 | 63 | 67 | 66 | 63 | |
| Age | 16 to 18 | 5 | 4 | 4 | 4 | 3 |
| 19 to 24 | 6 | 13 | 9 | 12 | 11 | |
| 25 to 34 | 30 | 26 | 25 | 29 | 27 | |
| 35 to 49 | 38 | 33 | 33 | 31 | 30 | |
| 50 to 64 | 30 | 34 | 33 | 32 | 34 | |
| 65+ | 16 | 15 | 21 | 17 | 20 | |
| Populations of Interest | General Population | 104 | 108 | 105 | 103 | 104 |
| Indigenous | 7 | 6 | 6 | 6 | 6 | |
| Teens | 4 | 4 | 4 | 4 | 3 | |
| Francophone | 10 | 7 | 10 | 12 | 12 | |
| Health Literacy | Adequate | 49 | 49 | 50 | 50 | 50 |
| Limited/Marginal | 76 | 76 | 75 | 75 | 75 |
| Shopping Task | Measure | Control N = 125 | FOPL N = 500 | * p-Value |
|---|---|---|---|---|
| Non-specific (1 task) | Success rate, n (%) | 36 (28.8) | 218 (43.6) | 0.0029 |
| Time, seconds; mean ± SEM | 28.5 ± 2.4 | 31.7 ± 1.7 | 0.92 | |
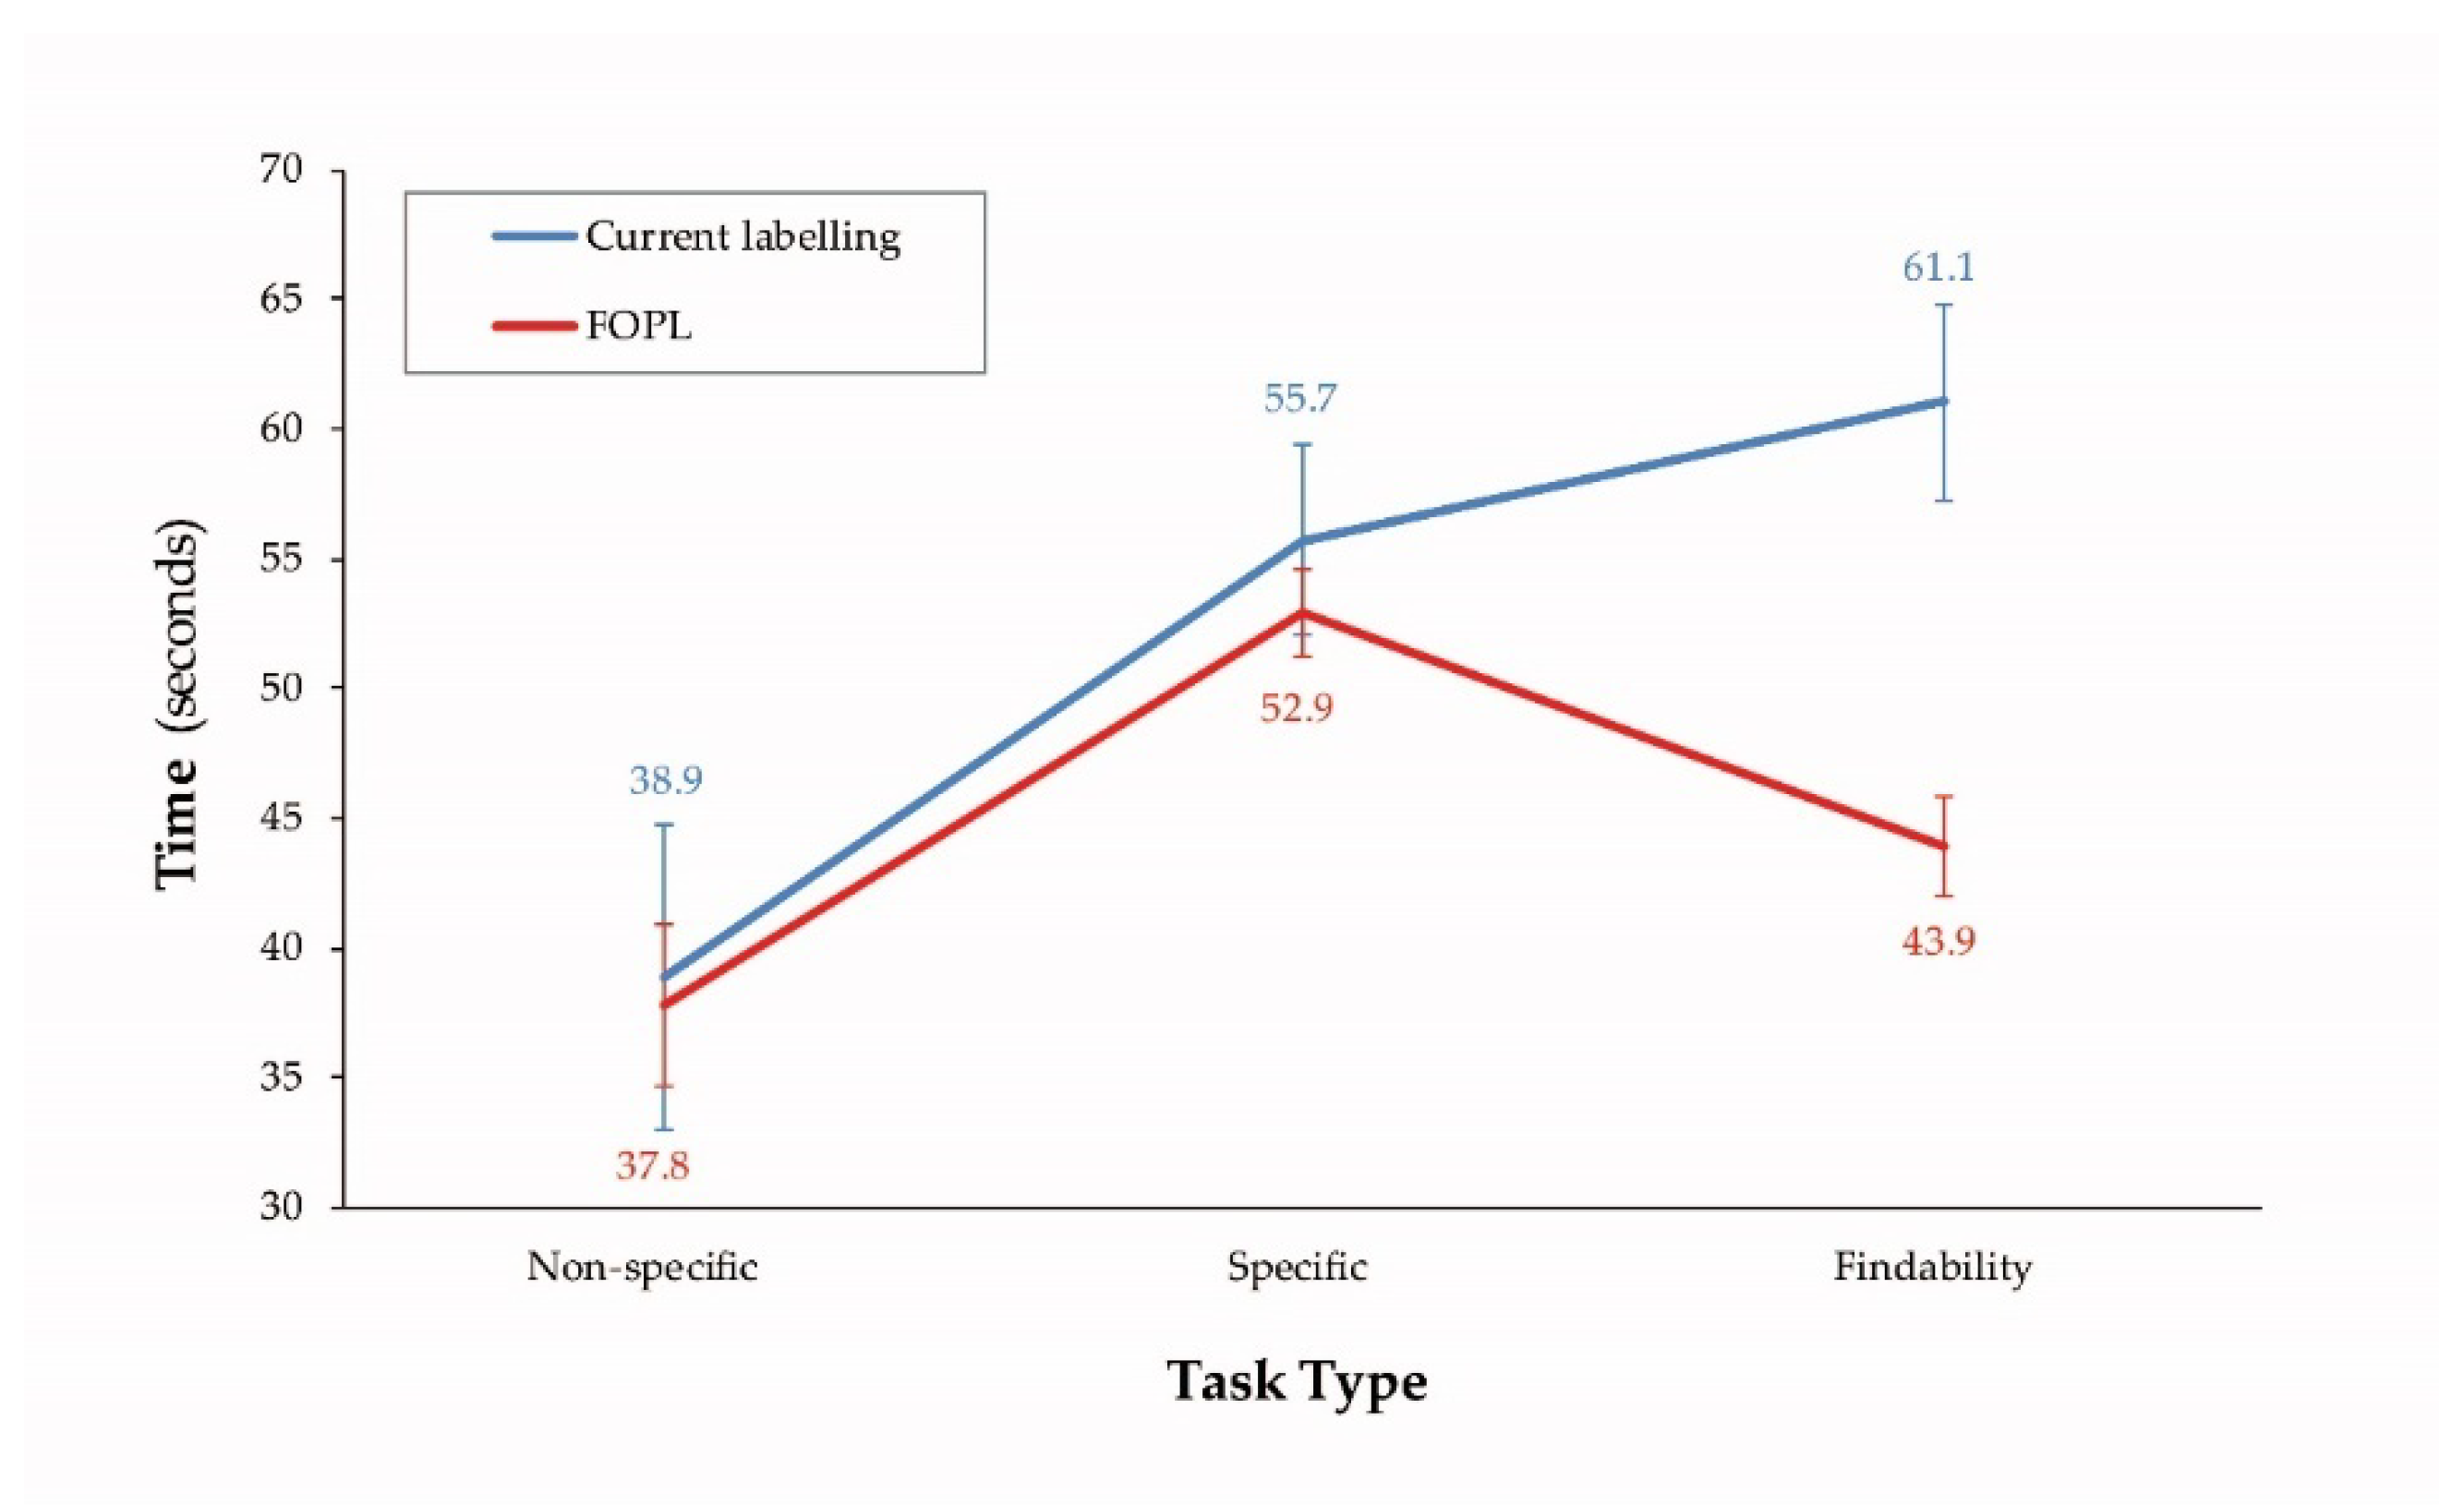
| Success only | 38.9 ± 5.9 | 37.8 ± 3.2 | 0.28 | |
| Specific (2 tasks) | Success rate, n (%) | 184 (73.6) | 858 (85.8) | <0.001 |
| Time, seconds; mean ± SEM | 54.3 ± 3.3 | 52.3 ± 1.6 | 0.54 | |
| Success only | 55.7 ± 3.7 | 52.9 ± 1.7 | 0.36 | |
| Findability (2 tasks) | Success rate, n (%) | 168 (67.2) | 883 (88.3) | <0.001 |
| Time, seconds; mean ± SEM | 64.7 ± 3.9 | 46.6 ± 1.9 | <0.0001 | |
| Success only | 61.1 ± 3.8 | 43.9 ± 1.9 | < 0.001 | |
| All 5 tasks | Success rate, n (%) | 388 (62.08) | 1959 (78.36) | <0.001 |
| Time, seconds; mean ± SEM | 53.3 ± 2.9 | 46.1 ± 1.5 | 0.29 | |
| Success only | 56.4 ± 3.3 | 47.1 ± 1.6 | 0.02 |
| Marginal HL N = 377 | Adequate HL N = 248 | ||||||
|---|---|---|---|---|---|---|---|
| Shopping Task | Measure | Control N = 76 | FOPL N = 301 | * p-Value | Control N = 49 | FOPL N = 199 | * p-Value |
| Non-specific (1 task) | Success rate, n (%) | 24 (31.58%) | 128 (42.52%) | 0.08 | 12 (24.49%) | 90 (45.23%) | 0.008 |
| Time (sec) mean ± SEM | 39.1 ± 8 | 38 ± 4.7 | 0.30 | 38.3 ± 8 | 37.4 ± 3.7 | 0.48 | |
| Specific (2 tasks) | Success rate, n (%) | 106 (69.74%) | 512 (85.05%) | <0.001 | 78 (79.59%) | 346 (86.93%) | 0.065 |
| Time (sec) mean ± SEM | 58.5 ± 5.6 | 52.7 ± 2.3 | 0.33 | 51.9 ± 4.2 | 53.2 ± 2.3 | 0.87 | |
| Findability (2 tasks) | Success rate, n (%) | 96 (63.16%) | 522 (86.71%) | <0.001 | 72 (73.47%) | 361 (90.70%) | <0.001 |
| Time (sec) mean ± SEM | 62.8 ± 5 | 43.8 ± 2.6 | <0.001 | 58.7 ± 5.8 | 43.9 ± 2.8 | 0.002 | |
| All 5 tasks | Success rate, n (%) | 226 (59.47%) | 1162 (77.21%) | <0.001 | 162 (66.12%) | 797 (80.1%) | <0.001 |
| Time (sec) mean ± SEM | 58.3 ± 4 | 47.1 ± 2 | 0.06 | 53.9 ± 3.7 | 47.2 ± 2.1 | 0.31 | |
| Shopping Task | Measure | FOPL Designs | ||||
|---|---|---|---|---|---|---|
| Arm 1 Magnifying Glass | Arm 2 Exclamation Point | Arm 3 Black High In | Arm 4 Red High In | * p-Value | ||
| Non-specific (1 task) | Success rate n (%) | 52 (41.6%) | 55 (44.0%) | 53 (42.4%) | 58 (46.4%) | 0.88 |
| Time (sec) mean ± SEM | 26.3 ± 2.2 | 34.9 ± 4.4 | 32.8 ± 3.2 | 33.1 ± 3.1 | ||
| Success only | 27.9 ± 3.2 | 43.5 ± 9.1 | 43.2 ± 6.2 | 36.3 ± 5.2 | 0.27 | |
| Specific (2 tasks) | Success rate n (%) | 211 (84.4%) | 216 (86.4%) | 214 (85.6%) | 217 (86.8%) | 0.88 |
| Time (sec) mean ± SEM | 51.8 ± 3.2 | 55.1 ± 3.4 | 50.9 ± 3.2 | 53.4 ± 3.4 | ||
| Success only | 51.9 ± 3.5 | 56.2 ± 3.6 | 51.2 ± 3.2 | 52.1 ± 3.2 | 0.66 | |
| Findability (2 tasks) | Success rate n (%) | 225 (90.0%) | 219 (87.6%) | 225 (90.0%) | 214 (85.6%) | 0.40 |
| Time (sec) mean ± SEM) | 44.1 ± 3.3 | 50.9 ± 4.9 | 47.1 ± 3.9 | 44.4 ± 3.4 | ||
| Success only | 43.4 ± 3.2 | 44.9 ± 4.5 | 44.5 ± 3.8 | 42.6 ± 3.8 | 0.90 | |
| All 5 tasks | Success rate n (%) | 488 (78.08%) | 490 (78.40%) | 492 (78.72%) | 489 (78.24%) | 0.99 |
| Time (sec) mean ± SEM | 43.6 ± 2.6 | 49.4 ± 3.6 | 45.7 ± 3.1 | 45.7 ± 2.9 | ||
| Success only | 45.4 ± 2.8 | 49.7 ± 3.5 | 47.3 ± 3.2 | 46.1 ± 3.1 | 0.78 | |
| Shopping Task | Time to First Fixation TTFF (Seconds) | FOPL Designs | ||||
|---|---|---|---|---|---|---|
| Arm 1 Magnifying Glass | Arm 2 Exclamation Point | Arm 3 Black High In | Arm 4 Red High In | * p-Value | ||
| Non-specific (1 task) | TTFF success + fail | 8.12 ± 1.1 | 6.49 ± 1.0 | 8.43 ± 1.2 | 9.18 ± 1.1 | 0.14 |
| TTFF success only | 8.21 ± 1.8 | 7.01 ± 2.2 | 5.66 ± 0.9 | 8.7 ± 1.8 | 0.35 | |
| Specific (2 tasks) | TTFF success + fail | 11.35 ± 1.2 | 9.08 ± 0.9 | 12.76 ± 1.3 | 9.12 ± 1.1 | 0.03 |
| TTFF success only | 11.65 ± 1.3 | 8.98 ± 0.9 | 12.6 ± 1.3 | 9.2 ± 1.2 | 0.03 | |
| Findability (2 tasks) | TTFF success + fail | 10.52 ± 1.0 | 9.23 ± 1.1 | 10.74 ± 1.1 | 9.16 ± 1.3 | 0.39 |
| TTFF success only | 9.18 ± 0.9 | 9.61 ± 1.2 | 10.12 ± 1.2 | 9.45 ± 1.4 | 0.83 | |
| All 5 tasks | TTFF success + fail | 10.43 ± 0.7 | 8.66 ± 0.6 | 11.12 ± 0.9 | 9.15 ± 0.8 | 0.02 |
| TTFF success only | 10.10 ± 0.8 | 9.08 ± 0.6 | 10.69 ± 1.0 | 9.22 ± 1.0 | 0.07 | |
| Product Factors | Control (Current Labeling) N = 125 | All FOPL Arms N = 500 | ||||
|---|---|---|---|---|---|---|
| Success | Failure | p-Value | Success | Failure | * p-Value | |
| Taste | 44% | 61% | <0.0001 | 41% | 61% | <0.0001 |
| Brand name | 39% | 55% | <0.0001 | 35% | 48% | <0.0001 |
| Perceived healthiness | 31% | 25% | 0.02 | 23% | 22% | 0.46 |
| Nutrition information | 48% | 28% | <0.0001 | 66% | 46% | <0.0001 |
| Ingredients | 22% | 26% | 0.06 | 14% | 14% | 0.97 |
| Other | 3% | 2% | 0.45 | 2% | 2% | 0.24 |
| Use of FOPL | Task Type | |||
|---|---|---|---|---|
| Non-Specific | Specific | Findability | * p-Value | |
| Compare foods | 70% | 68% | 78% | <0.001 |
| Choose foods without FOPL | 69% | 68% | N/A | 0.9 |
| Choose healthier foods | 40% | 30% | N/A | 0.07 |
Publisher’s Note: MDPI stays neutral with regard to jurisdictional claims in published maps and institutional affiliations. |
© 2020 by the authors. Licensee MDPI, Basel, Switzerland. This article is an open access article distributed under the terms and conditions of the Creative Commons Attribution (CC BY) license (http://creativecommons.org/licenses/by/4.0/).
Share and Cite
Mansfield, E.D.; Ibanez, D.; Chen, F.; Chen, E.; de Grandpré, E. Efficacy of “High in” Nutrient Specific Front of Package Labels—A Retail Experiment with Canadians of Varying Health Literacy Levels. Nutrients 2020, 12, 3199. https://0-doi-org.brum.beds.ac.uk/10.3390/nu12103199
Mansfield ED, Ibanez D, Chen F, Chen E, de Grandpré E. Efficacy of “High in” Nutrient Specific Front of Package Labels—A Retail Experiment with Canadians of Varying Health Literacy Levels. Nutrients. 2020; 12(10):3199. https://0-doi-org.brum.beds.ac.uk/10.3390/nu12103199
Chicago/Turabian StyleMansfield, Elizabeth D., Dominique Ibanez, Fuqi Chen, Emily Chen, and Elaine de Grandpré. 2020. "Efficacy of “High in” Nutrient Specific Front of Package Labels—A Retail Experiment with Canadians of Varying Health Literacy Levels" Nutrients 12, no. 10: 3199. https://0-doi-org.brum.beds.ac.uk/10.3390/nu12103199