The Impact of Sample Type on Vitamin D Quantification and Clinical Classification during Pregnancy


Abstract
:1. Introduction
2. Materials and Methods
Statistical Analysis
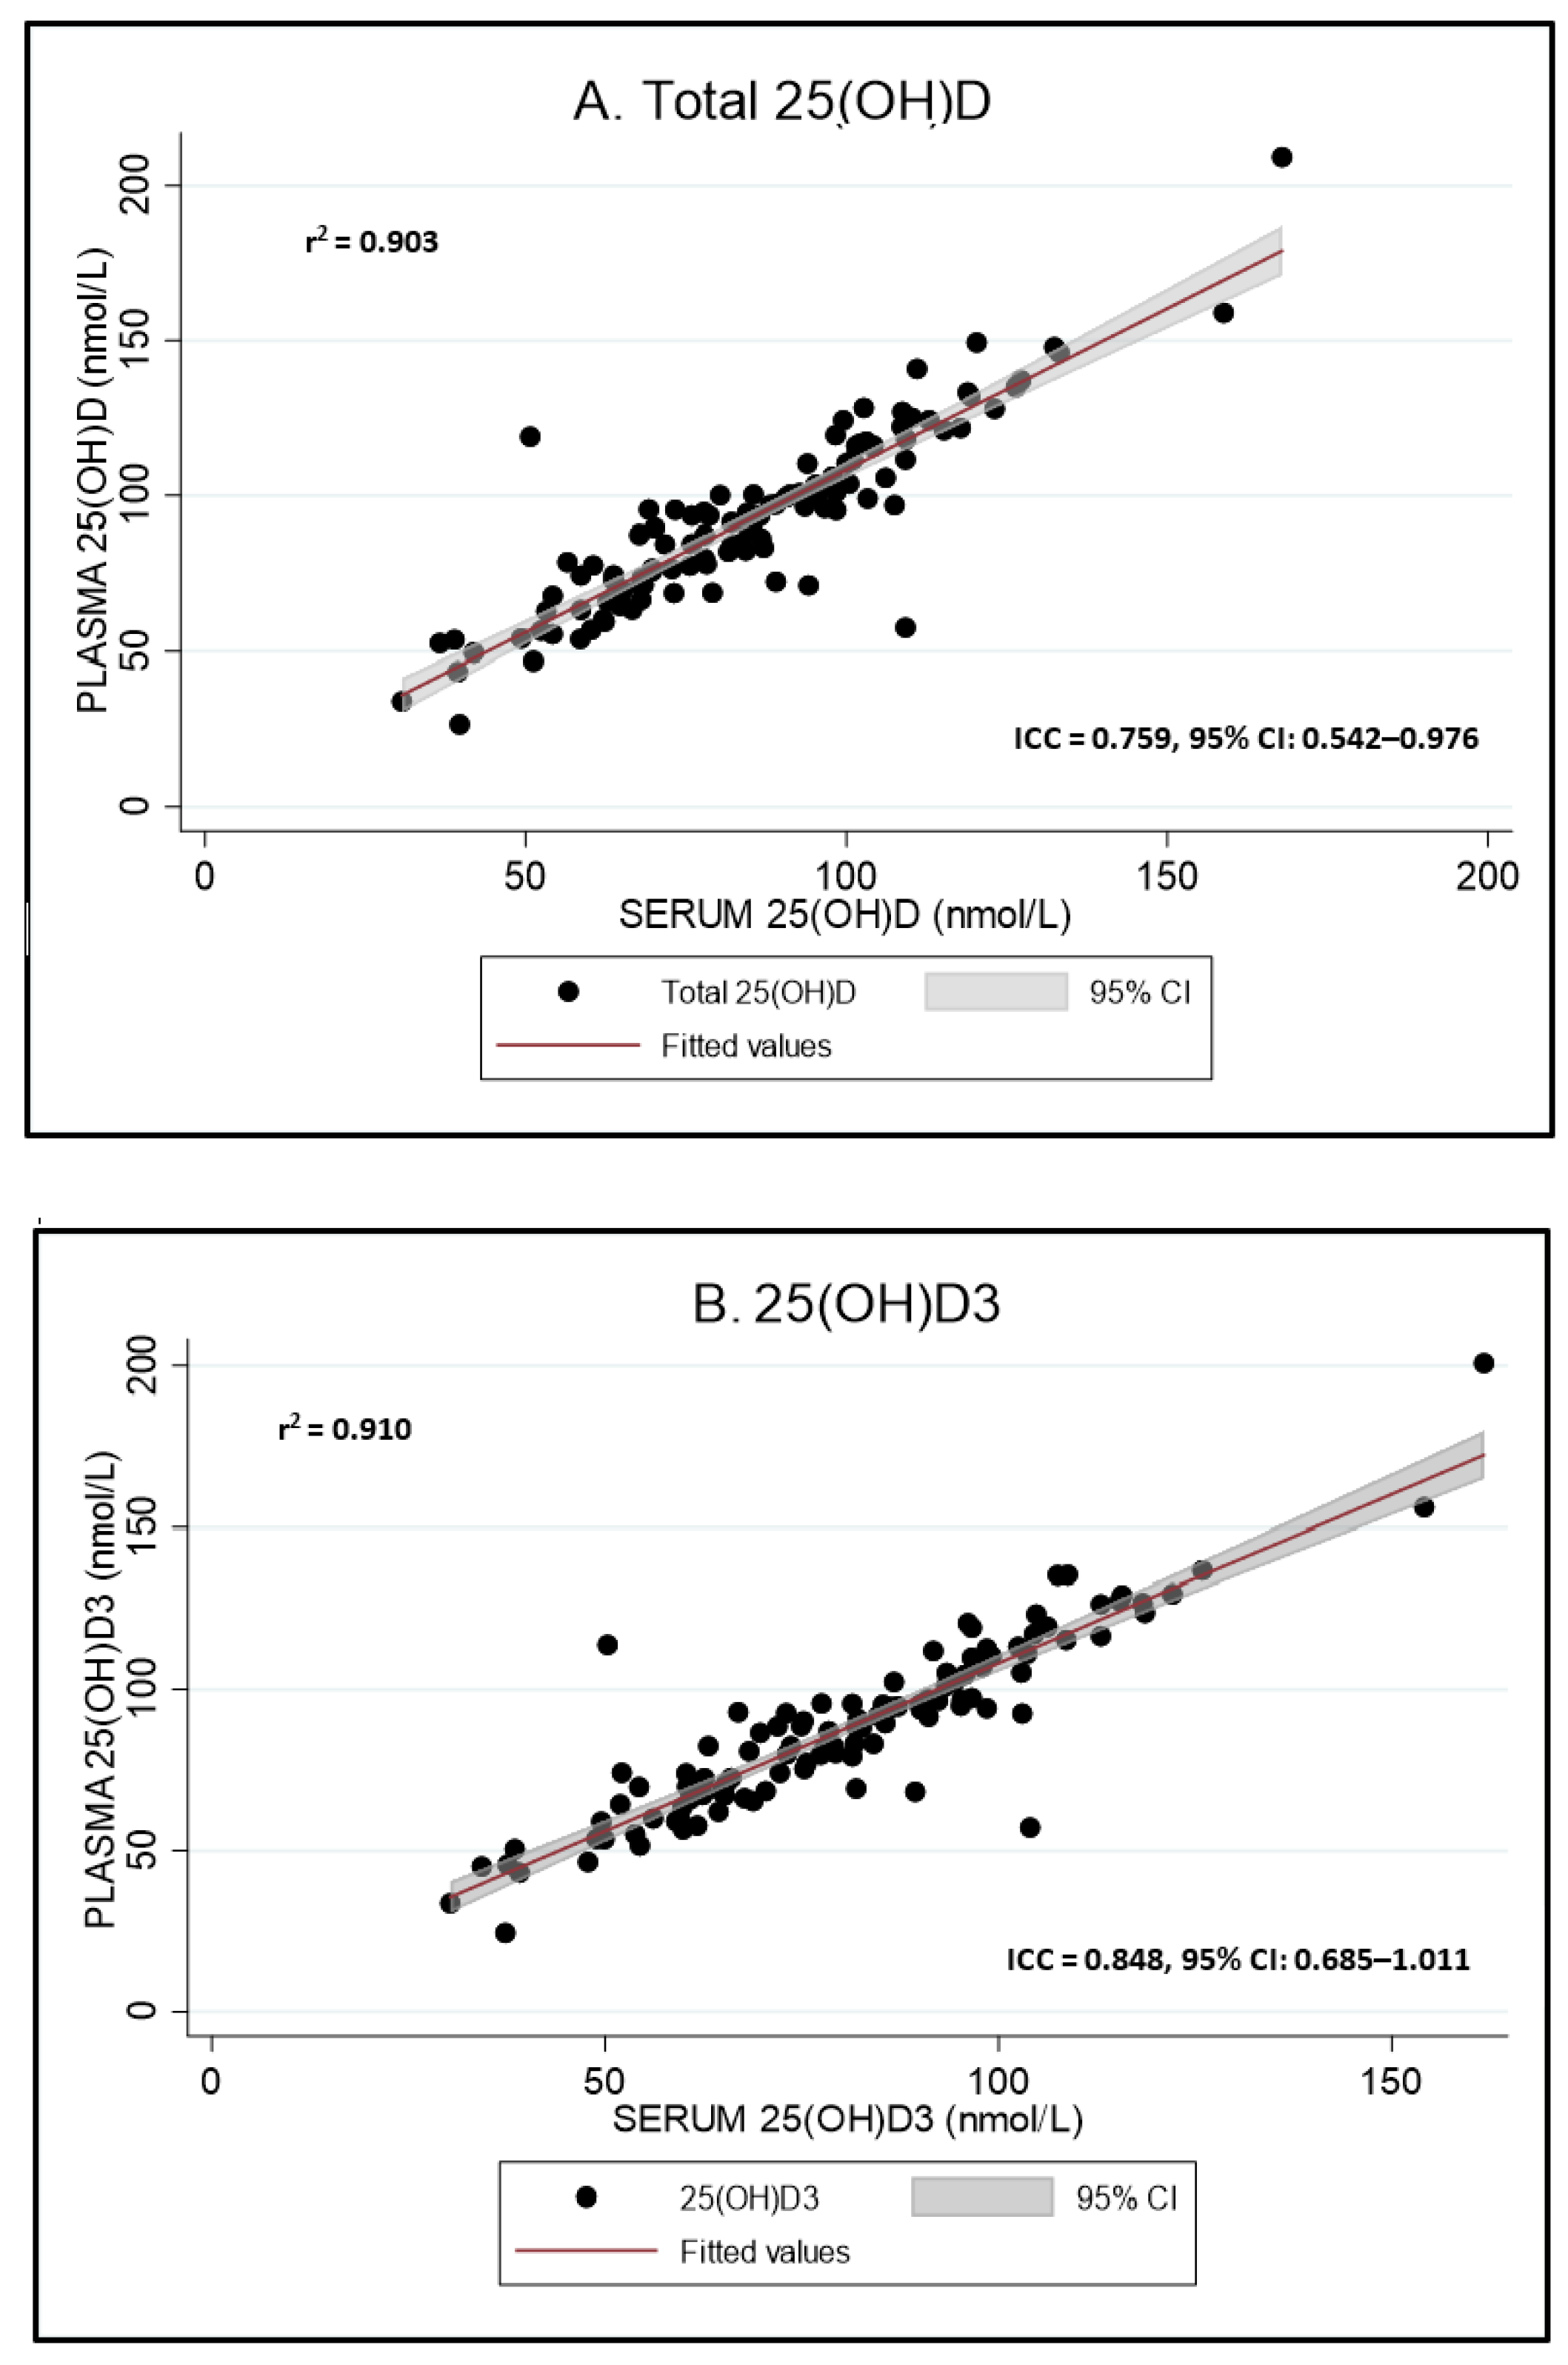
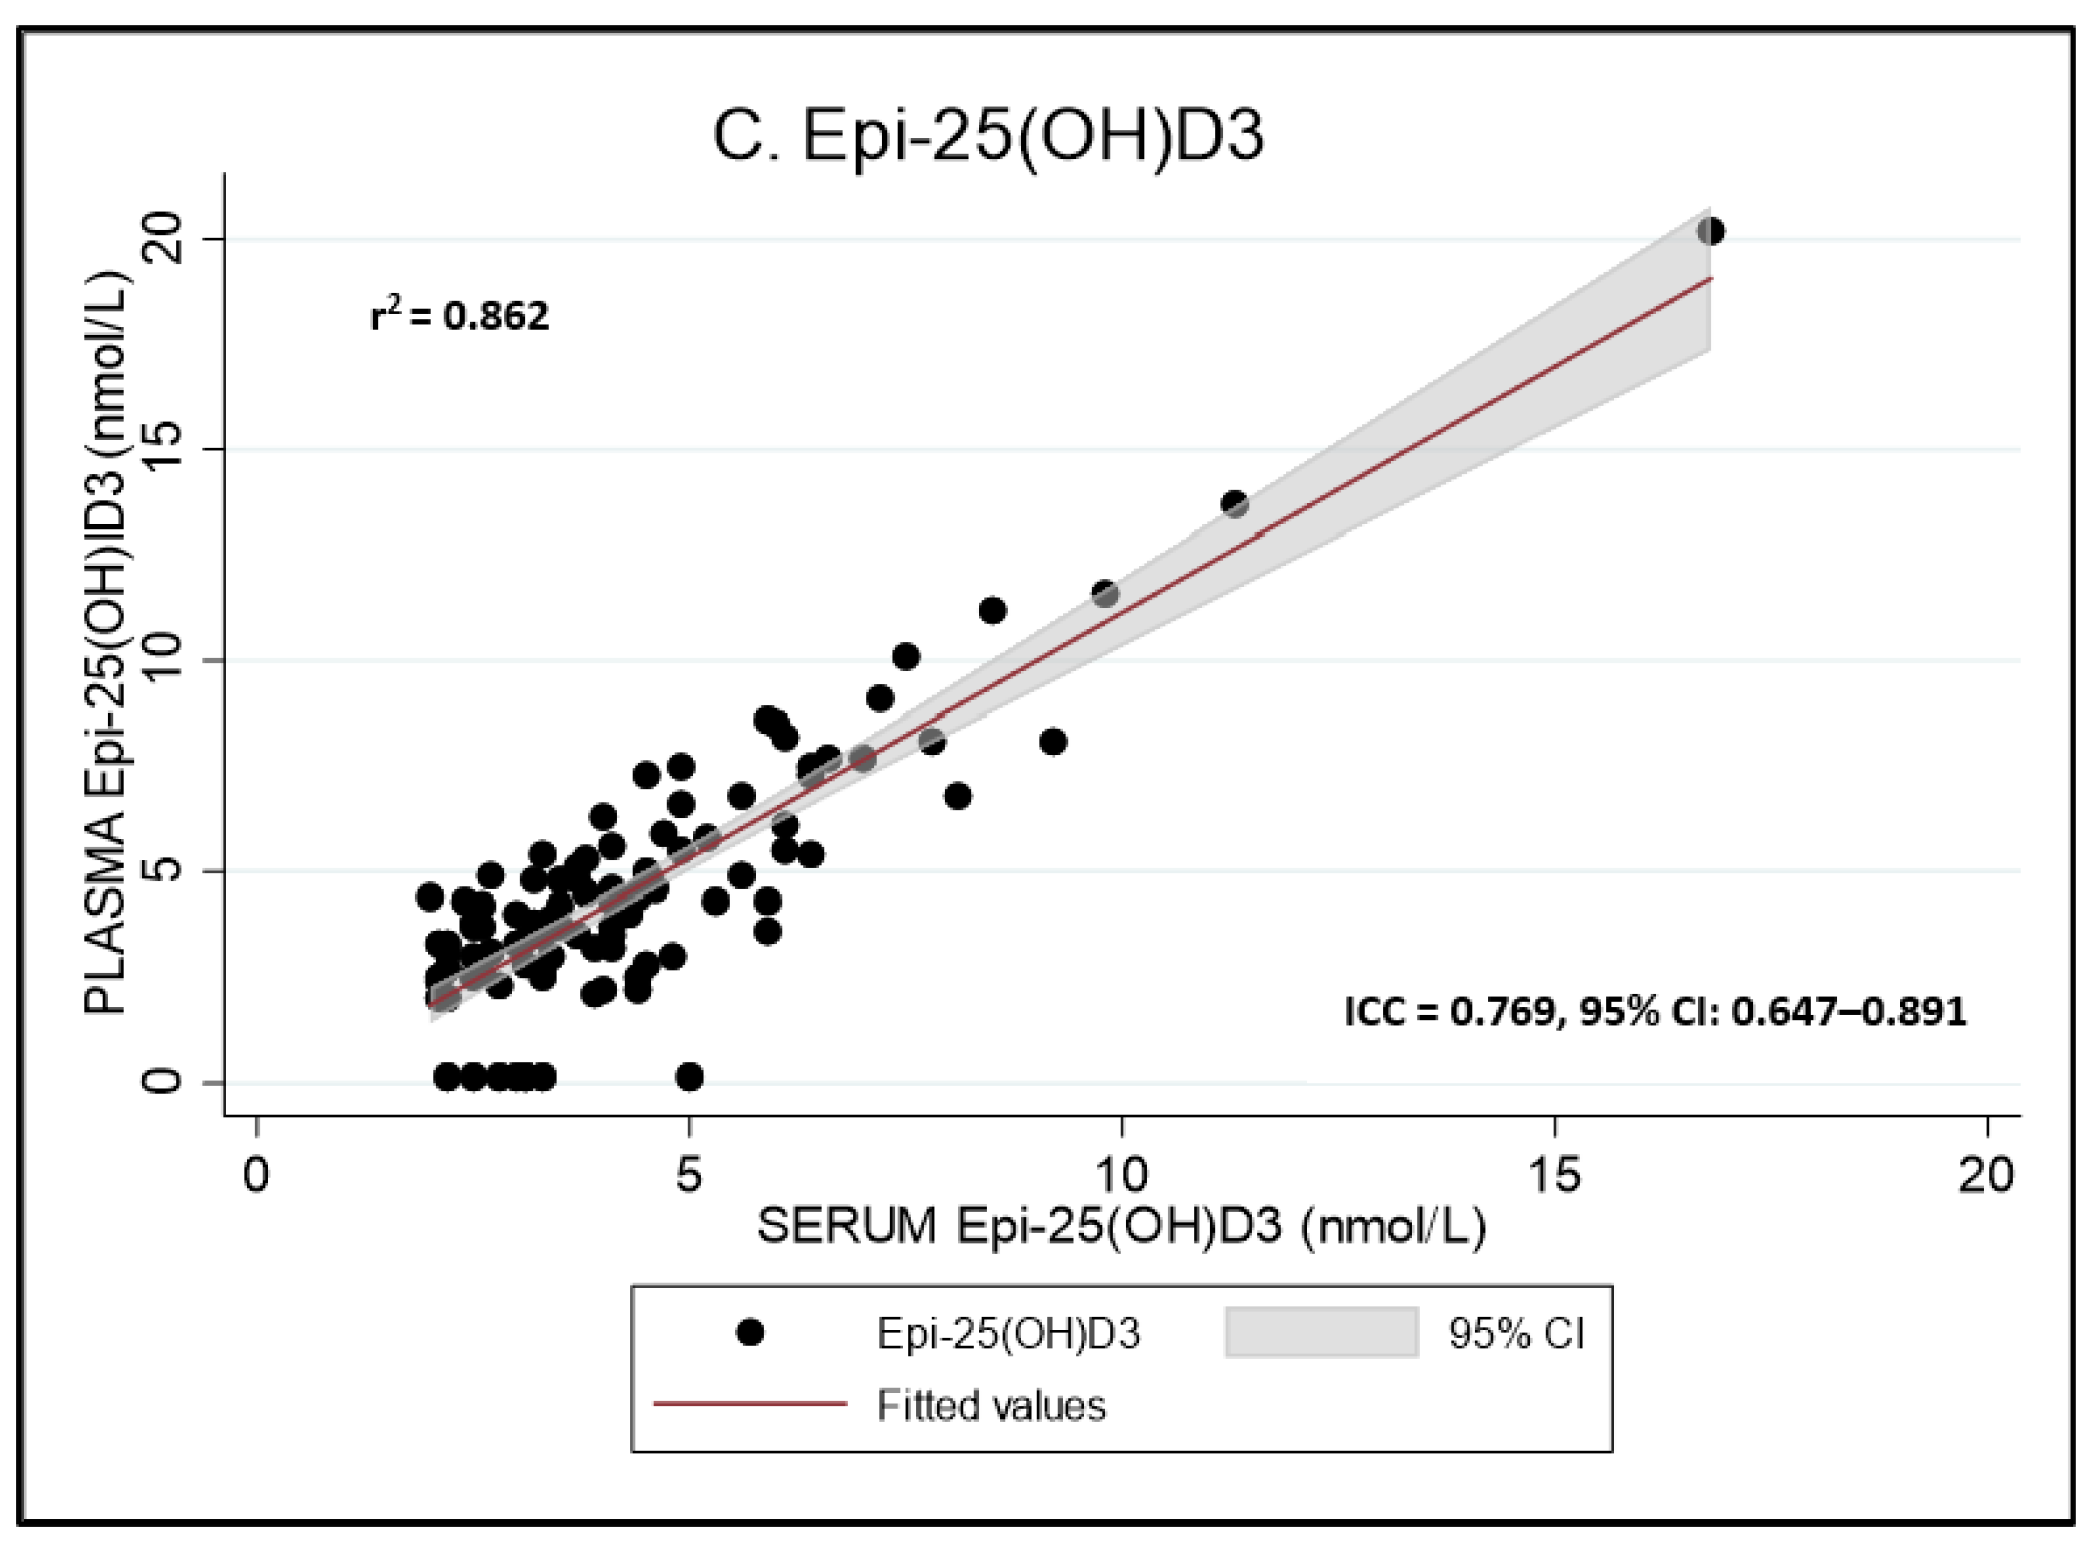
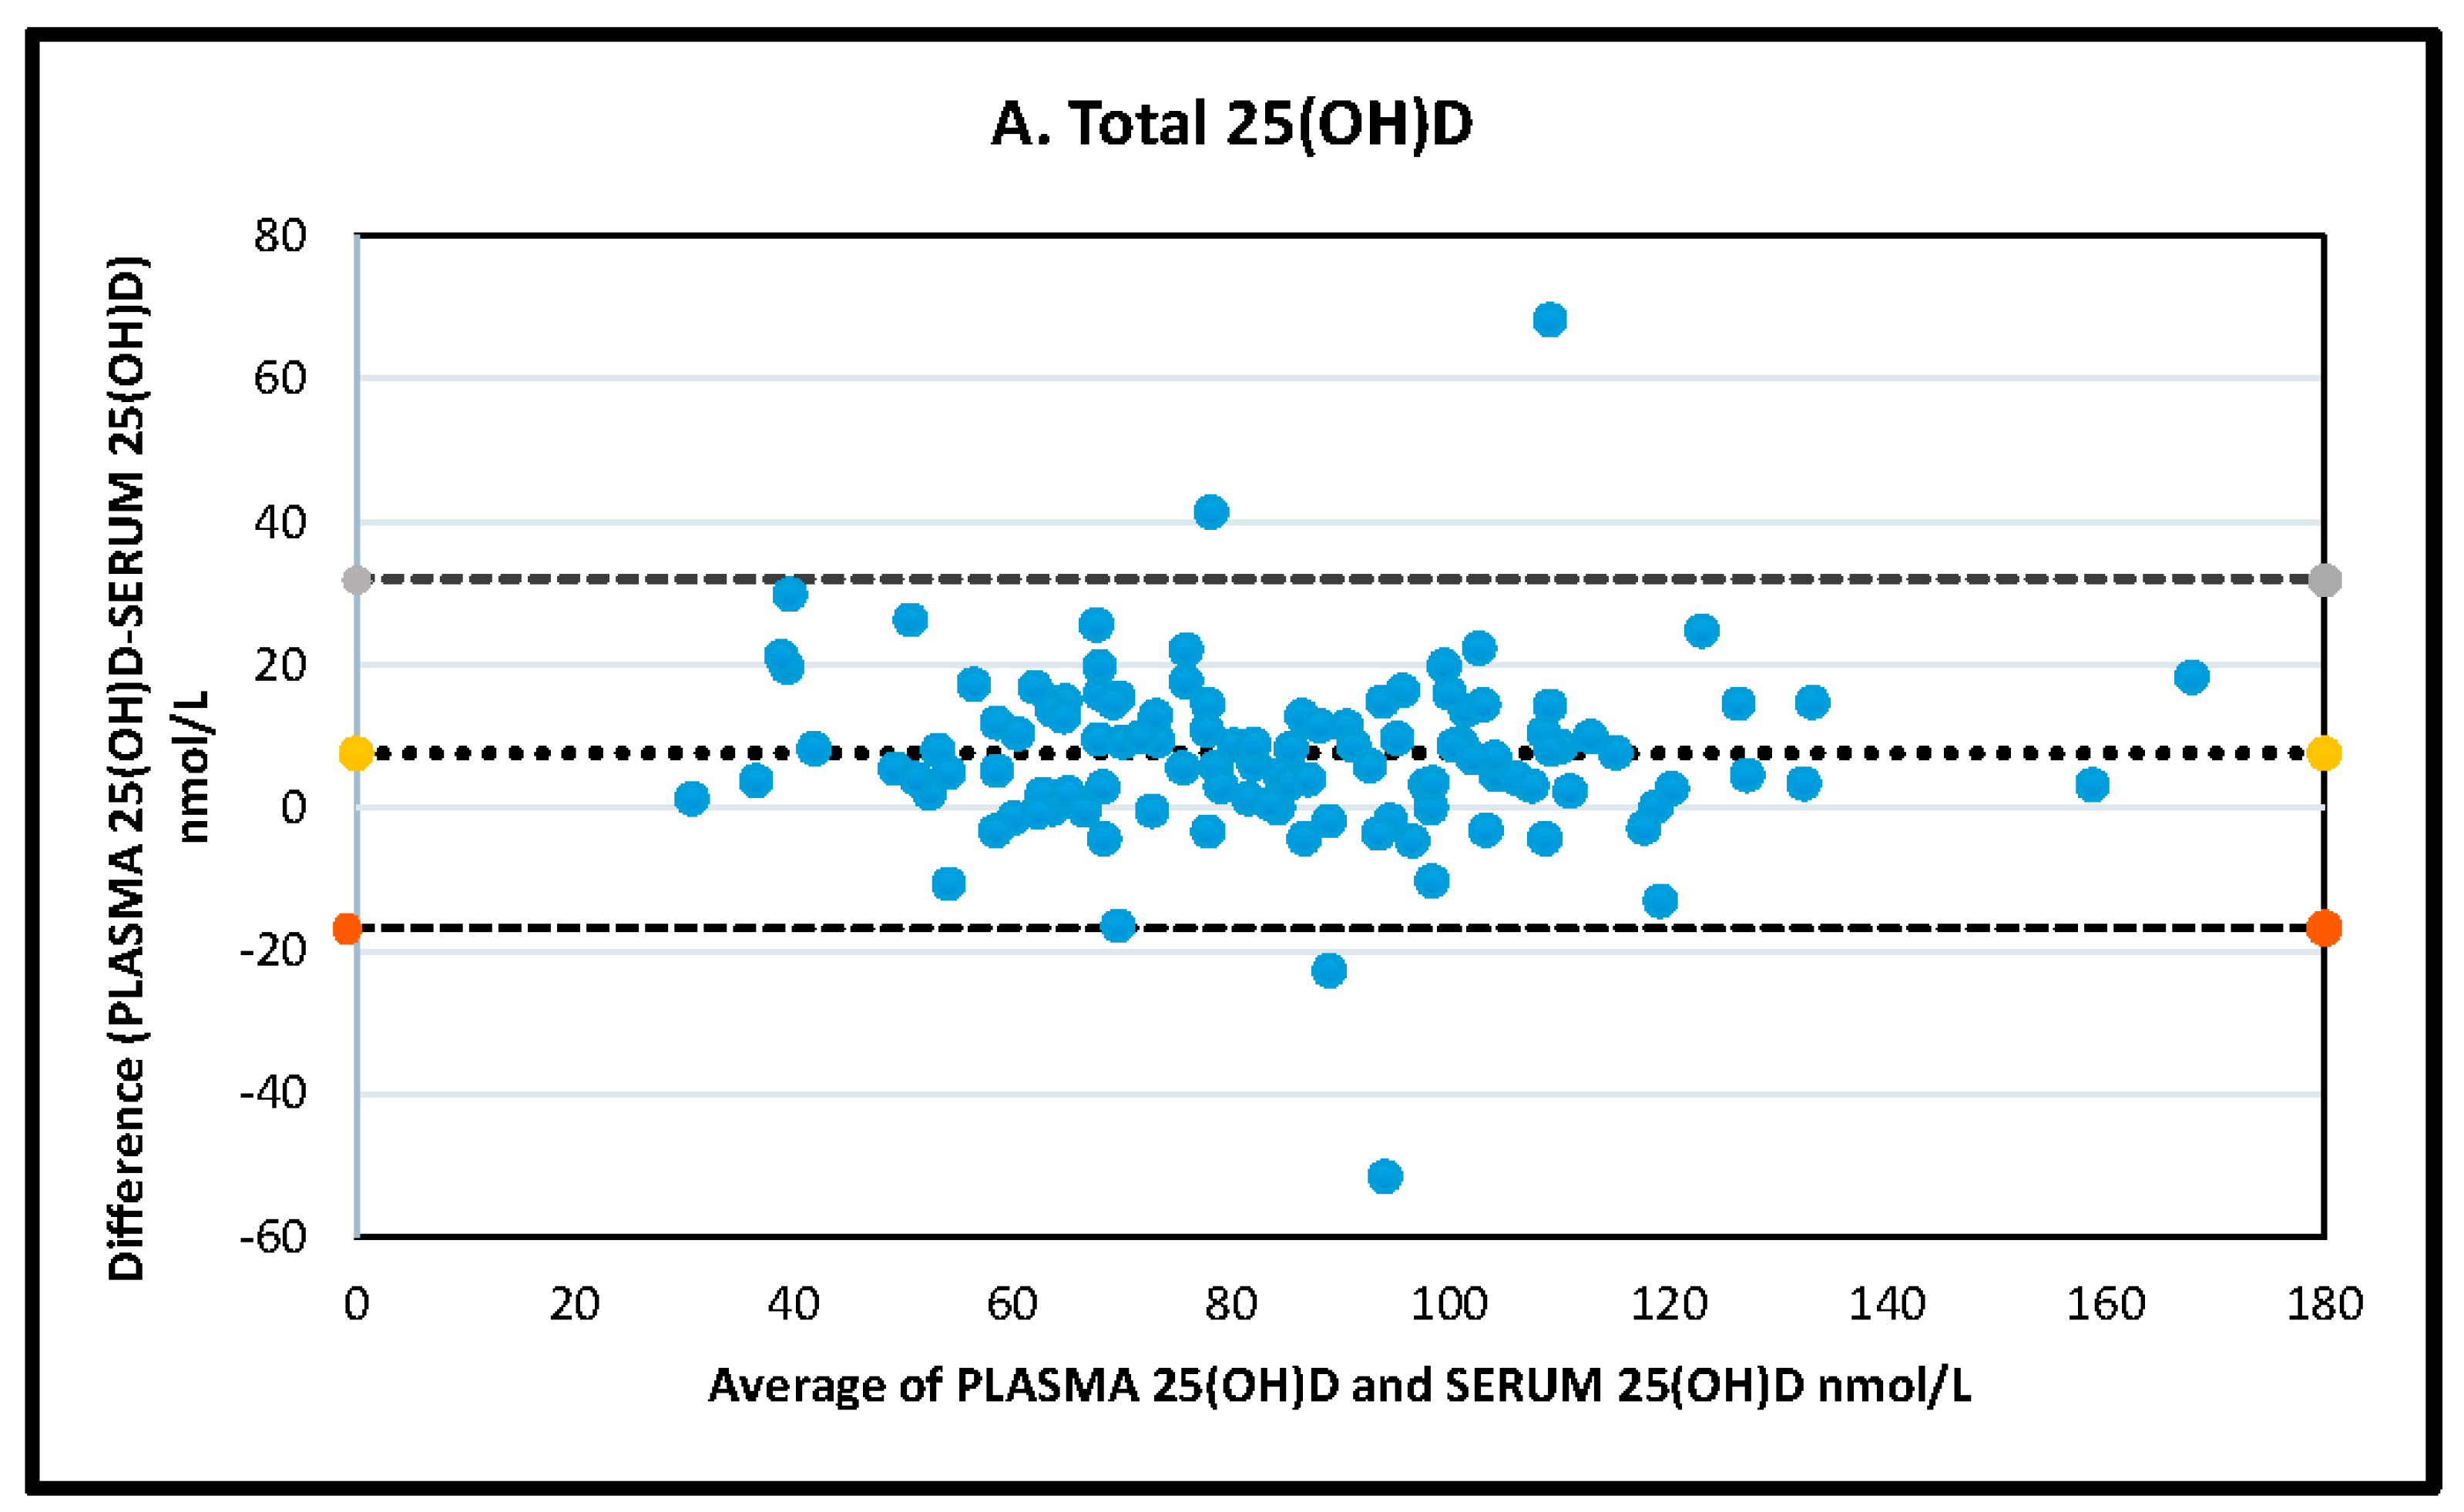
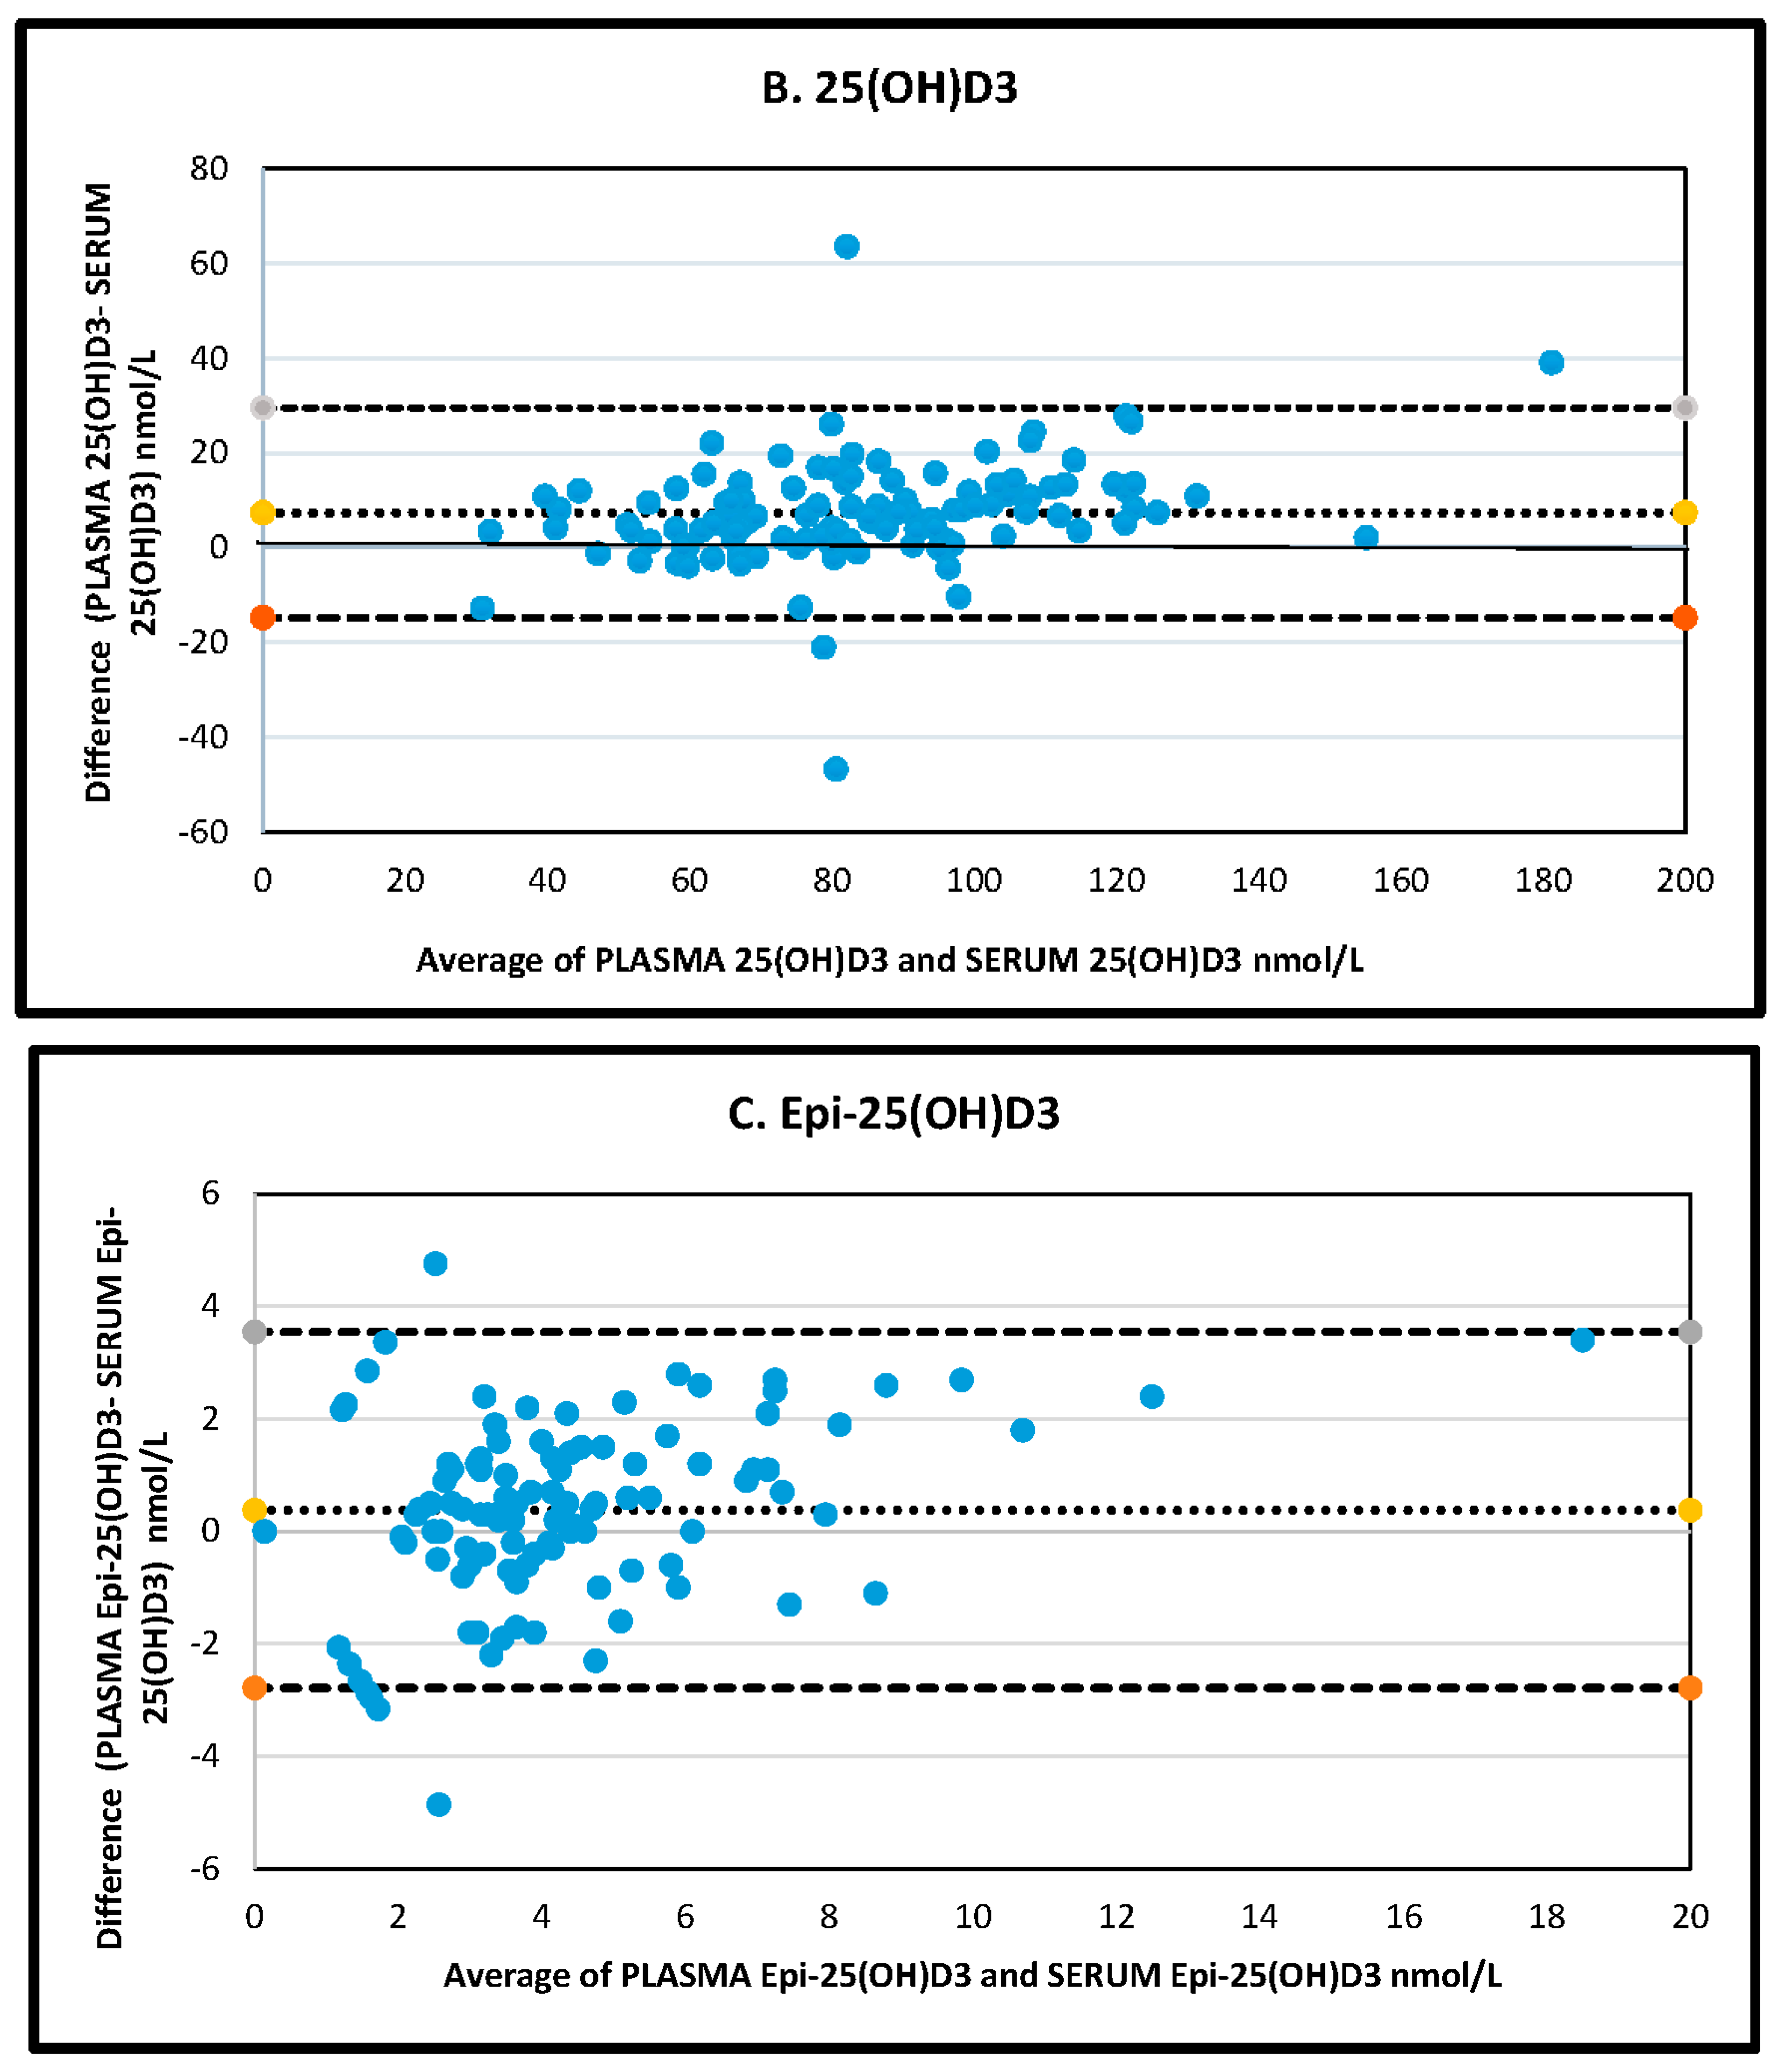
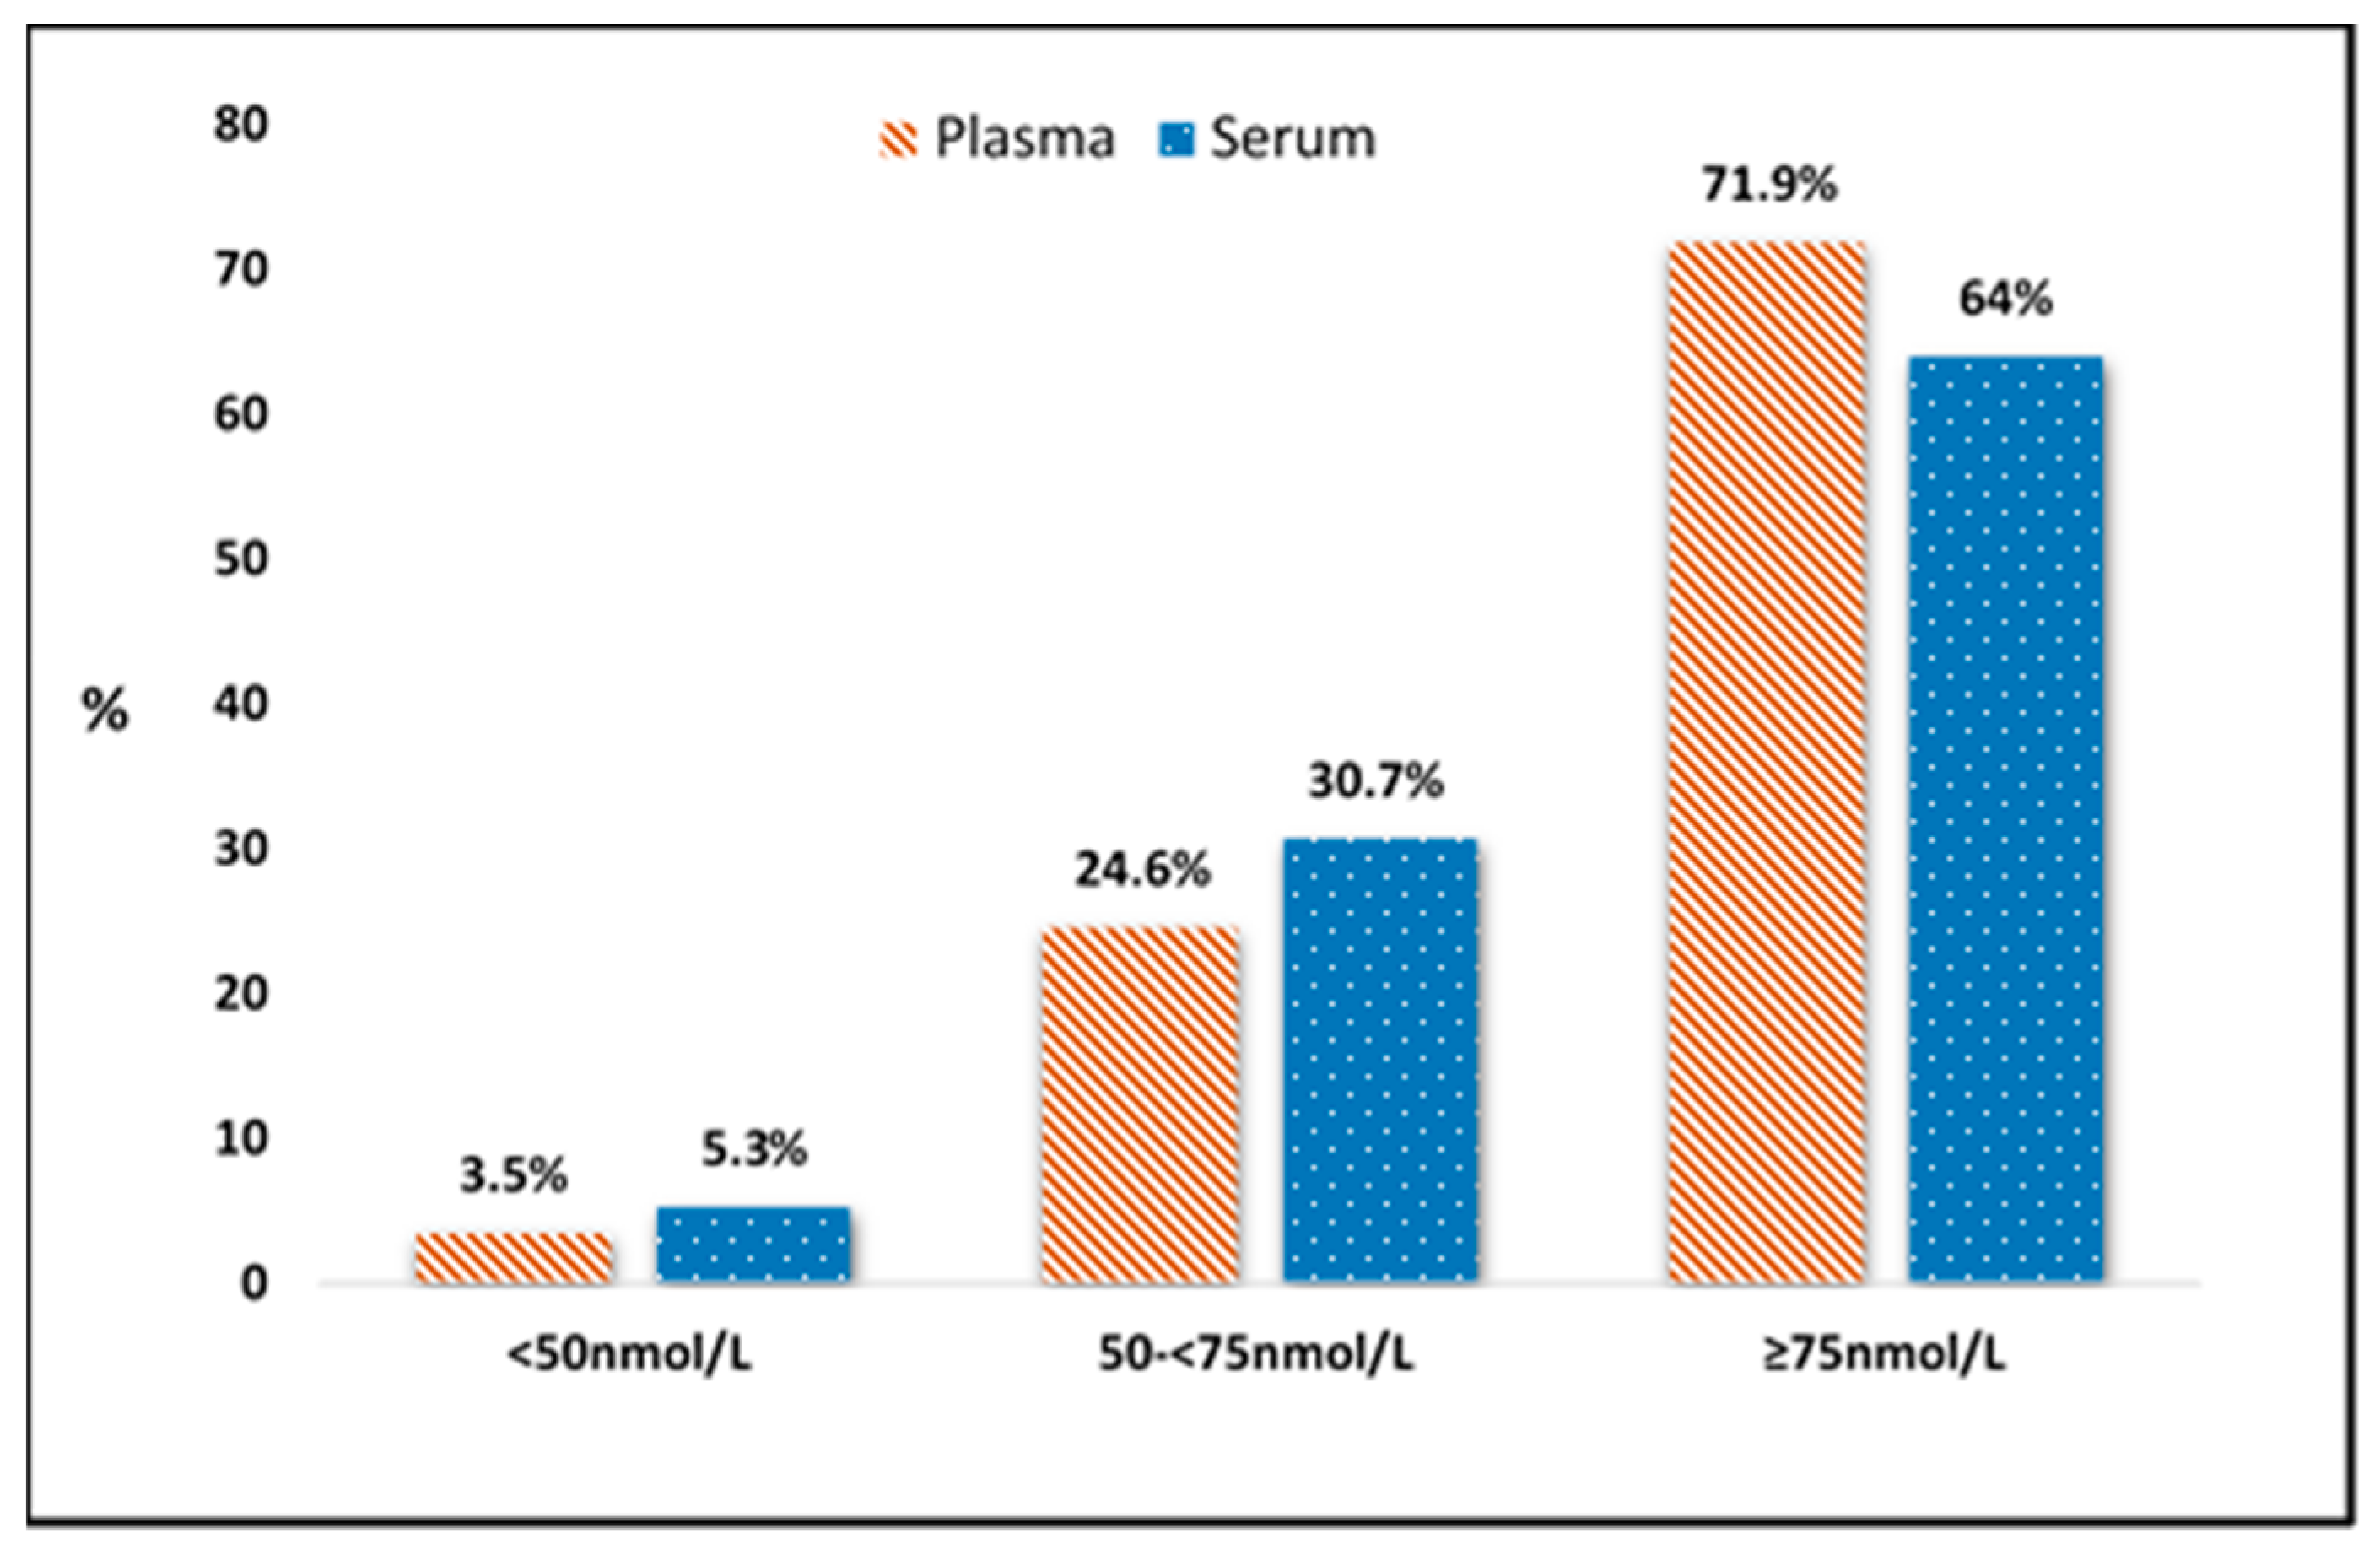
3. Results
4. Discussion
Author Contributions
Funding
Acknowledgments
Conflicts of Interest
References
- National Institutes of Health. Vitamin D: Fact Sheet for Health Professionals. 2014. Available online: https://ods.od.nih.gov/factsheets/VitaminD-HealthProfessional (accessed on 1 October 2020).
- Zhao, S.; Gardner, K.; Taylor, W.; Marks, E.; Goodson, N. Vitamin D assessment in primary care: Changing patterns of testing. Lond. J. Prim. Care (Abingdon) 2015, 7, 15–22. [Google Scholar] [CrossRef] [Green Version]
- Gordon, L.; Waterhouse, M.; Reid, I.R.; Neale, R.E. The vitamin D testing rate is again rising, despite new MBS testing criteria. Med. J. Aust. 2020, 213. [Google Scholar] [CrossRef]
- Colak, A.; Toprak, B.; Dogan, N.; Ustuner, F. Effect of sample type, centrifugation and storage conditions on vitamin D concentration. Biochem. Med. 2013, 23, 321–325. [Google Scholar] [CrossRef] [PubMed] [Green Version]
- Yu, C.-L.; Falk, R.T.; Kimlin, M.G.; Rajaraman, P.; Sigurdson, A.J.; Horst, R.L.; Cosentino, L.M.; Linet, M.S.; Freedman, D.M. The impact of delayed blood centrifuging, choice of collection tube, and type of assay on 25-hydroxyvitamin D concentrations. Cancer Causes Control CCC 2010, 21, 643–648. [Google Scholar] [CrossRef] [PubMed] [Green Version]
- Lissner, D.; Mason, R.S.; Posen, S. Stability of vitamin D metabolites in human blood serum and plasma. Clin. Chem. 1981, 27, 773–774. [Google Scholar] [CrossRef]
- Norris, R.L.; Thomas, M.J.; Craswell, P.W. Assessment of a two-step high-performance liquid chromatographic assay using dual-wavelength ultraviolet monitoring for 25-hydroxyergocalciferol and 25-hydroxycholecalciferol in human serum or plasma. J. Chromatogr. 1986, 381, 53–61. [Google Scholar] [CrossRef]
- Farrell, C.-J.L.; Martin, S.; McWhinney, B.; Straub, I.; Williams, P.; Herrmann, M. State-of-the-Art Vitamin D Assays: A Comparison of Automated Immunoassays with Liquid Chromatography-Tandem Mass Spectrometry Methods. Clin. Chem. 2012, 58, 531–542. [Google Scholar] [CrossRef]
- Yetley, E.A.; Pfeiffer, C.M.; Schleicher, R.L.; Phinney, K.W.; Lacher, D.A.; Christakos, S.; Eckfeldt, J.H.; Fleet, J.C.; Howard, G.; Hoofnagle, A.N.; et al. NHANES monitoring of serum 25-hydroxyvitamin D: A roundtable summary. J. Nutr. 2010, 140, 2030s–2045s. [Google Scholar]
- de la Hunty, A.; Wallace, A.M.; Gibson, S.; Viljakainen, H.; Lamberg-Allardt, C.; Ashwell, M. UK Food Standards Agency Workshop Consensus Report: The choice of method for measuring 25-hydroxyvitamin D to estimate vitamin D status for the UK National Diet and Nutrition Survey. Br. J. Nutr. 2010, 104, 612–619. [Google Scholar] [CrossRef] [Green Version]
- Chen, H.; McCoy, L.; Schleicher, R.; Pfeiffer, C. Measurement of 25-hydroxyvitamin D-3 (25OHD(3)) and 25-hydroxyvitamin D-2 (25OHD(2)) in human serum using liquid chromatography-tandem mass spectrometry and its comparison to a radioimmunoassay method. Clin. Chim. Acta Int. J. Clin. Chem. 2008, 391, 6–12. [Google Scholar] [CrossRef]
- Clarke, M.W.; Tuckey, R.C.; Gorman, S.; Holt, B.; Hart, P.H. Optimized 25-hydroxyvitamin D analysis using liquid-liquid extraction with 2D separation with LC/MS/MS detection, provides superior precision compared to conventional assays. Metabolomics 2013, 9, 1031–1040. [Google Scholar] [CrossRef]
- Wise, S.A.; Phinney, K.W.; Tai, S.S.; Camara, J.E.; Myers, G.L.; Durazo-Arvizu, R.; Tian, L.; Hoofnagle, A.N.; Bachmann, L.M.; Young, I.S.; et al. Baseline Assessment of 25-Hydroxyvitamin D Assay Performance: A Vitamin D Standardization Program (VDSP) Interlaboratory Comparison Study. J. AOAC Int. 2017, 100, 1244–1252. [Google Scholar] [CrossRef]
- Zhang, S.W.; Jian, W.; Sullivan, S.; Sankaran, B.; Edom, R.W.; Weng, N.; Sharkey, D. Development and validation of an LC-MS/MS based method for quantification of 25 hydroxyvitamin D2 and 25 hydroxyvitamin D3 in human serum and plasma. J. Chromatogr. B Anal. Technol. Biomed. Life Sci. 2014, 961, 62–70. [Google Scholar] [CrossRef] [PubMed]
- Abu Kassim, N.S.; Gomes, F.P.; Shaw, P.N.; Hewavitharana, A.K. Simultaneous quantitative analysis of nine vitamin D compounds in human blood using LC-MS/MS. Bioanalysis 2016, 8, 397–411. [Google Scholar] [CrossRef] [PubMed]
- Albarhani, A.A.; Collier, F.; Greaves, R.F.; Ponsonby, A.L.; Allen, K.J.; Vuillermin, P.J.; Roche, P.; Clarke, M.W.; BIS Steering Committee. Vitamins D and A can be successfully measured by LC-MS/MS in cord blood diluted plasma. Clin. Biochem. 2015, 48, 1105–1112. [Google Scholar] [CrossRef] [PubMed]
- Mena-Bravo, A.; Priego-Capote, F.; Luque de Castro, M.D. Study of blood collection and sample preparation for analysis of vitamin D and its metabolites by liquid chromatography-tandem mass spectrometry. Anal. Chim. Acta 2015, 879, 69–76. [Google Scholar] [CrossRef]
- Sempos, C.T.; Vesper, H.W.; Phinney, K.W.; Thienpont, L.M.; Coates, P.M. Vitamin D status as an international issue: National surveys and the problem of standardization. Scand. J. Clin. Lab. Investig. Suppl. 2012, 243, 32–40. [Google Scholar]
- Karras, S.N.; Wagner, C.L.; Castracane, V.D. Understanding vitamin D metabolism in pregnancy: From physiology to pathophysiology and clinical outcomes. Metabolism 2018, 86, 112–123. [Google Scholar] [CrossRef]
- Fernando, M.; Ellery, S.J.; Marquina, C.; Lim, S.; Naderpoor, N.; Mousa, A. Vitamin D-Binding Protein in Pregnancy and Reproductive Health. Nutrients 2020, 12, 1489. [Google Scholar] [CrossRef]
- Beentjes, C.H.L.; Taylor-King, J.P.; Bayani, A.; Davis, C.N.; Dunster, J.L.; Jabbari, S.; Mirams, G.; Jenkinson, C.; Kilby, M.; Hewison, M.; et al. Defining vitamin D status using multi-metabolite mathematical modelling: A pregnancy perspective. J. Steroid Biochem. Mol. Biol. 2019, 190, 152–160. [Google Scholar] [CrossRef]
- Murphy, V.E.; Jensen, M.E.; Mattes, J.; Hensley, M.J.; Giles, W.B.; Peek, M.J.; Bisits, A.; Callaway, L.K.; McCaffery, K.; Barrett, H.L.; et al. The Breathing for Life Trial: A randomised controlled trial of fractional exhaled nitric oxide (FENO)-based management of asthma during pregnancy and its impact on perinatal outcomes and infant and childhood respiratory health. BMC Pregnancy Childbirth 2016, 16. [Google Scholar] [CrossRef] [PubMed] [Green Version]
- Bartolucci, A.A. Limits of Calibration. Introduction to Statistical Analysis of Laboratory Data; John Wiley & Sons: New Jersey, NJ, USA, 2016; Chapter 6. [Google Scholar]
- Holick, M.F.; Binkley, N.C.; Bischoff-Ferrari, H.A.; Gordon, C.M.; Hanley, D.A.; Heaney, R.P.; Hassan Murad, M.; Weaver, C.M. Evaluation, Treatment, and Prevention of Vitamin D Deficiency: An Endocrine Society Clinical Practice Guideline. J. Clin. Endocrinol. Metab. 2011, 96, 1911–1930. [Google Scholar] [CrossRef] [PubMed] [Green Version]
- Bland, J.M.; Altman, D.G. Statistical methods for assessing agreement between two methods of clinical measurement. Lancet 1986, 1, 307–310. [Google Scholar] [CrossRef]
- Department of Health. Clinical Practice Guidelines: Pregnancy Care; Australian Government, Department of Health: Canberra, Australia, 2018.
- Vieth, R.; Holick, M.F. The IOM—Endocrine Society Controversy on Recommended Vitamin D Targets. In Support of the Endocrine Society Position, 4th ed.; Feldman, D., Ed.; Academic Press: Cambridge, MA, USA, 2018; Chapter 57B; pp. 1091–1107. [Google Scholar]
- Bouillon, R.; Rosen, C. The IOM—Endocrine Society Controversy on Recommended Vitamin D Targets. In Support of the IOM Position, 4th ed.; Feldman, D., Ed.; Academic Press: Cambridge, MA, USA, 2018; Chapter 57A; pp. 1065–1089. [Google Scholar]
- Del Valle, H.B.; Yaktine, A.L.; Taylor, C.L.; Ross, A.C. Dietary Reference Intakes for Calcium and Vitamin D; National Academies Press: Washington, DC, USA, 2011. [Google Scholar]
- Sim, J.; Wright, C.C. The Kappa Statistic in Reliability Studies: Use, Interpretation, and Sample Size Requirements. Phys. Ther. 2005, 85, 257–268. [Google Scholar] [CrossRef] [Green Version]
- McHugh, M.L. Interrater reliability: The kappa statistic. Biochem. Med. 2012, 22, 276–282. [Google Scholar] [CrossRef]
- Stöckl, D.; Sluss, P.M.; Thienpont, L.M. Specifications for trueness and precision of a reference measurement system for serum/plasma 25-hydroxyvitamin D analysis. Clin. Chim. Acta 2009, 408, 8–13. [Google Scholar] [CrossRef]
- Sapan, C.V.; Lundblad, R.L. Considerations regarding the use of blood samples in the proteomic identification of biomarkers for cancer diagnosis. Cancer Genom. Proteom. 2006, 3, 227–230. [Google Scholar]
- Castle, M.C.; Cooke, W.J. Measurement of vitamin E in serum and plasma by high performance liquid chromatography with electrochemical detection. Ther. Drug Monit. 1985, 7, 364–368. [Google Scholar] [CrossRef]
- Greaves, R.F.; Woollard, G.A.; Hoad, K.E.; Walmsley, T.A.; Johnson, L.A.; Briscoe, S.; Koetsier, S.; Harrower, T.; Gill, J.P. Laboratory medicine best practice guideline: Vitamins a, e and the carotenoids in blood. Clin. Biochem. Rev. 2014, 35, 81–113. [Google Scholar]


| Total 25(OH)D | Minimum (nmol/L) | Maximum (nmol/L) | Mean (nmol/L) | SD (nmol/L) | CV% | p-Value * |
|---|---|---|---|---|---|---|
| PLASMA | 28.60 | 211.2 | 94.40 | 28.80 | 30.51 | |
| SERUM | 33.80 | 169.8 | 86.77 | 24.91 | 28.71 | <0.001 |
| 25(OH)D3 | ||||||
| PLASMA | 24.50 | 200.80 | 87.83 | 27.10 | 30.9 | |
| SERUM | 30.3 | 161.7 | 80.45 | 23.65 | 29.4 | <0.001 |
| 25(OH)D2 ‡ | ||||||
| PLASMA | <3.0 | 6.3 | 2.23 | 0.54 | 24.22 | |
| SERUM | <3.0 | 4.5 | 2.15 | 0.24 | 11.16 | 0.112 |
| Epi-25(OH)D3 ‡ | ||||||
| PLASMA | <2.0 | 20.2 | 4.44 | 2.81 | 63.29 | |
| SERUM | <2.0 | 16.8 | 4.05 | 2.28 | 56.30 | 0.003 |
Publisher’s Note: MDPI stays neutral with regard to jurisdictional claims in published maps and institutional affiliations. |
© 2020 by the authors. Licensee MDPI, Basel, Switzerland. This article is an open access article distributed under the terms and conditions of the Creative Commons Attribution (CC BY) license (http://creativecommons.org/licenses/by/4.0/).
Share and Cite
Harvey, S.M.; Murphy, V.E.; Gibson, P.G.; Clarke, M.; Jensen, M.E. The Impact of Sample Type on Vitamin D Quantification and Clinical Classification during Pregnancy. Nutrients 2020, 12, 3872. https://0-doi-org.brum.beds.ac.uk/10.3390/nu12123872
Harvey SM, Murphy VE, Gibson PG, Clarke M, Jensen ME. The Impact of Sample Type on Vitamin D Quantification and Clinical Classification during Pregnancy. Nutrients. 2020; 12(12):3872. https://0-doi-org.brum.beds.ac.uk/10.3390/nu12123872
Chicago/Turabian StyleHarvey, Soriah M., Vanessa E. Murphy, Peter G. Gibson, Michael Clarke, and Megan E. Jensen. 2020. "The Impact of Sample Type on Vitamin D Quantification and Clinical Classification during Pregnancy" Nutrients 12, no. 12: 3872. https://0-doi-org.brum.beds.ac.uk/10.3390/nu12123872