Usual Dietary Intake, Nutritional Adequacy and Food Sources of Calcium, Phosphorus, Magnesium and Vitamin D of Spanish Children Aged One to <10 Years. Findings from the EsNuPI Study †

 , , , , ,
  , , ,
, , ,  ,
,  ,
,  , and
, and
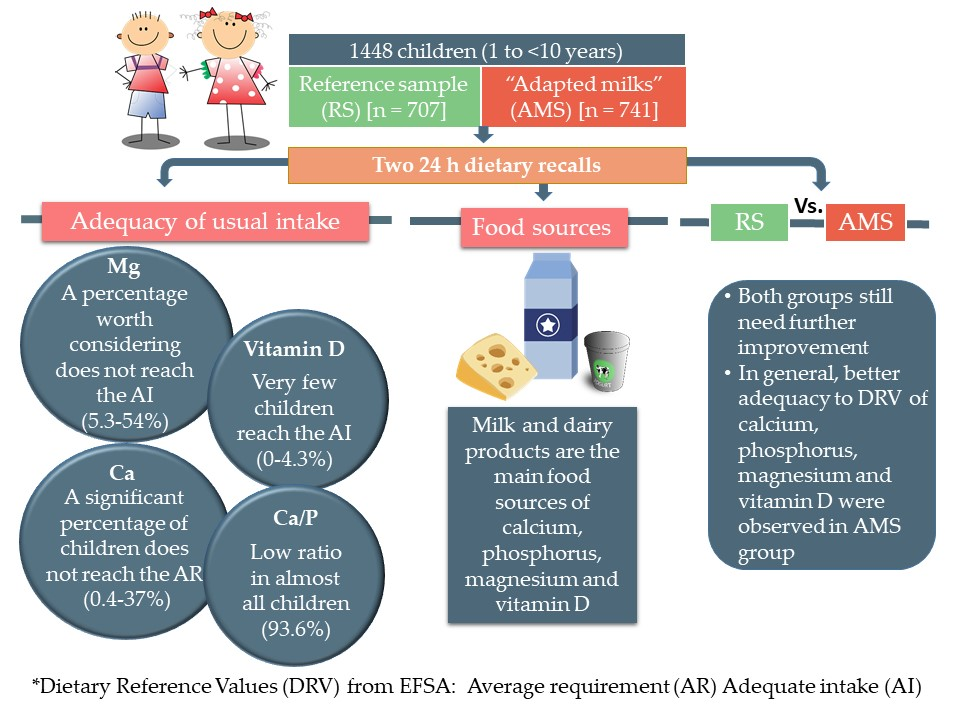
Abstract
:
1. Introduction
2. Materials and Methods
2.1. Study Design and Sample
2.2. Procedures and Data Collection
2.2.1. Socio-Demographic and Anthropometric Information
2.2.2. Physical Activity and Sedentary Behavior Questionnaire
2.2.3. Dietary Survey and Data Collection
2.3. Evaluation of Plausible Under- and Over-Reporters (Misreporting)
2.4. Statistical Analysis
3. Results
3.1. Description of the Sample
3.2. Usual Calcium, Phosphorus, Magnesium, and Vitamin D Intake in Children under Study
3.2.1. Calcium
3.2.2. Phosphorus
3.2.3. Magnesium
3.2.4. Vitamin D
3.2.5. Calcium, Phosphorus, Magnesium and Vitamin D in Plausible Reporters
3.3. Contribution of Food Sources to Calcium, Phosphorus, Magnesium and Vitamin D Reported Intakes
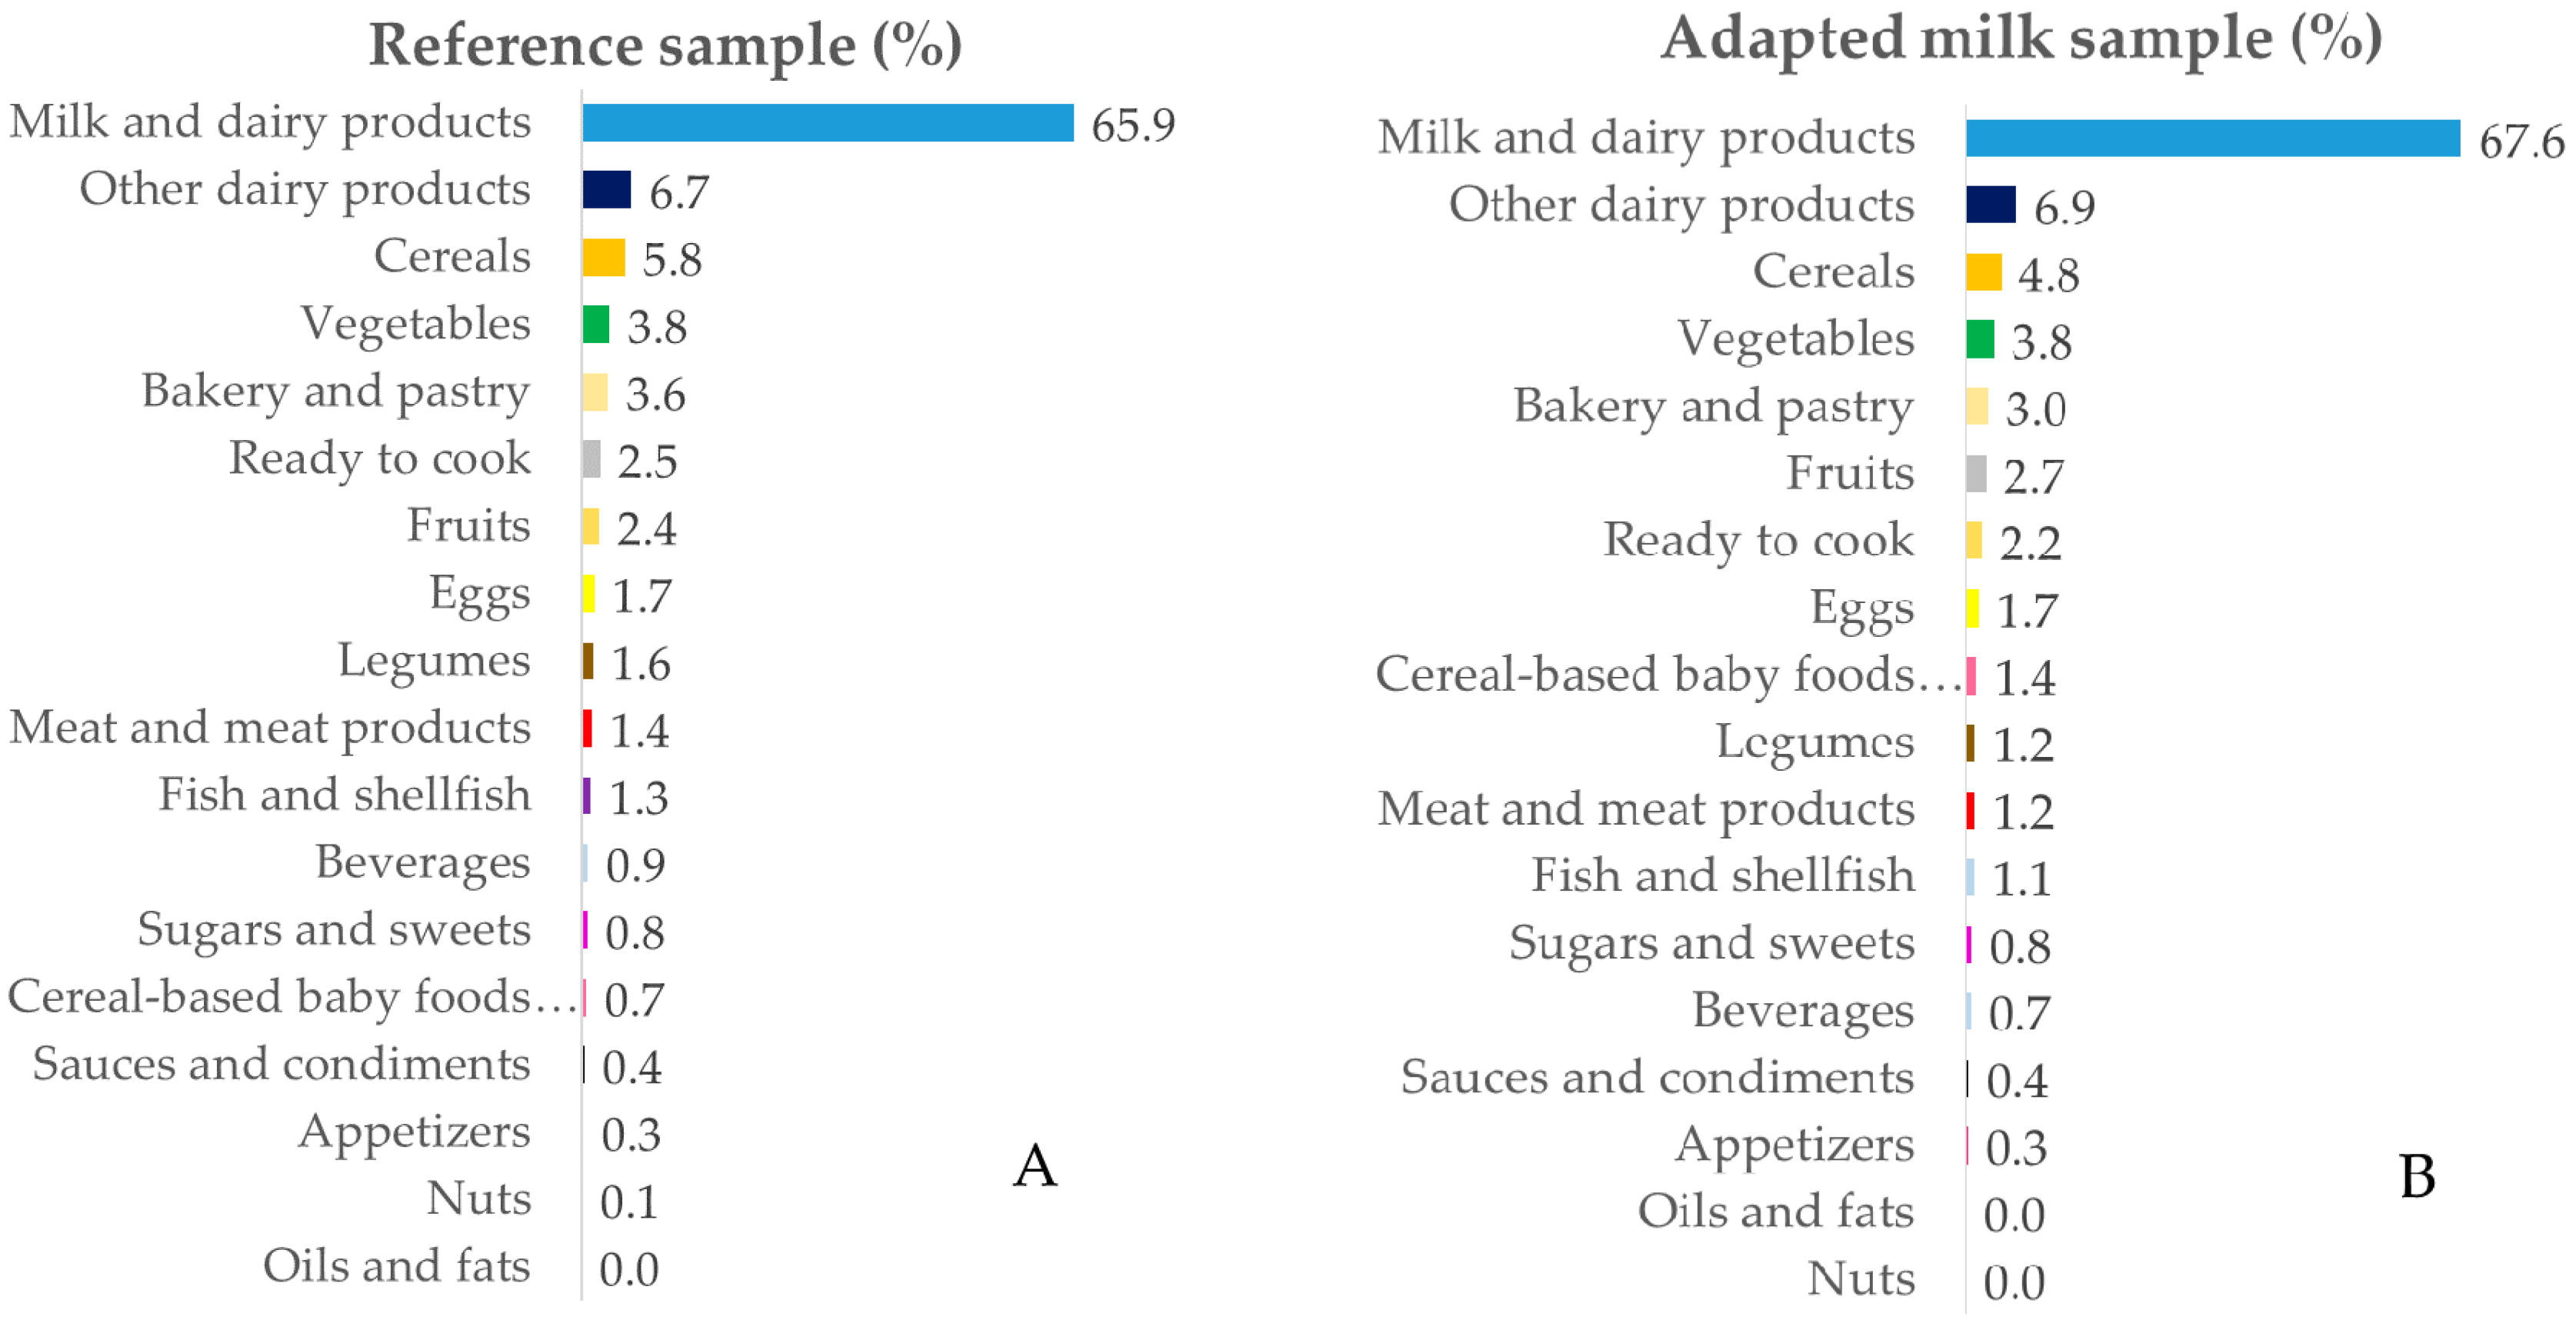
3.3.1. Calcium
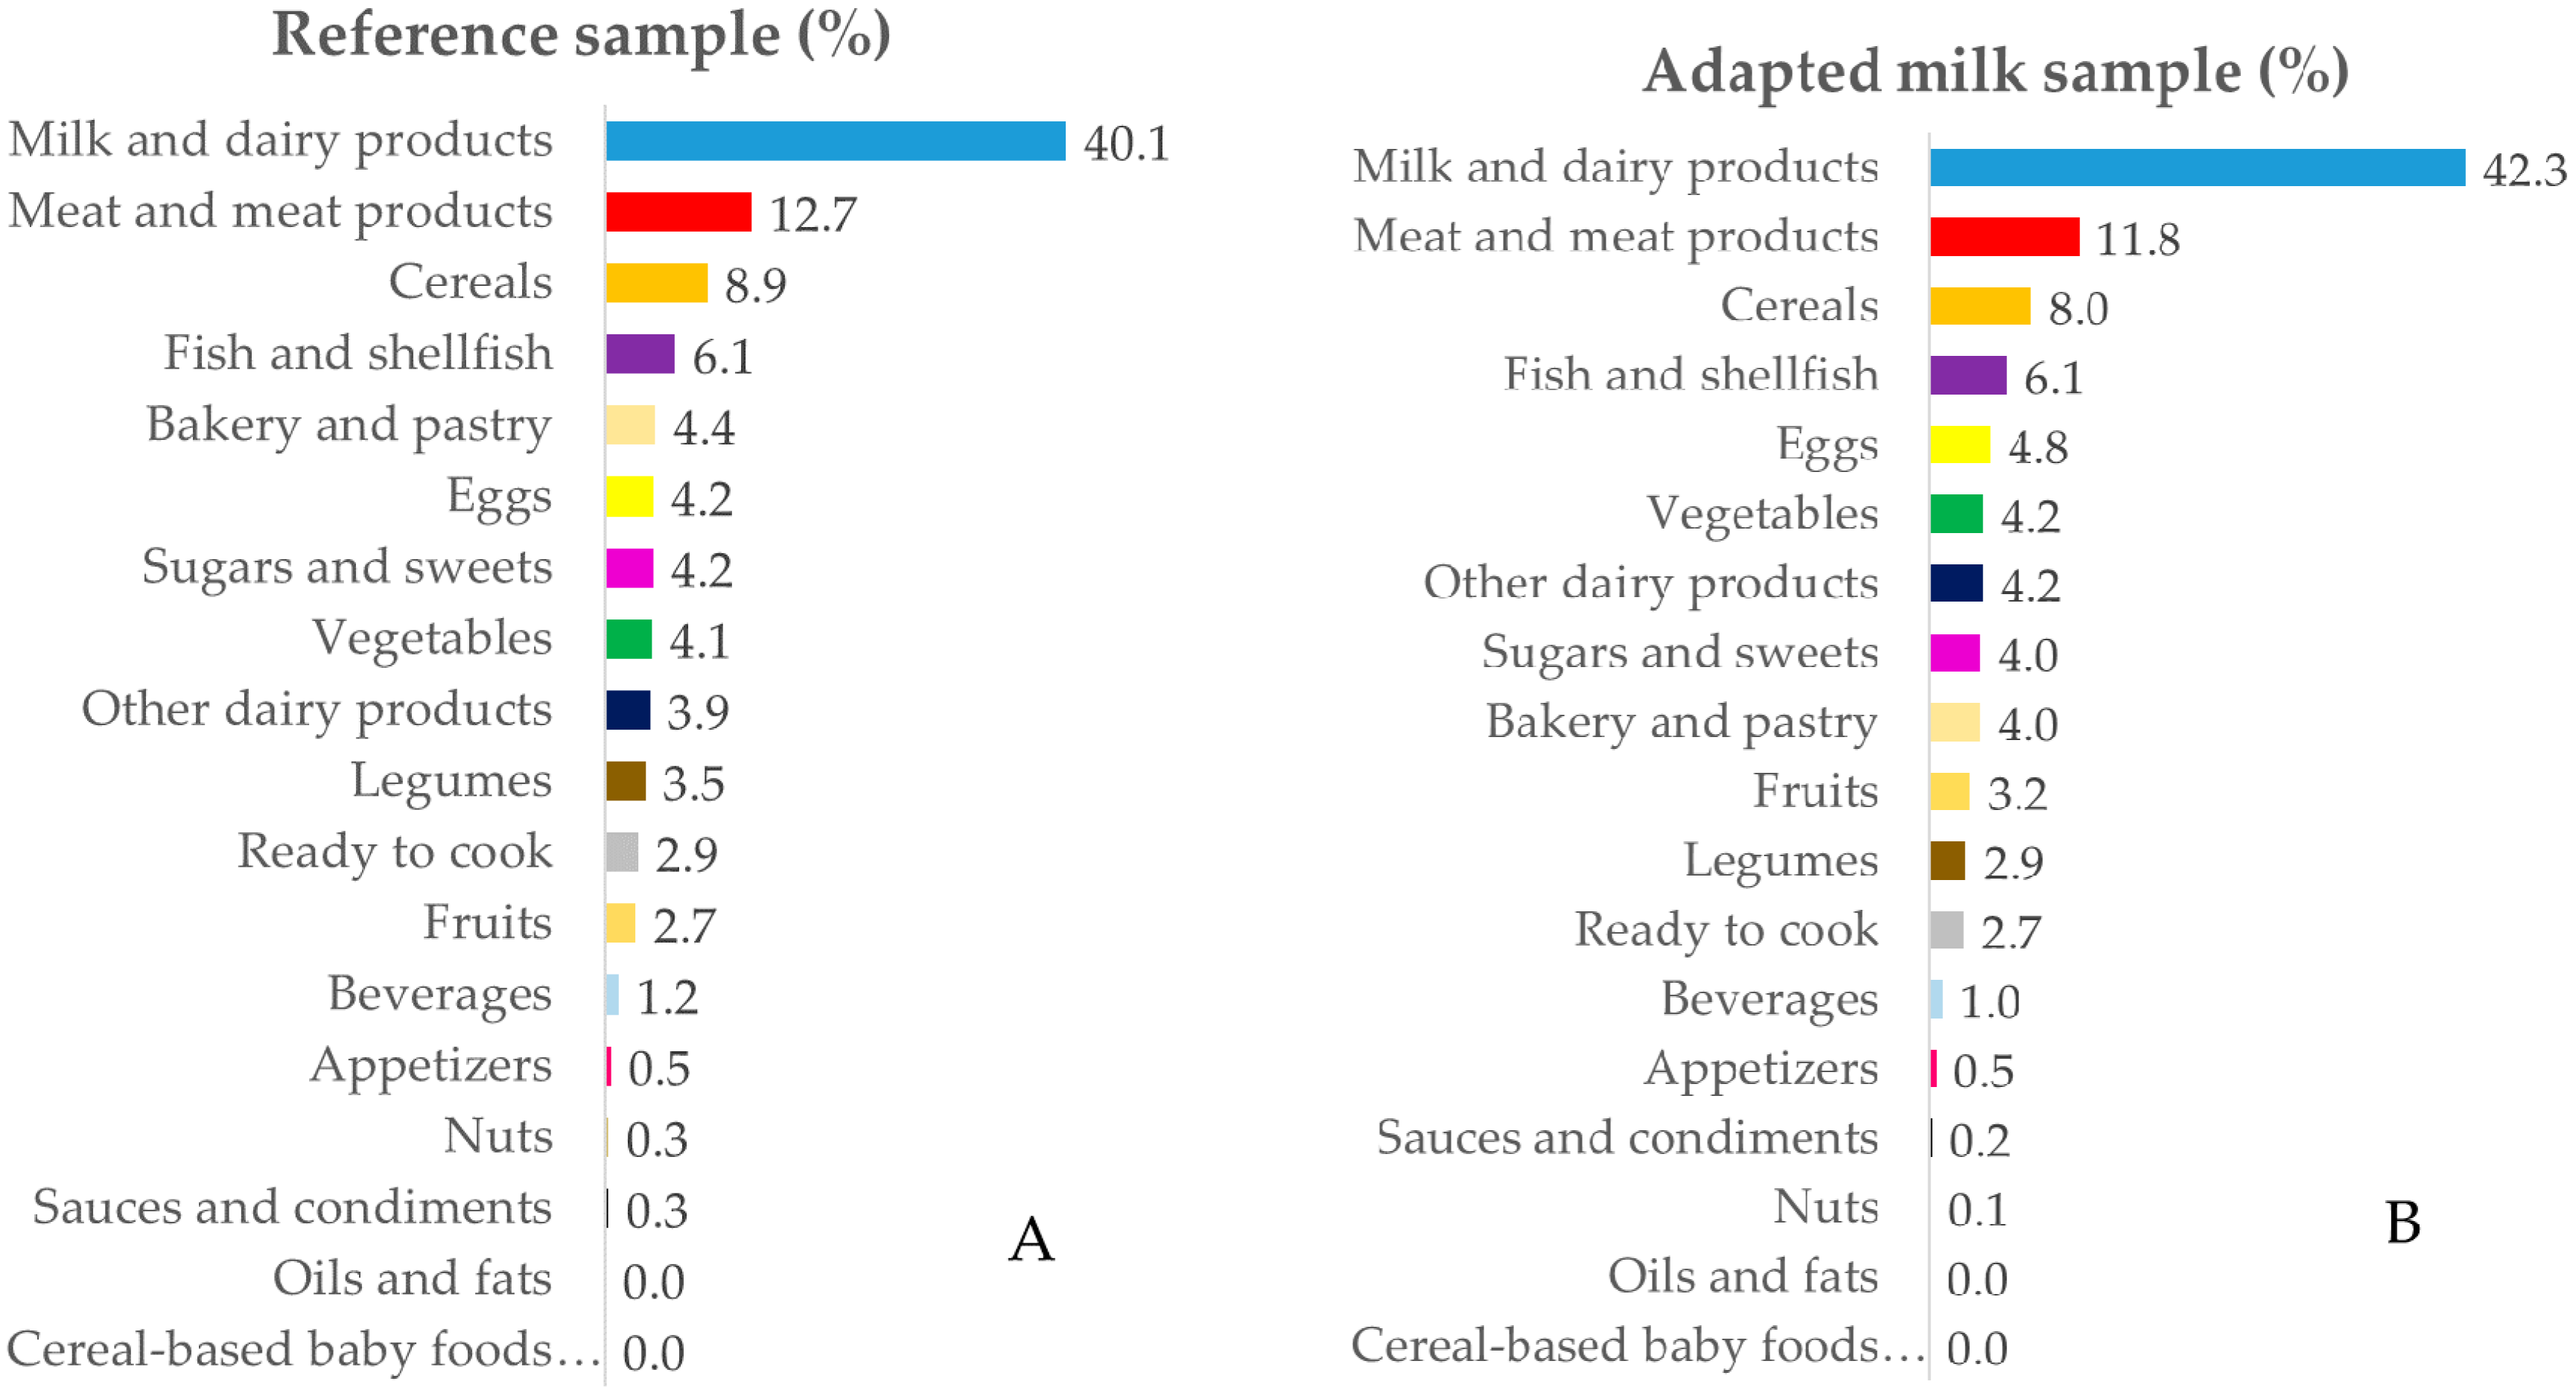
3.3.2. Phosphorus
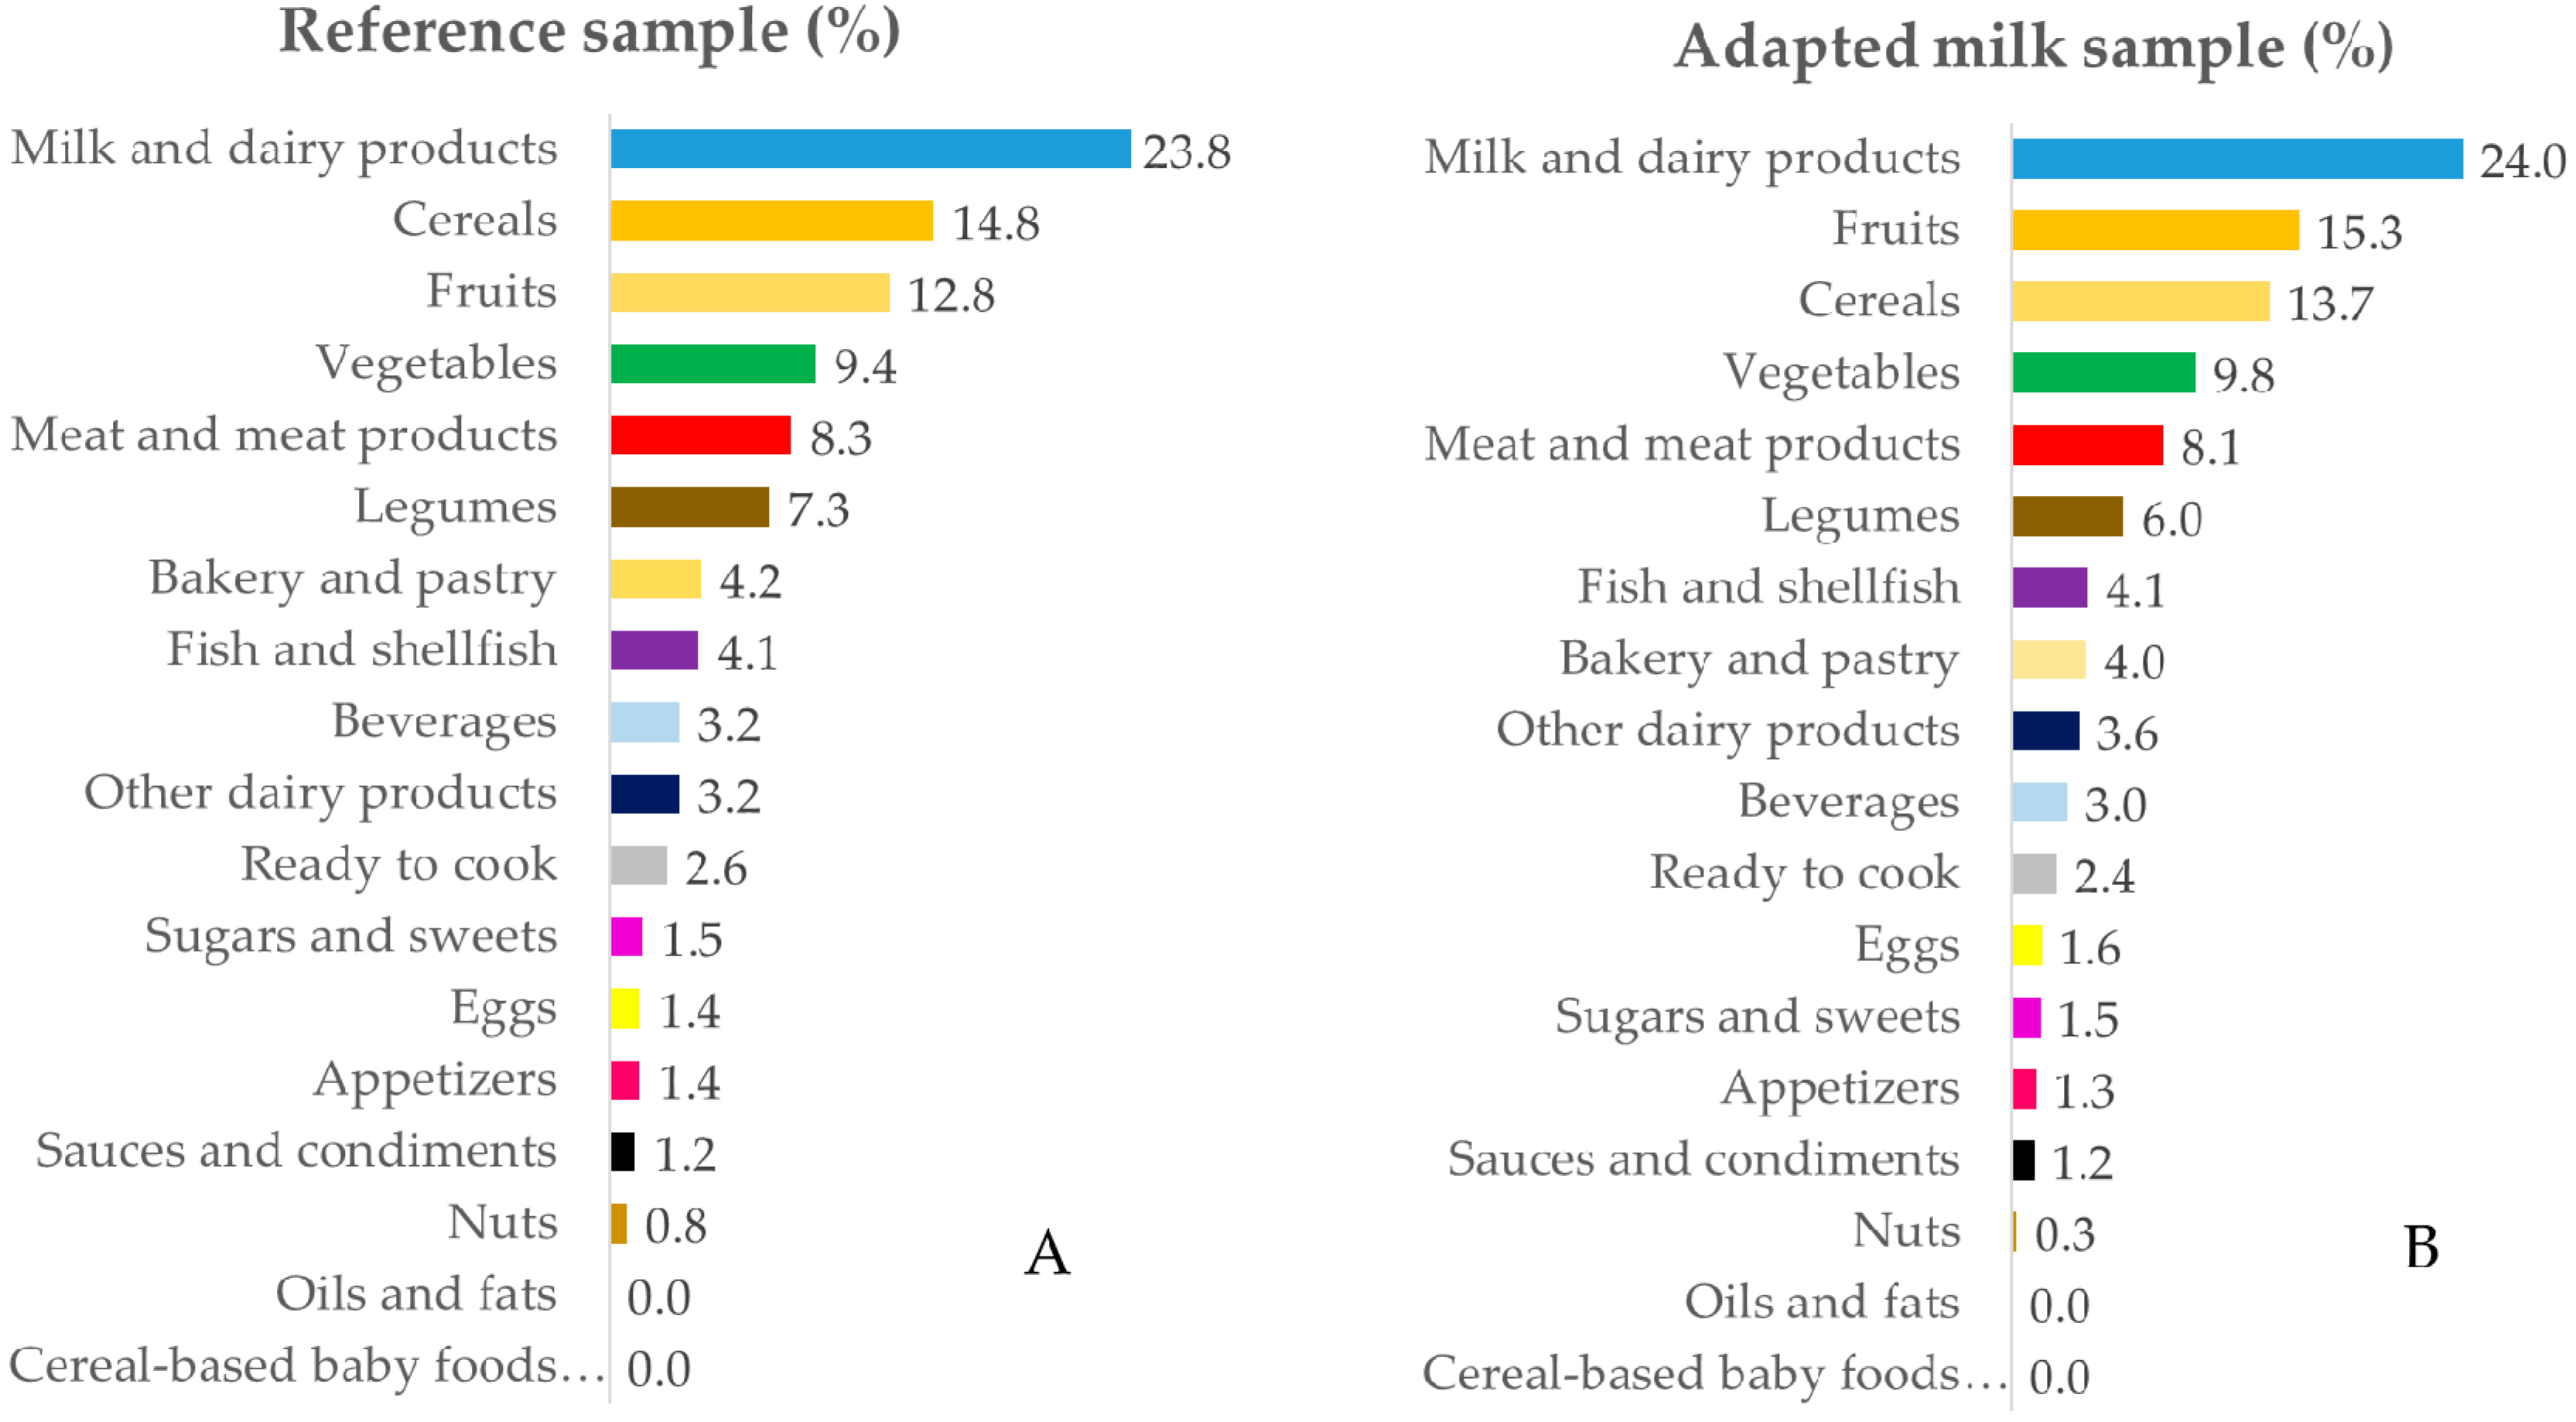
3.3.3. Magnesium
3.3.4. Vitamin D
4. Discussion
4.1. Calcium
4.2. Phosphorus
4.3. Calcium–Phosphorus Ratio
4.4. Magnesium
4.5. Vitamin D
4.6. Nutrient Sources
4.7. Strengths and Limitations
5. Conclusions
Supplementary Materials
Author Contributions
Funding
Acknowledgments
Conflicts of Interest
References
- US Department of Health and Human Services and US Department of Agriculture 2015–2020 Dietary Guidelines for Americans. Available online: https://health.gov/dietaryguidelines/2015/guidelines/ (accessed on 14 June 2020).
- Cashman, K.D. Diet, Nutrition, and Bone Health. J. Nutr. 2007, 137, 2507S–2512S. [Google Scholar] [CrossRef] [PubMed] [Green Version]
- Rizzoli, R.; Bianchi, M.L.; Garabédian, M.; McKay, H.A.; Moreno, L.A. Maximizing bone mineral mass gain during growth for the prevention of fractures in the adolescents and the elderly. Bone 2010, 46, 294–305. [Google Scholar] [CrossRef] [PubMed]
- Suárez Cortina, L.; Moreno Villares, J.M.; Martínez Suárez, V.; Aranceta Bartrina, J.; Dalmau Serra, J.; Gil Hernández, A.; Lama More, R.; Martín Mateos, M.A.; Pavón Belinchón, P. Ingesta de calcio y densidad mineral ósea en una población de escolares españoles (estudio CADO). An. Pediatría 2011, 74, 3–9. [Google Scholar] [CrossRef]
- Duren, D.L.; Sherwood, R.J.; Choh, A.C.; Czerwinski, S.A.; Cameron Chumlea, W.; Lee, M.; Sun, S.S.; Demerath, E.W.; Siervogel, R.M.; Towne, B. Quantitative genetics of cortical bone mass in healthy 10-year-old children from the Fels Longitudinal Study. Bone 2007, 40, 464–470. [Google Scholar] [CrossRef] [PubMed] [Green Version]
- Julián-Almárcegui, C.; Gómez-Cabello, A.; Huybrechts, I.; González-Agüero, A.; Kaufman, J.M.; Casajús, J.A.; Vicente-Rodríguez, G. Combined effects of interaction between physical activity and nutrition on bone health in children and adolescents: A systematic review. Nutr. Rev. 2015, 73, 127–139. [Google Scholar] [CrossRef] [PubMed] [Green Version]
- Moyer-Mileur, L.J.; Xie, B.; Ball, S.D.; Pratt, T. Bone mass and density response to a 12-month trial of calcium and vitamin D supplement in preadolescent girls. J. Musculoskelet. Neuronal Interact. 2003, 3, 63–70. [Google Scholar] [PubMed]
- de Lamas, C.; de Castro, M.J.; Gil-Campos, M.; Gil, Á.; Couce, M.L.; Leis, R. Effects of Dairy Product Consumption on Height and Bone Mineral Content in Children: A Systematic Review of Controlled Trials. Adv. Nutr. 2019, 10, S88–S96. [Google Scholar]
- Abrams, S.A.; Chen, Z.; Hawthorne, K.M. Magnesium Metabolism in 4-Year-Old to 8-Year-Old Children. J. Bone Miner. Res. 2014, 29, 118–122. [Google Scholar] [CrossRef]
- Pérez-Llamas, F.; Zamora, S. Calcio, fósforo, magnesio y flúor. In Tratado de Nutrición, Vol. 1; Gil, A., Ed.; Editorial Médica Panamericana: Madrid, Spain, 2017; pp. 481–507. [Google Scholar]
- Gil, Á.; Plaza-Diaz, J.; Mesa, M.D. Vitamin D: Classic and Novel Actions. Ann. Nutr. Metab. 2018, 72, 87–95. [Google Scholar] [CrossRef]
- Olza, J.; Aranceta-Bartrina, J.; González-Gross, M.; Ortega, R.; Serra-Majem, L.; Varela-Moreiras, G.; Gil, Á. Reported Dietary Intake, Disparity between the Reported Consumption and the Level Needed for Adequacy and Food Sources of Calcium, Phosphorus, Magnesium and Vitamin D in the Spanish Population: Findings from the ANIBES Study †. Nutrients 2017, 9, 168. [Google Scholar] [CrossRef]
- López-Sobaler, A.M.; Aparicio, A.; González-Rodríguez, L.G.; Cuadrado-Soto, E.; Rubio, J.; Marcos, V.; Sanchidrián, R.; Santos, S.; Pérez-Farinós, N.; Dal Re, M.Á.; et al. Adequacy of Usual Vitamin and Mineral Intake in Spanish Children and Adolescents: ENALIA Study. Nutrients 2017, 9, 131. [Google Scholar] [CrossRef] [PubMed] [Green Version]
- Ortega, R.M.; López-Sobaler, A.M.; Jiménez Ortega, A.I.; Navia Lombán, B.; Ruiz-Roso Calvo de Mora, B.; Rodríguez-Rodríguez, E.; López Plaza, B.; Grupo de investigación no 920030. Food sources and average intake of calcium in a representative sample of Spanish schoolchildren. Nutr. Hosp. 2012, 27, 715–723. [Google Scholar] [PubMed]
- Partearroyo, T.; Samaniego-Vaesken, M.d.L.; Ruiz, E.; Varela-Moreiras, G. Assessment of micronutrients intakes in the Spanish population: A review of the findings from the Anibes study. Nutr. Hosp. 2018, 35, 20–24. [Google Scholar] [CrossRef] [PubMed]
- Dalmau, J.; Peña-Quintana, L.; Moráis, A.; Martínez, V.; Varea, V.; Martínez, M.J.; Soler, B. Quantitative analysis of nutrient intake in children under 3 years old. ALSALMA study. An. Pediatría 2015, 82, 255–266. [Google Scholar] [CrossRef] [PubMed]
- Huysentruyt, K.; Laire, D.; Van Avondt, T.; De Schepper, J.; Vandenplas, Y. Energy and macronutrient intakes and adherence to dietary guidelines of infants and toddlers in Belgium. Eur. J. Nutr. 2016, 55, 1595–1604. [Google Scholar] [CrossRef] [PubMed]
- Iglesia, I.; Intemann, T.; De Miguel-Etayo, P.; Pala, V.; Hebestreit, A.; Wolters, M.; Russo, P.; Veidebaum, T.; Papoutsou, S.; Nagy, P.; et al. Dairy Consumption at Snack Meal Occasions and the Overall Quality of Diet during Childhood. Prospective and Cross-Sectional Analyses from the IDEFICS/I.Family Cohort. Nutrients 2020, 12, 642. [Google Scholar] [CrossRef] [Green Version]
- Grimes, C.; Szymlek-Gay, E.; Campbell, K.; Nicklas, T. Food Sources of Total Energy and Nutrients among U.S. Infants and Toddlers: National Health and Nutrition Examination Survey 2005–2012. Nutrients 2015, 7, 6797–6836. [Google Scholar] [CrossRef] [Green Version]
- Dalmau, J.; Moráis, A.; Martínez, V.; Peña-Quintana, L.; Varea, V.; Martínez, M.J.; Soler, B. Evaluation of diet and nutrient intake in children under three years old. ALSALMA pilot study. An. Pediatría 2014, 81, 22–31. [Google Scholar] [CrossRef]
- Afshin, A.; Sur, P.J.; Fay, K.A.; Cornaby, L.; Ferrara, G.; Salama, J.S.; Mullany, E.C.; Abate, K.H.; Abbafati, C.; Abebe, Z.; et al. Health effects of dietary risks in 195 countries, 1990–2017: A systematic analysis for the Global Burden of Disease Study 2017. Lancet 2019, 393, 1958–1972. [Google Scholar] [CrossRef] [Green Version]
- Eussen, S.R.B.M.; Pean, J.; Olivier, L.; Delaere, F.; Lluch, A. Theoretical Impact of Replacing Whole Cow’s Milk by Young-Child Formula on Nutrient Intakes of UK Young Children: Results of a Simulation Study. Ann. Nutr. Metab. 2015, 67, 247–256. [Google Scholar] [CrossRef] [PubMed]
- Srbely, V.; Janjua, I.; Buchholz, A.; Newton, G. Interventions Aimed at Increasing Dairy and/or Calcium Consumption of Preschool-Aged Children: A Systematic Literature Review. Nutrients 2019, 11, 714. [Google Scholar] [CrossRef] [PubMed] [Green Version]
- Dror, D.K.; Allen, L.H. Dairy product intake in children and adolescents in developed countries: Trends, nutritional contribution, and a review of association with health outcomes. Nutr. Rev. 2014, 72, 68–81. [Google Scholar] [CrossRef]
- Santaliestra-Pasías, A.M.; González-Gil, E.M.; Pala, V.; Intemann, T.; Hebestreit, A.; Russo, P.; Van Aart, C.; Rise, P.; Veidebaum, T.; Molnar, D.; et al. Predictive associations between lifestyle behaviours and dairy consumption: The IDEFICS study. Nutr. Metab. Cardiovasc. Dis. 2020, 30, 514–522. [Google Scholar] [CrossRef] [PubMed]
- Madrigal, C.; Soto-Méndez, M.J.; Hernández-Ruiz, Á.; Ruiz, E.; Valero, T.; Ávila, J.M.; Lara-Villoslada, F.; Leis, R.; Martínez de Victoria, E.; Moreno, J.M.; et al. Dietary and Lifestyle Patterns in the Spanish Pediatric Population (One to <10 Years Old): Design, Protocol, and Methodology of the EsNuPI Study. Nutrients 2019, 11, 3050. [Google Scholar] [CrossRef] [PubMed] [Green Version]
- Madrigal, C.; Soto-Méndez, M.J.; Hernández-Ruiz, Á.; Valero, T.; Ávila, J.M.; Ruiz, E.; Lara Villoslada, F.; Leis, R.; Martínez de Victoria, E.; Moreno, J.M.; et al. Energy Intake, Macronutrient Profile and Food Sources of Spanish Children Aged One to <10 Years—Results from the EsNuPI Study †. Nutrients 2020, 12, 893. [Google Scholar] [CrossRef] [Green Version]
- World Health Organization The WHO Child Growth Standards. Available online: http://www.who.int/childgrowth/en (accessed on 14 June 2020).
- De Onis, M. Development of a WHO growth reference for school-aged children and adolescents. Bull. World Health Organ. 2007, 85, 660–667. [Google Scholar] [CrossRef]
- Camargo, D.M.; Santisteban, S.; Paredes, E.; Flórez, M.; Bueno, D.A. Confiabilidad de un cuestionario para medir actividad física y comportamientos sedentarios en niños desde preescolar a cuarto grado de primaria. Biomédica 2015, 35, 347–356. [Google Scholar] [CrossRef] [PubMed] [Green Version]
- Moreiras, O.; Carbajal, A.; Cabrera, L. Ingestas Diarias Recomendadas de Energía y Nutrientes Para la Población Española. Tablas de Composición de Alimentos, 19th ed.; Ediciones Pirámide (Grupo Anaya, SA): Madrid, Spain, 2018. [Google Scholar]
- Fundación Española de la Nutrición (FEN). Software VD-FEN 2.1 Programa de Valoración Dietética de la FEN; Fundación Española de la Nutrición (FEN): Madrid, Spain, 2013. [Google Scholar]
- Ruiz-López, M.; Martínez de Victoria, E.; Gil, A. Guía Fotográfica de Porciones de Alimentos Consumidos en España; Fundación Iberoamericana de Nutrición: Granada, Spain, 2019. [Google Scholar]
- Ocké, M.; de Boer, E.; Brants, H.; van der Laan, J.; Niekerk, M.; van Rossum, C.; Temme, L.; Freisling, H.; Nicolas, G.; Casagrande, C.; et al. PANCAKE–Pilot study for the Assessment of Nutrient intake and food Consumption Among Kids in Europe. EFSA Support. Publ. 2012, 9, 339E. [Google Scholar] [CrossRef]
- European Food Safety Authority (EFSA) Dietary Reference Values for the European Union. Available online: https://www.efsa.europa.eu/en/topics/topic/dietary-reference-values (accessed on 14 June 2020).
- Krebs-Smith, S.M.; Kott, P.S.; Guenther, P.M. Mean proportion and population proportion: Two answers to the same question? J. Am. Diet. Assoc. 1989, 89, 671–676. [Google Scholar]
- Börnhorst, C.; Huybrechts, I.; Ahrens, W.; Eiben, G.; Michels, N.; Pala, V.; Molnár, D.; Russo, P.; Barba, G.; Bel-Serrat, S.; et al. Prevalence and determinants of misreporting among European children in proxy-reported 24 h dietary recalls. Br. J. Nutr. 2013, 109, 1257–1265. [Google Scholar] [CrossRef] [Green Version]
- Schofield, W.N. Predicting basal metabolic rate, new standards and review of previous work. Hum. Nutr. Clin. Nutr. 1985, 39, 5–41. [Google Scholar] [PubMed]
- European Food Safety Authority (EFSA). Guidance on the EU Menu methodology. EFSA J. 2014, 12, 3944. [Google Scholar]
- Serra-Majem, L.; Ribas-Barba, L.; Pérez-Rodrigo, C.; Bartrina, J.A. Nutrient adequacy in Spanish children and adolescents. Br. J. Nutr. 2006, 96, S49–S57. [Google Scholar] [CrossRef] [PubMed]
- Nusser, S.M.; Carriquiry, A.L.; Dodd, K.W.; Fuller, W.A. A Semiparametric Transformation Approach to Estimating Usual Daily Intake Distributions. J. Am. Stat. Assoc. 1996, 91, 1440–1449. [Google Scholar] [CrossRef]
- López-Sobaler, A.M.; Aparicio, A.; Rubio, J.; Marcos, V.; Sanchidrián, R.; Santos, S.; Pérez-Farinós, N.; Dal-Re, M.Á.; Villar-Villalba, C.; Yusta-Boyo, M.J.; et al. Adequacy of usual macronutrient intake and macronutrient distribution in children and adolescents in Spain: A National Dietary Survey on the Child and Adolescent Population, ENALIA 2013–2014. Eur. J. Nutr. 2019, 58, 705–719. [Google Scholar] [CrossRef] [Green Version]
- Agencia Española de Consumo Seguridad Alimentaria y Nutrición. Estudio ALADINO 2015: Estudio de Vigilancia del Crecimiento, Alimentación, Actividad Física, Desarrollo Infantil y Obesidad en España; Ministerio de Sanidad, Servicios Sociales e Igualdad: Madrid, Spain, 2016; ISBN 9788578110796.
- Pérez-Farinós, N.; López-Sobaler, A.M.; Dal Re, M.Á.; Villar, C.; Labrado, E.; Robledo, T.; Ortega, R.M. The ALADINO Study: A National Study of Prevalence of Overweight and Obesity in Spanish Children in 2011. Biomed Res. Int. 2013, 2013, 163687. [Google Scholar] [CrossRef]
- Chouraqui, J.-P.; Turck, D.; Tavoularis, G.; Ferry, C.; Dupont, C. The Role of Young Child Formula in Ensuring a Balanced Diet in Young Children (1–3 Years Old). Nutrients 2019, 11, 2213. [Google Scholar] [CrossRef] [Green Version]
- Jiménez-Aguilar, A.; González Castell, D.; Flores-Aldana, M.; Mundo-Rosas, V.; Hernández-Cordero, S.; García-Feregrino, R. Dietary intake and adequacy in Mexican preschool children: National Health and Nutrition Survey 2012. Nutr. Hosp. 2018, 35, 1186. [Google Scholar] [CrossRef]
- Mensink, G.B.M.; Fletcher, R.; Gurinovic, M.; Huybrechts, I.; Lafay, L.; Serra-Majem, L.; Szponar, L.; Tetens, I.; Verkaik-Kloosterman, J.; Baka, A.; et al. Mapping low intake of micronutrients across Europe. Br. J. Nutr. 2013, 110, 755–773. [Google Scholar] [CrossRef] [Green Version]
- Zimmer, M.C.; Rubio, V.; Kintziger, K.W.; Barroso, C. Racial/Ethnic Disparities in Dietary Intake of U.S. Children Participating in WIC. Nutrients 2019, 11, 2607. [Google Scholar] [CrossRef] [Green Version]
- Rubio-López, N.; Llopis-González, A.; Morales-Suárez-Varela, M. Calcium Intake and Nutritional Adequacy in Spanish Children: The ANIVA Study. Nutrients 2017, 9, 170. [Google Scholar] [CrossRef] [PubMed] [Green Version]
- Hojsak, I.; Bronsky, J.; Campoy, C.; Domellöf, M.; Embleton, N.; Fidler Mis, N.; Hulst, J.; Indrio, F.; Lapillonne, A.; Mølgaard, C.; et al. Young Child Formula. J. Pediatr. Gastroenterol. Nutr. 2018, 66, 177–185. [Google Scholar] [CrossRef] [PubMed]
- Salamoun, M.M.; Kizirian, A.S.; Tannous, R.I.; Nabulsi, M.M.; Choucair, M.K.; Deeb, M.E.; El-Hajj Fuleihan, G.A. Low calcium and vitamin D intake in healthy children and adolescents and their correlates. Eur. J. Clin. Nutr. 2005, 59, 177–184. [Google Scholar] [CrossRef] [PubMed] [Green Version]
- Tornaritis, M.J.; Philippou, E.; Hadjigeorgiou, C.; Kourides, Y.A.; Panayi, A.; Savva, S.C. A study of the dietary intake of Cypriot children and adolescents aged 6-18 years and the association of mother’s educational status and children’s weight status on adherence to nutritional recommendations. BMC Public Health 2014, 14, 13. [Google Scholar] [CrossRef] [PubMed] [Green Version]
- Elmadfa, I.; Meyer, A.; Nowak, V.; Hasenegger, V.; Putz, P.; Verstraeten, R.; Remaut-DeWinter A, A.M.; Kolsteren, P.; Dostálová, J.; Dlouhý, P.; et al. European Nutrition and Health Report 2009; Forum of nutrition: Basel, Switzerland, 2009; Volume 61. [Google Scholar]
- Loughrill, E.; Wray, D.; Christides, T.; Zand, N. Calcium to phosphorus ratio, essential elements and vitamin D content of infant foods in the UK: Possible implications for bone health. Matern. Child Nutr. 2017, 13, e12368. [Google Scholar] [CrossRef] [Green Version]
- Kostecka, M. Frequency of consumption of foods rich in calcium and vitamin D among school-age children. Rocz. Panstw. Zakl. Hig. 2016, 67, 23–30. [Google Scholar]
- Lee, K.-J.; Kim, K.-S.; Kim, H.-N.; Seo, J.-A.; Song, S.-W. Association between dietary calcium and phosphorus intakes, dietary calcium/phosphorus ratio and bone mass in the Korean population. Nutr. J. 2014, 13, 114. [Google Scholar] [CrossRef] [Green Version]
- Vorland, C.J.; Stremke, E.R.; Moorthi, R.N.; Hill Gallant, K.M. Effects of Excessive Dietary Phosphorus Intake on Bone Health. Curr. Osteoporos. Rep. 2017, 15, 473–482. [Google Scholar] [CrossRef]
- Horikawa, C.; Murayama, N.; Ishida, H.; Yamamoto, T.; Hazano, S.; Nakanishi, A.; Arai, Y.; Nozue, M.; Yoshioka, Y.; Saito, S.; et al. Association between parents’ work hours and nutrient inadequacy in Japanese schoolchildren on weekdays and weekends. Nutrition 2020, 70, 110598. [Google Scholar] [CrossRef]
- Gwynn, J.D.; Flood, V.M.; D’Este, C.A.; Attia, J.R.; Turner, N.; Cochrane, J.; Louie, J.C.-Y.; Wiggers, J.H. Poor food and nutrient intake among Indigenous and non-Indigenous rural Australian children. BMC Pediatr. 2012, 12, 12. [Google Scholar] [CrossRef] [Green Version]
- Verduci, E.; Banderali, G.; Montanari, C.; Berni Canani, R.; Cimmino Caserta, L.; Corsello, G.; Mosca, F.; Piazzolla, R.; Rescigno, M.; Terracciano, L.; et al. Childhood Dietary Intake in Italy: The Epidemiological “MY FOOD DIARY” Survey. Nutrients 2019, 11, 1129. [Google Scholar] [CrossRef] [PubMed] [Green Version]
- Cribb, V.L.; Northstone, K.; Hopkins, D.; Emmett, P.M. Sources of vitamin D and calcium in the diets of preschool children in the UK and the theoretical effect of food fortification. J. Hum. Nutr. Diet. 2015, 28, 583–592. [Google Scholar] [CrossRef] [PubMed]
- Ahluwalia, N.; Herrick, K.A.; Rossen, L.M.; Rhodes, D.; Kit, B.; Moshfegh, A.; Dodd, K.W. Usual nutrient intakes of US infants and toddlers generally meet or exceed Dietary Reference Intakes: Findings from NHANES 2009–2012. Am. J. Clin. Nutr. 2016, 104, 1167–1174. [Google Scholar] [CrossRef] [PubMed] [Green Version]
- Damsgaard, C.T. Can vitamin D supplementation improve childhood cardiometabolic status?—data from 2 randomized trials. Am. J. Clin. Nutr. 2020, 111, 737–738. [Google Scholar] [CrossRef] [PubMed]
- Holick, M.F.; Binkley, N.C.; Bischoff-Ferrari, H.A.; Gordon, C.M.; Hanley, D.A.; Heaney, R.P.; Murad, M.H.; Weaver, C.M. Evaluation, Treatment, and Prevention of Vitamin D Deficiency: An Endocrine Society Clinical Practice Guideline. J. Clin. Endocrinol. Metab. 2011, 96, 1911–1930. [Google Scholar] [CrossRef] [PubMed] [Green Version]
- Huybrechts, I.; Lin, Y.; De Keyzer, W.; Sioen, I.; Mouratidou, T.; Moreno, L.A.; Slimani, N.; Jenab, M.; Vandevijvere, S.; De Backer, G.; et al. Dietary sources and sociodemographic and economic factors affecting vitamin D and calcium intakes in Flemish preschoolers. Eur. J. Clin. Nutr. 2011, 65, 1039–1047. [Google Scholar] [CrossRef] [Green Version]
- Omidvar, N.; Neyestani Tirang, R.; Hajifaraji, M.; Eshraghian, M.-R.; Rezazadeh, A.; Armin, S.; Haidari, H.; Zowghi, T. Calcium Intake, Major Dietary Sources and Bone Health Indicators in Iranian Primary School Children. Iran. J. Pediatr. 2015, 25. [Google Scholar] [CrossRef] [Green Version]
- Murphy, M.M.; Douglass, J.S.; Johnson, R.K.; Spence, L.A. Drinking Flavored or Plain Milk Is Positively Associated with Nutrient Intake and Is Not Associated with Adverse Effects on Weight Status in US Children and Adolescents. J. Am. Diet. Assoc. 2008, 108, 631–639. [Google Scholar] [CrossRef] [PubMed]
- Eloranta, A.-M.; Venäläinen, T.; Soininen, S.; Jalkanen, H.; Kiiskinen, S.; Schwab, U.; Lakka, T.A.; Lindi, V. Food sources of energy and nutrients in Finnish girls and boys 6–8 years of age–the PANIC study. Food Nutr. Res. 2016, 60, 32444. [Google Scholar] [CrossRef] [Green Version]
- Fidler Mis, N.; Braegger, C.; Bronsky, J.; Campoy, C.; Domellöf, M.; Embleton, N.D.; Hojsak, I.; Hulst, J.; Indrio, F.; Lapillonne, A.; et al. Sugar in Infants, Children and Adolescents. J. Pediatr. Gastroenterol. Nutr. 2017, 65, 681–696. [Google Scholar] [CrossRef] [PubMed] [Green Version]
- Sette, S.; D’Addezio, L.; Piccinelli, R.; Hopkins, S.; Le Donne, C.; Ferrari, M.; Mistura, L.; Turrini, A. Intakes of whole grain in an Italian sample of children, adolescents and adults. Eur. J. Nutr. 2017, 56, 521–533. [Google Scholar] [CrossRef] [PubMed] [Green Version]
- Bischofova, S.; Dofkova, M.; Blahova, J.; Kavrik, R.; Nevrla, J.; Rehurkova, I.; Ruprich, J. Dietary Intake of Vitamin D in the Czech Population: A Comparison with Dietary Reference Values, Main Food Sources Identified by a Total Diet Study. Nutrients 2018, 10, 1452. [Google Scholar] [CrossRef] [PubMed] [Green Version]
- Moe, S.M. Disorders Involving Calcium, Phosphorus, and Magnesium. Prim. Care Clin. Off. Pract. 2008, 35, 215–237. [Google Scholar] [CrossRef] [PubMed] [Green Version]


| Reference Sample | Adapted Milk Consumer Sample | |||||
|---|---|---|---|---|---|---|
| Total | Boys | Girls | Total | Boys | Girls | |
| n | 707 | 357 | 350 | 741 | 371 | 370 |
| Age group, n (%) | ||||||
| 1 to <3 years | 162 (22.9) * | 84 (23.5) * | 78 (22.3) * | 294 (39.7) * | 144 (38.8) * | 150 (40.5) * |
| 3 to <6 years | 244 (34.5) * | 122 (34.2) * | 122 (34.9) * | 262 (35.4) * | 128 (34.5) * | 134 (36.2) * |
| 6 to <10 years | 301 (42.6) * | 151 (42.3) * | 150 (42.9) * | 185 (25) * | 99 (26.7) * | 86 (23.2) * |
| Anthropometric characteristics, X ± SD | ||||||
| Weight (kg) # | 20.8 ± 8.4 * | 21.2 ± 8.5 * | 20.5 ± 8.2 | 17.4 ± 7.4 * | 17.9 ± 7.8 * | 16.9 ± 6.9 |
| Height (cm) # | 109.4 ± 20.1 * | 110.1 ± 20.2 * | 108.6 ± 20.0 | 100.5 ± 19.3 * | 101.7 ± 20.2 * | 99.2 ± 18.4 |
| BMI (kg/m2) # | 16.9 ± 2.9 | 16.9 ± 3.1 | 16.8 ± 2.7 | 16.8 ± 2.9 | 16.8 ± 2.6 | 16.8 ± 3.1 |
| Z-BMI/Age # | 0.59 ± 1.73 | 0.64 ± 1.97 | 0.54 ± 1.44 | 0.57 ± 1.72 | 0.52 ± 1.67 | 0.61 ± 1.77 |
| Z-Weight/Height # | 0.59 ± 1.79 | 0.61 ± 2.09 | 0.57 ± 1.42 | 0.62 ± 1.69 | 0.53 ± 1.61 | 0.71 ± 1.76 |
| Z-Height/Age # | −0.25 ± 1.7 * | −0.14 ± 1.82 * | −0.36 ± 1.57 | −0.54 ± 1.82 * | −0.52 ± 1.85 * | −0.55 ± 1.79 |
| Physical activity (PAL) (X ± SD) | ||||||
| 1 to <3 years | 1.56 ± 0.32 | 1.60 ± 0.32 | 1.53 ± 0.31 | 1.54 ± 0.30 a | 1.54 ± 0.29 a,b | 1.53 ± 0.30 |
| 3 to <6 years | 1.56 ± 0.22 | 1.59 ± 0.21 | 1.52 ± 0.23 | 1.52 ± 0.22 a | 1.53 ± 0.24 a | 1.52 ± 0.19 |
| 6 to <10 years | 1.58 ± 0.21 | 1.59 ± 0.22 | 1.57 ± 0.20 | 1.61 ± 0.21 b | 1.62 ± 0.21 b | 1.60 ± 0.21 |
| Size of the municipality n (%) | ||||||
| 50,001–300,000 people | 376 (53.2) | 193 (54.1) | 183 (52.3) | 406 (54.8) | 204 (55.0) | 202 (54.6) |
| >300,000 people | 331 (46.8) | 164 (45.9) | 167 (47.7) | 335 (45.2) | 167 (45.0) | 168 (45.4) |
| Highest level of education achieved by one of the parents, n (%) ¥ | ||||||
| ≤10 years of education | 22 (3.2) | 9 (2.6) | 13 (3.8) | 16 (2.2) | 8 (2.2) | 8 (2.2) |
| Secondary education | 428 (62.3) | 227 (65.4) | 201 (59.1) | 420 (57.9) | 210 (58.0) | 210 (57.7) |
| University studies | 237 (34.5) | 111 (32.0) | 126 (37.1) | 290 (39.9) | 144 (39.8) | 146 (40.1) |
| Family income, n (%) | ||||||
| ≤2000 €/month | 297 (42.0) | 146 (40.9) | 151 (43.1) | 297 (40.1) | 148 (39.9) | 149 (40.3) |
| >2000 €/month | 226 (32.0) | 123 (34.5) | 103 (29.4) | 238 (32.1) | 110 (29.6) | 128 (34.6) |
| Not known/no answer | 184 (26.0) | 88 (24.6) | 96 (27.4) | 206 (27.8) | 113 (30.5) | 93 (25.1) |
| Dietary supplements, n (%) | ||||||
| Vitamin D, n (%) | 3 (0.4) | 3 (0.8) | 0 (0.0) | 5 (0.7) | 4 (1.1) | 1 (0.3) |
| Multivitamins and Minerals or Vitamins, n (%) | 5 (0.7) | 2 (0.6) | 3 (0.9) | 5 (0.7) | 3 (0.8) | 2 (0.5) |
| Number of feeding bottles or glasses of milk per day, n (%) | ||||||
| Less than 2 | 222 (32.9) | 110 (32.0) | 115 (33.8) | 178 (24.1) | 92 (24.9) | 86 (23.3) |
| 2 or more | 459 (67.1) | 234 (68.0) | 225 (66.2) | 561 (75.9) | 278 (75.1) | 283 (76.7) |
| Group by Age | AR | AI | Boys | Girls | ||||||||
|---|---|---|---|---|---|---|---|---|---|---|---|---|
| Mean | SD | Median (P5–P95) | <AR (%) | >AI (%) | Mean | SD | Median (P5–P95) | <AR (%) | >AI (%) | |||
| Calcium (mg/day), RS # | ||||||||||||
| 1 to <4 years | 390 | 746 a * | 184 | 736 (462–1064) a * | 1.6 | 744 a | 149 | 740 (508–997) a | 0.5 | |||
| 4 to <6 years | 680 | 775 a,b * | 112 | 772 (597–964) a,b * | 20.0 | 743 a | 161 | 732 (499–1026) b | 37.0 | |||
| 6 to <10 years | 680 | 815 b * | 192 | 805 (517–1148) b * | 24.9 | 799 b * | 150 | 791 (566–1058) c * | 22.0 | |||
| Calcium (mg/day), AMS # | ||||||||||||
| 1 to <4 years | 390 | 702 a * | 131 | 697 (495–924) a * | 0.5 | 735 a | 146 | 727 (511–987) a | 0.4 | |||
| 4 to <6 years | 680 | 835 b * | 150 | 829 (600–1093) a * | 14.9 | 785 b | 132 | 780 (574–1009) b | 21.5 | |||
| 6 to <10 years | 680 | 903 c * | 131 | 897 (696–1127) b * | 3.7 | 846 c * | 171 | 833 (590–1147) c * | 18.6 | |||
| Phosphorus (mg/day), RS # | ||||||||||||
| 1 to <4 years | 250 | 943 a * | 215 | 942 (591–1298) a * | 100 | 939 a * | 196 | 940 (615–1260) a * | 100 | |||
| 4 to <6 years | 440 | 1103 b | 200 | 1102 (775–1434) b * | 100 | 1068 b | 175 | 1061 (792–1366) b | 100 | |||
| 6 to <10 years | 440 | 1179 c | 242 | 1164 (809–1600) c | 100 | 1143 c | 140 | 1138 (920–1381) c | 100 | |||
| Phosphorus (mg/day), AMS # | ||||||||||||
| 1 to <4 years | 250 | 826 a* | 191 | 822 (518–1146) a * | 100 | 870 a * | 213 | 861 (536–1235) a * | 100 | |||
| 4 to <6 years | 440 | 1116 b | 193 | 1108 (814–1446) b * | 100 | 1042 b | 160 | 1039 (784–1309) b | 100 | |||
| 6 to <10 years | 440 | 1182 c | 160 | 1175 (932–1456) c | 100 | 1130 c | 178 | 1124 (846–1432) c | 100 | |||
| Magnesium (mg/day), RS # | ||||||||||||
| 1 to <3 years | 170 | 173 a | 55 | 170 (86–257) a | 50.3 | 175 a | 35 | 173 (121–235) a | 54.0 | |||
| 3 to <6 years | 230 | 205 b * | 31 | 202 (159–258) b * | 19.6 | 200 b * | 33 | 198 (149–259) a,b * | 17.9 | |||
| 6 to <10 years | 230 | 220 c * | 46 | 218 (150–306) c * | 38.8 | 210 c * | 32 | 208 (162–266) b * | 24.5 | |||
| Magnesium (mg/day), AMS # | ||||||||||||
| 1 to <3 years | 170 | 178 a | 47 | 173 (111–263) a | 52.9 | 171 | 51 | 165 (100–265) a | 45.5 | |||
| 3 to <6 years | 230 | 185 a,b * | 29 | 183 (140–236) b * | 7.2 | 181 * | 30 | 180 (134–231) b * | 5.3 | |||
| 6 to <10 years | 230 | 192 b * | 27 | 191 (150–237) b * | 7.8 | 185 * | 45 | 183 (113–262) b * | 16.0 | |||
| Vitamin D (µg/day), RS # | ||||||||||||
| 1 to <4 years | 15 | 3.20 * | 2.84 | 2.43 (0.36–8.83) a,b * | 0.6 | 3.05 a * | 2.70 | 2.28 (0.34–8.55) * | 0.4 | |||
| 4 to <6 years | 15 | 2.77 * | 2.17 | 2.20 (0.45–7.04) a * | 0.1 | 3.14 b * | 2.12 | 2.63 (0.76–7.22) * | 0.1 | |||
| 6 to <10 years | 15 | 2.96 * | 0.96 | 2.85 (1.61–4.72) b * | 0.0 | 3.09 a,b * | 1.77 | 2.72 (0.97–6.52) * | 0.0 | |||
| Vitamin D (µg/day), AMS # | ||||||||||||
| 1 to <4 years | 15 | 6.80 * | 2.32 | 6.57 (3.42–10.95) * | 0.4 | 7.51 a * | 2.44 | 7.08 (4.30–12.10) a * | 0.9 | |||
| 4 to <6 years | 15 | 8.32 * | 3.44 | 7.88 (3.51–14.63) * | 4.3 | 7.02 a,b * | 2.50 | 6.73 (3.46–11.55) b * | 0.6 | |||
| 6 to <10 years | 15 | 7.47 * | 2.98 | 7.14 (3.18–12.86) * | 1.6 | 6.67 b * | 2.61 | 6.38 (2.92–11.4) b * | 0.5 | |||
| Calcium (mg/day) (≥P50) † | Phosphorus (mg/day) (≥P50) † | Magnesium (mg/day) (≥P50) † | Vitamin D (µg/day) (≥P50) † | ||||||||||
|---|---|---|---|---|---|---|---|---|---|---|---|---|---|
| Factor | Subcategories | OR | IC | p | OR | IC | p | OR | IC | p | OR | IC | p |
| Sex | Boys | 1 | 1 | 1 | 1 | ||||||||
| Girls | 0.983 | 0.732–1.32 | 0.910 | 0.983 | 0.732–1.321 | 0.911 | 1.006 | 0.749–1.35 | 0.970 | 0.994 | 0.74–1.335 | 0.970 | |
| Age ¥ | 1 to <4 years | 1 | 1 | 1 | 1 | ||||||||
| 4 to <6 years | 1.075 | 0.716–1.612 | 0.728 | 1.042 | 0.695–1.564 | 0.842 | 1.000 | 0.672–1.488 | 1.000 | 1.042 | 0.695–1.564 | 0.842 | |
| 6-<10 years | 1.031 | 0.740–1.436 | 0.857 | 1.000 | 0.718–1.393 | 1.000 | 0.993 | 0.678–1.455 | 0.973 | 0.987 | 0.708–1.375 | 0.937 | |
| Number of feeding bottles or glasses of milk per day | Less than 2 | 1 | 1 | 1 | 1 | ||||||||
| 2 or more | 1.681 | 1.218–2.320 | 0.002 * | 1.252 | 0.910–1.723 | 0.168 | 1.127 | 0.819–1.551 | 0.463 | 1.167 | 0.848–1.605 | 0.344 | |
| Physical activity (PAL) | <P50 by sex and age | 1 | 1 | 1 | 1 | ||||||||
| ≥P50 by sex and age | 1.023 | 0.761–1.374 | 0.880 | 0.892 | 0.664–1.199 | 0.449 | 0.873 | 0.650–1.173 | 0.366 | 1.269 | 0.944–1.705 | 0.114 | |
| Size of the municipality | 50,001–300,000 people | 1 | 1 | 1 | 1 | ||||||||
| >300,0000 people | 1.277 | 0.950–1.716 | 0.106 | 1.25 | 0.930–1.68 | 0.140 | 1.336 | 0.994–1.797 | 0.055 | 1.449 | 1.077–1.949 | 0.014 * | |
| Family income | ≤2000 €/month | 1 | 1 | 1 | 1 | ||||||||
| >2000 €/month | 0.838 | 0.593–1.186 | 0.319 | 1.140 | 0.806–1.612 | 0.459 | 1.519 | 1.072–2.151 | 0.019 * | 1.071 | 0.757–1.514 | 0.699 | |
| Not known/no answer | 0.877 | 0.607–1.267 | 0.485 | 0.903 | 0.625–1.305 | 0.587 | 1.133 | 0.784–1.638 | 0.505 | 0.860 | 0.595–1.243 | 0.422 | |
| Highest level of education achieved by one of the parents | ≤10 years of education | 1 | 1 | 1 | 1 | ||||||||
| Secondary education | 0.297 | 0.108–0.819 | 0.019 * | 0.358 | 0.137–0.932 | 0.035 * | 0.810 | 0.343–1.915 | 0.632 | 0.402 | 0.161–1.005 | 0.051 | |
| University studies | 0.264 | 0.094–0.738 | 0.011 * | 0.391 | 0.148–1.034 | 0.058 | 0.899 | 0.374–2.161 | 0.812 | 0.539 | 0.212–1.369 | 0.194 | |
| BMI for age | Normal BMI | 1 | 1 | 1 | 1 | ||||||||
| Overweight and obese | 0.932 | 0.683–1.272 | 0.658 | 1.067 | 0.782–1.457 | 0.681 | 0.999 | 0.732–1.364 | 0.997 | 1.015 | 0.744–1.385 | 0.925 | |
| Underweight | 0.408 | 0.190–0.879 | 0.022 * | 0.647 | 0.314–1.335 | 0.238 | 0.558 | 0.268–1.163 | 0.120 | 0.558 | 0.268–1.163 | 0.120 | |
| Height for age | Normal height | 1 | 1 | 1 | 1 | ||||||||
| High stature | 1.246 | 0.744–2.087 | 0.404 | 1.549 | 0.918–2.612 | 0.101 | 1.538 | 0.911–2.594 | 0.107 | 1.080 | 0.646–1.804 | 0.769 | |
| Stunting | 0.836 | 0.519–1.349 | 0.463 | 1.006 | 0.625–1.619 | 0.981 | 0.854 | 0.53–1.378 | 0.518 | 1.472 | 0.909–2.385 | 0.116 | |
| Calcium (mg/day) (≥P50) † | Phosphorus (mg/day) (≥P50) † | Magnesium (mg/day) (≥P50) † | Vitamin D (µg/day) (≥P50) † | ||||||||||
|---|---|---|---|---|---|---|---|---|---|---|---|---|---|
| Factor | Subcategories | OR | IC | p | OR | IC | p | OR | IC | p | OR | IC | p |
| Sex | Boys | 1 | 1 | 1 | 1 | ||||||||
| Girls | 1.005 | 0.754–1.341 | 0.971 | 0.995 | 0.746–1.327 | 0.971 | 1.005 | 0.754–1.341 | 0.971 | 0.995 | 0.746–1.327 | 0.971 | |
| Age ¥ | 1 to <4 years | 1 | 1 | 1 | 1 | ||||||||
| 4 to <6 years | 1.029 | 0.703–1.506 | 0.885 | 1.000 | 0.683–1.464 | 1.000 | 1.000 | 0.717–1.395 | 1.000 | 1.000 | 0.683–1.464 | 1.000 | |
| 6 to <10 years | 1.011 | 0.715–1.430 | 0.951 | 1.011 | 0.715–1.430 | 0.951 | 0.989 | 0.685–1.429 | 0.954 | 1.011 | 0.715–1.430 | 0.951 | |
| Number of feeding bottles or glasses of milk per day | Less than 2 | 1 | 1 | 1 | 1 | ||||||||
| 2 or more | 2.206 | 1.556–3.129 | 0.000* | 1.302 | 0.928–1.826 | 0.127 | 0.961 | 0.686–1.346 | 0.815 | 2.352 | 1.655–3.342 | 0.000 * | |
| Physical activity (PAL) | <P50 by sex and age | 1 | 1 | 1 | 1 | ||||||||
| ≥P50 by sex and age | 0.797 | 0.597–1.063 | 0.123 | 0.968 | 0.726–1.291 | 0.825 | 0.763 | 0.571–1.018 | 0.066 | 1.067 | 0.800–1.423 | 0.659 | |
| Size of the municipality | 50,001–300,000 people | 1 | 1 | 1 | 1 | ||||||||
| >300,000 people | 0.874 | 0.654–1.167 | 0.362 | 1.427 | 1.067–1.908 | 0.016 * | 1.441 | 1.078–1.927 | 0.014 * | 0.709 | 0.530–0.948 | 0.020 * | |
| Family income | ≤2000 €/month | 1 | 1 | 1 | 1 | ||||||||
| >2000 €/month | 0.973 | 0.692–1.369 | 0.877 | 1.245 | 0.885–1.751 | 0.209 | 1.406 | 0.999–1.980 | 0.051 | 1.183 | 0.841–1.665 | 0.334 | |
| Not known/no answer | 0.854 | 0.598–1.219 | 0.385 | 1.128 | 0.790–1.61 | 0.507 | 1.489 | 1.042–2.129 | 0.029* | 0.938 | 0.658–1.339 | 0.726 | |
| Highest level of education achieved by one of the parents | ≤10 years of education | 1 | 1 | 1 | 1 | ||||||||
| Secondary education | 1.039 | 0.383–2.820 | 0.940 | 1.100 | 0.405–2.986 | 0.852 | 0.770 | 0.282–2.107 | 0.611 | 0.935 | 0.345–2.539 | 0.896 | |
| University studies | 0.933 | 0.341–2.554 | 0.893 | 0.883 | 0.323–2.417 | 0.809 | 0.789 | 0.286–2.174 | 0.646 | 1.071 | 0.392–2.932 | 0.893 | |
| BMI for age | Normal BMI | 1 | 1 | 1 | 1 | ||||||||
| Overweight and obese | 1.045 | 0.767–1.423 | 0.783 | 1.045 | 0.767–1.423 | 0.783 | 1.063 | 0.780–1.449 | 0.697 | 1.194 | 0.876–1.627 | 0.262 | |
| Underweight | 0.822 | 0.436–1.552 | 0.546 | 0.747 | 0.394–1.414 | 0.370 | 0.837 | 0.444–1.58 | 0.583 | 0.868 | 0.460–1.637 | 0.661 | |
| Height for age | Normal height | 1 | 1 | 1 | 1 | ||||||||
| High stature | 1.260 | 0.721–2.201 | 0.417 | 0.929 | 0.534–1.617 | 0.795 | 0.868 | 0.499–1.512 | 0.618 | 0.777 | 0.445–1.357 | 0.375 | |
| Stunting | 0.813 | 0.548–1.206 | 0.303 | 0.531 | 0.354–0.795 | 0.002 * | 0.863 | 0.582–1.278 | 0.462 | 1.165 | 0.786–1.727 | 0.447 | |
© 2020 by the authors. Licensee MDPI, Basel, Switzerland. This article is an open access article distributed under the terms and conditions of the Creative Commons Attribution (CC BY) license (http://creativecommons.org/licenses/by/4.0/).
Share and Cite
Cuadrado-Soto, E.; López-Sobaler, A.M.; Jiménez-Ortega, A.I.; Aparicio, A.; Bermejo, L.M.; Hernández-Ruiz, Á.; Lara Villoslada, F.; Leis, R.; Martínez de Victoria, E.; Moreno, J.M.; et al. Usual Dietary Intake, Nutritional Adequacy and Food Sources of Calcium, Phosphorus, Magnesium and Vitamin D of Spanish Children Aged One to <10 Years. Findings from the EsNuPI Study. Nutrients 2020, 12, 1787. https://0-doi-org.brum.beds.ac.uk/10.3390/nu12061787
Cuadrado-Soto E, López-Sobaler AM, Jiménez-Ortega AI, Aparicio A, Bermejo LM, Hernández-Ruiz Á, Lara Villoslada F, Leis R, Martínez de Victoria E, Moreno JM, et al. Usual Dietary Intake, Nutritional Adequacy and Food Sources of Calcium, Phosphorus, Magnesium and Vitamin D of Spanish Children Aged One to <10 Years. Findings from the EsNuPI Study. Nutrients. 2020; 12(6):1787. https://0-doi-org.brum.beds.ac.uk/10.3390/nu12061787
Chicago/Turabian StyleCuadrado-Soto, Esther, Ana M. López-Sobaler, Ana Isabel Jiménez-Ortega, Aránzazu Aparicio, Laura M. Bermejo, Ángela Hernández-Ruiz, Federico Lara Villoslada, Rosaura Leis, Emilio Martínez de Victoria, José Manuel Moreno, and et al. 2020. "Usual Dietary Intake, Nutritional Adequacy and Food Sources of Calcium, Phosphorus, Magnesium and Vitamin D of Spanish Children Aged One to <10 Years. Findings from the EsNuPI Study" Nutrients 12, no. 6: 1787. https://0-doi-org.brum.beds.ac.uk/10.3390/nu12061787