Article

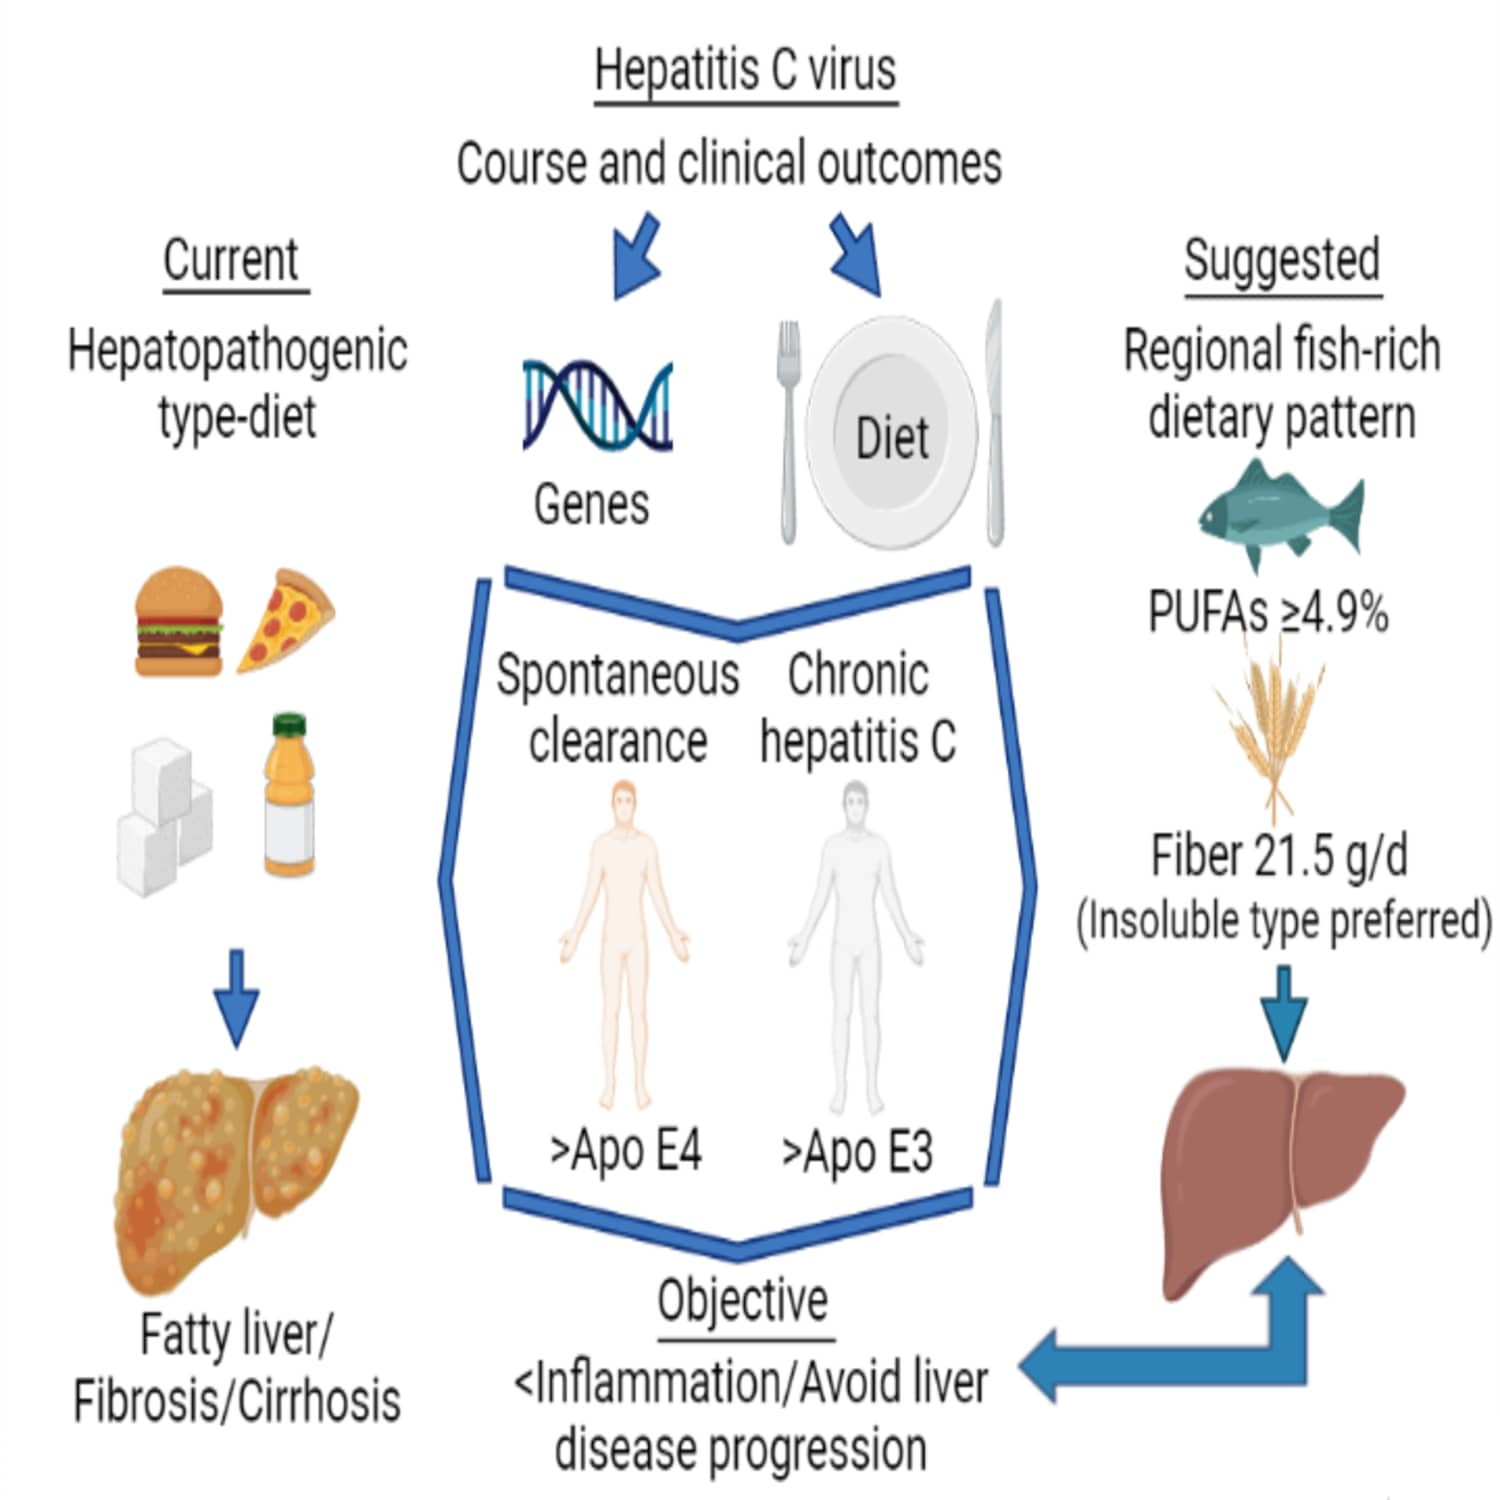
Adherence to a Fish-Rich Dietary Pattern Is Associated with Chronic Hepatitis C Patients Showing Low Viral Load: Implications for Nutritional Management

by
Claudia Ojeda-Granados
1,2,
Arturo Panduro
1,2,
Karina Gonzalez-Aldaco
1,2,
Ingrid Rivera-Iñiguez
1,2,
Liliana Campos-Medina
1,2 and
Sonia Roman
1,2,*
1
Department of Molecular Biology in Medicine, Civil Hospital of Guadalajara “Fray Antonio Alcalde”, Hospital #278, Col. El Retiro, Guadalajara 44280, Jalisco, Mexico
2
Health Sciences Center, University of Guadalajara, Guadalajara 44340, Jalisco, Mexico
*
Author to whom correspondence should be addressed.
Submission received: 3 September 2021 / Revised: 19 September 2021 / Accepted: 20 September 2021 / Published: 23 September 2021
(This article belongs to the Special Issue Dietary Pattern and Nutrients Intake on Chronic Diseases)

Abstract

:
Hepatitis C virus (HCV) infection is influenced by genetic (e.g., APOE polymorphisms) and environmental factors between the virus and the host. HCV modulates the host’s lipid metabolism but dietary components influence lipids and in vitro HCV RNA replication. Few data exist on the role of dietary features or patterns (DPs) in HCV infection. Herein, we aimed to evaluate the nutritional profiles of chronic HCV (CHC) and spontaneous clearance (SC) Mexican patients in the context of APOE alleles and their correlation with HCV-related variables. The fibrosis-related APOE ε3 allele prevailed in CHC and SC patients, who had four DPs (“meat and soft drinks”, DP1; “processed animal and fried foods”, DP2; “Mexican-healthy”, DP3; and “fish-rich”, DP4). In CHC subjects, polyunsaturated fatty acid intake (PUFA ≥ 4.9%) was negatively associated, and fiber intake (≥21.5 g/day) was positively associated with a high viral load (p < 0.036). High adherence to fish-rich DP4 was associated with a higher frequency of CHC individuals consuming PUFA ≥ 4.9% (p = 0.004) and low viral load (p = 0.036), but a lower frequency of CHC individuals consuming fiber ≥21.5 g/day (p = 0.038). In SC and CHC individuals, modifying unhealthy DPs and targeting HCV-interacting nutrients, respectively, could be part of a nutritional management strategy to prevent further liver damage.

Graphical Abstract

1. Introduction

Chronic hepatitis C virus (HCV) infection is a leading cause of chronic liver disease along with hepatitis B virus infection, alcohol-related liver disease, and the emerging metabolic-associated fatty liver disease [1,2,3]. According to the World Health Organization, 58 million people are chronically infected, and 290,000 deaths per year are related to HCV infection [1]. Chronic HCV (CHC) infection is epidemiologically heterogenous in regard to prevalence rates and associated risk factors. Furthermore, interactions between the distinct virus types (genotypes 1–7) and their putative host populations are regulated by genetic, immune, and metabolic factors influencing the natural course of HCV infection [4]. In this sense, there is increasing evidence that HCV modulates the host’s lipid metabolism to enhance its life cycle [5]. HCV favors a lipid-rich intrahepatocyte but lipid-depleted extrahepatic environment by promoting lipogenesis, down-regulating fatty acid oxidation, and impairing very-low-density lipoprotein (VLDL-c) secretion [6,7]. The resulting metabolic phenotype in chronically infected patients is often characterized by serum hypocholesterolemia, hypobetalipoproteinemia, and in some cases, liver steatosis, insulin resistance, or type 2 diabetes mellitus [8,9].
As a complex process, lipid metabolism is in turn influenced by environmental factors, such as diet [10]. For example, Western-style diets, typically high in energy intake, saturated fatty acids (SFA), cholesterol, simple sugars, and an increased ratio of n-6:n-3 polyunsaturated fatty acids (PUFA) have been shown to increase the risk of chronic inflammatory non-communicable diseases such as obesity, T2DM, and cardiovascular diseases, metabolic-associated fatty liver disease, as well as certain cancers [11,12]. Notably, some specific dietary components enhance in vitro HCV RNA replication, such as excess SFA (e.g., lauric, myristic, and palmitic) or monounsaturated fatty acids (MUFA), vitamin E, and resveratrol [13,14]. Conversely, some foods or nutrients, denoted as “anti-HCV nutrients” (i.e., PUFA-rich fish, n-3 PUFA supplementation, linoleic, arachidonic, docosahexaenoic, and eicosapentaenoic PUFA, β-carotene, vitamin D, and gallic acid) have been shown to interfere with viral replication mechanisms [13,15,16,17,18] or to have protective effects against adverse health outcomes associated with HCV infection [19,20]. Additionally, some key genetic and metabolic factors associated with HCV spontaneous clearance (SC) status or less liver damage in chronic HCV (CHC) patients [21,22] have emerged. Hypercholesterolemia associated with the apolipoprotein E (APOE) ε4 allele, and overweight have been reported to be more prevalent in SC subjects [23]. Likewise, the ε4 allele in CHC has been related to hypercholesterolemia but less liver damage than the ε3 allele, carriers of which show advanced fibrosis [23].
Diverse nations around the world, including Mexico, have shifted their regional food culture towards a globalized Western-style diet or pattern [24,25,26,27]. In Mexico, it is denoted as a hepatopathogenic diet due to its association with the onset and progression of liver damage in non-HCV patients [27,28]. Indeed, Western-like diets or patterns have been associated with a worse metabolic profile, including increased insulin resistance, blood pressure, and liver fibrosis, in HCV patients, indirectly impairing the response to antiviral treatment, as well as resulting in a direct risk of hepatocellular carcinoma [29,30,31]. Nonetheless, no data exist on dietary features or dietary patterns (DPs) in anti-HCV-positive patients and the likely impact on their clinical profile when coupled with a lipid-related genetic factor such as APOE. In this study, we aimed to analyze the nutritional profiles of HCV treatment-naive Mexican patients in the context of APOE ε2, -ε3, and -ε4 alleles and to assess their correlation with the clinical outcomes of HCV infection.

2. Materials and Methods

2.1. Study Design and Patients

A detailed description of the study protocol complying with the Declaration of Helsinki ethical guidelines and approved by the Institutional Review Board (Health Sciences Center, University of Guadalajara, Certificate #CI-00612) is provided elsewhere [23]. Briefly, from January 2014 to December 2016, adult patients were included in the study if they were serologically positive for anti-HCV antibodies, treatment-naive, and unrelated. The exclusion criteria were chronic hepatitis B virus or human immunodeficiency virus infections, autoimmune liver disease, Child–Pugh classes B and C, Wilson’s disease, hemochromatosis, drinkers, and use of hypolipidemic drugs. Patients were enrolled at the Nutrigenetic Clinic, Department of Molecular Biology in Medicine, Civil Hospital of Guadalajara “Fray Antonio Alcalde” in Guadalajara, Mexico. After passing exclusion criteria and undergoing quantitative serum HCV RNA assessment by RT-qPCR (Roche COBAS® AmpliPrep and COBAS® TaqMan 48 HCV test, Pleasanton, CA, USA), individuals were grouped as SC or CHC patients if they had at least two undetectable serum HCV RNA results or if they had two detectable serum HCV RNA results, respectively, in the preceding 12 months with a six-month interval between tests.
For this secondary retrospective analysis, anti-HCV-positive patients from the first cohort (SC and CHC) with data on demographic, clinical, and genetic features (i.e., genotyping of APOE rs429358 and rs7412 polymorphisms), as well as their nutritional assessment, were included to analyze their dietary profiles and their clinical correlations in the context of the APOE-ε2, -ε3, and -ε4 alleles.

2.2. Clinical Data

Clinical data comprised the anthropometric and biochemical features of patients. Anthropometric variables included height, measured with a stable stadiometer (seca GmbH & Co. KG, Hamburg, Germany), and body composition parameters (i.e., weight, body fat percentage, and body mass index, BMI) that were determined by bioelectrical impedance analysis using the InBody 3.0 analyzer (InBody Co., Seoul, Korea). Normal weight (≥18.5–24.99 kg/m2), overweight (≥25.0–29.99 kg/m2), and obesity (≥30.0 kg/m2) were defined according to BMI and World Health Organization criteria.
Laboratory tests were performed on venous blood samples collected after a 12 h overnight fast to determine platelet count, total bilirubin, and total cholesterol, and concentrations of glucose, albumin, triglycerides, high-density lipoprotein cholesterol (HDL-c), alanine aminotransferase (ALT), aspartate aminotransferase (AST), and gamma-glutamyl transferase (GGT) through a biochemical analyzer (Vitros 250, Ortho Clinical Diagnostics, Johnson & Johnson, Rochester, NY, USA). The LDL-c level was estimated with the Friedewald formula [32], and VLDL-c as total cholesterol (LDL-c + HDL-c). The biochemical variables of glucose, platelet count, albumin, total bilirubin, and GGT previously associated with liver damage [33] were considered in CHC subjects.

2.3. Lipid Profile Abnormalities

Hypercholesterolemia (≥200 mg/dL), hypertriglyceridemia (≥150 mg/dL), elevated LDL-c (≥130 mg/dL), and hypoalphalipoproteinemia (HDL-c ≤ 40 mg/dL in men and ≤50 mg/dL in women) were diagnosed by considering the criteria of the National Cholesterol Education Program ATP III [34] and the Norma Oficial Mexicana NOM-037-SSA2-2012 for the treatment of dyslipidemia [35].

2.4. APOE Genotyping

The APOE rs429358 and rs7412 polymorphisms leading to the common ε2, ε3, and ε4 alleles were determined by allelic discrimination assays and real-time PCR using genomic DNA samples isolated from white blood cells. In particular, the predesigned TaqMan® SNP Genotyping Assays C___3084793_20 and C____904973_10 (Applied Biosystems, Life Technologies, Foster City, CA, USA) were employed to perform the experiments on a StepOnePlus thermocycler (Applied Biosystems, Life Technologies, Foster City, CA, USA) by setting an initial enzyme activation step for 10 min at 95 °C, followed by 40 cycles of denaturalization for 15 s at 95 °C and annealing/extension for 1 min at 60 °C. The APOE ε2, -ε3, and -ε4 allele frequencies were derived by direct counting. For analysis purposes and according to the known contribution of APOE alleles to the lipid profile, APOE genotypes were classified as E2 (ε2ε2 + ε2ε3 + ε2ε4), E3 (ε3ε3), or E4 (ε3ε4 + ε4ε4) genotype groups.

2.5. Nutritional Assessment

Two dietary assessment tools were administered to evaluate the patients’ dietary profile, the 24 h recall to determine their habitual intake, and the food frequency questionnaire (FFQ) to derive their dietary patterns through a data-driven method (i.e., exploratory factor analysis, EFA) [36].
In detail, three 24 h recalls (two weekdays and one weekend day) were administered to participants by trained dietitians as an in-person interview [37]. Dietary recall methodology consisted of five steps: (1) the quick list—subjects were asked to recall all foods and beverages consumed during the previous 24 h; (2) the forgotten foods list—subjects were asked to recall on categories of foods that have been documented as frequently forgotten; (3) time/occasion—subjects were asked to recall the time and occasion at which foods were consumed; (4) the detail cycle—participants were asked to give details related to the amount, portion sizes, characteristics, preparation styles and recipes of the foods and beverages consumed; and (5) the final probe—probes of portion sizes of foods and beverages using measuring cups to have a better estimation.
Collected data from the 24 h recalls were then processed with NutriKal® VO software (Consinfo S.C., CDMX, Mexico) to estimate patients’ daily energy and macro- and micronutrient intake for correlation analyses. This software uses foods from the USDA National Nutrient Database for Standard Reference, Release 24 [38] and contains the composition tables compiled by the Instituto Nacional de Ciencias Médicas y Nutrición Salvador Zubirán (INCMNSZ) and the information derived from the Mexican Equivalent Food System [39], as well as the information from industrialized foods available in our country and the result of the nutritional calculation of typically consumed dishes.

2.6. Dietary Pattern Analysis

Dietary information from a 64-item adjusted FFQ [40], with a five-choice frequency scale comprising daily, 1–2 times per week, ≥3 times per week, once every 15 days, and once per month, was instead considered to derive typical DPs among anti-HCV-positive patients. The 64 FFQ items were reorganized into 23 food groups based on the similarity of their nutritional content. DPs were generated using the EFA method [36]. To this end, the adequacy of the sample size was first checked using the Kaiser–Meyer–Olklin (KMO) test, considering a value of ≥0.60 as acceptable [41]. Then, a principal axis factor extraction method and an orthogonal varimax factor rotation strategy were applied for the EFA [42]. A parallel analysis was conducted to determine the number of factors (i.e., dietary patterns) to be selected [41]. Accordingly, only factors (dietary patterns) with original eigenvalues above their corresponding randomly generated eigenvalues (95th percentile value) were retained [43]. Next, to identify variables (i.e., food groups) as highly representative of the identified DPs, a cutoff value of ≥0.30 for factor loadings was considered indicative of a strong association between a food group and DP [44]. Thus, DPs were named considering the most representative food groups in it. Finally, to analyze the relationship between adherence to the identified DPs and variables associated with HCV infection, DP factor scores obtained for each individual and representing the level of adherence to the identified DPs were classified into tertiles (T1, T2, and T3), with values in the T3 tertiles being associated with greater adherence.

2.7. Statistical Analysis

Statistical analyses and EFA were conducted using the IBM SPSS v.20 software (IBM Corp, Inc., Chicago, IL, USA). A p-value < 0.05 was considered for statistical significance on two-sided tests. Categorical variables were expressed as frequencies and percentages and analyzed with chi-square test, while continuous variables were analyzed as means ± standard deviation. The normality distribution of quantitative variables was assessed with the Kolmogorov–Smirnov test with Lilliefors significance correction. Thus, variables with normal and non-normal distributed data were analyzed with Student’s t-test and Mann–Whitney U test, respectively. For the latter, the median, first quartile (Q1), and third quartile (Q3) were also reported. Differences in nutritional profile variables according to the APOE genotype group in CHC and SC patients were evaluated with the non-parametric Kruskal–Wallis test, because there were some genotype groups with fewer than 30 patients. A value <600,000 IU/mL of HCV RNA, referred to as low baseline viral load [45], was considered to classify CHC patients into low or high (≥600,000 IU/mL) viral load.
The dietary variables associated with HCV viral load were identified by univariate and multivariate logistic regression analysis. Results were expressed as an odds ratio with a 95% confidence interval. The robustness of the regression model was tested using the Hosmer–Lemeshow method. An area under the receiver-operating characteristic (ROC) curve analysis was performed to determine optimal cutoff values for variables associated with HCV viral load. Differences in the frequency of CHC patients with HCV-related variables concerning adherence to identified DPs were assessed with a chi-square test.

3. Results

3.1. Demographic, Clinical, and Genetic Characteristics of Patients

The clinical and genetic characteristics of anti-HCV-positive patients are depicted in Table 1. No significant differences in gender, body fat percentage, or BMI were found between CHC and SC groups. However, according to BMI classification, CHC patients were more frequently in the normal weight range than SC subjects (34.8% vs. 19.6%, p = 0.045). Consistent with the peculiar lipid and metabolic profile related to chronic infection, the CHC group showed lower levels of total cholesterol, triglycerides, LDL-c, and VLDL-c, but increased ALT, AST, and GGT compared to the SC group (p < 0.001). In contrast, lipid abnormalities (i.e., hypercholesterolemia, hypertriglyceridemia, and elevated LDL-c) were more frequent in SC than in CHC patients (p < 0.020).
Regarding the APOE genotyping data, no differences were observed in the distribution of genotype or allele frequencies between the CHC and SC groups. APOE ε3 allele was the most frequent among both groups, whereas the frequency of the ε4 allele was higher in SC subjects than in CHC subjects.

3.2. Nutritional Profile of CHC and SC Patients According to APOE Genotype Group

The nutritional profile, including anthropometric and dietary features, of CHC and SC patients according to their APOE genotype group is displayed in Table 2. No significant differences were observed in the nutritional profile of CHC or SC subjects according to their APOE genotype group. However, both groups of patients showed dietary features typical of a hepatopathogenic diet, such as a high mean intake of SFA, cholesterol, carbohydrates, and added sugars, and a low mean intake of MUFA, PUFA, and fiber. Compared to the Recommended Dietary Allowance (RDA) values [46], the mean intake of some micronutrients with a potential effect on liver function, particularly vitamin E, folates, pyridoxine, and selenium, was deficient.

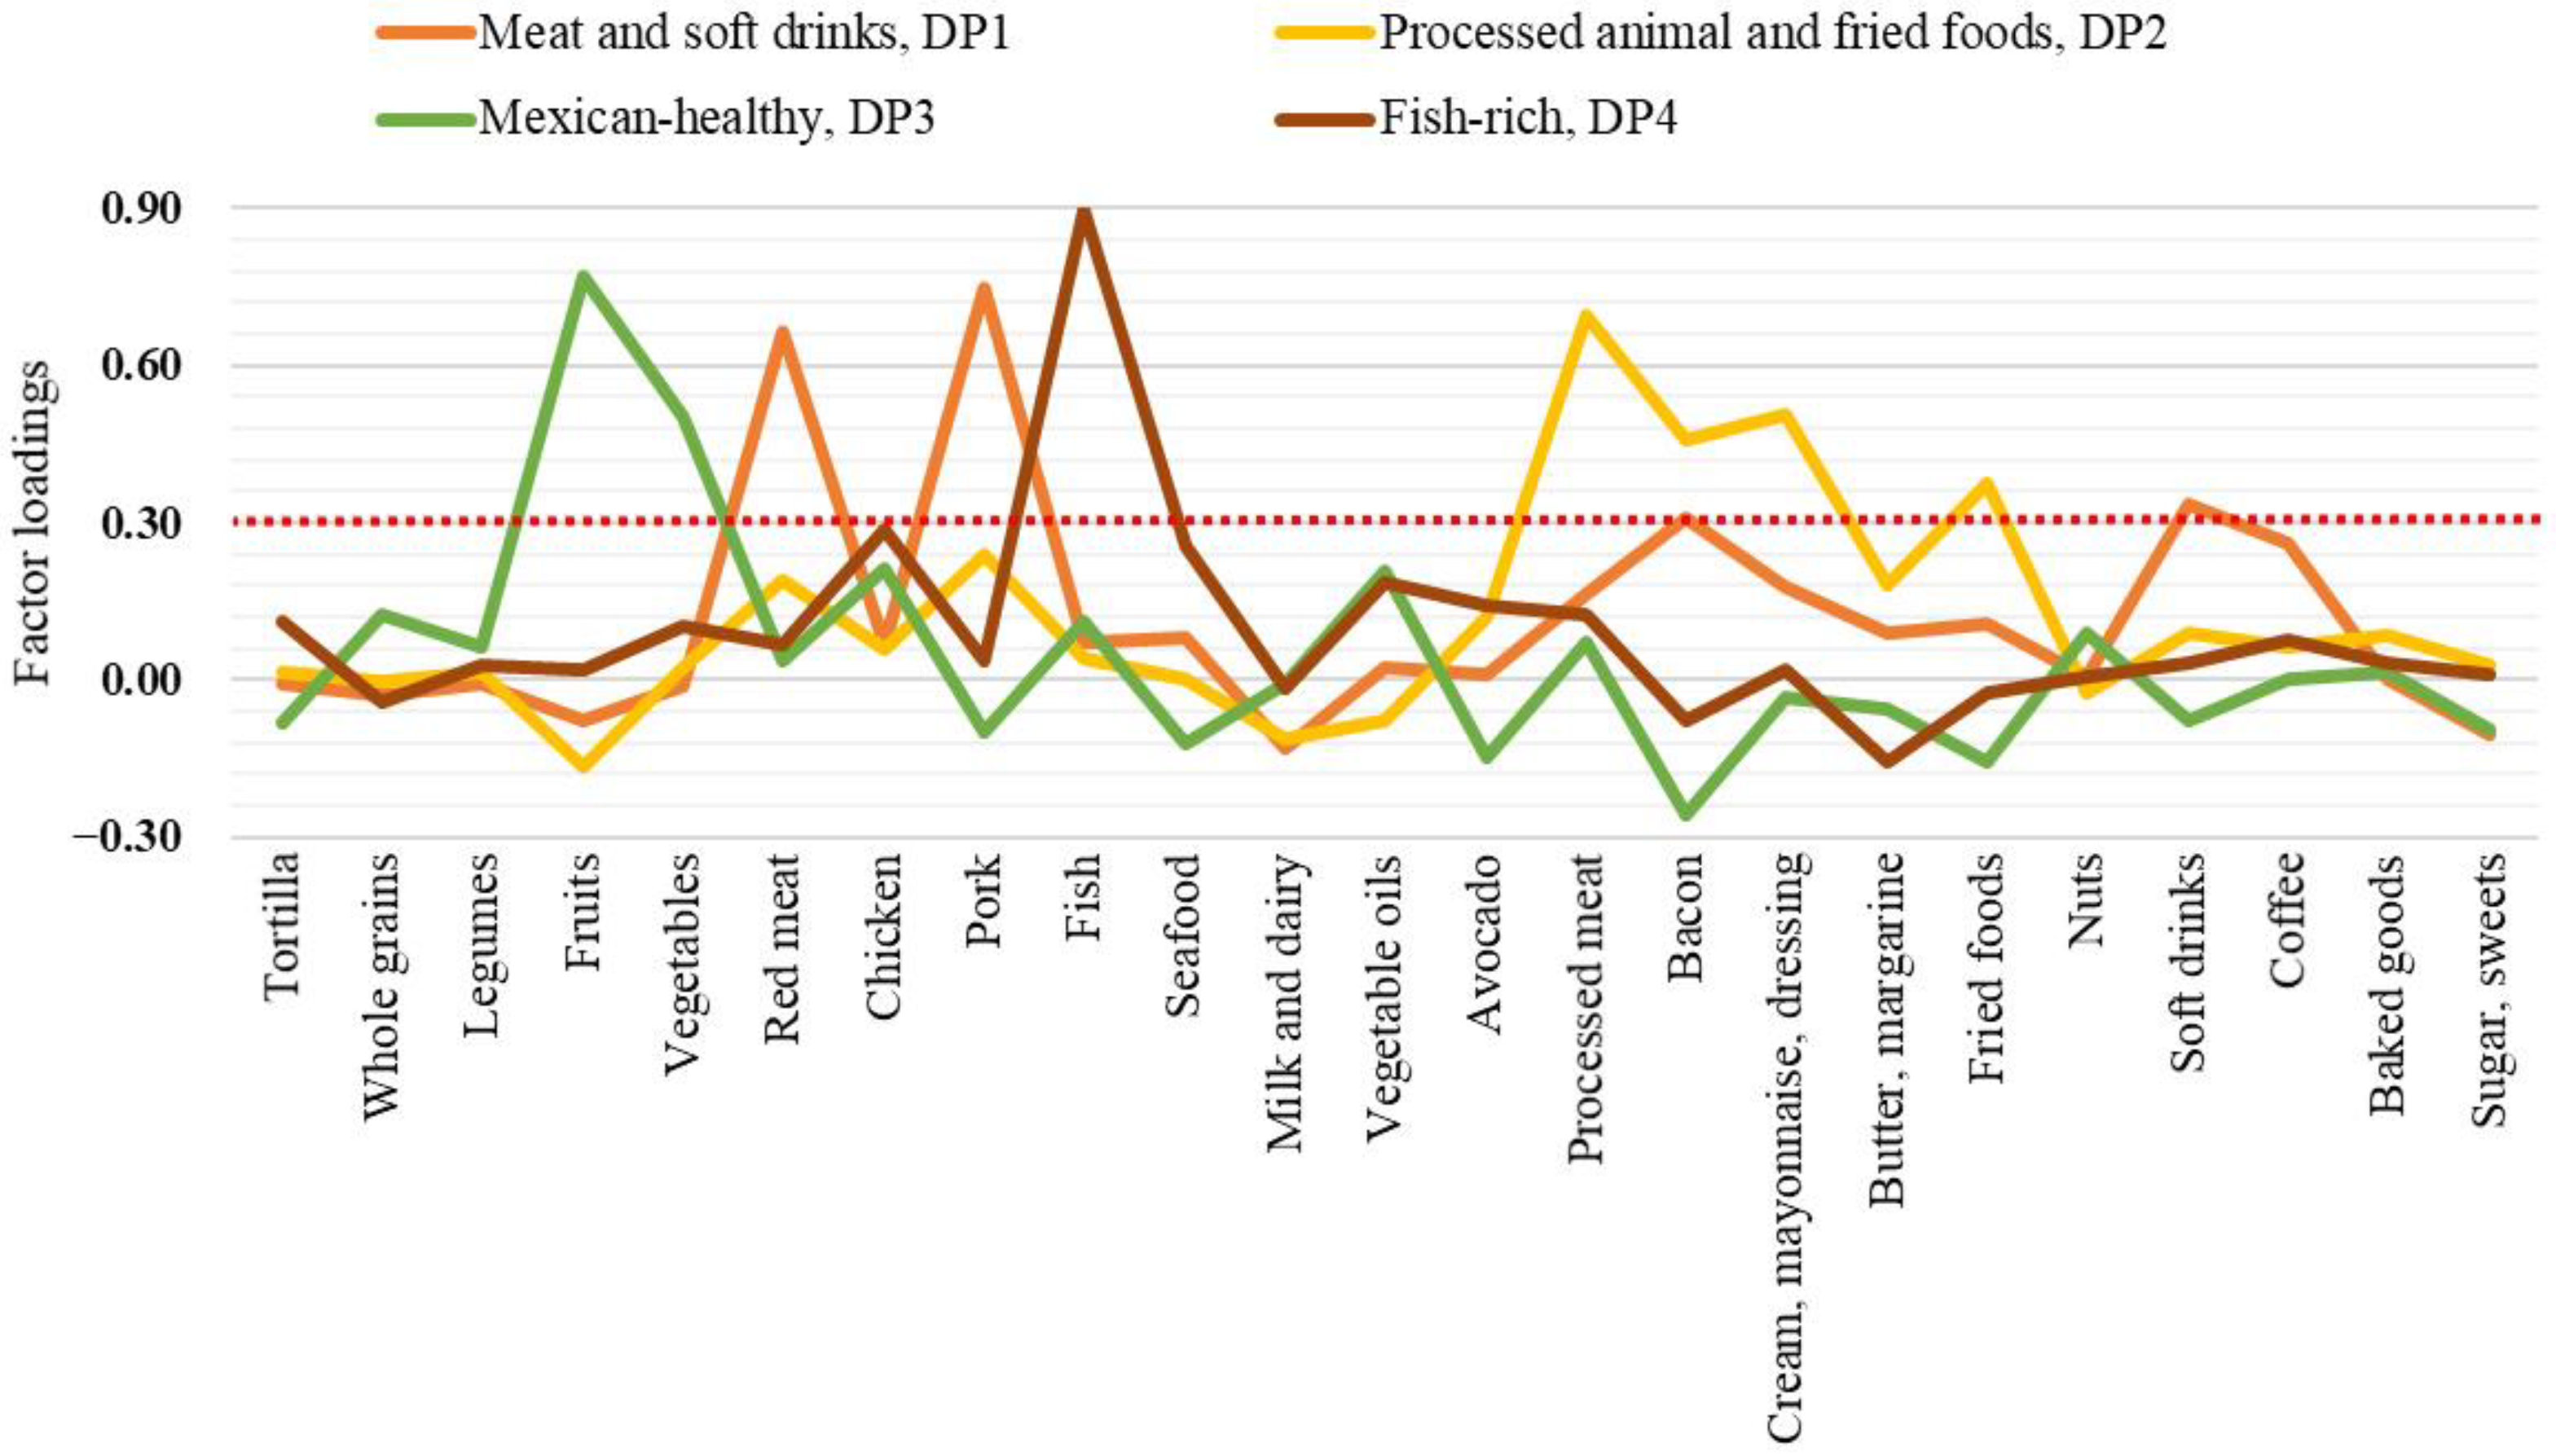
3.3. Identification of Dietary Patterns among CHC and SC Patients

To identify the food groups that contribute the most to the habitual dietary characteristics of CHC and SC subjects, an EFA was conducted on data from a 64-item FFQ, reorganized into 23 food groups. A KMO test value of 0.60 was obtained, indicating an acceptable sample size to run the EFA. According to the parallel post-EFA analysis, four main factors (i.e., dietary patterns) were identified, which accounted for 36.9% of the total variance. Each DP was named considering the kind of those food groups representative in it based on the factor loading scores cutoff value of ≥0.30 (Figure 1 and Supplementary Table S1).
Accordingly, the meat and soft drinks DP1 was mainly characterized by pork, red meat, soft drinks, and animal fat (bacon) and the processed animal and fried foods DP2 featured processed meat, animal fats (cream, mayonnaise, dressings, and bacon), and fried foods. These DPs, primarily represented by Western-type foods, accounted for 13.8% and 8.2% of the total variance, respectively. The Mexican-healthy DP3 was characterized mainly by fruits and vegetables, although chicken, vegetable oils, and whole grains were also present. Finally, the fish-rich DP4 was strongly defined by fish, but seafood and vegetable oils were also found. The later accounted for 7.6% and 7.3% of the total variance.

3.4. Association of Nutritional and Biochemical Characteristics with the Clinical Outcome of HCV Infection

The relationship between some nutritional profile characteristics and biochemical variables, previously related to liver damage, with low or high viral load in CHC patients, was evaluated (Table 3). CHC subjects with low viral load had significantly higher intakes of total fat and PUFA, while those with high viral load had a higher fiber intake and showed higher ALT and GGT.
Univariate and multivariate logistic regression analysis was then performed to assess the association of the most relevant dietary characteristics with a high viral load (Table 4). PUFA intake was negatively associated, and fiber intake was positively associated with a high viral load (p < 0.036). The area under the ROC curve analysis was conducted to estimate the optimal intake cutoff values of PUFA and fiber related to a low and high viral load, respectively (Table 5).

3.5. Association of Adherence to Dietary Patterns with HCV-Related Variables

Finally, considering the estimated cutoff values of PUFA and fiber that were found to be associated with HCV viral load, the relationship between adherence to the identified dietary patterns and the frequency of patients with low or high viral load as well as PUFA and fiber intake corresponding to the cutoff value was evaluated (Table 6). Only high adherence (T3) to the fish-rich DP4 was associated with a higher frequency of patients with PUFA intake ≥4.9% and low viral load, and in turn, a lower frequency of patients with fiber intake ≥21.5 g/day compared to low adherence (T1) to such dietary pattern.

4. Discussion

The clinical outcomes of HCV infection are modulated by the interplay of genetic and environmental factors between the virus and the host. On the one hand, HCV is genetically classified into seven genotypes and >40 subtypes with a heterogeneous geographic distribution (different hosts’ ethnicities). Such genetic variability has pathogenic and clinical implications [47]. On the other hand, several human genes are known to modulate the immune response system, lipid transport, and lipid metabolism, as well as liver fibrogenesis driven by HCV [4,8,48]. Ultimately, diet composition is an environmental factor that contributes to the onset and progression of liver disease in susceptible individuals and has been less explored in vivo in the context of CHC infection [29,30,49]. Studies in vitro have shown that HCV RNA replication can be modulated by the quality and quantity of certain macro- and micronutrients, some of which can directly or indirectly influence lipid metabolism [13,14,50].
This study revealed that, regardless of APOE allele type, both CHC and SC patients consumed a hepatopathogenic-type diet, in line with earlier findings from studies conducted in non-HCV patients with obesity-related dysfunctional metabolism [28,51]. This diet was rich in SFA, cholesterol, carbohydrates, and added sugars but deficient in MUFA, PUFA, fiber, and micronutrients with likely beneficial effects on liver function, evidencing that despite their medical condition, this group of patients is equally immersed in the obesogenic environment surrounding the Mexican population [52]. Furthermore, the paradoxically protective APOE ε4 allele in anti-HCV-positive subjects showed the frequency typical of the admixed population of West Mexico [53], but consistent with earlier findings [23], it was higher in SC patients, who also showed a higher frequency of lipid profile abnormalities than CHC subjects. However, the fibrosis-related APOE ε3 allele was the most frequent among both groups. Thus, besides the potentially risky APOE ε3 genetic factor prevalent in this population group, a hepatopathogenic-type diet might contribute to an increased risk of liver damage progression.
The identification of dietary patterns has been considered a more realistic representation of the food type and dietary habits of a population than the isolated consumption of nutrients [54]. Dietary intake follows a pattern of consumption, and the diet itself is a modifiable risk factor. In particular, four dietary patterns (i.e., meat and soft drinks, DP1, processed animal and fried foods, DP2, Mexican-healthy, DP3, and fish-rich, DP4) were identified in CHC and SC patients. DP1 and DP2, characterized mainly by pork, red meat, soft drinks, animal fat (e.g., bacon, cream, mayonnaise, and dressings), processed meat, and fried foods, accounted for the largest variance of dietary patterns. Interestingly, despite the consumption of these Western-like DPs, CHC individuals exhibited the peculiar, lowered profile of cholesterol, triglycerides, LDL-c, and VLDL-c compared to that of SC patients that have been reported by our research group [23] and other authors as well [9,55]. This alteration is explained by the fact that HCV hijacks the lipoprotein pathways exerting a plasmatic lipid-lowering effect even if the patients consume a lipid-rich diet associated with dyslipidemia, but at the cost of exhibiting fatty hepatocytes.
In addition, this study found differences in some dietary characteristics of CHC patients in relation to their viral load. Specifically, subjects with low viral load showed a significantly higher total fat intake than those with high viral load. Moreover, PUFA intake was negatively associated, whereas fiber intake was positively associated with elevated HCV RNA viral load. In this regard, in vitro studies have shown that long-chain PUFA, such as arachidonic acid (20:4 n-6), docosahexaenoic acid (22:6 n-3), and eicosapentaenoic acid (20:5 n-3), suppressed the expression of genes that regulate enzymes involved in hepatic fatty acid and triglyceride biosynthesis, particularly sterol regulatory element-binding protein-1c (SREBP-1c) and fatty-acid synthase, as well as HCV RNA replication [13,56]. These effects were independent of PUFA’s ability to antagonize liver X nuclear receptors (LXR) that transcriptionally regulate SREBPs (i.e., the LXR-SREBP-1c pathway); yet the mechanism of these effects remains unclear [13].
Another in vitro study provided evidence that eicosapentaenoic acid (20:5 n-3) and arachidonic acid (20:4 n-6) counteracted the fatty acid enzyme delta-9 desaturase enhanced effect by which HCV core protein induces steatosis [50]. Although the specific mechanisms underlying the anti-HCV activity of PUFA have not been fully elucidated, it has been suggested that they may be closely related to the downregulatory activity of some hepatic lipogenic genes, which are also key to HCV-induced lipogenesis for its efficient replication cycle [13]. Furthermore, the few and small clinical studies performed so far have yielded inconsistent results. While some have failed to demonstrate the benefits of PUFA [57,58], others have evidenced the protective effects of n-3 PUFA-rich fish or n-3 PUFA supplementation against detrimental variables associated with HCV infection [19,20].
Concerning fiber consumption, to our knowledge, there are no studies showing its effects in the context of HCV infection. However, we could hypothesize that the association of a fiber intake ≥21.5 g/day with a high viral load might be a collateral effect related to its blood-lipid-lowering properties. Dietary fiber is classified into insoluble and soluble fibers. Insoluble fibers (i.e., lignin, cellulose, and hemicellulose), present in cereals, whole-grain foods, bran, and nuts, help to increase fecal mass, decrease intestinal transit time and serve as a laxative agent when sufficient liquid is consumed [59]. Instead, soluble fibers (e.g., pectin, celluloses, water-soluble gums, fructans, and some resistant starches) present in certain fruits, vegetables, seeds, avocado, oats, and legumes, due to their viscosity and fermentable properties, can reduce postprandial plasma glucose and cholesterol levels through the production of short-chain fatty acids [59]. A fiber-rich diet (>24 g per 1000 kcal), mainly of the soluble type, has been shown to reduce total blood cholesterol and LDL-c levels to their lowest levels, regardless of the amount of other blood lipid dietary modifiers, such as SFA and cholesterol [60]. Therefore, a soluble-type fiber-rich diet might be counterproductive in CHC patients because it may contribute to the lipid-depleted extrahepatic environment that HCV itself promotes.
Treatment of HCV infection has advanced notably in the last decade in terms of developing more effective therapies such as the direct-acting antiviral agents (DAAs) for the promising eradication of HCV while reducing the risk factors involved in liver damage, including necroinflammation, steatosis, cirrhosis, and hepatocellular carcinoma [61]. However, patients living in low-income and middle-income countries such as Latin America do not have immediate access to DDA therapy [62]. Therefore, lifestyle modifications, including diet, are validated resources to manage patients with liver disease [27,30]. Based on the preliminary evidence found in this study, specific nutrients or DPs might play an essential role in modulating the natural course of the infection after the acquisition of HCV, i.e., within the acute phase (first six months) while waiting for confirmation of infection status (chronicity) and during therapy.
In addition, it has recently been documented that patients who achieve a sustained virological response, either by interferon or non-interferon regimens (DAAs), are still at risk of post-therapy clinical complications [63,64]. Furthermore, in the development of chronic liver disease, co-morbidities other than HCV infection, such as obesity, diabetes, metabolic-associated fatty liver, and even co-infection with hepatitis B or HIV, can overlap, acting synergically towards liver damage (cirrhosis) in a single patient. Therefore, the results obtained in this study have implications for the nutritional management of SC and CHC patients focused on improving liver function.
The limitations of the present study were that the specific type of PUFA, fiber, or n-6:n-3 PUFA ratio was not evaluated, nor could we break down all nutrients, specifically vitamin D and iodine related to fish consumption. There was also no possibility to calculate the intake. Nonetheless, despite the retrospective, cross-sectional nature of the study, it revealed that high adherence to the identified fish-rich DP4 was associated with a higher frequency of CHC subjects with PUFA intake ≥4.9% and low viral load, but a lower frequency of individuals consuming ≥21.5 g/day of fiber. Although this DP likely has nutritional characteristics that might benefit this group of patients, further prospective nutrigenetic studies are warranted.
Understanding the wide range of healthy and detrimental dietary patterns worldwide provides valuable knowledge to prevent chronic diseases [65,66,67,68]. However, when designing nutritional interventions strategies containing healthy dietary components, these should be tailored to the population’s genetic background, regional foods, and culinary culture [27,69]. Therefore, in summary, for SC patients with a genetic (ε4 allele) and metabolic profile related to a higher frequency of lipid abnormalities (i.e., hypercholesterolemia, hypertriglyceridemia, and elevated LDL-c), it is essential to address the hepatopathogenic and Western-like dietary characteristics to prevent further metabolic abnormalities or liver fibrosis progression linked to this type of proinflammatory diet. In CHC patients, in whom the fibrosis-related ε3 allele is also frequent, in addition to addressing the above, it seems that a lipid-rich diet might also be of benefit, especially one containing long-chain PUFA with an adequate n-6:n-3 ratio, and a fiber intake, mainly of the insoluble type, kept at the lower limit of the daily recommendation. Further large-scale clinical trials are required to confirm these observations or add new evidence.

Supplementary Materials

The following are available online at https://www.mdpi.com/article/10.3390/nu13103337/s1, Table S1: Factor loading matrix of main dietary patterns identified in anti-HCV-positive patients.

Author Contributions

Conceptualization, S.R., C.O.-G. and A.P.; methodology, C.O.-G., I.R.-I. and S.R.; investigation, C.O.-G., A.P.; K.G.-A.; I.R.-I., L.C.-M. and S.R.; formal analysis, C.O.-G. and K.G.-A.; data curation, L.C.-M.; resources, A.P. and S.R.; writing—original draft preparation, C.O.-G.; writing—review and editing, C.O.-G., S.R., K.G.-A.; I.R.-I., L.C.-M. and S.R.; supervision, A.P.; project administration, S.R. and A.P.; funding acquisition, A.P. All authors have read and agreed to the published version of the manuscript.

Funding

This research was partially funded by Consejo Nacional de Ciencia y Tecnología (CONACYT) to A.P. (Grant No. 2017-01-5254).

Institutional Review Board Statement

The study was conducted according to the guidelines of the Declaration of Helsinki and approved by the Institutional Review Board (Health Sciences Center, University of Guadalajara, Certificate #CI-00612).

Informed Consent Statement

Informed consent was obtained from all subjects involved in the study.

Data Availability Statement

The data presented in this study are available on request from the corresponding author. The data are not publicly available due to policies of patients’ data privacy.

Acknowledgments

L.C.-M. is a recipient of a researcher assistantship (CONACYT/SNI 2020-2021).

Conflicts of Interest

The authors declare no conflict of interest.

References

  1. World Health Organization. Hepatitis C Fact Sheet. Available online: https://www.who.int/news-room/fact-sheets/detail/hepatitis-c (accessed on 27 July 2021).
  2. Paik, J.M.; Golabi, P.; Younossi, Y.; Mishra, A.; Younossi, Z.M. Changes in the Global Burden of Chronic Liver Diseases From 2012 to 2017: The Growing Impact of NAFLD. Hepatology 2020, 72, 1605–1616. [Google Scholar] [CrossRef]
  3. Eslam, M.; Sanyal, A.J.; George, J. International Consensus Panel MAFLD: A Consensus-Driven Proposed Nomenclature for Metabolic Associated Fatty Liver Disease. Gastroenterology 2020, 158, 1999–2014.e1. [Google Scholar] [CrossRef]
  4. Cai, T.; Dufour, J.-F.; Muellhaupt, B.; Gerlach, T.; Heim, M.; Moradpour, D.; Cerny, A.; Malinverni, R.; Kaddai, V.; Bochud, M.; et al. Viral Genotype-Specific Role of PNPLA3, PPARG, MTTP, and IL28B in Hepatitis C Virus-Associated Steatosis. J. Hepatol. 2011, 55, 529–535. [Google Scholar] [CrossRef]
  5. Grassi, G.; Di Caprio, G.; Fimia, G.M.; Ippolito, G.; Tripodi, M.; Alonzi, T. Hepatitis C Virus Relies on Lipoproteins for Its Life Cycle. World J. Gastroenterol. 2016, 22, 1953–1965. [Google Scholar] [CrossRef] [PubMed]
  6. Syed, G.H.; Amako, Y.; Siddiqui, A. Hepatitis C Virus Hijacks Host Lipid Metabolism. Trends Endocrinol. Metab. 2010, 21, 33–40. [Google Scholar] [CrossRef] [Green Version]
  7. Syed, G.H.; Tang, H.; Khan, M.; Hassanein, T.; Liu, J.; Siddiqui, A. Hepatitis C Virus Stimulates Low-Density Lipoprotein Receptor Expression to Facilitate Viral Propagation. J. Virol. 2014, 88, 2519–2529. [Google Scholar] [CrossRef] [PubMed] [Green Version]
  8. Bassendine, M.F.; Sheridan, D.A.; Bridge, S.H.; Felmlee, D.J.; Neely, R.D.G. Lipids and HCV. Semin. Immunopathol. 2013, 35, 87–100. [Google Scholar] [CrossRef] [PubMed]
  9. Butt, A.A.; Yan, P.; Simon, T.G.; Chung, R.T.; Abou-Samra, A.-B.; ERCHIVES Study Team. Changes in Circulating Lipids Level over Time after Acquiring HCV Infection: Results from ERCHIVES. BMC Infect. Dis. 2015, 15, 510. [Google Scholar] [CrossRef] [PubMed] [Green Version]
  10. González-Becerra, K.; Ramos-Lopez, O.; Barrón-Cabrera, E.; Riezu-Boj, J.I.; Milagro, F.I.; Martínez-López, E.; Martínez, J.A. Fatty Acids, Epigenetic Mechanisms and Chronic Diseases: A Systematic Review. Lipids Health Dis. 2019, 18, 178. [Google Scholar] [CrossRef] [Green Version]
  11. Christ, A.; Lauterbach, M.; Latz, E. Western Diet and the Immune System: An Inflammatory Connection. Immunity 2019, 51, 794–811. [Google Scholar] [CrossRef]
  12. Torres-Castillo, N.; Silva-Gómez, J.A.; Campos-Perez, W.; Barron-Cabrera, E.; Hernandez-Cañaveral, I.; Garcia-Cazarin, M.; Marquez-Sandoval, Y.; Gonzalez-Becerra, K.; Barron-Gallardo, C.; Martinez-Lopez, E. High Dietary ω-6:ω-3 PUFA Ratio Is Positively Associated with Excessive Adiposity and Waist Circumference. Obes. Facts 2018, 11, 344–353. [Google Scholar] [CrossRef] [PubMed]
  13. Kapadia, S.B.; Chisari, F.V. Hepatitis C Virus RNA Replication Is Regulated by Host Geranylgeranylation and Fatty Acids. Proc. Natl. Acad. Sci. USA 2005, 102, 2561–2566. [Google Scholar] [CrossRef] [PubMed] [Green Version]
  14. Nakamura, M.; Saito, H.; Ikeda, M.; Hokari, R.; Kato, N.; Hibi, T.; Miura, S. An Antioxidant Resveratrol Significantly Enhanced Replication of Hepatitis C Virus. World J. Gastroenterol. 2010, 16, 184–192. [Google Scholar] [CrossRef] [PubMed]
  15. Yano, M.; Ikeda, M.; Abe, K.-I.; Dansako, H.; Ohkoshi, S.; Aoyagi, Y.; Kato, N. Comprehensive Analysis of the Effects of Ordinary Nutrients on Hepatitis C Virus RNA Replication in Cell Culture. Antimicrob. Agents Chemother. 2007, 51, 2016–2027. [Google Scholar] [CrossRef] [PubMed] [Green Version]
  16. Gutierrez, J.A.; Jones, K.A.; Flores, R.; Singhania, A.; Woelk, C.H.; Schooley, R.T.; Wyles, D.L. Vitamin D Metabolites Inhibit Hepatitis C Virus and Modulate Cellular Gene Expression. J. Virol. Antivir. Res. 2014, 3. [Google Scholar] [CrossRef] [Green Version]
  17. Shibata, C.; Ohno, M.; Otsuka, M.; Kishikawa, T.; Goto, K.; Muroyama, R.; Kato, N.; Yoshikawa, T.; Takata, A.; Koike, K. The Flavonoid Apigenin Inhibits Hepatitis C Virus Replication by Decreasing Mature MicroRNA122 Levels. Virology 2014, 462–463, 42–48. [Google Scholar] [CrossRef] [PubMed]
  18. Govea-Salas, M.; Rivas-Estilla, A.M.; Rodríguez-Herrera, R.; Lozano-Sepúlveda, S.A.; Aguilar-Gonzalez, C.N.; Zugasti-Cruz, A.; Salas-Villalobos, T.B.; Morlett-Chávez, J.A. Gallic Acid Decreases Hepatitis C Virus Expression through Its Antioxidant Capacity. Exp. Ther. Med. 2016, 11, 619–624. [Google Scholar] [CrossRef] [Green Version]
  19. Sawada, N.; Inoue, M.; Iwasaki, M.; Sasazuki, S.; Shimazu, T.; Yamaji, T.; Takachi, R.; Tanaka, Y.; Mizokami, M.; Tsugane, S.; et al. Consumption of N-3 Fatty Acids and Fish Reduces Risk of Hepatocellular Carcinoma. Gastroenterology 2012, 142, 1468–1475. [Google Scholar] [CrossRef]
  20. Freire, T.O.; Boulhosa, R.S.S.B.; Oliveira, L.P.M.; de Jesus, R.P.; Cavalcante, L.N.; Lemaire, D.C.; Toralles, M.B.P.; Lyra, L.G.C.; Lyra, A.C. N-3 Polyunsaturated Fatty Acid Supplementation Reduces Insulin Resistance in Hepatitis C Virus Infected Patients: A Randomised Controlled Trial. J. Hum. Nutr. Diet. 2016, 29, 345–353. [Google Scholar] [CrossRef]
  21. Mueller, T.; Fischer, J.; Gessner, R.; Rosendahl, J.; Böhm, S.; van Bömmel, F. Apolipoprotein E allele frequencies in chronic and self-limited hepatitis C suggest a protective effect of APOE4 in the course of hepatitis C virus infection. Liver Int. 2016, 36, 1267–1274. [Google Scholar] [CrossRef] [Green Version]
  22. Gomaa, H.E.; Mahmoud, M.; Saad, N.E.; Saad-Hussein, A.; Ismail, S.; Thabet, E.H.; Farouk, H.; Kandil, D.; Heiba, A.; Hafez, W. Impact of Apo E gene polymorphism on HCV therapy related outcome in a cohort of HCV Egyptian patients. J. Genet. Eng. Biotechnol. 2018, 16, 47–51. [Google Scholar] [CrossRef]
  23. Gonzalez-Aldaco, K.; Roman, S.; Torres-Valadez, R.; Ojeda-Granados, C.; Torres-Reyes, L.A.; Panduro, A. Hepatitis C Virus Clearance and Less Liver Damage in Patients with High Cholesterol, Low-Density Lipoprotein Cholesterol and APOE Ε4 Allele. World J. Gastroenterol. 2019, 25, 5826–5837. [Google Scholar] [CrossRef]
  24. Ronto, R.; Wu, J.H.; Singh, G.M. The Global Nutrition Transition: Trends, Disease Burdens and Policy Interventions. Public Health Nutr. 2018, 21, 2267–2270. [Google Scholar] [CrossRef] [Green Version]
  25. Betancourt-Nuñez, A.; Márquez-Sandoval, F.; González-Zapata, L.I.; Babio, N.; Vizmanos, B. Unhealthy dietary patterns among healthcare professionals and students in Mexico. BMC Public Health 2018, 18, 1246. [Google Scholar] [CrossRef]
  26. Cantoral, A.; Contreras-Manzano, A.; Luna-Villa, L.; Batis, C.; Roldán-Valadez, E.A.; Ettinger, A.S.; Mercado, A.; Peterson, K.E.; Téllez-Rojo, M.M.; Rivera, J.A. Dietary Sources of Fructose and Its Association with Fatty Liver in Mexican Young Adults. Nutrients 2019, 11, 522. [Google Scholar] [CrossRef] [PubMed] [Green Version]
  27. Roman, S.; Rivera-Iñiguez, I.; Ojeda-Granados, C.; Sepulveda-Villegas, M.; Panduro, A. Genome-Based Nutrition in Chronic Liver Disease. In Dietary Interventions in Liver Disease—Foods, Nutrients, and Dietary Supplements; Academic Press: Cambridge, MA, USA, 2019; p. 428. [Google Scholar]
  28. Sepulveda-Villegas, M.; Roman, S.; Rivera-Iñiguez, I.; Ojeda-Granados, C.; Gonzalez-Aldaco, K.; Torres-Reyes, L.A.; Jose-Abrego, A.; Panduro, A. High Prevalence of Nonalcoholic Steatohepatitis and Abnormal Liver Stiffness in a Young and Obese Mexican Population. PLoS ONE 2019, 14, e0208926. [Google Scholar] [CrossRef]
  29. Bertani, J.P.B.; Alves, B.C.; Azevedo, L.A.; Álvares-da-Silva, M.R.; Dall’Alba, V. Is dietary glycemic load associated with liver fibrosis in hepatitis C? Nutr. Hosp. 2018, 35, 140–147. [Google Scholar] [CrossRef]
  30. Loguercio, C.; Federico, A.; Masarone, M.; Torella, R.; Blanco del V., C.; Persico, M. The impact of diet on liver fibrosis and on response to interferon therapy in patients with HCV-related chronic hepatitis. Am. J. Gastroenterol. 2008, 103, 3159–3166. [Google Scholar] [CrossRef] [PubMed]
  31. Moussa, I.; Day, R.S.; Li, R.; Du, X.L.; Kaseb, A.O.; Jalal, P.K.; Daniel-MacDougall, C.; Hatia, R.I.; Abdelhakeem, A.; Rashid, A.; et al. Dietary Patterns and Hepatocellular Carcinoma Risk among US Adults. Nutrients 2021, 13, 2011. [Google Scholar] [CrossRef]
  32. Friedewald, W.T.; Levy, R.I.; Fredrickson, D.S. Estimation of the Concentration of Low-Density Lipoprotein Cholesterol in Plasma, without Use of the Preparative Ultracentrifuge. Clin. Chem. 1972, 18, 499–502. [Google Scholar] [CrossRef] [PubMed]
  33. Torres-Valadez, R.; Roman, S.; Jose-Abrego, A.; Sepulveda-Villegas, M.; Ojeda-Granados, C.; Rivera-Iñiguez, I.; Panduro, A. Early Detection of Liver Damage in Mexican Patients with Chronic Liver Disease. J. Transl. Int. Med. 2017, 5, 49–57. [Google Scholar] [CrossRef] [PubMed] [Green Version]
  34. National Cholesterol Education Program (NCEP) Expert Panel on Detection, Evaluation, and Treatment of High Blood Cholesterol in Adults (Adult Treatment Panel III). Third Report of the National Cholesterol Education Program (NCEP) Expert Panel on Detection, Evaluation, and Treatment of High Blood Cholesterol in Adults (Adult Treatment Panel III) Final Report. Circulation 2002, 106, 3143–3421. [Google Scholar] [CrossRef]
  35. Norma Oficial Mexicana NOM-037-SSA2-2012. Para La Prevención, Tratamiento y Control de Las Dislipidemias. Available online: https://www.dof.gob.mx/nota_detalle.php?codigo=5259329&fecha=13/07/2012 (accessed on 24 May 2021).
  36. Zhao, J.; Li, Z.; Gao, Q.; Zhao, H.; Chen, S.; Huang, L.; Wang, W.; Wang, T. A review of statistical methods for dietary pattern analysis. Nutr. J. 2021, 20, 37. [Google Scholar] [CrossRef] [PubMed]
  37. Hernández-Cordero, S.; López-Olmedo, N.; Rodríguez-Ramírez, S.; Barquera-Cervera, S.; Rivera-Dommarco, J.; Popkin, B. Comparing a 7-day diary vs. 24 h-recall for estimating fluid consumption in overweight and obese Mexican women. BMC Public Health 2015, 15, 1031. [Google Scholar] [CrossRef] [PubMed] [Green Version]
  38. USDA. USDA National Nutrient Database for Standard Reference, Release 24; U.S. Department of Agriculture, Agricultural Research Service, USDA Nutrient Data Laboratory: Beltsville, MD, USA, 2011.
  39. Pérez Lizaur, A.B.; Palacios González, B.; Castro Becerra, A.L.; Flores Galicia, I. Sistema Mexicano de Alimentos Equivalentes, 4th ed.; Cuadernos de Nutrición (Fomento de Nutrición y Salud, A.C.): Mexico City, Mexico, 2011. [Google Scholar]
  40. Denova-Gutiérrez, E.; Ramírez-Silva, I.; Rodríguez-Ramírez, S.; Jiménez-Aguilar, A.; Shamah-Levy, T.; Rivera-Dommarco, J.A. Validity of a food frequency questionnaire to assess food intake in Mexican adolescent and adult population. Salud Publica México 2016, 58, 617–628. [Google Scholar] [CrossRef]
  41. Dziuban, C.D.; Shirkey, E.C. When is correlation matrix appropriate for factory analysis? Some decision rules. Psychol. Bull. 1973, 81, 358–361. [Google Scholar] [CrossRef]
  42. Howard, M.C. Review of Exploratory Factor Analysis Decisions and Overview of Current Practices: What We Are Doing and How Can We Improve? Int. J. Hum.-Comput. Interact. 2016, 32, 51–62. [Google Scholar] [CrossRef]
  43. O’Connor, B.P. SPSS and SAS Programs for Determining the Number of Components Using Parallel Analysis and Velicer’s MAP Test. Behav. Res. Methods Instrum. Comput. 2000, 32, 396–402. [Google Scholar] [CrossRef] [Green Version]
  44. Osborne, J.W. Best Practices in Exploratory Factor Analysis, 1st ed.; CreateSpace Independent Publishing: Scotts Valley, CA, USA, 2014; p. 150. [Google Scholar]
  45. Maasoumy, B.; Vermehren, J. Diagnostics in Hepatitis C: The End of Response-Guided Therapy? J. Hepatol. 2016, 65, S67–S81. [Google Scholar] [CrossRef] [PubMed] [Green Version]
  46. Trumbo, P.; Schlicker, S.; Yates, A.A.; Poos, M. Food and Nutrition Board of the Institute of Medicine, The National Academies Dietary Reference Intakes for Energy, Carbohydrate, Fiber, Fat, Fatty Acids, Cholesterol, Protein, and Amino Acids. J. Am. Diet. Assoc. 2002, 102, 1621–1630. [Google Scholar] [CrossRef]
  47. Pawlotsky, J.-M. Hepatitis C Virus Genetic Variability: Pathogenic and Clinical Implications. Clin. Liver Dis. 2003, 7, 45–66. [Google Scholar] [CrossRef]
  48. Fierro, N.A.; Gonzalez-Aldaco, K.; Torres-Valadez, R.; Martinez-Lopez, E.; Roman, S.; Panduro, A. Immunologic, Metabolic and Genetic Factors in Hepatitis C Virus Infection. World J. Gastroenterol. 2014, 20, 3443–3456. [Google Scholar] [CrossRef] [PubMed]
  49. Das, U.N. Beneficial Role of Bioactive Lipids in the Pathobiology, Prevention, and Management of HBV, HCV and Alcoholic Hepatitis, NAFLD, and Liver Cirrhosis: A Review. J. Adv. Res. 2019, 17, 17–29. [Google Scholar] [CrossRef]
  50. Miyoshi, H.; Moriya, K.; Tsutsumi, T.; Shinzawa, S.; Fujie, H.; Shintani, Y.; Fujinaga, H.; Goto, K.; Todoroki, T.; Suzuki, T.; et al. Pathogenesis of Lipid Metabolism Disorder in Hepatitis C: Polyunsaturated Fatty Acids Counteract Lipid Alterations Induced by the Core Protein. J. Hepatol. 2011, 54, 432–438. [Google Scholar] [CrossRef] [PubMed]
  51. Ojeda-Granados, C.; Panduro, A.; Rivera-Iñiguez, I.; Sepúlveda-Villegas, M.; Roman, S. A Regionalized Genome-Based Mexican Diet Improves Anthropometric and Metabolic Parameters in Subjects at Risk for Obesity-Related Chronic Diseases. Nutrients 2020, 12, 645. [Google Scholar] [CrossRef] [Green Version]
  52. Barquera, S.; Rivera, J.A. Obesity in Mexico: Rapid Epidemiological Transition and Food Industry Interference in Health Policies. Lancet Diabetes Endocrinol. 2020, 8, 746–747. [Google Scholar] [CrossRef]
  53. Ojeda-Granados, C.; Panduro, A.; Gonzalez-Aldaco, K.; Sepulveda-Villegas, M.; Rivera-Iñiguez, I.; Roman, S. Tailoring Nutritional Advice for Mexicans Based on Prevalence Profiles of Diet-Related Adaptive Gene Polymorphisms. J. Pers. Med. 2017, 7, 16. [Google Scholar] [CrossRef] [PubMed] [Green Version]
  54. Ocke, M.C. Evaluation of methodologies for assessing the overall diet: Dietary quality scores and dietary pattern analysis. Proc. Nutr. Soc. 2013, 72, 191–199. [Google Scholar] [CrossRef] [Green Version]
  55. Lambert, J.E.; Bain, V.G.; Ryan, E.A.; Thomson, A.B.R.; Clandinin, M.T. Elevated Lipogenesis and Diminished Cholesterol Synthesis in Patients with Hepatitis C Viral Infection Compared to Healthy Humans. Hepatology 2013, 57, 1697–1704. [Google Scholar] [CrossRef]
  56. Leu, G.-Z.; Lin, T.-Y.; Hsu, J.T.A. Anti-HCV Activities of Selective Polyunsaturated Fatty Acids. Biochem. Biophys. Res. Commun. 2004, 318, 275–280. [Google Scholar] [CrossRef]
  57. Hayashi, H.; Tanaka, Y.; Hibino, H.; Umeda, Y.; Kawamitsu, H.; Fujimoto, H.; Amakawa, T. Beneficial Effect of Salmon Roe Phosphatidylcholine in Chronic Liver Disease. Curr. Med. Res. Opin. 1999, 15, 177–184. [Google Scholar] [CrossRef]
  58. Sheridan, D.A.; Bridge, S.H.; Crossey, M.M.E.; Felmlee, D.J.; Fenwick, F.I.; Thomas, H.C.; Neely, R.D.G.; Taylor-Robinson, S.D.; Bassendine, M.F. Omega-3 Fatty Acids and/or Fluvastatin in Hepatitis C Prior Non-Responders to Combination Antiviral Therapy—A Pilot Randomised Clinical Trial. Liver Int. 2014, 34, 737–747. [Google Scholar] [CrossRef]
  59. Soliman, G.A. Dietary Fiber, Artherosclerosis, and Cardiovascular Disease. Nutrients 2019, 11, 1155. [Google Scholar] [CrossRef] [Green Version]
  60. Jenkins, D.J.; Wolever, T.M.; Rao, A.V.; Hegele, R.A.; Mitchell, S.J.; Ransom, T.P.; Boctor, D.L.; Spadafora, P.J.; Jenkins, A.L.; Mehling, C. Effect on Blood Lipids of Very High Intakes of Fiber in Diets Low in Saturated Fat and Cholesterol. N. Engl. J. Med. 1993, 329, 21–26. [Google Scholar] [CrossRef] [PubMed]
  61. Ke, P.Y.; Chen, S.S. Hepatitis C virus and cellular stress response: Implications to molecular pathogenesis of liver diseases. Viruses 2012, 4, 2251–2290. [Google Scholar] [CrossRef] [PubMed] [Green Version]
  62. García-Sepúlveda, C.A.; Laguna-Meraz, S.; Panduro, A. How far is Mexico from Viral Hepatitis Global Health Sector Strategy 2030 targets. Ann. Hepatol. 2020, 19, 123–125. [Google Scholar] [CrossRef] [PubMed]
  63. Saldarriaga, O.A.; Dye, B.; Pham, J.; Wanninger, T.G.; Millian, D.; Kueht, M.; Freiberg, B.; Utay, N.; Stevenson, H.L. Comparison of liver biopsies before and after direct-acting antiviral therapy for hepatitis C and correlation with clinical outcome. Sci. Rep. 2021, 11, 14506. [Google Scholar] [CrossRef]
  64. Rinaldi, L.; Nevola, R.; Franci, G.; Perrella, A.; Corvino, G.; Marrone, A.; Berretta, M.; Morone, M.V.; Galdiero, M.; Giordano, M.; et al. Risk of Hepatocellular Carcinoma after HCV Clearance by Direct-Acting Antivirals Treatment Predictive Factors and Role of Epigenetics. Cancers 2020, 12, 1351. [Google Scholar] [CrossRef]
  65. Setiono, F.J.; Jock, B.; Trude, A.; Wensel, C.R.; Poirier, L.; Pardilla, M.; Gittelsohn, J. Associations between Food Consumption Patterns and Chronic Diseases and Self-Reported Morbidities in 6 American Indian Communities. Curr. Dev. Nutr. 2019, 3, 69–80. [Google Scholar] [CrossRef]
  66. Castelló, A.; Pollán, M.; Buijsse, B.; Ruiz, A.; Casas, A.M.; Baena-Cañada, J.M.; Lope, V.; Antolín, S.; Ramos, M.; Muñoz, M.; et al. Spanish Mediterranean diet and other dietary patterns and breast cancer risk: Base-control EpiGEICAM study. Br. J. Cancer 2014, 111, 1454–1462. [Google Scholar] [CrossRef] [Green Version]
  67. Casas, R.; Estruch, R. Dietary Patterns, Foods, Nutrients and Chronic Inflammatory Disorders. Immunome Res. 2016, 12, 122. [Google Scholar] [CrossRef] [Green Version]
  68. Zhang, J.; Wang, H.; Wang, Z.; Huang, F.; Zhang, X.; Du, W.; Su, C.; Ouyang, Y.; Li, L.; Bai, J.; et al. Trajectories of Dietary Patterns and Their Associations with Overweight/Obesity among Chinese Adults: China Health and Nutrition Survey 1991–2018. Nutrients 2021, 13, 2835. [Google Scholar] [CrossRef] [PubMed]
  69. Ojeda-Granados, C.; Roman, S. Mediterranean Diet or Genome-Based Nutrition Diets in Latin America’s Clinical Practice Guidelines for Managing Chronic Liver Diseases? Ann. Hepatol. 2021, 20, 100291. [Google Scholar] [CrossRef]
Figure 1. Dietary patterns in anti-HCV-positive patients identified by exploratory factor analysis. The red dotted line indicates the cutoff value of the factor loadings in which a food group was considered highly representative of the dietary pattern.
Nutrients 13 03337 g001
Table 1. Demographics, anthropometrics, lipid profile, and APOE characteristics of anti-HCV-positive patients.
Anti-HCV-Positive Patients
VariableTotal Study Group
(n = 188)
Chronic Hepatitis C
(n = 137)
Spontaneous Clearance
(n = 51)
p-Value
Demographics/Anthropometrics
Age (years)49.51 ± 12.050.9 ± 11.745.7 ± 12.10.007
Female/Male n (%)106/82 (56.4/43.6)78/59 (56.9/43.1)28/23 (54.9/45.1)0.803
Weight (kg)71.4 ± 14.270.4 ± 14.774.1 ± 12.50.120
Height (cm)161.5 ± 10.1161.3 ± 10.3162.0 ± 9.60.689
Body fat mass (kg)22.3 ± 9.721.9 ± 10.223.2 ± 8.40.417
Percent body fat (%)30.8 ± 9.912.1 ± 2.712.7 ± 2.60.543
BMI (kg/m2)27.4 ± 5.230.5 ± 10.231.5 ± 9.10.187
Lipid Profile and Liver Enzymes
Total cholesterol (mg/dL)
Median (Q1, Q3)
155.0 ± 49.1
153 (124.0, 183.3)
142.6 ± 45.1
140.0 (116.0, 166.5)
191.0 ± 42.
192.0 (157.0, 214.0)
<0.001 a
Triglycerides (mg/dL)
Median (Q1, Q3)
139.6 ± 68.5
123.5 (90.0, 181.0)
128.8 ± 61.1
113.0 (84.0, 166.5)
171.2 ± 79.1
153.0 (108.0, 210.0)
<0.001 a
LDL-c (mg/dL)
Median (Q1, Q3)
93.2 ± 37.8
89.5 (67.0, 111.6)
84.8 ± 34.7
82.0 (61.5, 100.0)
118.7 ± 36.1
112.0 (91.0, 136.5)
<0.001 a
VLDL-c (mg/dL)
Median (Q1, Q3)
27.7 ± 13.9
24.3 (18.0, 36.0)
25.9 ± 12.2
22.6 (17.0, 33.8)
33.0 ± 17.0
29.8 (21.0, 42.0)
0.002 a
HDL-c (mg/dL)39.9 ± 15.838.9 ± 13.442.7 ± 21.10.309
Hypercholesterolemia, n (%)30 (16.3)11 (8.0)19 (40.4)<0.001
Hypertriglyceridemia, n (%)68 (37.0)44 (32.1)24 (51.1)0.020
High LDL-c, n (%)22 (14.7)10 (8.8)12 (32.4)<0.001
Hypoalphalipoproteinemia, n (%)108 (71.1)81 (71.7)27 (69.2)0.771
AST (IU/L)
Median (Q1,Q3)
65.7 ± 65.1
49.0 (29.0, 78.0)
78.0 ± 62.1
61.0 (40.0, 100.0)
33.7 ± 27.5
27.0 (23.9, 34.8)
<0.001 a
ALT (IU/L)
Median (Q1,Q3)
66.4 ± 58.5
45.0 (27.3, 78.0)
75.7 ± 70.9
57.5 (35.0, 91.8)
37.5 ± 31.4
27.0 (20.0, 43.5)
<0.001 a
GGT (IU/L)
Median (Q1,Q3)
69.9 ± 98.3
39.0 (24.0, 74.0)
77.5 ± 102.2
50.0 (27.0, 92.0)
48.7 ± 84.0
24.5 (20.0, 41.0)
<0.001 a
APOE Allele Frequency b
ε214 (4.1)12 (4.7)2 (2.3)0.323
ε3297 (86.3)224 (87.5)73 (83.0)0.284
ε433 (9.6)20 (7.8)13 (14.7)0.056
Data are presented as mean ± SD unless indicated. Median, first quartile (Q1), and third quartile (Q3) are also presented. HCV, hepatitis C virus; BMI, body mass index; CHC, chronic hepatitis C; SC, spontaneous clearance; LDL-c, low-density lipoprotein-cholesterol; VLDL-c, very-low-density lipoprotein-cholesterol; HDL-c, high-density lipoprotein-cholesterol; ALT, alanine aminotransferase; AST, aspartate aminotransferase; and GGT, gamma-glutamyl transferase. The chi-square test was used to compare categorical variables, while the t-test and a Mann–Whitney U test were used for variables with normal and non-normal distributed data, respectively; b Frequency was obtained from 172 patients.
Table 2. Nutritional profile of chronic hepatitis C and spontaneous clearance patients according to APOE genotype group.
VariablesChronic Hepatitis CSpontaneous ClearanceRDA
Values
E2
(n = 10)
E3
(n = 100)
E4
(n = 18)
E2
(n = 2)
E3
(n = 30)
E4
(n = 12)
Anthropometrics
Weight (kg)69.1 ± 5.570.5 ± 14.972.7 ± 18.375.9 ± 26.770.5 ± 9.680.0 ± 16.9
Body fat (%)26.6 ± 10.931.4 ± 10.129.9 ± 10.630.1 ± 0.830.2 ± 9.031.8 ± 6.8
BMI (kg/m2)26.1 ± 3.927.3 ± 5.227.8 ± 5.528.0 ± 4.627.0 ± 3.729.4 ± 4.9
Macronutrients
Total energy (kcal)2061 ± 4462082 ± 6961900 ± 5102903 ± 42070 ± 4702135 ± 414
Proteins (%)15.7 ± 5.917.1 ± 4.016.1 ± 4.214.0 ± 1.416.0 ± 4.619.0 ± 4.915–20
Total fat (%)24.5 ± 10.029.1 ± 8.226.3 ± 7.924.0 ± 7.129.2 ± 9.329.9 ± 3.925–30
SFA (%)5.9 ± 4.47.8 ± 3.36.8 ± 2.76.5 ± 3.58.2 ± 3.67.1 ± 3.2<7
MUFA (%)8.1 ± 5.19.9 ± 4.08.9 ± 4.08.0 ± 1.49.6 ± 4.611.2 ± 6.910–15
PUFA (%)3.8 ± 1.54.8 ± 2.24.5 ± 1.74.0 ± 0.04.6 ± 2.15.6 ± 3.27–10
Cholesterol (mg/dL)217.8 ± 166.3311.4 ± 251.6239.5 ± 155.0125.0 ± 0.0300.1 ± 248.9334.5 ± 207.3<200
Carbohydrates (%)61.4 ± 12.955.9 ± 10.059.8 ± 9.964.0 ± 7.157.1 ± 12.452.6 ± 3.850–55
Fiber (g/day)18.9 ± 8.325.3 ± 12.719.3 ± 8.328.3 ± 0.024.2 ± 12.725.2 ± 1.525–38
Sugar (g/day)29.0 ± 20.336.2 ± 26.448.8 ± 39.040.1 ± 0.048.6 ± 48.632.8 ± 24.9<30
Micronutrients a
Vitamin A (μg/day)1407.9 ± 2288.71045.1 ± 1138.91493.6 ± 1689.7831 ± 0.0950.1 ± 777.81184.1 ± 535.2900
Vitamin E (mg/day)1.7 ± 1.02.6 ± 2.02.0 ± 1.63.8 ± 0.02.4 ± 2.22.7 ± 1.915
Folates
(μg/day of DFE)
98.3 ± 101.4189.2 ± 148.1157.5 ± 80.290.0 ± 0.0173.6 ± 147.9366.1 ± 360.6300–600
Thiamin (mg/day)1.2 ± 0.51.3 ± 0.71.2 ± 0.62.0 ± 0.01.3 ± 0.61.7 ± 1.31.1–1.2
Pyridoxine (mg/day)1.0 ± 0.31.3 ± 0.81.5 ± 0.90.6 ± 0.01.2 ± 0.91.8 ± 1.41.7
Cobalamin (μg/day)3.1 ± 3.33.5 ± 2.52.7 ± 2.14.4 ± 0.02.5 ± 1.94.8 ± 3.32.4
Iron (mg/day)14.3 ± 6.316.2 ± 7.213.4 ± 4.427.3 ± 0.014.2 ± 5.620.5 ± 12.68–18
Selenium (μg/day) 30.4 ± 27.542.6 ± 37.826.6 ± 19.747.0 ± 0.042.7 ± 36.459.1 ± 73.555
BMI, body mass index; SFA, saturated fatty acids; MUFA, monounsaturated fatty acids; PUFA, polyunsaturated fatty acids; DFE, dietary folate equivalents; and RDA, Recommended Dietary Allowance. A total of 172 study patients had APOE genotyping data. a Only vitamins and minerals with a potential effect on liver function are listed. Differences between variables according to the APOE genotype group in CHC and SC patients were evaluated with the Kruskal–Wallis test. No significant differences were found.
Table 3. Nutritional and biochemical characteristics of CHC patients according to viral load.
Chronic Hepatitis C Patients
VariablesReference
Values
Low Viral Load
(n = 36)
High Viral Load
(n = 101)
p-Value
Anthropometrics
Body fat (%)30.7 ± 10.330.4 ± 10.30.882
BMI (kg/m2)27.7 ± 5.326.9 ± 5.50.458
Macro- and MicronutrientsRef [46]
Total energy (kcal)
Median (Q1, Q3)
1926 ± 483
1852 (1562, 2322)
2126 ± 713
1970 (1685, 2555)
0.233 a
Proteins (%)15–2017.7 ± 4.516.5 ± 4.00.138
Total fat (%)25–3030.9 ± 8.227.5 ± 8.00.030
SFA (%)<78.0 ± 3.37.5 ± 3.30.449
MUFA (%)10–1510.4 ± 4.19.4 ± 4.00.216
PUFA (%)7–105.4 ± 2.74.4 ± 1.90.030
Cholesterol (mg/dL)
Median (Q1, Q3)
<200316.0 ± 231.8
229.5 (147.5, 431.0)
278.5 ± 236.5
199 (107.0, 415.8)
0.239 a
Carbohydrates (%)50–5554.1 ± 9.657.9 ± 10.20.052
Fiber (g/day)25–3819.8 ± 9.526.3 ± 13.80.016
Sugar (g/day)<3033.3 ± 28.939.0 ± 26.60.314
Vitamin A (μg/day)9001050.0 ± 1268.11099.4 ± 1314.00.844
Vitamin E (mg/day)152.3 ± 1.92.4 ± 1.90.742
Laboratory DataRef [33]
Glucose (mg/dL)
Median (Q1, Q3)
≤100103.5 ± 34.8
96.5 (84.3, 109.8)
114.4 ± 58.7
97.0 (87.0, 116.5)
0.334 a
ALT (IU/L)
Median (Q1, Q3)
≤4253.3 ± 34.7
42.5 (29.5, 70.3)
83.8 ± 78.6
61.5 (37.0, 103.8)
0.011 a
AST (IU/L)
Median (Q1, Q3)
≤5462.7 ± 40.1
52.5 (35.5, 77.5)
83.6 ± 67.7
65.0 (41.0, 107.0)
0.083 a
GGT (IU/L)
Median (Q1, Q3)
≤3044.0 ± 27.4
33.5 (26.3, 64.5)
88.8 ± 115.1
54.0 (28.0, 110.0)
0.013 a
Platelets (×103/μL)150–450161.7 ± 116.4150.0 ± 71.00.590
Albumin (g/dL)3.4–5.43.4 ± 0.63.6 ± 0.60.047
T. bilirubin (mg/dL)
Median (Q1, Q3)
0.1–1.21.2 ± 0.9
1.0 (0.6, 1.5)
1.3 ± 1.6
0.9 (0.6, 1.4)
0.935 a
Data are presented as mean ± SD unless otherwise indicated. Median, first quartile (Q1), and third quartile (Q3) are also presented. CHC, chronic hepatitis C; BMI, body mass index; SFA, saturated fatty acids; MUFA, monounsaturated fatty acids; PUFA, polyunsaturated fatty acids; ALT, alanine aminotransferase; AST, aspartate aminotransferase; GGT, gamma-glutamyl transferase; and T. bilirubin, total bilirubin. Statistical analyses were performed using the t-test or a Mann–Whitney U test.
Table 4. Logistic regression analysis of dietary variables associated with high viral load in CHC patients.
Dietary VariableUnivariateMultivariate
OR95 % CIp-ValueOR95 % CIp-Value
Total fat (%)0.9490.904–0.9960.032
PUFA (%)0.8050.668–0.9690.0220.8040.656–0.9860.036
Carbohydrates (%)1.0400.999–1.0820.055
Fiber (g/day)1.0501.008–1.0930.0191.0491.007–1.0920.021
OR, odds ratio; CI, confidence interval; PUFA, polyunsaturated fatty acids. Variables with p < 0.2 in the univariate analysis were included for multivariate analysis. Hosmer–Lemeshow test: chi-square = 3.9, p = 0.866; Nagelkerke R square = 0.135.
Table 5. Receiver-operating characteristic analyses of dietary variables associated with low or high viral load.
HCV Viral LoadVariableCut-OffAUCp-ValueSensitivity, %Specificity, %
LowPUFA (%)≥4.90.6240.03261.856.6
HighFiber (g/day)≥21.50.6330.02661.469.7
HCV, hepatitis C virus; PUFA, polyunsaturated fatty acids; AUC, area under the curve.
Table 6. Frequency of CHC patients with HCV-related variables relative to adherence to dietary patterns.
Dietary Patterns HCV-Related Variables
Adherence
Tertile
PUFA
≥4.9%
Fiber
≥21.5 g/day
Low
Viral Load
High
Viral Load
Meat and soft drinks, DP1T119 (54.4)20 (57.1)13 (36.1)23 (63.9)
T215 (42.9)12 (46.7)5 (13.9)31 (86.1)
T314 (40.0)16 (50.0)10 (27.8)26 (72.2)
Processed animal and fried foods, DP2T116 (38.1)19 (45.2)8 (19.0)34 (81.0)
T215 (45.5)16 (57.1)11 (32.4)23 (67.6)
T317 (56.7)15 (55.6)9 (28.1)23 (71.9)
Mexican-healthy
DP3
T117 (50.0)20 (62.5)10 (28.6)25 (71.4)
T215 (41.7)14 (42.4)11 (29.7)26 (70.3)
T316 (45.7)16 (50.0)7 (19.4)29 (80.6)
Fish-rich
DP4
T111 (29.7)24 (68.6)6 (16.2)31 (83.8)
T216 (42.1)13 (39.4)10 (25.0)30 (75.0)
T321 (70.0) a13 (44.8) b12 (38.7) c19 (61.3)
Values are expressed as numbers and percentages; HCV, hepatitis C virus; and PUFA, polyunsaturated fatty acids. Comparisons were performed with chi-square test. a Fish-rich T3 vs. T1, p = 0.004; b fish-rich T3 vs. T1, p = 0.038; c fish-rich T3 vs. T1, p = 0.036.
Publisher’s Note: MDPI stays neutral with regard to jurisdictional claims in published maps and institutional affiliations.

