
Hepatocyte-Specific Phgdh-Deficient Mice Culminate in Mild Obesity, Insulin Resistance, and Enhanced Vulnerability to Protein Starvation

 ,
,
Abstract
:1. Introduction
2. Materials and Methods
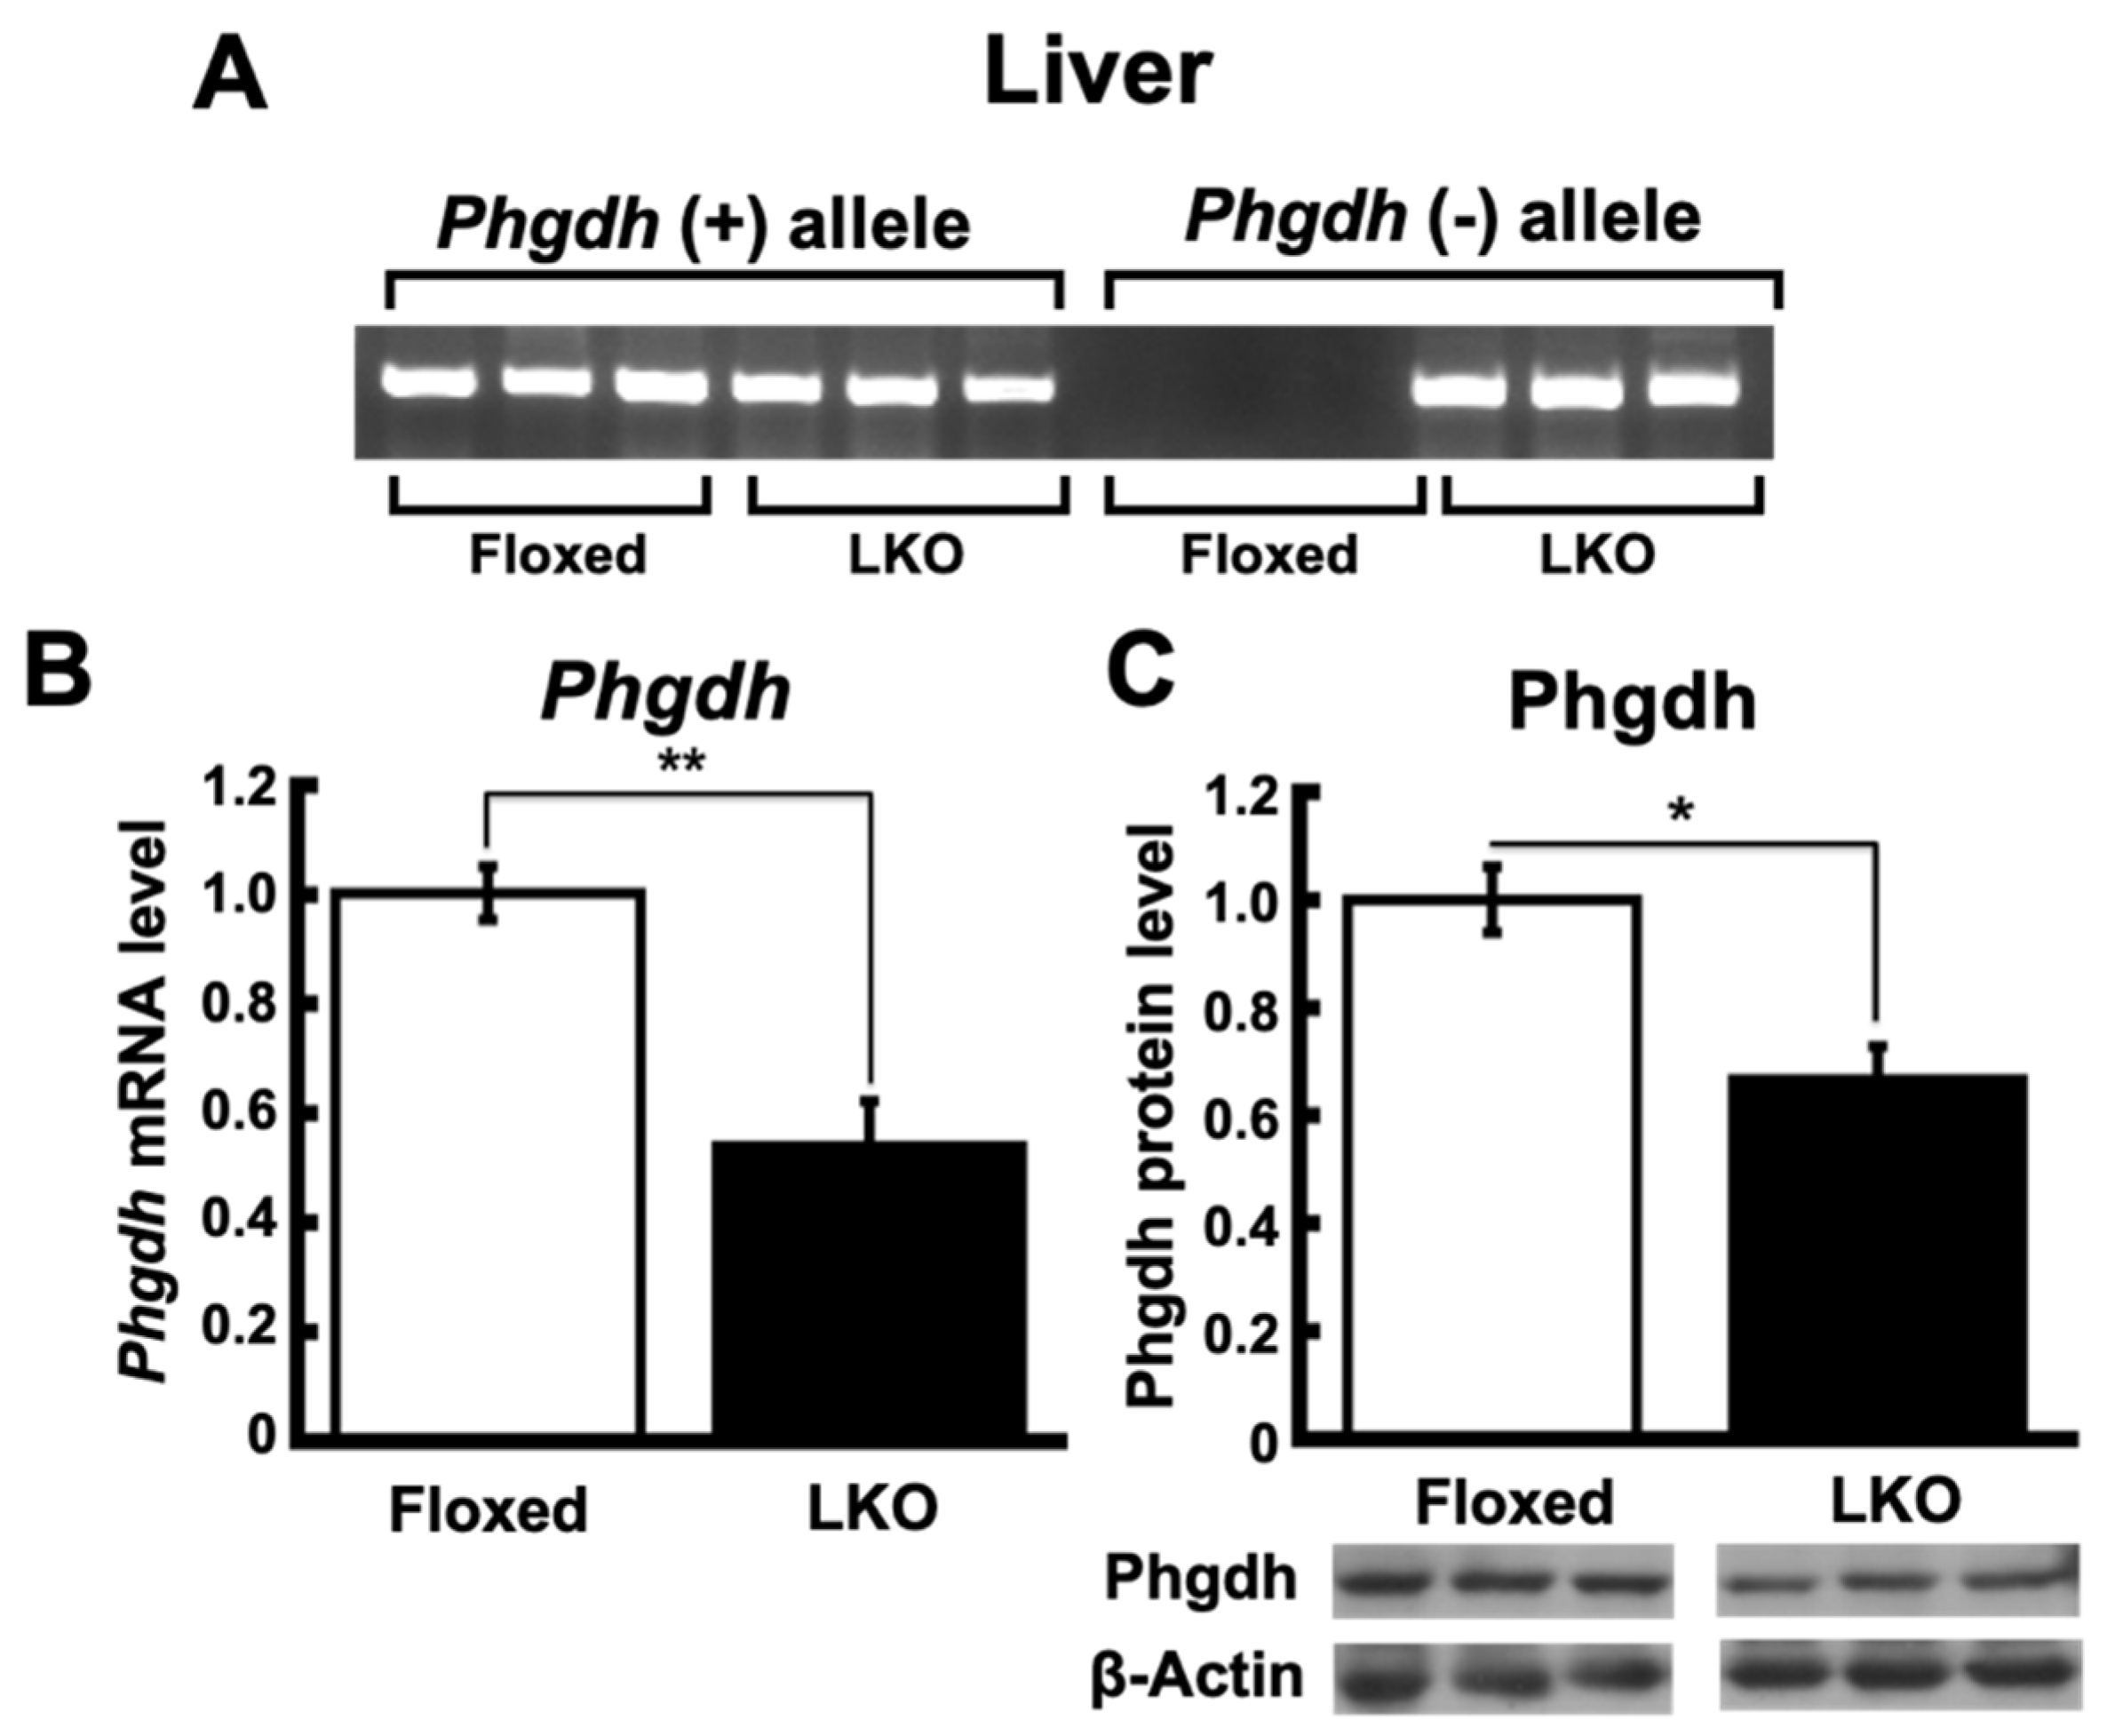
2.1. Hepatocyte-Specific Phgdh Knockout Mice
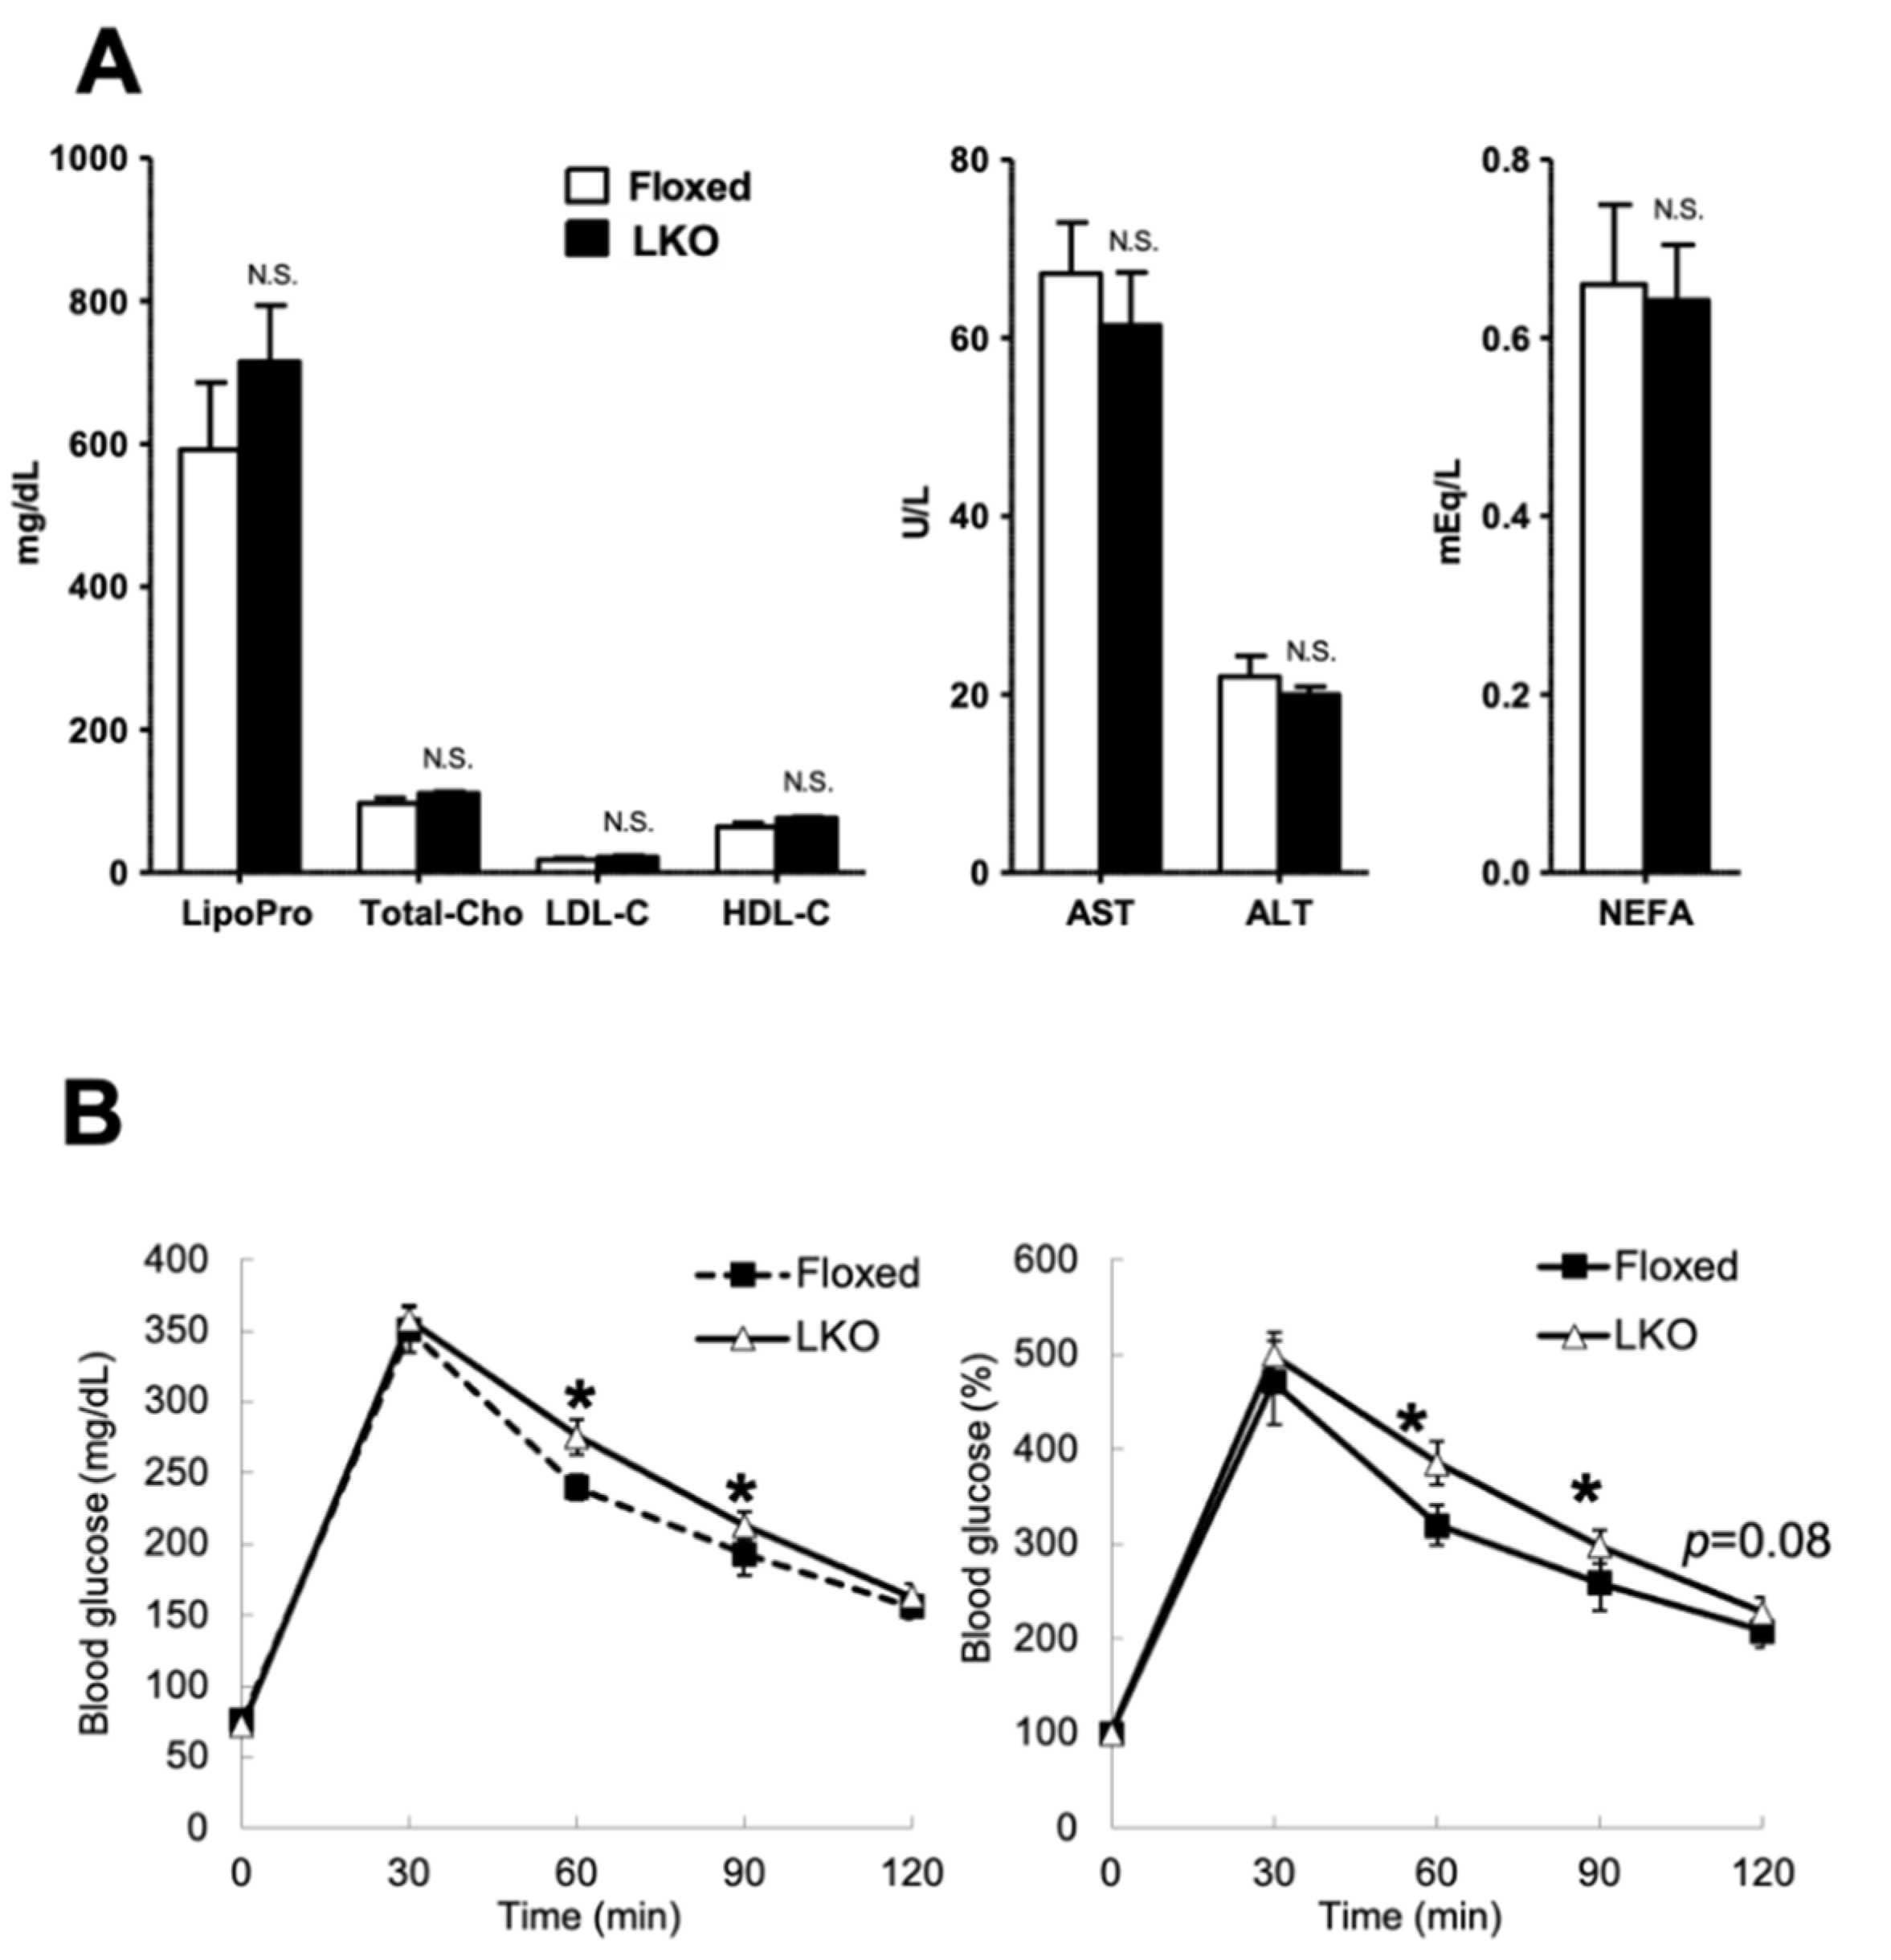
2.2. Glucose Tolerance Test
2.3. Feeding of Protein-Free Diet
2.4. RNA Isolation and Microarray Analysis
2.5. KEGG Pathway Enrichment Analysis for Differentially Expressed Genes
2.6. Gene Ontology Enrichment Analysis for Differentially Expressed Genes
2.7. Ingenuity Pathways Analysis
2.8. Quantitative Analysis of mRNA Expression
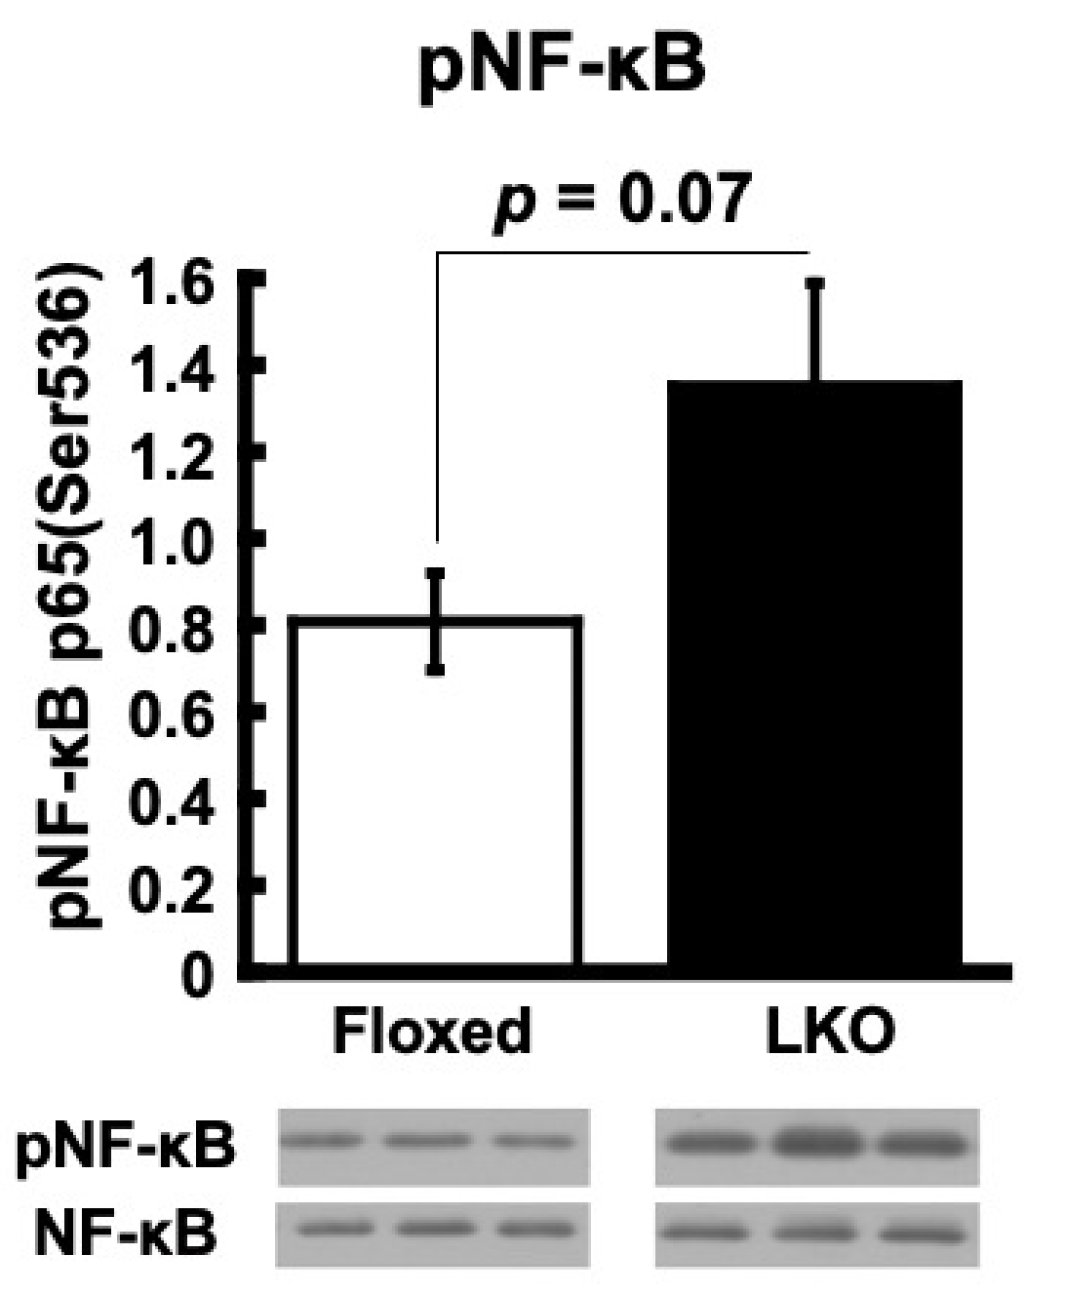
2.9. Western Blot Analysis
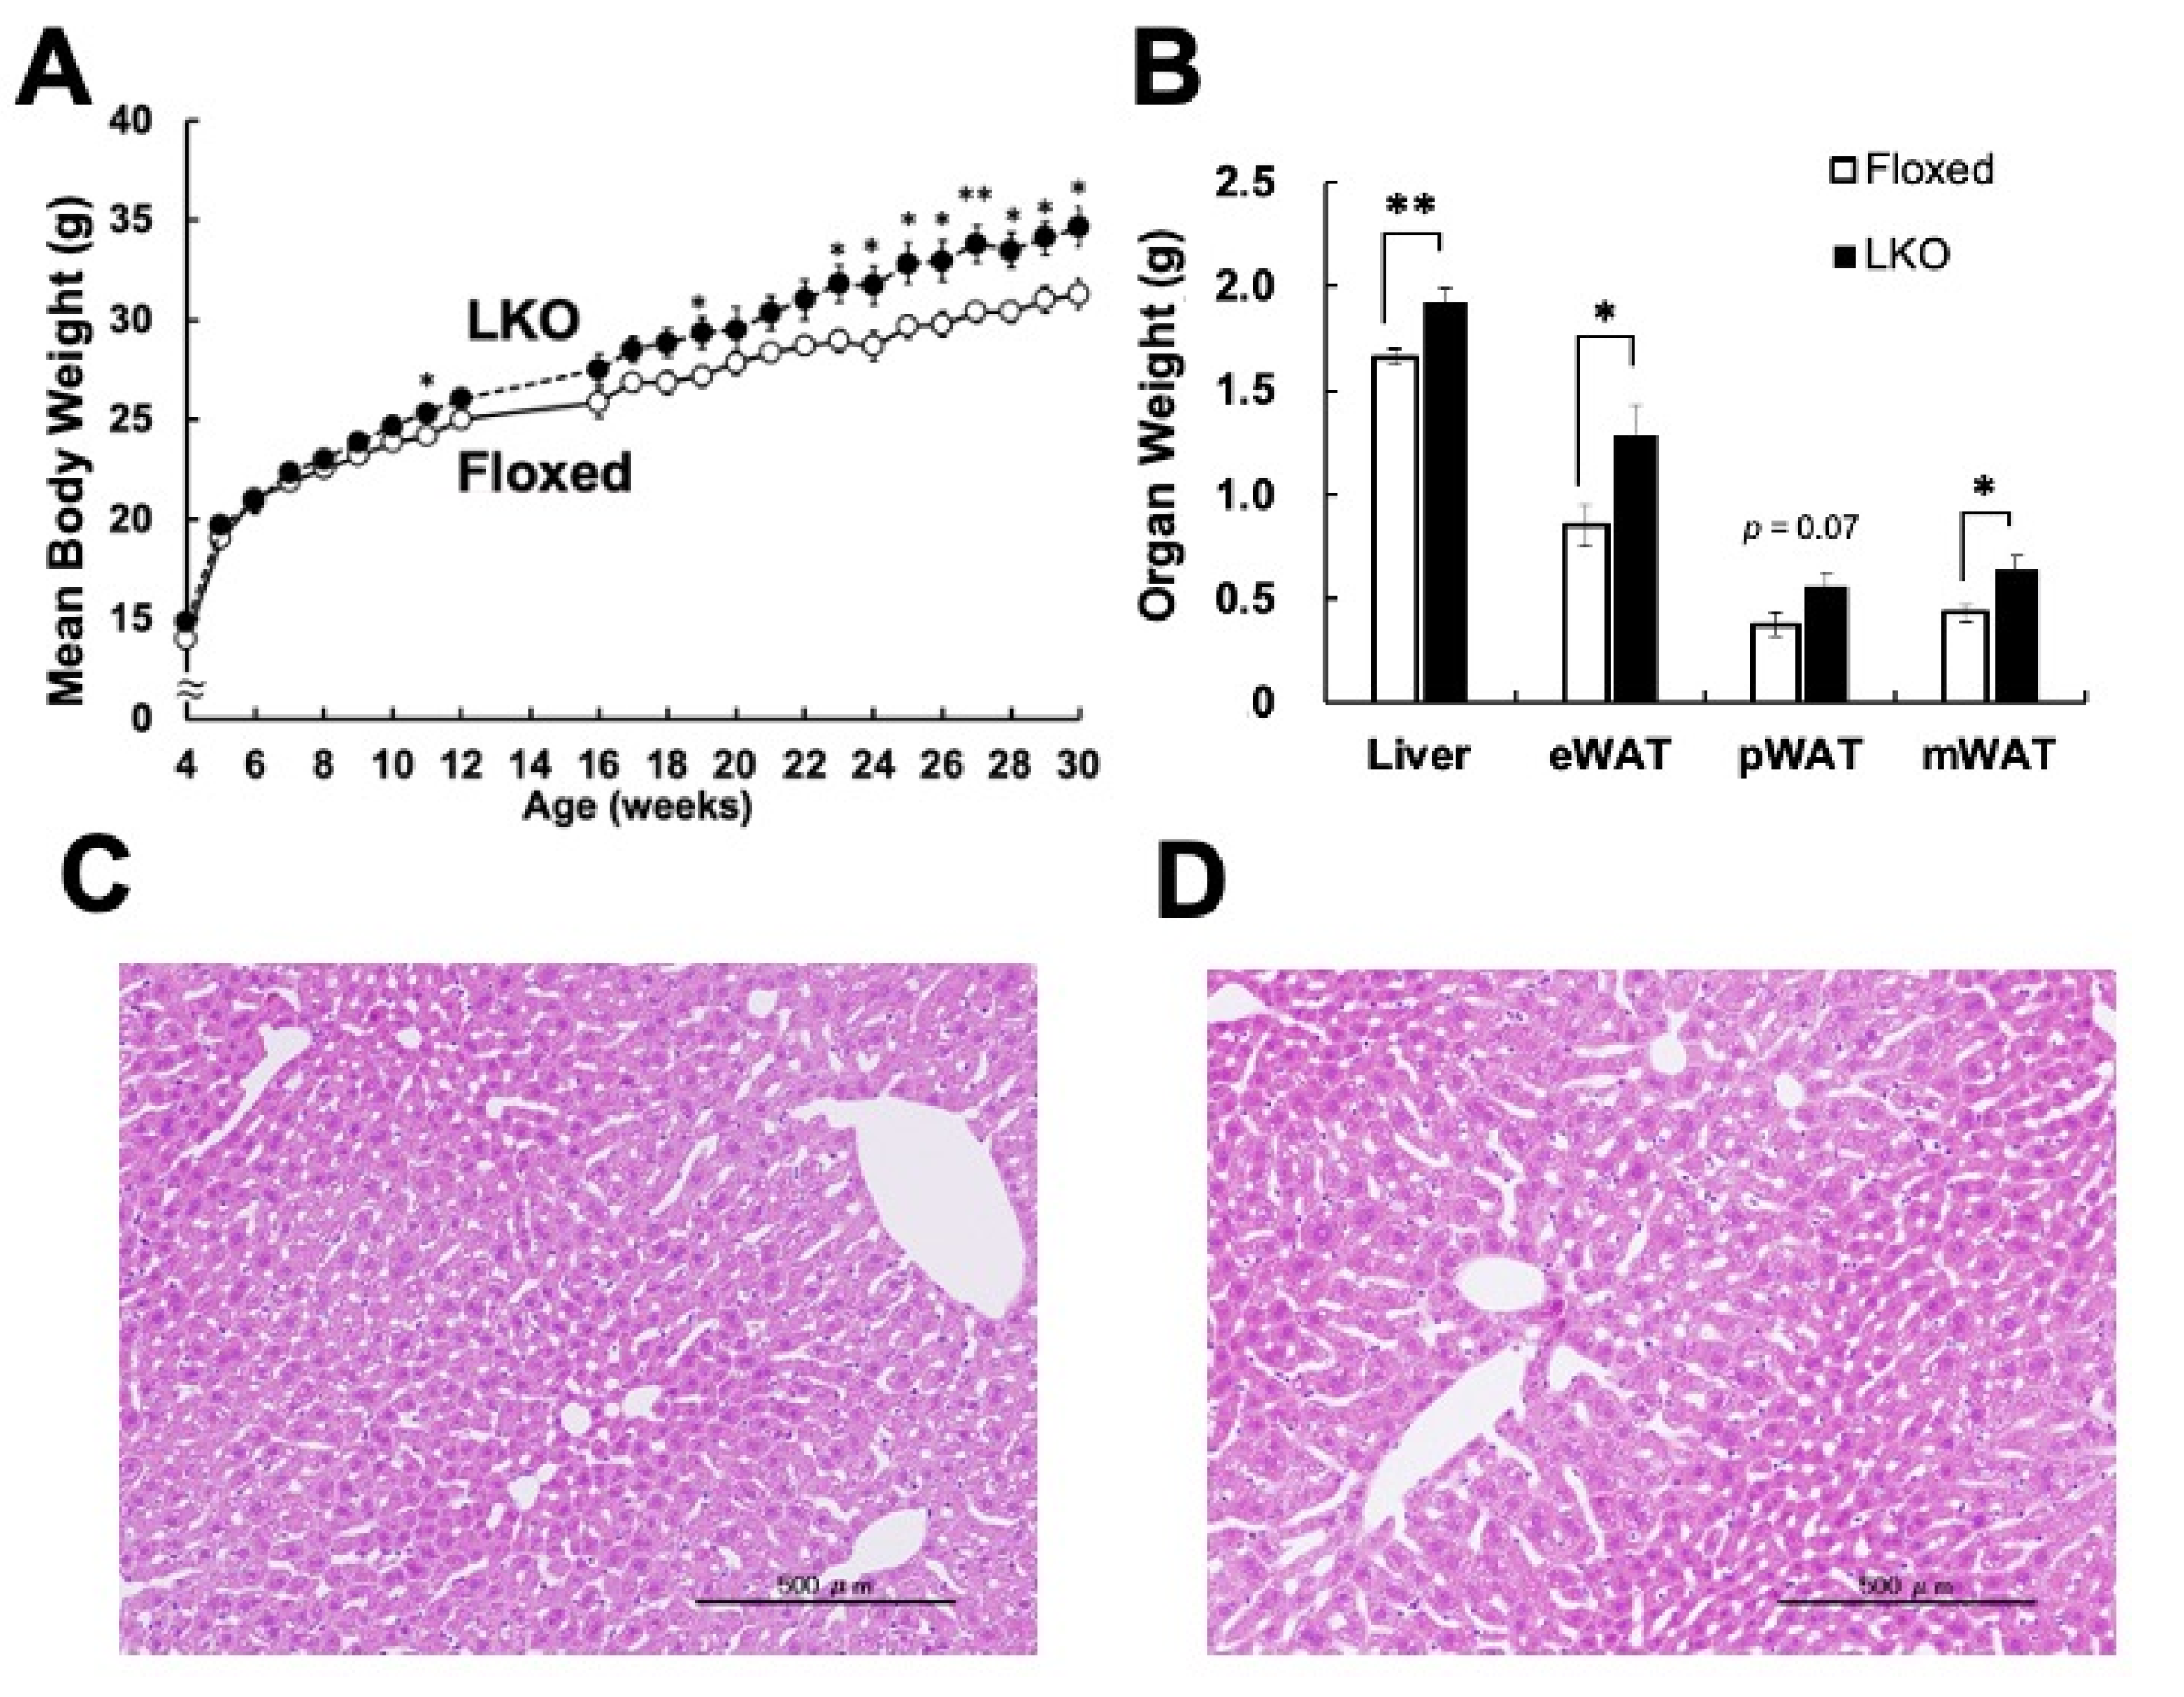
2.10. Histological Evaluation
2.11. Serum Biochemical Test
2.12. Amino Acid Analysis
2.13. Statistical Analysis
3. Results
4. Discussion
Supplementary Materials
Author Contributions
Funding
Institutional Review Board Statement
Informed Consent Statement
Data Availability Statement
Conflicts of Interest
References
- Yoshida, K.; Furuya, S.; Osuka, S.; Mitoma, J.; Shinoda, Y.; Watanabe, M.; Azuma, N.; Tanaka, H.; Hashikawa, T.; Itohara, S.; et al. Targeted Disruption of the Mouse 3-Phosphoglycerate Dehydrogenase Gene Causes Severe Neurodevelopmental Defects and Results in Embryonic Lethality. J. Biol. Chem. 2004, 279, 3573–3577. [Google Scholar] [CrossRef] [Green Version]
- Shaheen, R.; Rahbeeni, Z.; Alhashem, A.; Faqeih, E.; Zhao, Q.; Xiong, Y.; Almoisheer, A.; Al-Qattan, S.M.; Almadani, H.A.; Al-Onazi, N.; et al. Neu-laxova syndrome, an inborn error of serine metabolism, is caused by mutations in PHGDH. Am. J. Hum. Genet. 2014, 94, 898–904. [Google Scholar] [CrossRef] [Green Version]
- Sayano, T.; Kawano, Y.; Kusada, W.; Arimoto, Y.; Esaki, K.; Hamano, M.; Udono, M.; Katakura, Y.; Ogawa, T.; Kato, H.; et al. Adaptive response to l-serine deficiency is mediated by p38 MAPK activation via 1-deoxysphinganine in normal fibroblasts. FEBS Open Bio 2016, 6, 303–316. [Google Scholar] [CrossRef]
- Esaki, K.; Sayano, T.; Sonoda, C.; Akagi, T.; Suzuki, T.; Ogawa, T.; Okamoto, M.; Yoshikawa, T.; Hirabayashi, Y.; Furuya, S. L-serine deficiency elicits intracellular accumulation of cytotoxic deoxysphingolipids and lipid body formation. J. Biol. Chem. 2015, 290, 14595–14609. [Google Scholar] [CrossRef] [Green Version]
- Hamano, M.; Haraguchi, Y.; Sayano, T.; Zyao, C.; Arimoto, Y.; Kawano, Y.; Moriyasu, K.; Udono, M.; Katakura, Y.; Ogawa, T.; et al. Enhanced vulnerability to oxidative stress and induction of inflammatory gene expression in 3-phosphoglycerate dehydrogenase-deficient fibroblasts. FEBS Open Bio 2018, 8, 914–922. [Google Scholar] [CrossRef]
- Hamano, M.; Tomonaga, S.; Osaki, Y.; Oda, H.; Kato, H.; Furuya, S. Transcriptional activation of chac1 and other atf4-target genes induced by extracellular l-serine depletion is negated with glycine consumption in hepa1-6 hepatocarcinoma cells. Nutrients 2020, 12, 3018. [Google Scholar] [CrossRef]
- Yang, J.H.; Wada, A.; Yoshida, K.; Miyoshi, Y.; Sayano, T.; Esaki, K.; Kinoshita, M.O.; Tomonaga, S.; Azuma, N.; Watanabe, M.; et al. Brain-specific Phgdh deletion reveals a pivotal role for l-serine biosynthesis in controlling the level of D-serine, an N-methyl-D-aspartate receptor co-agonist, in adult brain. J. Biol. Chem. 2010, 285, 41380–41390. [Google Scholar] [CrossRef] [Green Version]
- Klomp, L.W.J.; De Koning, T.J.; Malingre, H.E.M.; Van Beurden, E.A.C.M.; Brink, M.; Opdam, F.L.; Duran, M.; Jaeken, J.; Pineda, M.; Van Maldergem, L.; et al. Molecular Characterization of 3-Phosphoglycerate Dehydrogenase Deficiency—A Neurometabolic Disorder Associated with Reduced L-Serine Biosynthesis. Am. J. Hum. Genet. 2000, 67, 1389–1399. [Google Scholar] [CrossRef] [Green Version]
- Kang, Y.P.; Falzone, A.; Liu, M.; Saller, J.J.; Karreth, F.A.; DeNicola, G.M. PHGDH supports liver ceramide synthesis and sustains lipid homeostasis. BioRxiv 2019, 15, 1–13. [Google Scholar] [CrossRef]
- Mardinoglu, A.; Agren, R.; Kampf, C.; Asplund, A.; Uhlen, M.; Nielsen, J. Genome-scale metabolic modelling of hepatocytes reveals serine deficiency in patients with non-alcoholic fatty liver disease. Nat. Commun. 2014, 5, 1–11. [Google Scholar] [CrossRef] [Green Version]
- Mardinoglu, A.; Bjornson, E.; Zhang, C.; Klevstig, M.; Söderlund, S.; Ståhlman, M.; Adiels, M.; Hakkarainen, A.; Lundbom, N.; Kilicarslan, M.; et al. Personal model-assisted identification of NAD + and glutathione metabolism as intervention target in NAFLD. Mol. Syst. Biol. 2017, 13, 916. [Google Scholar] [CrossRef]
- Sim, W.C.; Lee, W.; Sim, H.; Lee, K.Y.; Jung, S.H.; Choi, Y.J.; Kim, H.Y.; Kang, K.W.; Lee, J.Y.; Choi, Y.J.; et al. Downregulation of PHGDH expression and hepatic serine level contribute to the development of fatty liver disease. Metabolism 2020, 102, 154000. [Google Scholar] [CrossRef] [PubMed] [Green Version]
- Bolstad, B.M. PreprocessCore: A Collection of Pre-Processing Functions. R Package Version 1.0. 2013. Available online: https://scholar.google.co.uk/citations?view_op=view_citation&hl=en&user=Ntck_10AAAAJ&citation_for_view=Ntck_10AAAAJ:4JMBOYKVnBMC (accessed on 26 September 2021).
- Smyth, G.K. Limma: Linear models for microarray data. In Bioinformatics and Computational Biology Solution Using R and Bioconductor; Springer: New York, NY, USA, 2006; pp. 397–420. [Google Scholar]
- Dennis, G.; Sherman, B.T.; Hosack, D.A.; Yang, J.; Gao, W.; Lane, H.C.; Lempicki, R.A. DAVID: Database for Annotation, Visualization, and Integrated Discovery. Genome Biol. 2003, 4, 1–11. [Google Scholar] [CrossRef] [Green Version]
- Krämer, A.; Green, J.; Pollard, J.; Tugendreich, S. Causal analysis approaches in ingenuity pathway analysis. Bioinformatics 2014, 30, 523–530. [Google Scholar] [CrossRef] [PubMed]
- Zeyda, M.; Stulnig, T.M. Obesity, inflammation, and insulin resistance—A mini-review. Gerontology 2009, 55, 379–386. [Google Scholar] [CrossRef] [PubMed]
- Jope, R.S.; Johnson, G.V.W. The glamour and gloom of glycogen synthase kinase-3. Trends Biochem. Sci. 2004, 29, 95–102. [Google Scholar] [CrossRef] [PubMed]
- Martin, M.; Rehani, K.; Jope, R.S.; Michalek, S.M. Toll-like receptor-Mediated cytokine production is differentially regulated by glycogen synthase kinase 3. Nat. Immunol. 2005, 6, 777–784. [Google Scholar] [CrossRef]
- Gual, P.; Le Marchand-Brustel, Y.; Tanti, J.F. Positive and negative regulation of insulin signaling through IRS-1 phosphorylation. Biochimie 2005, 87, 99–109. [Google Scholar] [CrossRef] [PubMed]
- De Fea, K.; Roth, R.A. Protein kinase C modulation of insulin receptor substrate-1 tyrosine phosphorylation requires serine 612. Biochemistry 1997, 36, 12939–12947. [Google Scholar] [CrossRef]
- Ozes, O.N.; Akca, H.; Mayo, L.D.; Gustin, J.A.; Maehama, T.; Dixon, J.E.; Donner, D.B. A phosphatidylinositol 3-kinase/Akt/mTOR pathway mediates and PTEN antagonizes tumor necrosis factor inhibition of insulin signaling through insulin receptor substrate-1. Proc. Natl. Acad. Sci. USA 2001, 98, 4640–4645. [Google Scholar] [CrossRef] [Green Version]
- Boura-Halfon, S.; Zick, Y. Phosphorylation of IRS proteins, insulin action, and insulin resistance. Am. J. Physiol.-Endocrinol. Metab. 2009, 296, 581–591. [Google Scholar] [CrossRef] [PubMed] [Green Version]
- Copps, K.D.; White, M.F. Regulation of insulin sensitivity by serine/threonine phosphorylation of insulin receptor substrate proteins IRS1 and IRS2. Diabetologia 2012, 55, 2565–2582. [Google Scholar] [CrossRef] [PubMed] [Green Version]
- Shen, N.; Yu, X.; Pan, F.Y.; Gao, X.; Xue, B.; Li, C.J. An early response transcription factor, Egr-1, enhances insulin resistance in type 2 diabetes with chronic hyperinsulinism. J. Biol. Chem. 2011, 286, 14508–14515. [Google Scholar] [CrossRef] [Green Version]
- Backman, M.; Flenkenthaler, F.; Blutke, A.; Dahlhoff, M.; Ländström, E.; Renner, S.; Philippou-Massier, J.; Krebs, S.; Rathkolb, B.; Prehn, C.; et al. Multi-omics insights into functional alterations of the liver in insulin-deficient diabetes mellitus. Mol. Metab. 2019, 26, 30–44. [Google Scholar] [CrossRef] [PubMed]
- Kim, Y.I.; Lee, F.N.; Choi, W.S.; Lee, S.; Youn, J.H. Insulin regulation of skeletal muscle PDK4 mRNA expression is impaired in acute insulin-resistant states. Diabetes 2006, 55, 2311–2317. [Google Scholar] [CrossRef] [Green Version]
- Trefely, S.; Khoo, P.S.; Krycer, J.R.; Chaudhuri, R.; Fazakerley, D.J.; Parker, B.L.; Sultani, G.; Lee, J.; Stephan, J.P.; Torres, E.; et al. Kinome screen identifies PFKFB3 and glucose metabolism as important regulators of the insulin/insulin-like growth factor (IGF)-1 signaling pathway. J. Biol. Chem. 2015, 290, 25834–25846. [Google Scholar] [CrossRef] [Green Version]
- Tao, R.; Xiong, X.; Harris, R.A.; White, M.F.; Dong, X.C. Genetic Inactivation of Pyruvate Dehydrogenase Kinases Improves Hepatic Insulin Resistance Induced Diabetes. PLoS ONE 2013, 8, e71997. [Google Scholar] [CrossRef] [Green Version]
- Yao, J.; Cheng, Y.; Zhang, D.; Fan, J.; Zhao, Z.; Li, Y.; Jiang, Y.; Guo, Y. Identification of key genes, MicroRNAs and potentially regulated pathways in alcoholic hepatitis by integrative analysis. Gene 2019, 720, 144035. [Google Scholar] [CrossRef]
- Samuel, V.T.; Shulman, G.I. The pathogenesis of insulin resistance: Integrating signaling pathways and substrate flux. J. Clin. Investig. 2016, 126, 12–22. [Google Scholar] [CrossRef] [Green Version]
- Utzschneider, K.M.; Kahn, S.E. Review: The role of insulin resistance in nonalcoholic fatty liver disease. J. Clin. Endocrinol. Metab. 2006, 91, 4753–4761. [Google Scholar] [CrossRef] [Green Version]
- Shoelson, S.E.; Lee, J.; Goldfine, A.B. Inflammation and insulin resistance. J. Clin. Investig. 2006, 116, 1793–1801. [Google Scholar] [CrossRef] [PubMed]
- Nam, H.; Ferguson, B.S.; Stephens, J.M.; Morrison, R.F. Impact of obesity on IL-12 family gene expression in insulin responsive tissues. Biochim. Biophys. Acta-Mol. Basis Dis. 2013, 1832, 11–19. [Google Scholar] [CrossRef] [PubMed] [Green Version]
- Wang, F.; Zhou, H.; Deng, L.; Wang, L.; Chen, J.; Zhou, X.; Jiang, H. Serine Deficiency Exacerbates Inflammation and Oxidative Stress via Microbiota-Gut-Brain Axis in D-Galactose-Induced Aging Mice. Mediat. Inflamm. 2020, 2020, 5821428. [Google Scholar] [CrossRef] [Green Version]
- Kurita, K.; Ohta, H.; Shirakawa, I.; Tanaka, M.; Kitaura, Y.; Iwasaki, Y.; Matsuzaka, T.; Shimano, H.; Aoe, S.; Arima, H.; et al. Macrophages rely on extracellular serine to suppress aberrant cytokine production. Sci. Rep. 2021, 11, 1–14. [Google Scholar] [CrossRef] [PubMed]
- Rodriguez, A.E.; Ducker, G.S.; Billingham, L.K.; Martinez, C.A.; Mainolfi, N.; Suri, V.; Friedman, A.; Manfredi, M.G.; Weinberg, S.E.; Rabinowitz, J.D.; et al. Serine Metabolism Supports Macrophage IL-1β Production. Cell Metab. 2019, 29, 1003–1011.e4. [Google Scholar] [CrossRef] [PubMed] [Green Version]
- Chen, S.; Xia, Y.; He, F.; Fu, J.; Xin, Z.; Deng, B.; He, L.; Zhou, X.; Ren, W. Serine Supports IL-1β Production in Macrophages Through mTOR Signaling. Front. Immunol. 2020, 11, 1–15. [Google Scholar] [CrossRef] [PubMed]
- Magee, N.; Zhang, Y. Role of early growth response 1 in liver metabolism and liver cancer. Hepatoma Res. 2017, 3, 268. [Google Scholar] [CrossRef] [PubMed] [Green Version]
- Allen, K.; Jaeschke, H.; Copple, B.L. Bile acids induce inflammatory genes in hepatocytes: A novel mechanism of inflammation during obstructive cholestasis. Am. J. Pathol. 2011, 178, 175–186. [Google Scholar] [CrossRef]
- Huang, H.; Liu, K.; Ou, H.; Qian, X.; Wan, J. Phgdh serves a protective role in Il-1β induced chondrocyte inflammation and oxidative-stress damage. Mol. Med. Rep. 2021, 23, 1–10. [Google Scholar] [CrossRef] [PubMed]
- Zhou, X.; Zhang, Y.; Wu, X.; Wan, D.; Yin, Y. Effects of Dietary Serine Supplementation on Intestinal Integrity, Inflammation and Oxidative Status in Early-Weaned Piglets. Cell. Physiol. Biochem. 2018, 48, 993–1002. [Google Scholar] [CrossRef]
- Scerri, T.S.; Quaglieri, A.; Cai, C.; Zernant, J.; Matsunami, N.; Baird, L.; Scheppke, L.; Bonelli, R.; Yannuzzi, L.A.; Friedlander, M.; et al. Genome-wide analyses identify common variants associated with macular telangiectasia type 2. Nat. Genet. 2017, 49, 559–567. [Google Scholar] [CrossRef]
- Shen, W.; Lee, S.R.; Mathai, A.E.; Zhang, R.; Du, J.; Yam, M.X.; Pye, V.; Barnett, N.L.; Rayner, C.L.; Zhu, L.; et al. Effect of selectively knocking down key metabolic genes in Müller glia on photoreceptor health. Glia 2021, 69, 1966–1986. [Google Scholar] [CrossRef] [PubMed]
- Shin-ichi, H.; Takehiko, T.; Junko, N.; Masami, S. Dietary and Hormonal Regulation of Serine Synthesis in the Rat. J. Biochem. 1975, 77, 207–219. [Google Scholar]
- Achouri, Y.; Robbi, M.; Van Schaftingen, E. Role of cysteine in the dietary control of the expression of 3-phosphoglycerate dehydrogenase in rat liver. Biochem. J. 1999, 21, 15–21. [Google Scholar] [CrossRef]
- Hill, R.B.; Prosper, J.; Hirschfield, J.S.; Kern, F. Protein starvation and the small intestine. I. The Growth and Morphology of the Small Intestine in Weanling Rats. Exp. Mol. Pathol. 1968, 8, 66–74. [Google Scholar] [CrossRef]


| (A) | ||||
| Amino Acid Concentration in Liver | ||||
| Concentration (nmol/g Weight Tissue) | ||||
| Amino Acid | Floxed Group | LKO Group | Ratio (%: LKO/Floxed) | p-Value |
| L-Asp | 79.17 ± 11.29 | 105.21 ± 14.55 | 132.9 | N.S. |
| L-G1u | 713.44 ± 97.8 | 731.2 ± 107.57 | 102.5 | N.S. |
| L-Ser | 323.55 ± 39.72 | 343.51 ± 37.4 | 106.2 | N.S. |
| L-Gln | 2946.45 ±308.2 | 3167.27 ± 174.77 | 107.5 | N.S. |
| L-His | 364.72 ± 6.91 | 414.93 ± 28.46 | 113.8 | N.S. |
| L-Thr | 234.27 ± 17.43 | 224.61 ± 15.36 | 95.9 | N.S. |
| Gly | 1715.62 ± 49.12 | 1717.33 ± 116 | 100.1 | N.S. |
| L-Arg | 26.97 ± 14.24 | 29.42 ± 18.42 | 109.1 | N.S. |
| Tau | 9200.13 ± 823.4 | 7966.99 ± 1591.07 | 86.6 | N.S. |
| GABA | 130.97 ± 2.42 | 135.75 ± 3.4 | 103.7 | N.S. |
| L-Ala | 2618.32 ± 210.7 | 2746.58 ± 140.02 | 104.9 | N.S. |
| L-Tyr | 248.25 ± 21.96 | 238.91 ± 13.9 | 96.2 | N.S. |
| L-Val | 399.78 ± 100.8 | 455.24 ± 169.22 | 113.9 | N.S. |
| L-Met | 68.41 ± 8.43 | 64.92 ± 6.41 | 94.9 | N.S. |
| L-Phe | 249.84 ± 16 | 237.87 ± 12.7 | 95.2 | N.S. |
| L-Ile | 99.47 ± 8.42 | 104.51 ± 8.33 | 105.1 | N.S. |
| L-Leu | 496.8 ± 36.46 | 456.04 ± 21.95 | 91.8 | N.S. |
| (B) | ||||
| Amino Acid Concentration in Kidney | ||||
| Concentration (nmol/g Weight Tissue) | ||||
| Amino Acid | Floxed Group | LKO Group | Ratio (%: LKO/Floxed) | p-Value |
| L-Asp | 1464.3 ± 162.39 | 1439.86 ± 89.12 | 98.3 | 0.02 |
| L-G1u | 4171.94 ± 321.28 | 3847.12 ± 214.57 | 92.2 | N.S. |
| L-Ser | 502.84 ± 41.5 | 702.08 ± 41.04 | 139.6 | 0.007 |
| L-Gln | 847.54 ± 39.02 | 937.62 ± 40.59 | 110.6 | N.S. |
| L-His | 94.1 ± 10.05 | 127.82 ± 9.09 | 135.8 | 0.009 |
| L-Thr | 300.35 ± 25.49 | 354.49 ± 19.05 | 118.0 | N.S. |
| Gly | 3641.13 ± 182.57 | 3830.17 ± 273.83 | 105.2 | N.S. |
| L-Arg | 178.67 ± 22.76 | 250.48 ± 17.65 | 140.2 | 0.03 |
| Tau | 5757.92 ± 238.44 | 5924.89 ± 366.5 | 102.9 | N.S. |
| GABA | 81.84 ± 1.09 | 95.92 ±6.36 | 117.2 | 0.054 |
| L-Ala | 983.93 ± 66.02 | 1126.23 ± 53.74 | 114.5 | 0.07 |
| L-Tyr | 350.66 ± 27.68 | 444.34 ± 27.39 | 126.7 | 0.04 |
| L-Val | 330.69 ± 91.3 | 406.58 ± 80.47 | 122.9 | N.S. |
| L-Met | 75.69 ± 8.7 | 106.19 ± 8.98 | 140.3 | 0.03 |
| L-Phe | 187.23 ± 12.96 | 248.64 ± 15.72 | 132.8 | 0.01 |
| L-Ile | 104.43 ± 5.86 | 135.03 ± 9.53 | 129.3 | 0.02 |
| L-Leu | 430.37 ± 25.3 | 562.25 ± 31.6 | 130.6 | 0.009 |
| (A) | |
| Enriched KEGG Pathway in Up-Regulated Genes | |
| Term | p-Value |
| mmu04740:O1factory transduction | 2.90 × 10⁻¹⁸ |
| mmu03320:PPAR signaling pathway | 0.02511031 |
| mmu04360:Axon guidance | 0.04367046 |
| (B) | |
| Enriched KEGG Pathway in Down-Regulated Genes | |
| Term | p-Value |
| mmu05211:Renal cell carcinoma | 0.00163639 |
| mmu03015:mRNA surveillance pathway | 0.00207197 |
| mmu05220:Chronic myeloid leukemia | 0.01099769 |
| mmu04510:Focal adhesion | 0.01549065 |
| mmu03018:RNA degradation | 0.01850316 |
| mmu04630:Jak-STAT signaling pathway | 0.01888063 |
| mmu05221:Acute myeloid leukemia | 0.02040881 |
| mmu04151:PI3K-Akt signaling pathway | 0.03143164 |
| mmu04152:AMPK signaling pathway | 0.03272039 |
| mmu05212:Pancreatic cancer | 0.03310616 |
| mmu05200:Pathways in cancer | 0.03348629 |
| mmuO4713:Circadian entrainment | 0.03641698 |
| mmu04015:Rapl signaling pathway | 0.04736727 |
| (A) | ||
| Top Canonical Pathway | ||
| Name | p-Value | Overlap |
| IL-12 Signaling and Production in Macrophages | 5.96 × 10⁻⁴ | 9.8% (11/112) |
| Ephrin Receptor Signaling | 6.14 × 10⁻⁴ | 8.3% (14/168) |
| UVA-Induced MAPK Signaling | 9.92 × 10⁻⁴ | 10.7% (9/84) |
| FLT3 Signaling in Hematopoietic Progenitor Cells | 1.23 × 10⁻³ | 11.4% (8/70) |
| Calcium Signaling | 1.27 × 10⁻³ | 8.1% (13/161) |
| (B) | ||
| Diseases and Disorders | ||
| Name | p-Value | # Molecules |
| Cancer | 0.0304–3.00 × 10⁻⁶ | 328 |
| Hematological Disease | 0.0304–3.00 × 10⁻⁶ | 52 |
| Immunological Disease | 0.0304–3.00 × 10⁻⁶ | 43 |
| Organismal Injury and Abnormalities | 0.0304–3.00 × 10⁻⁶ | 338 |
| Tumor Morphology | 0.0304–3.00 × 10⁻⁶ | 11 |
| (C) | ||
| Hepatotoxicity | ||
| Name | p-Value | # Molecules |
| Liver Regeneration | 0.440–0.0228 | 3 |
| Liver Edema | 0.0304 | 1 |
| Liver Fibrosis | 0.306–0.0304 | 7 |
| Liver Necrosis/Cell Death | 0.247–0.0304 | 11 |
| Hepatocellular Carcinoma | 1.00–0.0352 | 12 |
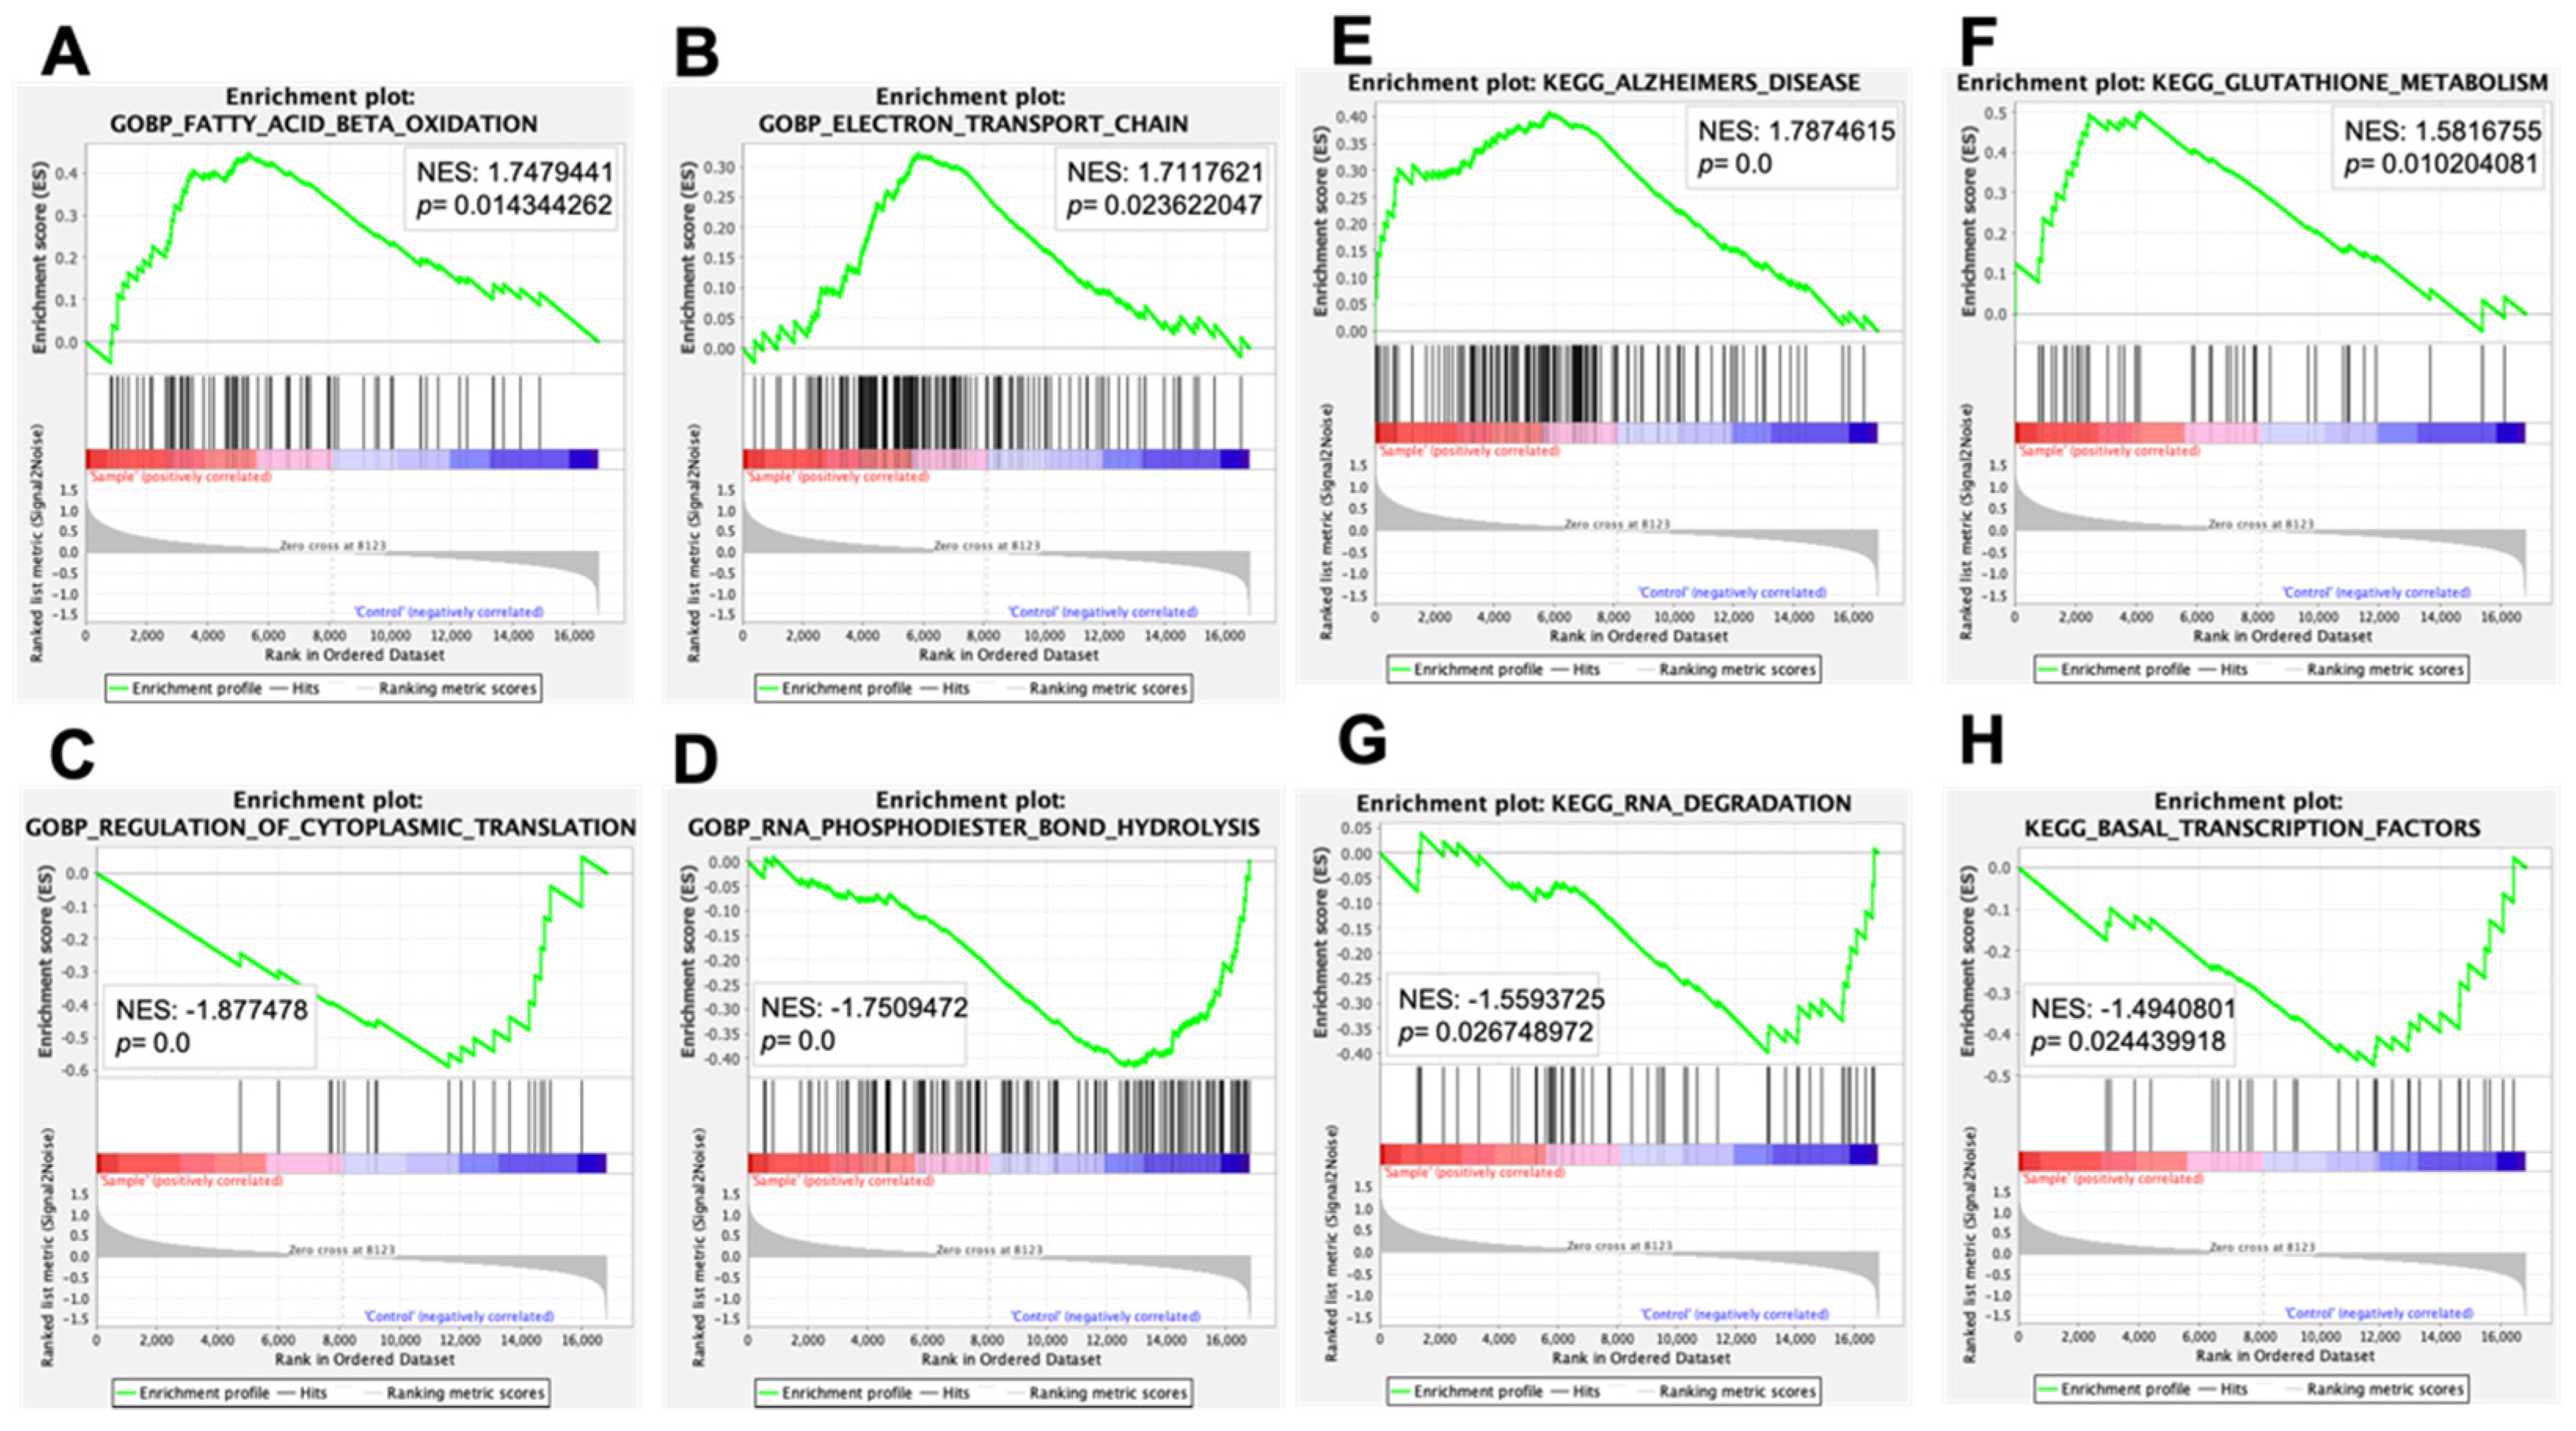
| (A) | ||
| Name | NES | NOM p-Value |
| GOBP_NEGATIVE_REGULATION_OF_NUCLEOCYTOPLASMIC_TRANSPORT | 1.7842134 | 0.00613497 |
| GOBP_BRANCHED_CHAIN_AMINO_ACID_METABOLIC_PROCESS | 1.7758015 | 0.00203666 |
| GOBP_FATTY_ACID_BETA_OXIDATION | 1.7479441 | 0.01434426 |
| GOBP_REGULATION_OF_CAMP_DEPENDENT_PROTEIN_KINASE_ ACTIVITY | 1.732202 | 0 |
| GOBP_ELECTRON_TRANSPORT_CHAIN | 1.7117621 | 0.02362205 |
| GOBP_CELLULAR_METABOLIC_COMPOUND_SALVAGE | 1.7083353 | 0 |
| GOBP_ATP_SYNTHESIS_COUPLED_ELECTRON_TRANSPORT | 1.707343 | 0.04918033 |
| GOBP_NOTOCHORD_DEVELOPMENT | 1.6475885 | 0.00393701 |
| GOBP_COCHLEA_DEVELOPMENT | 1.646138 | 0 |
| GOBP_SECRETION_BY_TISSUE | 1.6355267 | 0.00587084 |
| GOBP_PYRIMIDINE_NUCLEOSIDE_TRIPHOSPHATE_METABOLIC_PROCESS | 1.6341659 | 0.01185771 |
| GOBP_PYRIMIDINE_RIBONUCLEOSIDE_TRIPHOSPHATE_METABOLIC_PROCESS | 1.6233511 | 0.02564103 |
| GOBP.METANEPHRIC_N EPHRON_MORPHOGEN ESIS | 1.6204721 | 0.01996008 |
| GOBP_REGULATION_OF_CARDIAC_CONDUCTION | 1.6196082 | 0.01859504 |
| GOBP_RESPIRATORY_ELECTRON_TRANSPORT_CHAIN | 1.6190714 | 0.076 |
| GOBP_SPERM_EGG_RECOGNITION | 1.6184356 | 0.00592885 |
| GOBP_DNA_UNWINDING_INVOLVED_IN_DNA_REPLICATION | 1.618192 | 0.01030928 |
| GOBP_METANEPHROS_MORPHOGENESIS | 1.6089716 | 0.01629328 |
| GOBP_MONOVALENT_INORGANIC_ANION_HOMEOSTASIS | 1.6088727 | 0.00804829 |
| GOBP_PYRIMIDINE_NUCLEOSIDE_TRIPHOSPHATE_BIOSYNTHETIC_PROCESS | 1.6057541 | 0.01207244 |
| (B) | ||
| Name | NES | NOM p-Value |
| GOBP_REGULATION_OF_CYTOPLASMIC_TRANSLATION | −1.877478 | 0 |
| GOBP_RNA_PHOSPHODIESTER_BOND_HYDROLYSIS_EXONUCLEOLYTIC | −1.8400294 | 0.002 |
| GOBP_MATURATION_OF_5_8S_RRNA_FROM_TRICISTRONIC_RRNA_TRANSCRIPT_SSU_RRNA_5_8S_RRNA_LSU_RRNA | −1.8186126 | 0.00412371 |
| GOBP_NEGATIVE_REGULATION_OF_PROTEIN_TYROSINE_KINASE_ACTIVITY | −1.8014549 | 0 |
| GOBP_RNA_PHOSPHODIESTER_BOND_HYDROLYSIS | −1.7509472 | 0 |
| GOBP_CLEAVAGE_INVOLVED_IN_RRNA_PROCESSING | −1.7341155 | 0.01649485 |
| GOBP_POSITIVE_REGULATION_OF_VIRAL_TRANSCRIPTION | −1.7214938 | 0.0260521 |
| GOBP_REGULATION_OF_MACROPHAGE_CHEMOTAXIS | −1.7151726 | 0 |
| GOBP_PEPTIDYL_LYSINE_ ACETYLATION | −1.7136337 | 0 |
| GOBP_MRNA_CLEAVAGE | −1.6955862 | 0.01 |
| GOBP_POSITIVE_REGULATION_OF_HISTONE_DEACETYLATION | −1.684807 | 0.00984252 |
| GOBP_NUCLEAR_TRANSCRIBED_MRNA_CATABOLIC_PROCESS_EXONUCLEOLYTIC | −1.680216 | 0.006 |
| GOBP_VIRAL_GENE_EXPRESSION | −1.6742575 | 0.02615694 |
| GOBP_MATURATION_OF_5_8S_RRNA | −1.6727061 | 0.02340426 |
| GOBP_TRANSCRIPTION_PREINITIATION_COMPLEX_ASSEMBLY | −1.6675799 | 0.01757813 |
| GOBP_PROTEIN_LIPID_COMPLEX_ASSEMBLY | −1.6524748 | 0.01335878 |
| GOBP_NUCLEAR_ENVELOPE_REASSEMBLY | −1.6334432 | 0.03012048 |
| GOBP_PROTEIN_ACETYLATION | −1.6297097 | 0 |
| GOBP_PEPTIDYL_ASPARAGINE_MODIFICATION | −1.6176745 | 0.02985075 |
| GOBP_TRANSEPITHELIAL_TRANSPORT | −1.6128986 | 0.00395257 |
| (C) | ||
| Name | NES | NOM p-Value |
| KEGG_ALZHEIMERS_DISEASE | 1.7874615 | 0 |
| KEGG_CARDIAC_MUSCLE_CONTRACTION | 1.6276087 | 0.00796813 |
| KEGG_VALINE_LEUCINE_AND_ISOLEUCINE_DEGRADATION | 1.6064283 | 0.02484472 |
| KEGG_GLUTATHIONE_METABOLISM | 1.5816755 | 0.01020408 |
| KEGG_PARKINSONS_DISEASE | 1.5710168 | 0.10224949 |
| KEGG_HUNTINGTONS_DISEASE | 1.4995617 | 0.03952569 |
| KEGG_FATTY_ACID_METABOLISM | 1.4914919 | 0.04208417 |
| KEGG_GLYCEROLIPID_METABOLISM | 1.4762139 | 0.05633803 |
| KEGG_PEROXISOME | 1.4749482 | 0.125 |
| KEGG_OXIDATIVE_PHOSPHORYLATION | 1.4733046 | 0.14229248 |
| KEGG_ARACHIDONIC_ACID_METABOLISM | 1.4536077 | 0.00626305 |
| KEGG_PROPANOATE_METABOLISM | 1.446644 | 0.11332008 |
| KEGG_OLFACTORY_TRANSDUCTION | 1.4194456 | 0.02385686 |
| KEGG_PPAR_SIGNALING_PATHWAY | 1.4145677 | 0.06412826 |
| KEGG_TRYPTOPHAN_METABOLISM | 1.409311 | 0.12352941 |
| KEGG_REGULATION_OF_AUTOPHAGY | 1.4061221 | 0.07272727 |
| KEGG_GLYCOSAMINOGLYCAN_BIOSYNTHESIS_HEPARAN_SULFATE | 1.383326 | 0.05371901 |
| KEGG_DNA_REPLICATION | 1.3792615 | 0.17693837 |
| KEGG_CALCIUM_SIGNALING_PATHWAY | 1.362877 | 0.03193613 |
| KEGG_GNRH_SIGNALING_PATHWAY | 1.3259736 | 0.07628866 |
| (D) | ||
| Name | NES | NOM p-Value |
| KEGG_DORSO_VENTRAL_AXIS_FORMATION | −1.6805534 | 0.00199601 |
| KEGG_RNA_DEGRADATION | −1.5593725 | 0.02674897 |
| KEGG_NON_SMALL_CELL_LUNG_CANCER | −1.5283813 | 0.03092784 |
| KEGG_N_GLYCAN_BIOSYNTHESIS | −1.5252374 | 0.06681035 |
| KEGG_BASAL_TRANSCRIPTION_FACTORS | −1.4940801 | 0.02443992 |
| KEGG_GLYCOSYLPHOSPHATIDYLINOSITOL_GPI_ANCHOR_BIOSYNTHESIS | −1.4563912 | 0.05285412 |
| KEGG_PANCREATIC_CANCER | −1.4190394 | 0.05020081 |
| KEGG_RENAL_CELL_CARCINOMA | −1.3920702 | 0.0831643 |
| KEGG_ADHERENSJUNCTION | −1.3889191 | 0.09543569 |
| KEGG_ENDOMETRIAL_CANCER | −1.3684485 | 0.05702648 |
| KEGG_PROSTATE_CANCER | −1.3127599 | 0.10655738 |
| KEGG_SMALL_CELL_LUNG_CANCER | −1.2742031 | 0.12576064 |
| KEGG_TGF_BETA_SIGNALING_PATHWAY | −1.2639772 | 0.16232465 |
| KEGG_SPLICEOSOME | −1.2469473 | 0.18526316 |
| KEGG_PROTEIN_EXPORT | −1.2308676 | 0.32635984 |
| KEGG_CHRONIC_MYELOID_LEUKEMIA | −1.22399 | 0.1523046 |
| KEGG_MTOR_SIGNALING_PATHWAY | −1.2147567 | 0.17979798 |
| KEGG_STEROID_HORMONE_BIOSYNTHESIS | −1.2091544 | 0.13541667 |
| KEGG_RNA_POLYMERASE | −1.1975825 | 0.27021277 |
| KEGG_PORPHYRIN_AND_CHLOROPHYLL_METABOLISM | −1.196312 | 0.21991701 |
Publisher’s Note: MDPI stays neutral with regard to jurisdictional claims in published maps and institutional affiliations. |
© 2021 by the authors. Licensee MDPI, Basel, Switzerland. This article is an open access article distributed under the terms and conditions of the Creative Commons Attribution (CC BY) license (https://creativecommons.org/licenses/by/4.0/).
Share and Cite
Hamano, M.; Esaki, K.; Moriyasu, K.; Yasuda, T.; Mohri, S.; Tashiro, K.; Hirabayashi, Y.; Furuya, S. Hepatocyte-Specific Phgdh-Deficient Mice Culminate in Mild Obesity, Insulin Resistance, and Enhanced Vulnerability to Protein Starvation. Nutrients 2021, 13, 3468. https://0-doi-org.brum.beds.ac.uk/10.3390/nu13103468
Hamano M, Esaki K, Moriyasu K, Yasuda T, Mohri S, Tashiro K, Hirabayashi Y, Furuya S. Hepatocyte-Specific Phgdh-Deficient Mice Culminate in Mild Obesity, Insulin Resistance, and Enhanced Vulnerability to Protein Starvation. Nutrients. 2021; 13(10):3468. https://0-doi-org.brum.beds.ac.uk/10.3390/nu13103468
Chicago/Turabian StyleHamano, Momoko, Kayoko Esaki, Kazuki Moriyasu, Tokio Yasuda, Sinya Mohri, Kosuke Tashiro, Yoshio Hirabayashi, and Shigeki Furuya. 2021. "Hepatocyte-Specific Phgdh-Deficient Mice Culminate in Mild Obesity, Insulin Resistance, and Enhanced Vulnerability to Protein Starvation" Nutrients 13, no. 10: 3468. https://0-doi-org.brum.beds.ac.uk/10.3390/nu13103468