
In Vivo Hypoglycemic Effects, Potential Mechanisms and LC-MS/MS Analysis of Dendropanax Trifidus Sap Extract

 , , , ,
Abstract
:1. Introduction
2. Materials and Methods
2.1. Mice
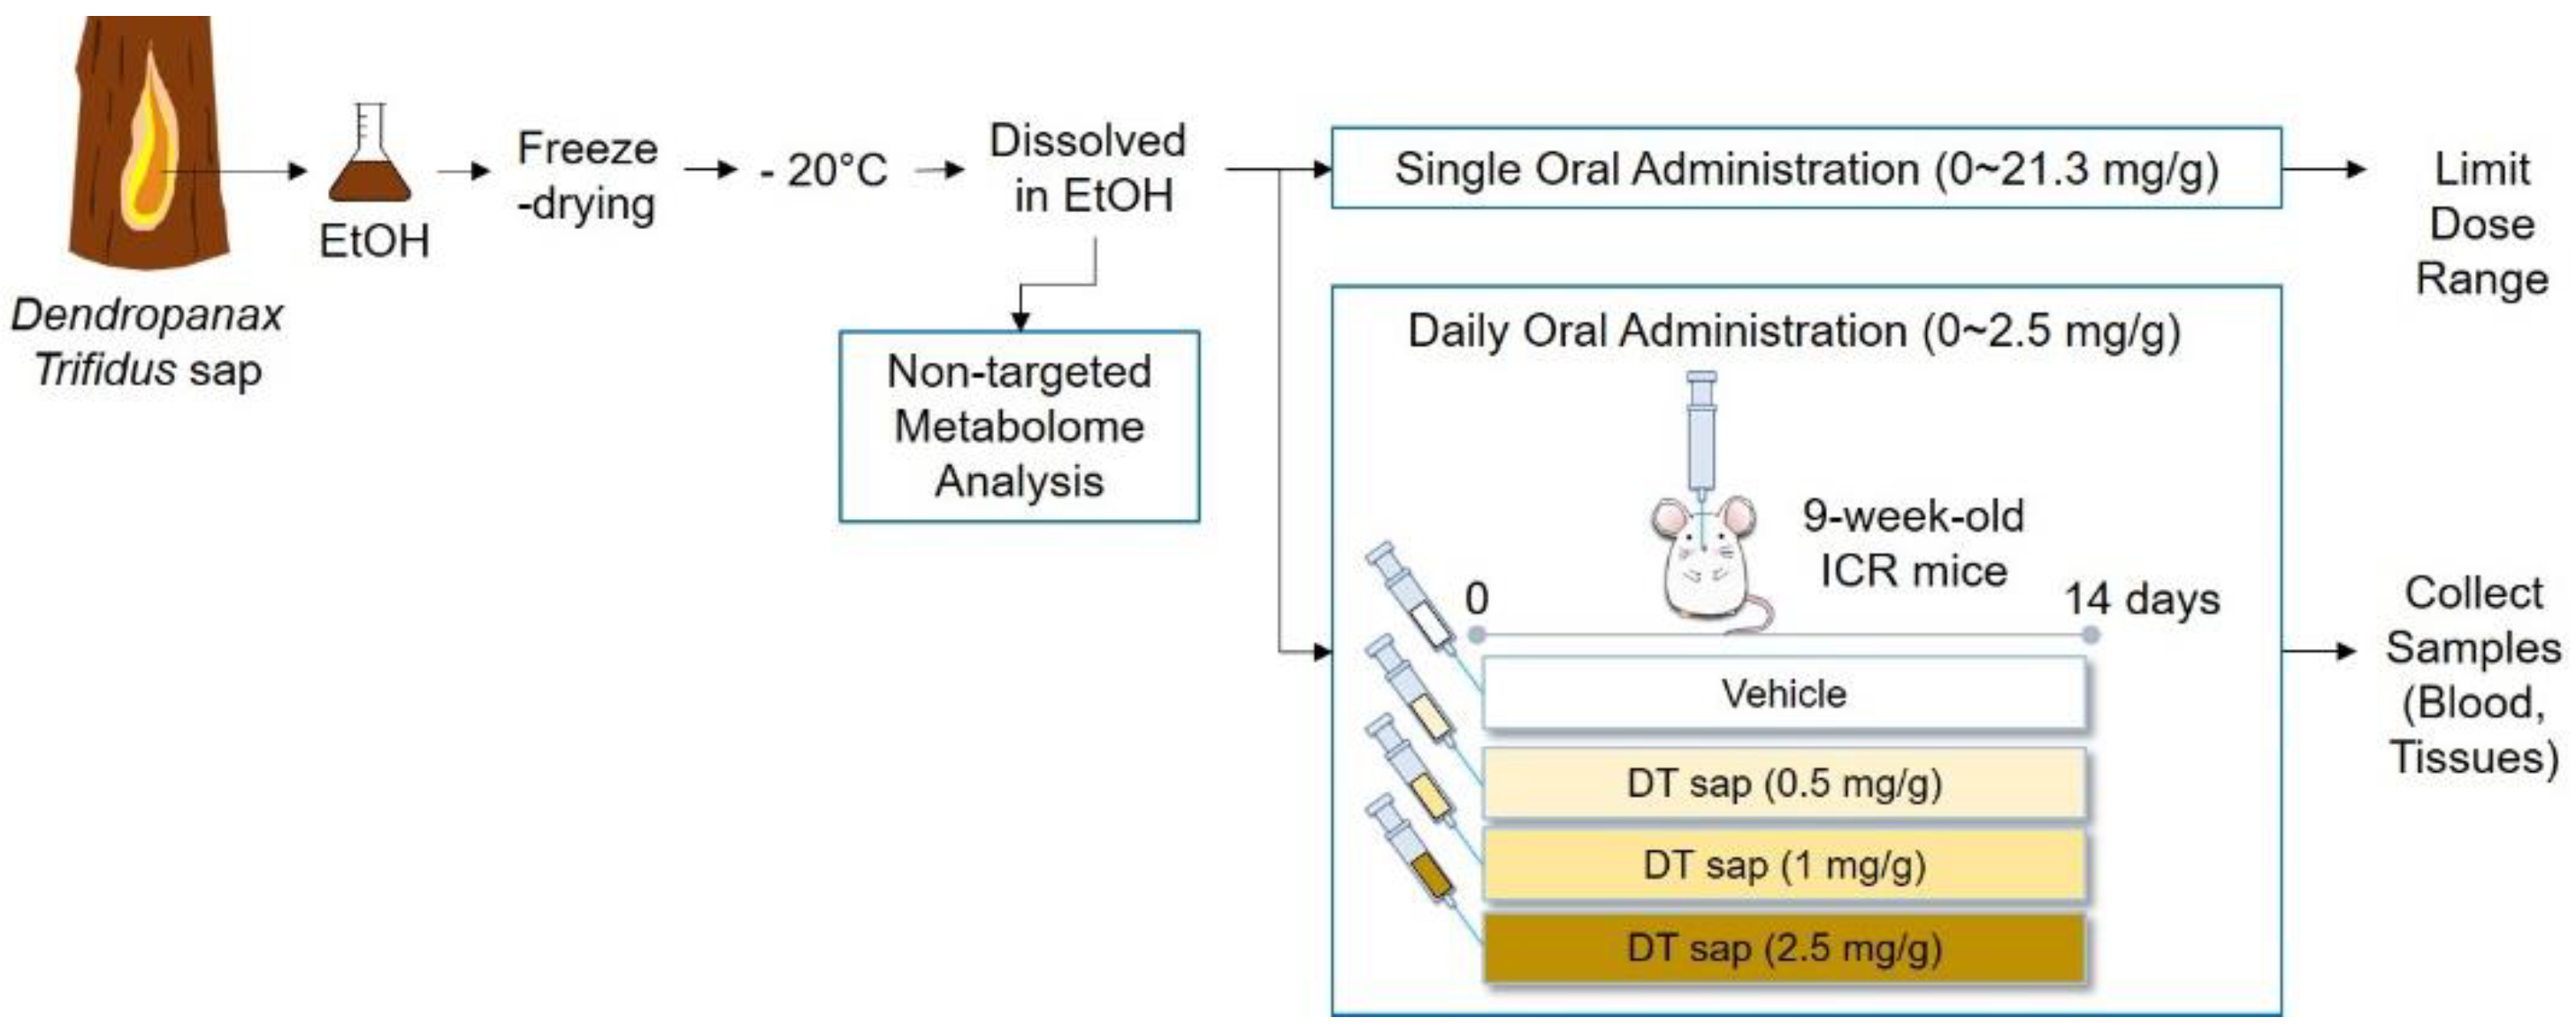
2.2. Dendropanax trifidus Sap Preparation
2.3. In Vivo Toxicity Test
2.4. Blood Chemistry
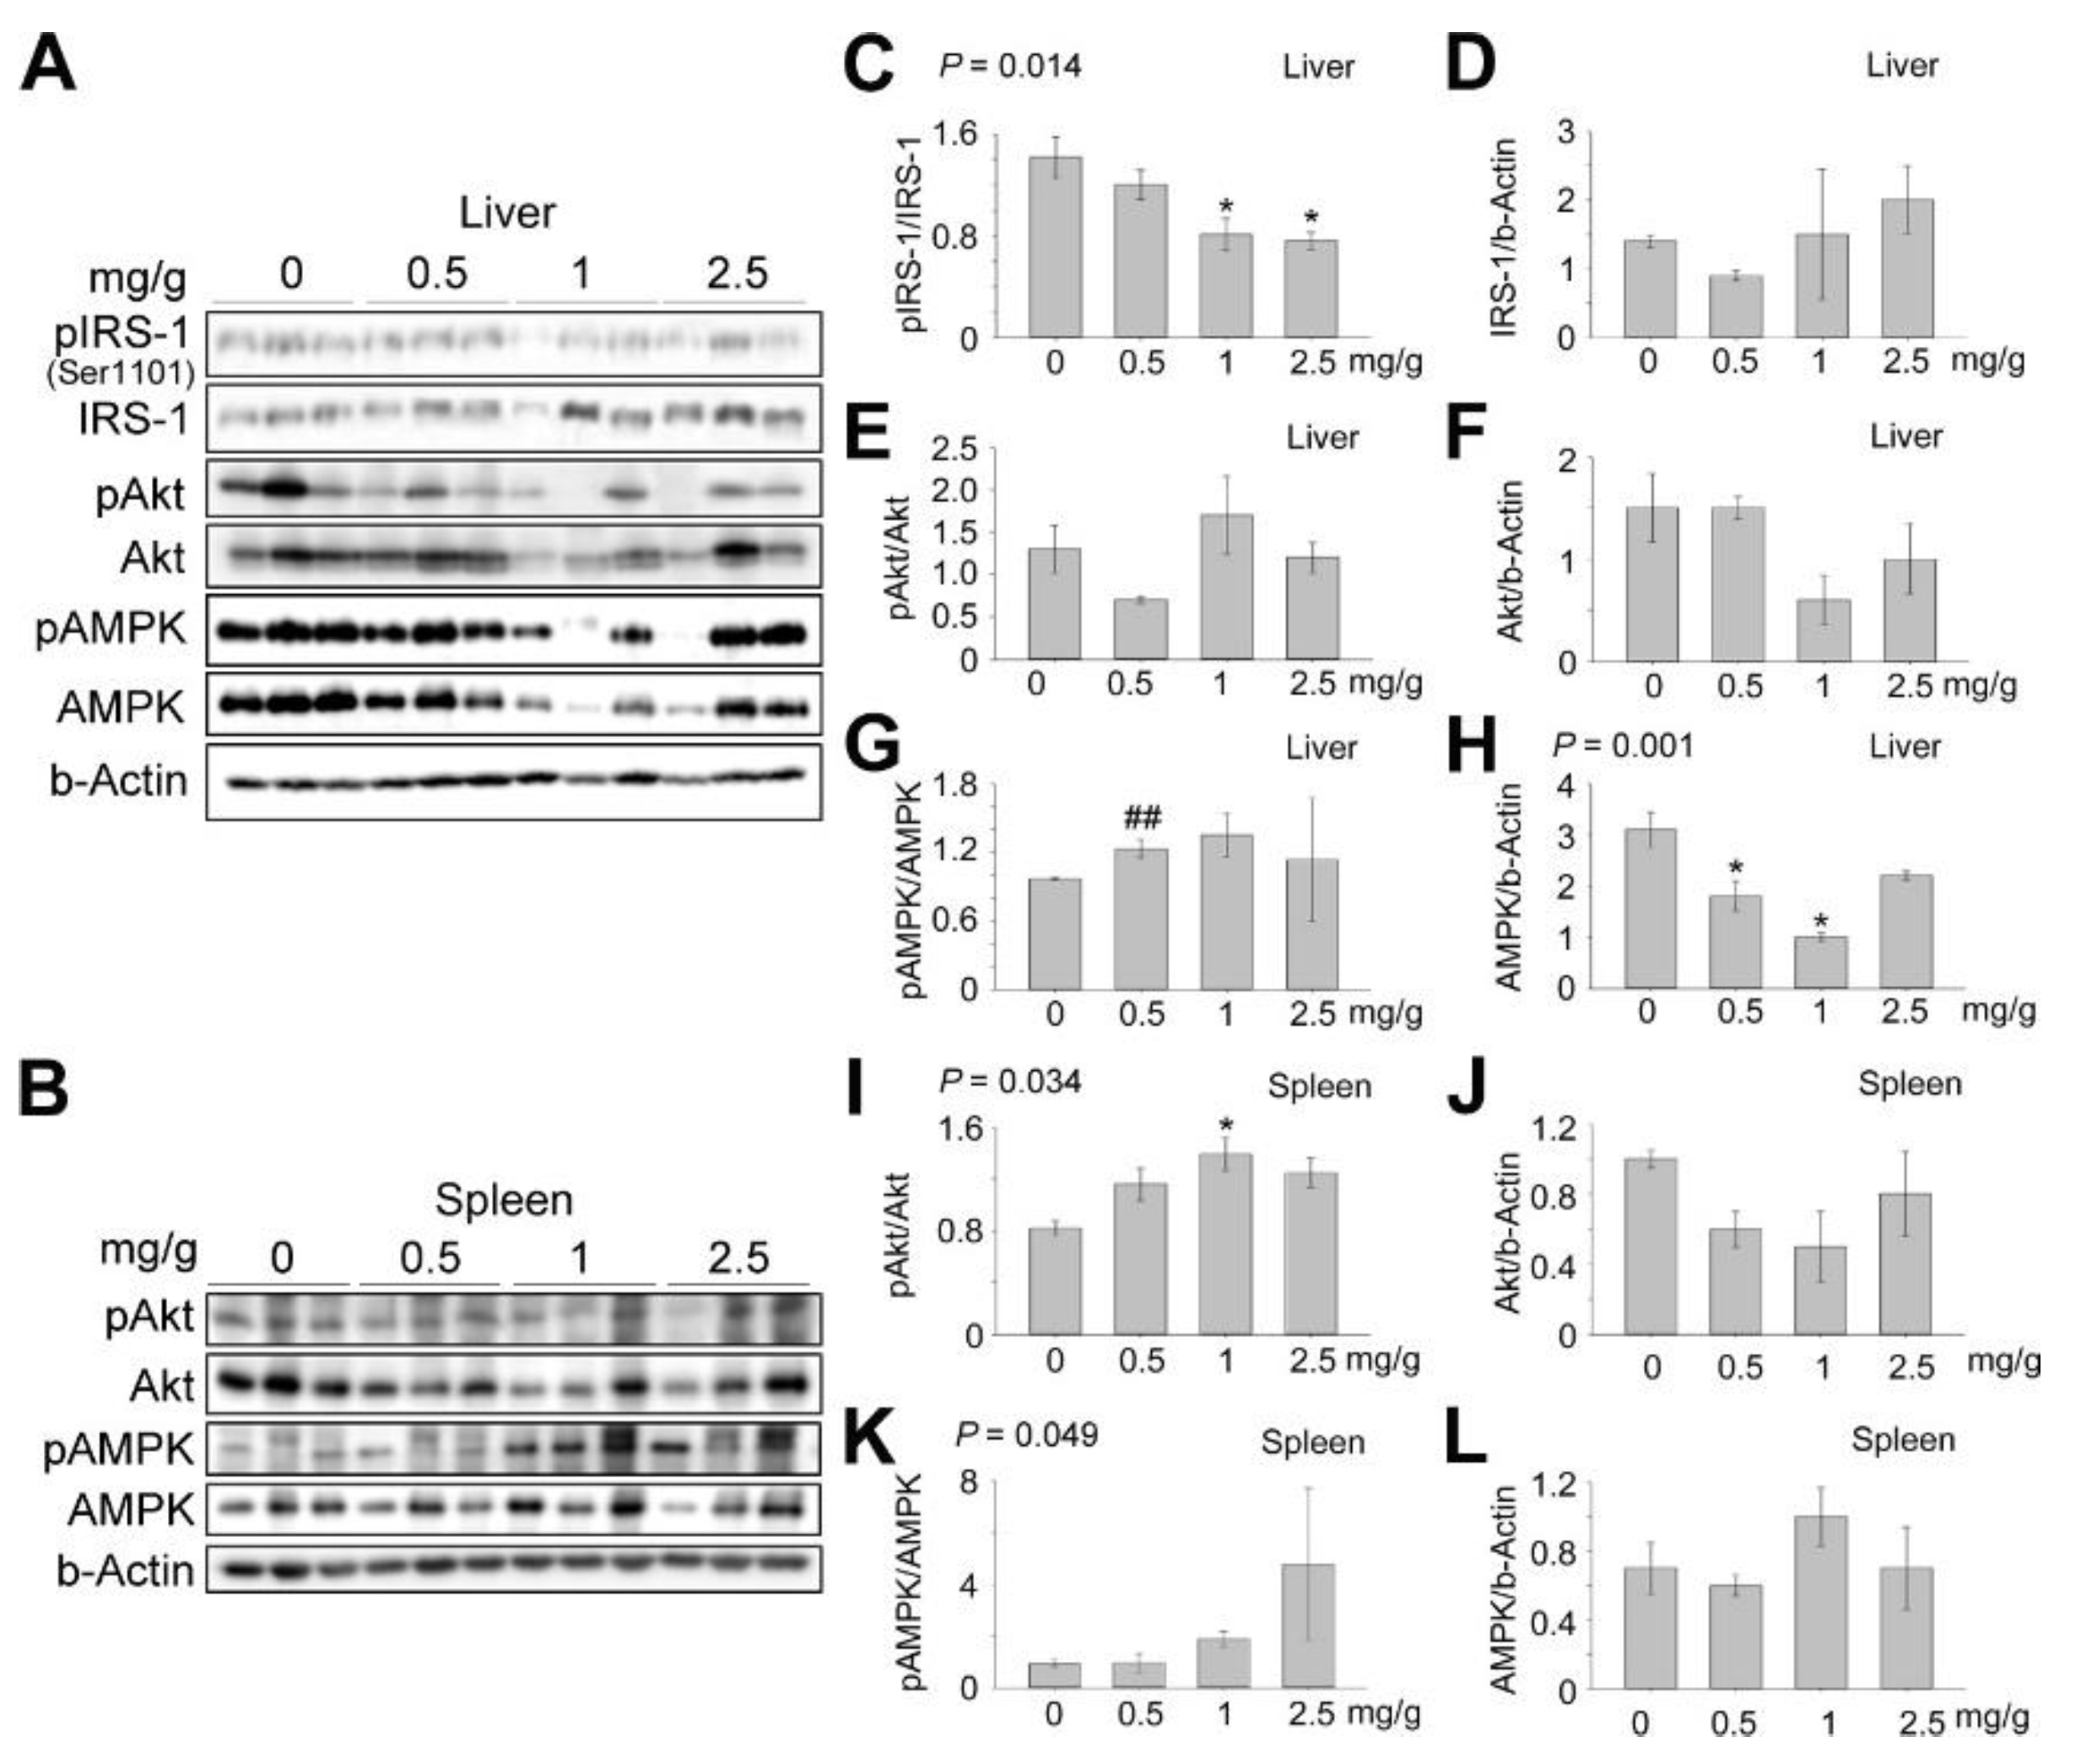
2.5. Western Blot
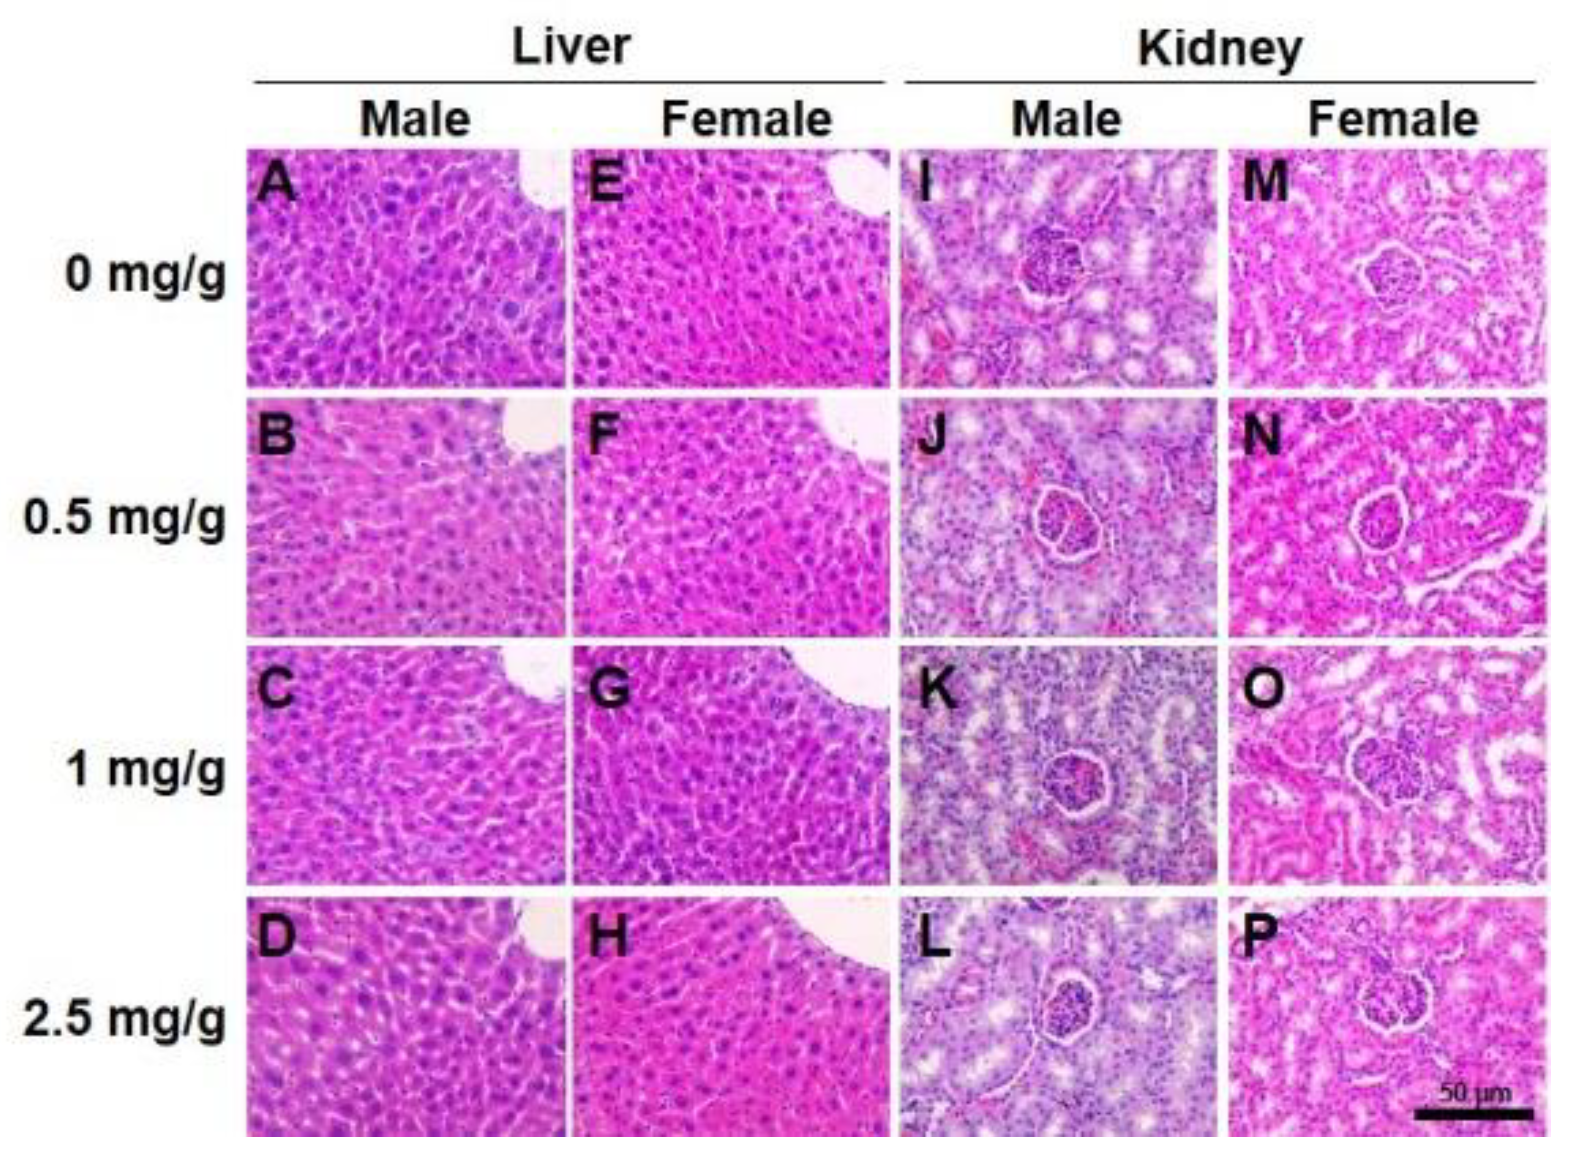
2.6. Histopathology
2.7. Non-Targeted Metabolome Analysis
2.8. Statistics
3. Results
3.1. Effects on Survival Ratio and Body/Tissue Weight by a Single Administration of Dendropanax trifidus Sap
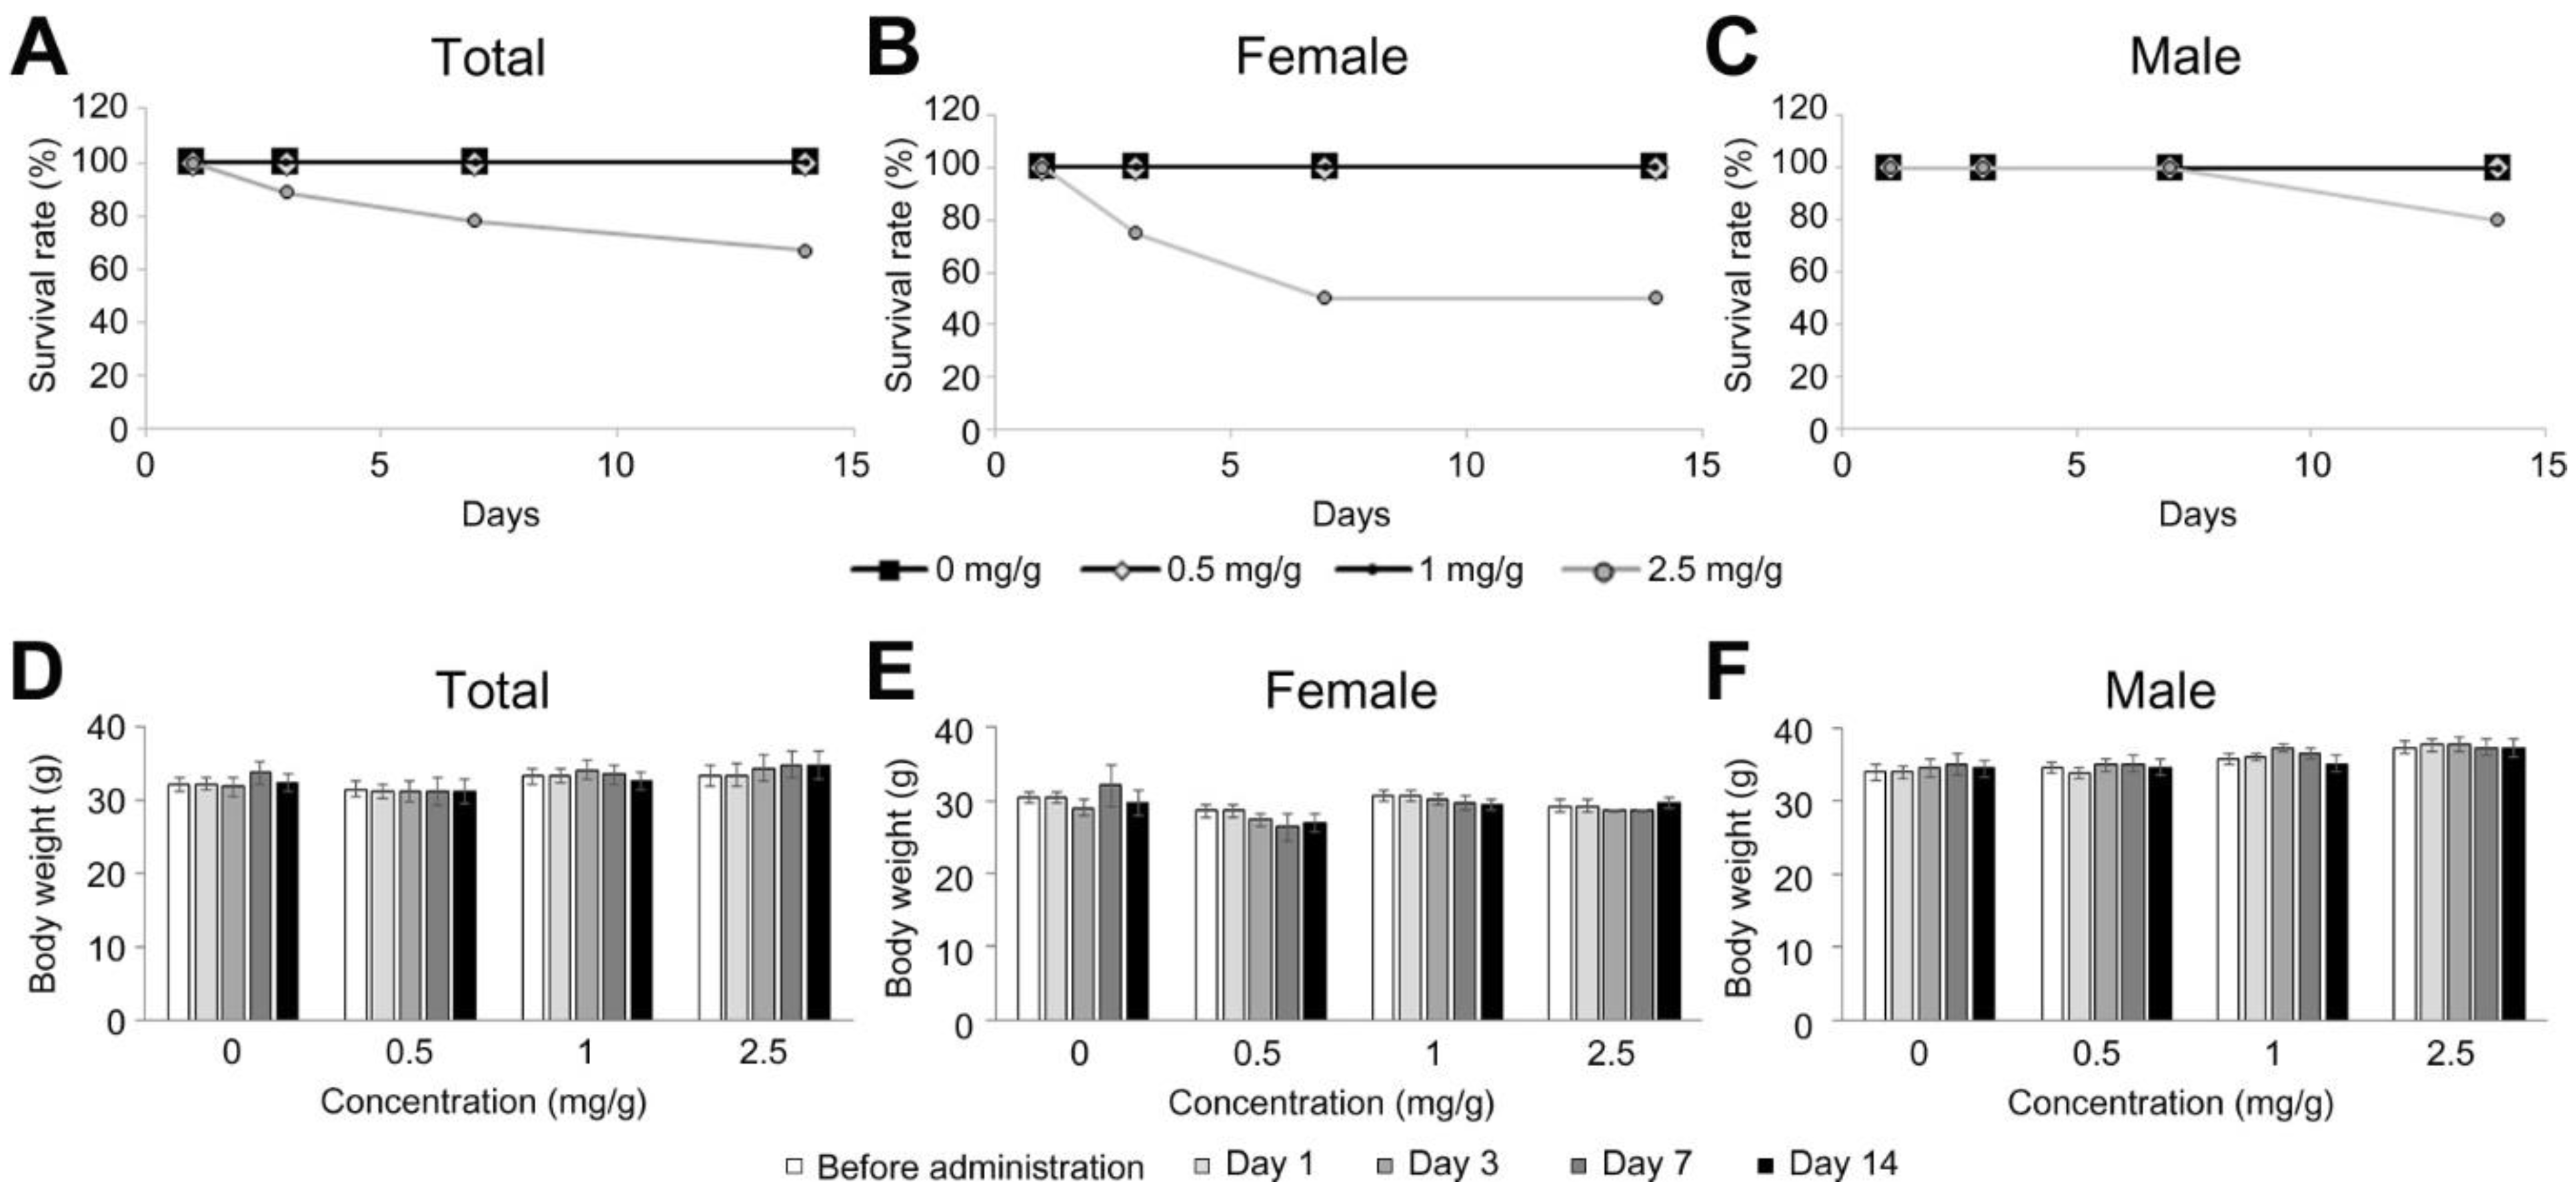
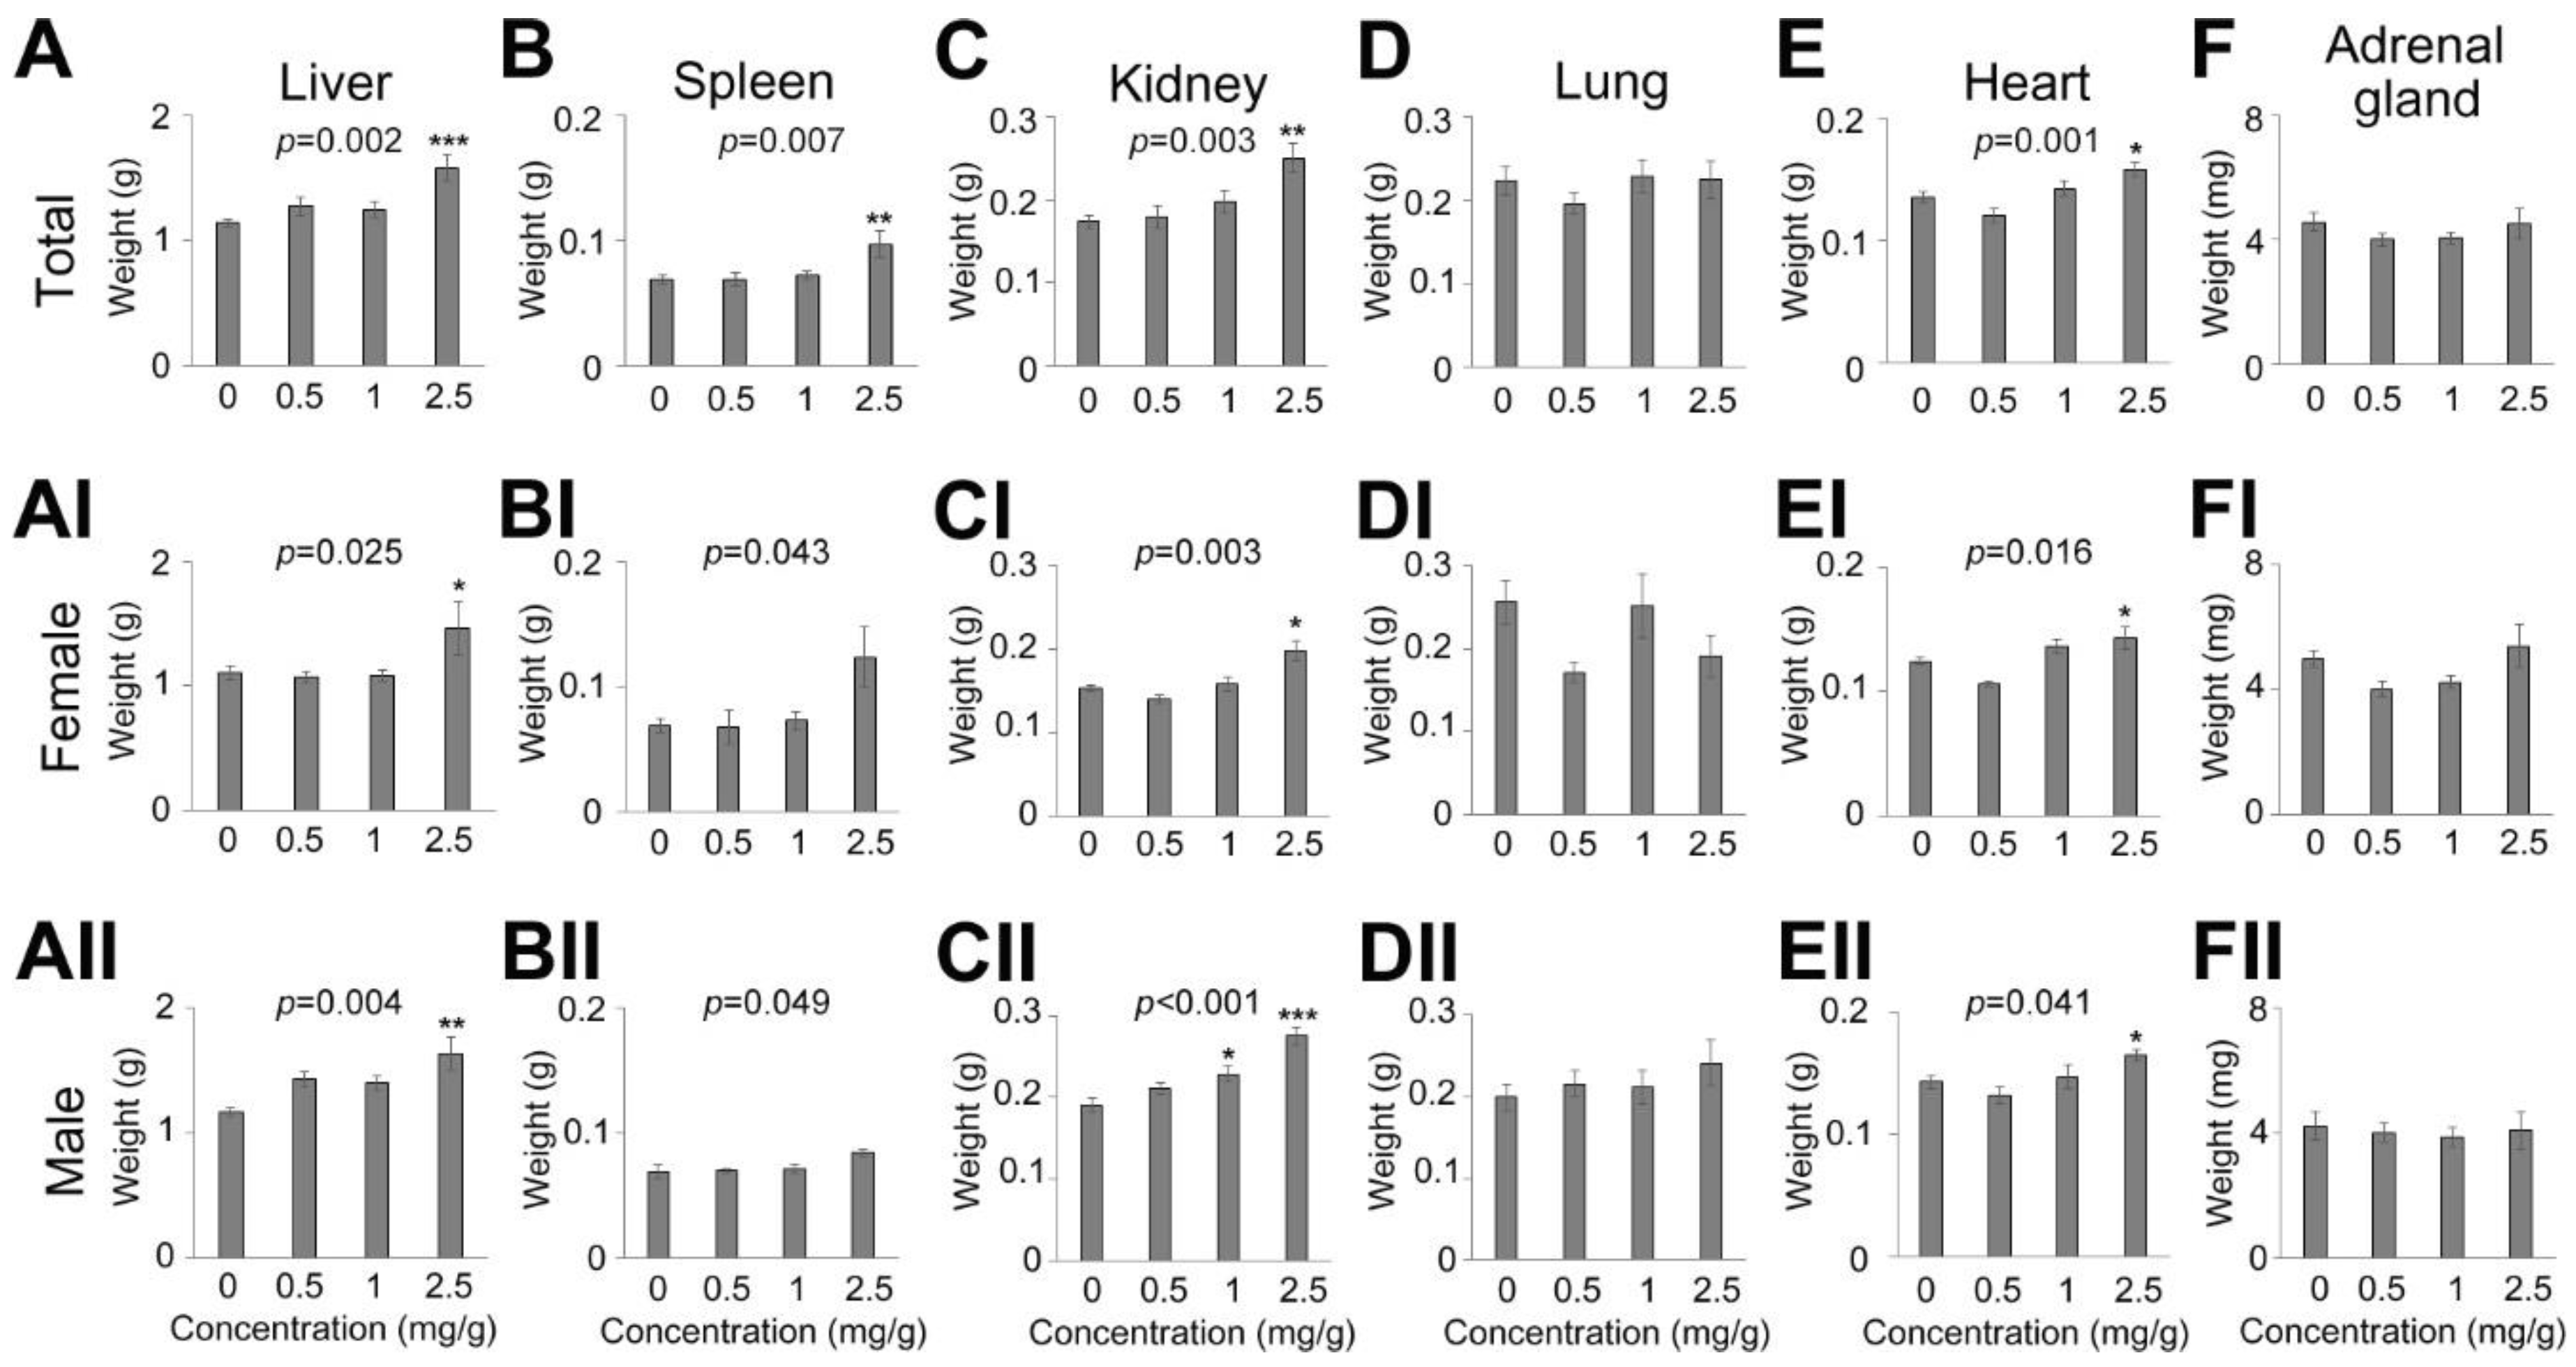
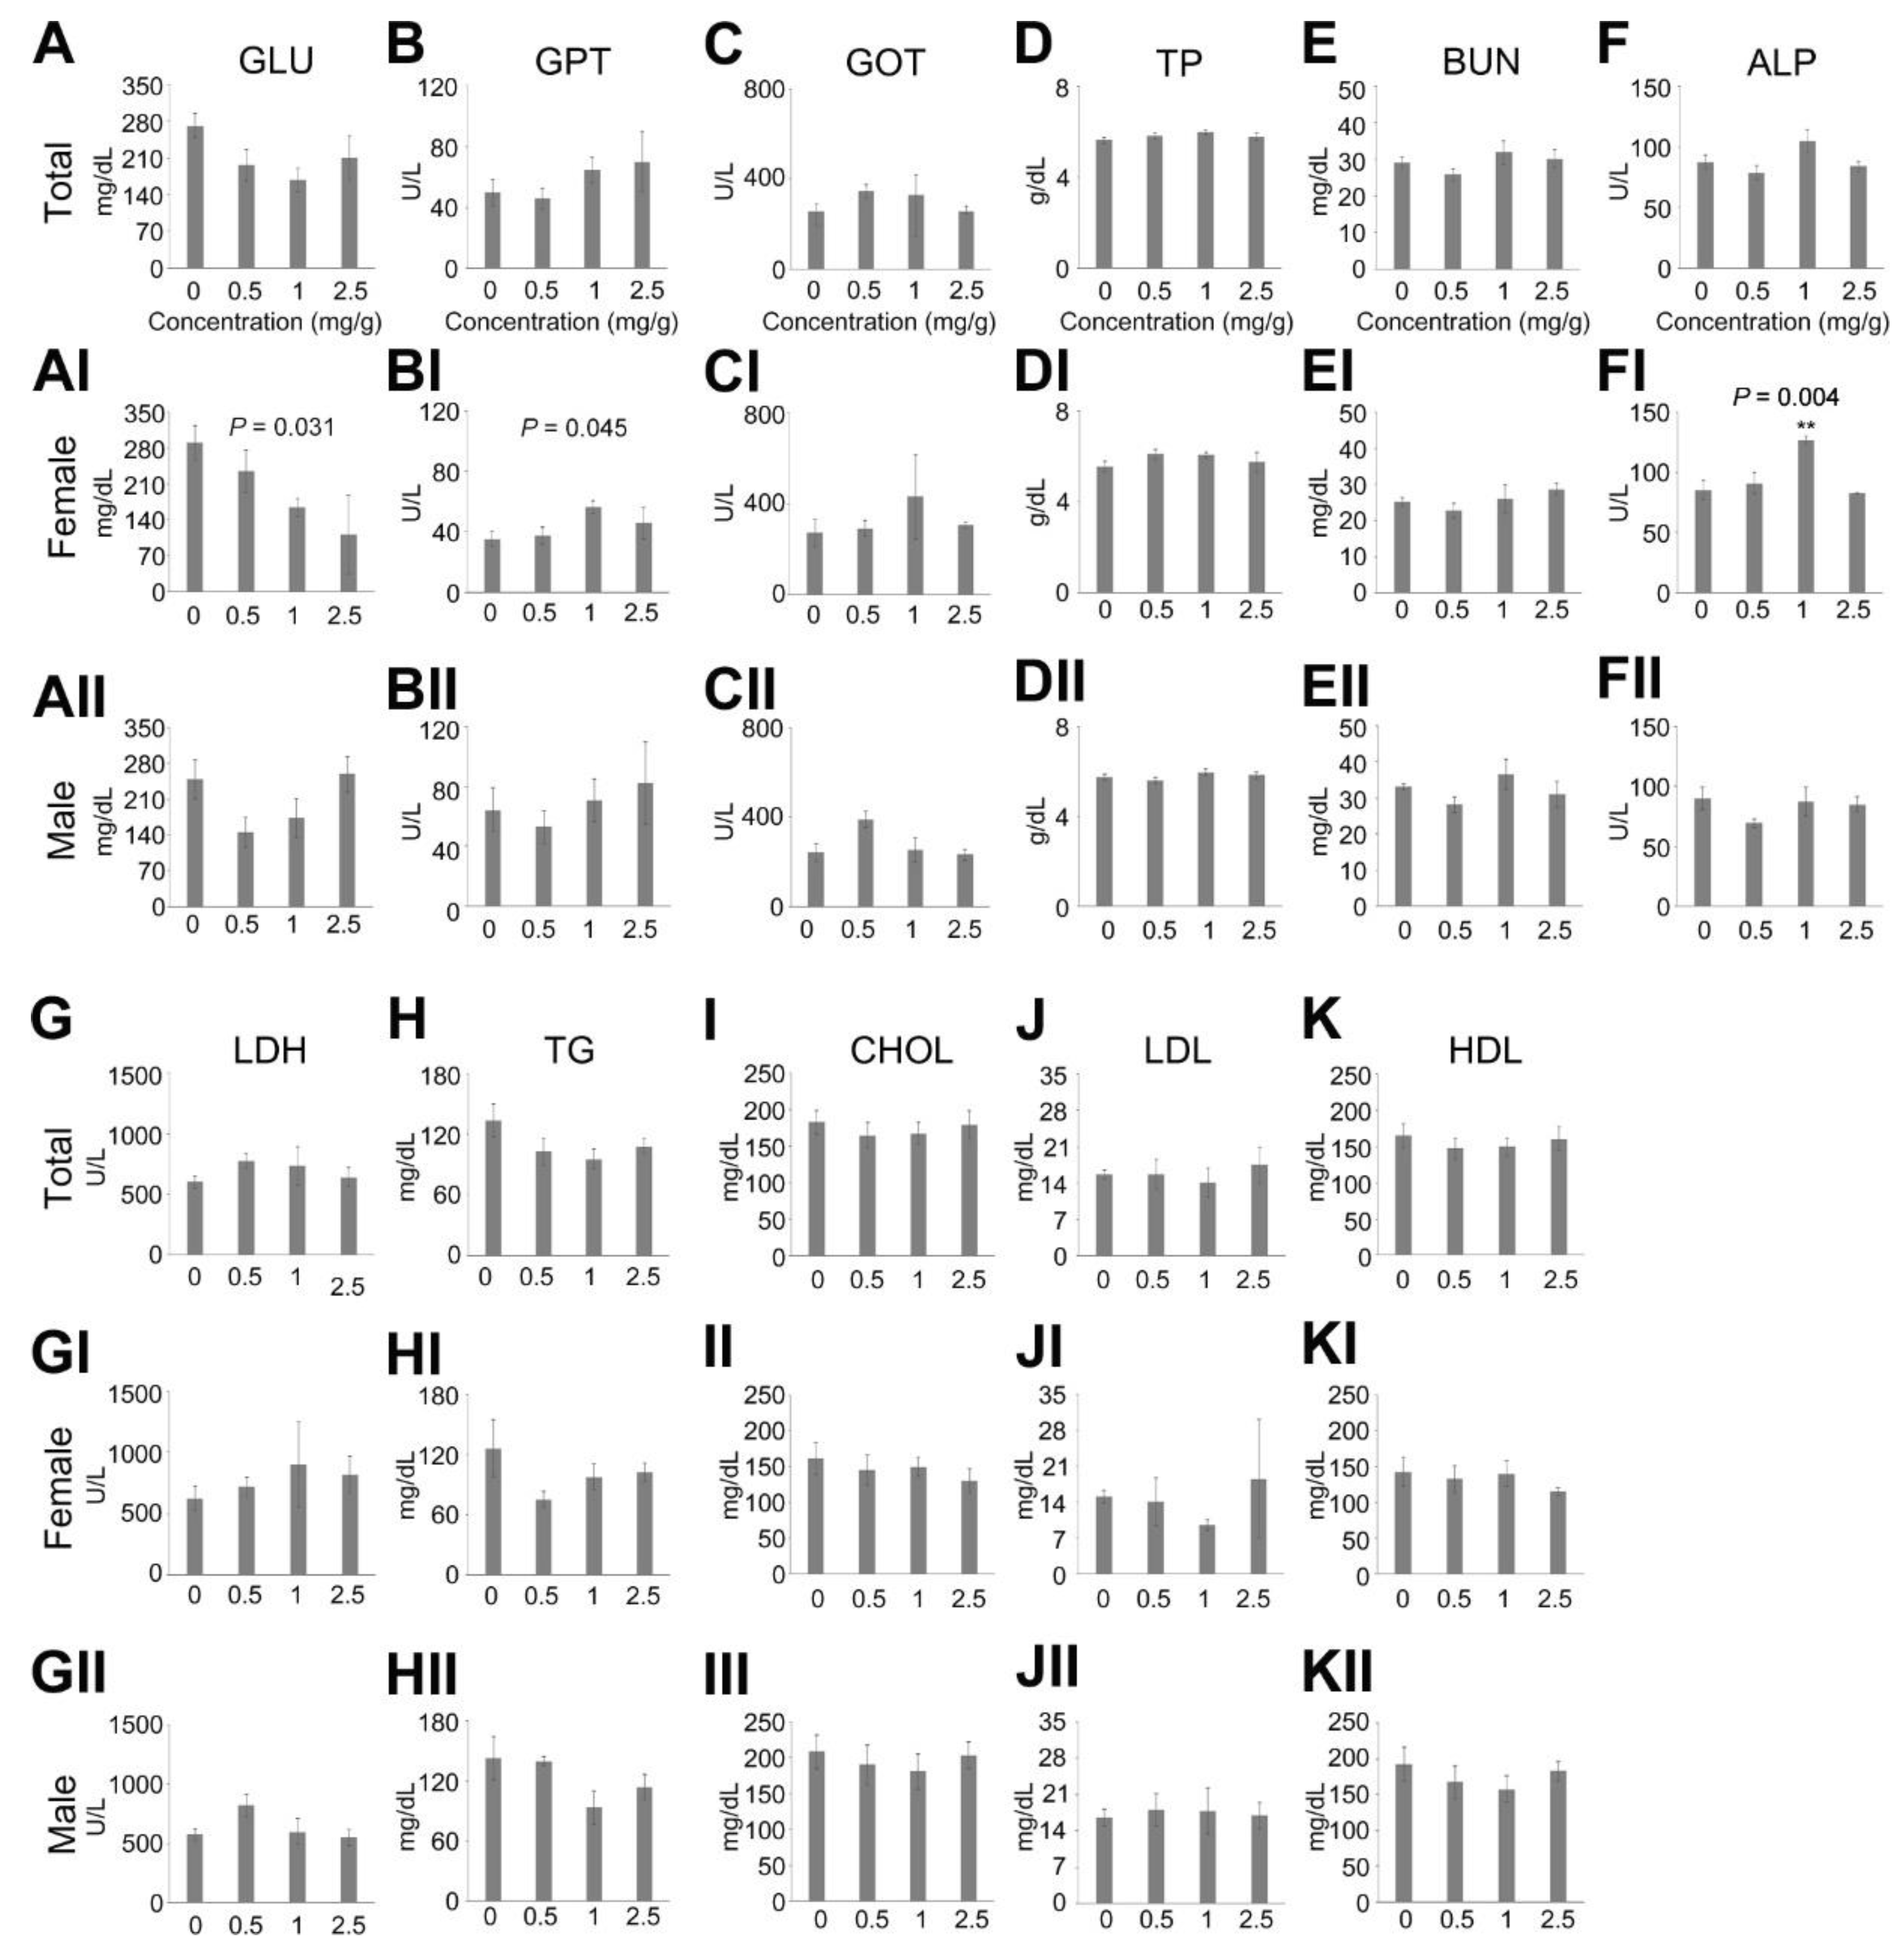
3.2. Effects on Survival Ratio and Body/Tissue Weight by a Multiple Administration of Dendropanax trifidus Sap
3.3. Reduction in Blood Glucose by Dendropanax trifidus Sap Injection
3.4. Effects of Dendropanax trifidus Sap on AMPK-Mediated Signaling
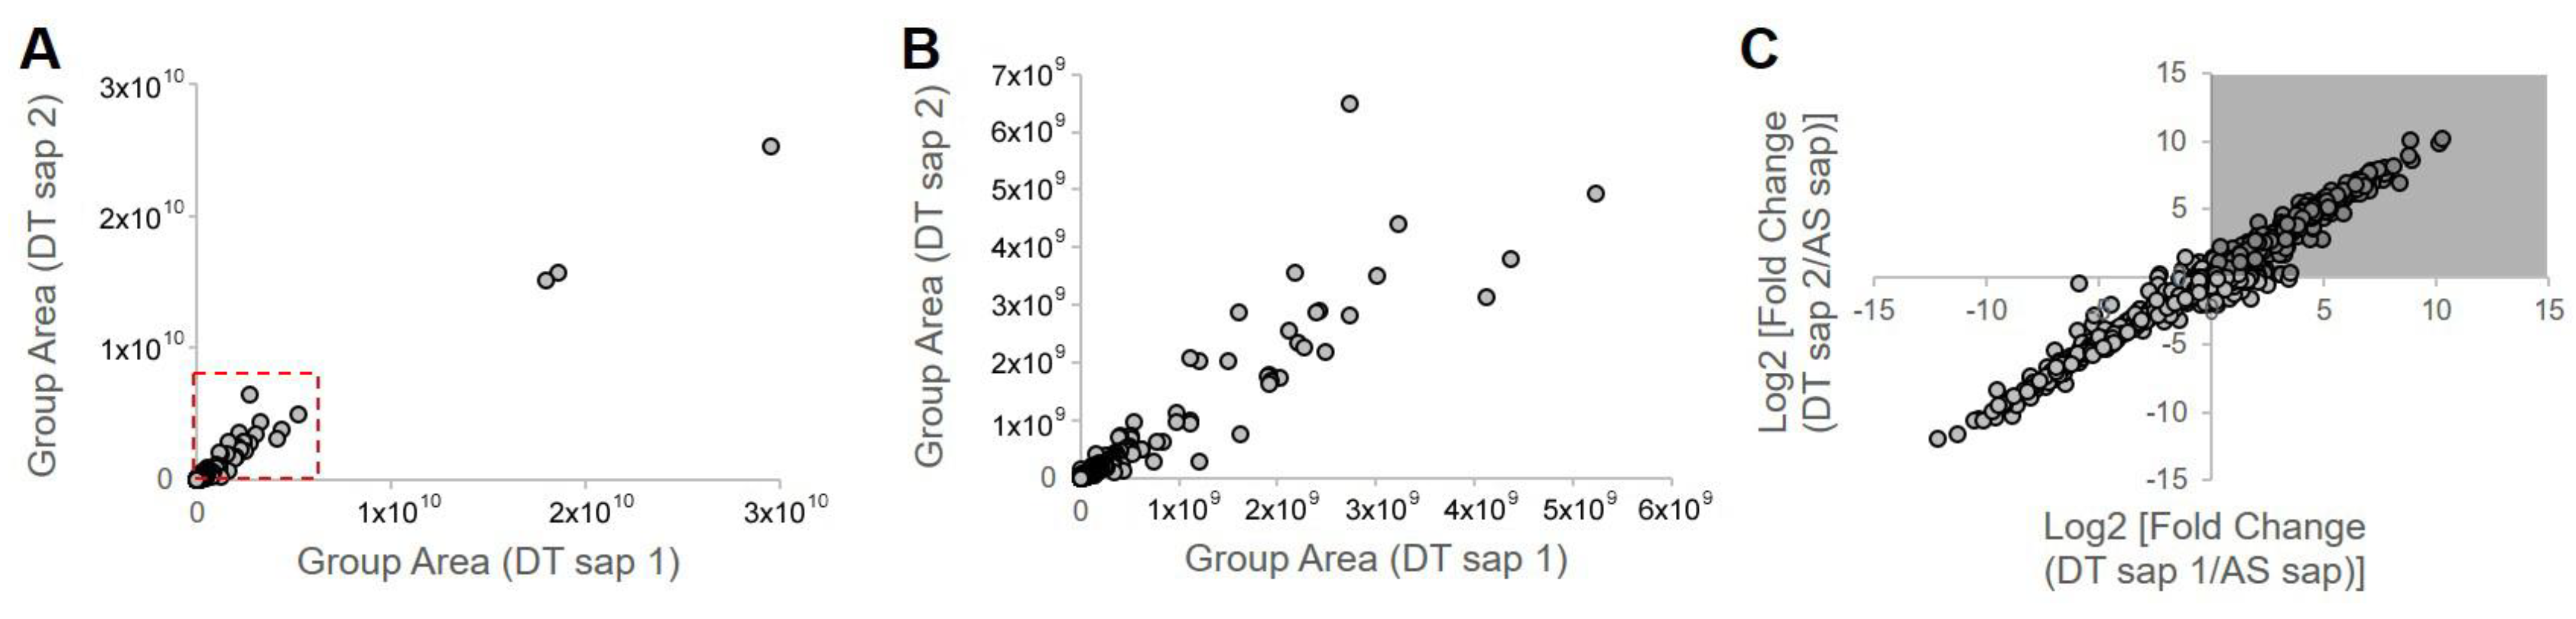
3.5. Component Analysis of Dendropanax trifidus Sap
4. Discussion
5. Conclusions
Supplementary Materials
Author Contributions
Funding
Institutional Review Board Statement
Informed Consent Statement
Data Availability Statement
Acknowledgments
Conflicts of Interest
References
- Li, R.; Wen, J. Phylogeny and Biogeography of Dendropanax (Araliaceae), an Amphi-Pacific Disjunct Genus between Tropical/Subtropical Asia and the Neotropics. Syst. Bot. 2013, 38, 536–551. [Google Scholar] [CrossRef]
- Han, S.H.; Jung, Y.H.; Oh, M.H.; Ko, M.H.; Oh, Y.S.; Koh, S.C.; Kim, M.H.; Oh, M.Y. Phytogenetic relationships of the Dendropanax morbifera and D. trifidus based on PCR-RAPD. Korean J. Genet. 1998, 20, 173–181. [Google Scholar]
- Im, H.T. Plant geographical study for the plant of Cheju. Korean J. Plant Taxon. 1992, 22, 219–234. [Google Scholar] [CrossRef]
- Jeong, B.S.; Jo, J.S.; Pyo, B.S.; Hwang, B. Studies on the distribution of Dendropanax morbifera and component analysis of the golden lacquer. Korean J. Biotechnol. Bioeng. 1995, 10, 393–400. [Google Scholar]
- Oka, K.; Saito, F.; Yasuhara, T.; Sugimoto, A. The major allergen of Dendropanax trifidus Makino. Contact Dermat. 1997, 36, 252–255. [Google Scholar] [CrossRef]
- Moon, M.O.; SIhm, B.S.; Chung, Y.C.; Kang, Y.J. Taxonomic Appraisal of Dendropanax morbifera Leveille and D. trifidus (Thunb. ex Murray) Makino based on Morphological Characters. Korean J. Plant Taxon. 1999, 29, 231–248. [Google Scholar] [CrossRef]
- Lee, H.S.; Jeon, J.I.; Chang, C.S. Foliar flavonoids of two sections of genus dendropanax in China, Japan, and Korea. For. Sci. Technol. 2005, 1, 45–50. [Google Scholar]
- Shin, Y.K. Phylogenetic Analysis of Dendropanax morbifera Using Nuclear Ribosomal DNA Internal Transcribed Spacer (ITS) Region Sequences. J. Life Sci. 2016, 26, 1341–1344. [Google Scholar] [CrossRef] [Green Version]
- Oka, K.; Saito, F.; Yasuhara, T.; Sugimoto, A. The allergens of Dendropanax trifidus Makino and Fatsia japonica Decne. et Planch. and evaluation of cross-reactions with other plants of the Araliaceae family. Contact Dermat. 1999, 40, 209–213. [Google Scholar] [CrossRef]
- Bae, K.H. The Medicinal Plants of Korea; Kyo-Hak Publishing Co., Ltd.: Seoul, Korea, 2000. [Google Scholar]
- Lee, K.B.; Kim, A. Antioxidant, cytotoxic, and antidiabetic activities of Dendropanax morbifera extract for production of health-oriented food materials. Afr. J. Biotechnol. 2019, 18, 124–129. [Google Scholar]
- Chung, I.M.; Kim, S.H.; Kwon, C.; Kim, S.Y.; Yang, Y.J.; Kim, J.S.; Ali, M.; Ahmad, A. New Chemical Constituents from the Bark of Dendropanax morbifera Leveille and their Evaluation of Antioxidant Activities. Molecules 2019, 24, 3967. [Google Scholar] [CrossRef] [Green Version]
- Jung, H.Y.; Chung, T.H.; Hwang, I.K. Dendropanax morbifera Léveille extract ameliorates memory impairments and inflammatory responses in the hippocampus of streptozotocin-induced type 1 diabetic rats. Mol. Cell. Toxicol. 2017, 12, 429–436. [Google Scholar] [CrossRef]
- Park, B.Y.; Min, B.S.; Oh, S.R.; Kim, J.H.; Kim, T.J.; Kim, D.H.; Bae, K.H.; Lee, H.K. Isolation and anticomplement activity of compounds from Dendropanax morbifera. J. Ethnopharmacol. 2004, 90, 403–408. [Google Scholar] [CrossRef]
- Kim, K.; Jung, J.H.; Yoo, H.J.; Hyun, J.K.; Park, J.H.; Na, D.; Yeon, J.H. Anti-Metastatic Effects of Plant Sap-Derived Extracellular Vesicles in a 3D Microfluidic Cancer Metastasis Model. J. Funct. Biomater. 2020, 11, 49. [Google Scholar] [CrossRef]
- Kim, K.; Yoo, H.J.; Jung, J.H.; Lee, R.; Hyun, J.K.; Park, J.H.; Na, D.; Yeon, J.H. Cytotoxic Effects of Plant Sap-Derived Extracellular Vesicles on Various Tumor Cell Types. J. Funct. Biomater. 2020, 11, 22. [Google Scholar] [CrossRef] [Green Version]
- Sakamoto, K.; Holman, G.D. Emerging role for AS160/TBC1D4 and TBC1D1 in the regulation of GLUT4 traffic. Am. J. Physiol. Endocrinol. Metab. 2008, 295, E29–E37. [Google Scholar] [CrossRef]
- Leto, D.; Saltiel, A.R. Regulation of glucose transport by insulin: Traffic control of GLUT4. Nat. Rev. Mol. Cell Biol. 2012, 13, 383–396. [Google Scholar] [CrossRef]
- Herzig, S.; Shaw, R.J. AMPK: Guardian of metabolism and mitochondrial homeostasis. Nat. Rev. Mol. Cell Biol 2018, 19, 121–135. [Google Scholar] [CrossRef] [Green Version]
- Chavez, J.A.; Roach, W.G.; Keller, S.R.; Lane, W.S.; Lienhard, G.E. Inhibition of GLUT4 translocation by Tbc1d1, a Rab GTPase-activating protein abundant in skeletal muscle, is partially relieved by AMP-activated protein kinase activation. J. Biol. Chem. 2008, 283, 9187–9195. [Google Scholar] [CrossRef] [Green Version]
- Lee, A.; Kwon, O.W.; Jung, K.R.; Song, G.J.; Yang, H.J. The effects of Korean red ginseng-derived components on oligodendrocyte lineage cells: Distinct facilitatory roles of the non-saponin and saponin fractions, and Rb1, in proliferation, differentiation and myelination. J. Ginseng Res. 2021. In Press. [Google Scholar] [CrossRef]
- Kim, E.J.; Jang, M.; Choi, J.H.; Park, K.S.; Cho, I.H. An Improved Dehydroepiandrosterone-Induced Rat Model of Polycystic Ovary Syndrome (PCOS): Post-pubertal Improve PCOS’s Features. Front. Endocrinol. 2018, 9, 735. [Google Scholar] [CrossRef]
- Miyajima, M.; Zhang, B.; Sugiura, Y.; Sonomura, K.; Guerrini, M.M.; Tsutsui, Y.; Maruya, M.; Vogelzang, A.; Chamoto, K.; Honda, K.; et al. Metabolic shift induced by systemic activation of T cells in PD-1-deficient mice perturbs brain monoamines and emotional behavior. Nat. Immunol. 2017, 18, 1342–1352. [Google Scholar] [CrossRef]
- Li, Y.; Soos, T.J.; Li, X.; Wu, J.; DeGennaro, M.; Sun, X.; Kittman, D.R.; Birnbaum, M.J.; Polakiewicz, R.D. Protein Kinase C θ Inhibits Insulin Signaling by Phosphorylating IRS1 at Ser1101. J. Biol. Chem. 2004, 279, 45304–45307. [Google Scholar] [CrossRef] [Green Version]
- Viana, A.Y.; Sakoda, H.; Anai, M.; Fujishiro, M.; Ono, H.; Kushiyama, A.; Fukushima, Y.; Sato, Y.; Oshida, Y.; Uchijima, Y.; et al. Role of hepatic AMPK activation in glucose metabolism and dexamethasone-induced regulation of AMPK expression. Diabetes Res. Clin. Pract. 2006, 73, 135–142. [Google Scholar] [CrossRef]
- Ley, E.J.; Singer, M.B.; Clond, M.A.; Johnson, T.; Bukur, M.; Chung, R.; Margulies, D.R.; Salim, A. Long-term effect of trauma splenectomy on blood glucose. J. Surg. Res. 2012, 177, 152–156. [Google Scholar] [CrossRef] [PubMed]
- de Souza, T.A.; de Souza, D.W.; Siqueira, B.S.; Rentz, T.; de Oliveria Emilio, H.R.; Grassiolli, S. Splenic participation in glycemic homeostasis in obese and non-obese male rats. Obes. Res. Clin. Pract. 2020, 14, 479–486. [Google Scholar] [CrossRef]
- Olson, A.L.; Pessin, J.E. Structure, function, and regulation of the mammalian facilitative glucose transporter gene family. Annu. Rev. Nutr. 1996, 16, 235–256. [Google Scholar] [CrossRef] [PubMed]
- Boucher, J.; Kleinridders, A.; Kahn, C.R. Insulin receptor signaling in normal and insulin-resistant states. Cold Spring Harb. Perspect. Biol. 2014, 6, a009191. [Google Scholar] [CrossRef] [Green Version]
- Li, J.; Zhong, L.; Wang, F.; Zhu, H. Dissecting the role of AMP-activated protein kinase in human diseases. Acta Pharm. Sin. B 2017, 7, 249–259. [Google Scholar] [CrossRef] [PubMed]
- Kim, J.Y.; Jo, K.J.; Kim, O.S.; Kim, B.J.; Kang, D.W.; Lee, K.H.; Baik, H.W.; Han, M.S.; Lee, S.K. Parenteral 17beta-estradiol decreases fasting blood glucose levels in non-obese mice with short-term ovariectomy. Life Sci. 2010, 87, 358–366. [Google Scholar] [CrossRef] [PubMed]
- Li, Y.; Huang, J.; Yan, Y.; Liang, J.; Liang, Q.; Lu, Y.; Zhao, L.; Li, H. Preventative effects of resveratrol and estradiol on streptozotocin-induced diabetes in ovariectomized mice and the related mechanisms. PLoS ONE 2018, 13, e0204499. [Google Scholar] [CrossRef] [Green Version]
- D’Eon, T.M.; Rogers, N.H.; Stancheva, Z.S.; Greenberg, A.S. Estradiol and the estradiol metabolite, 2-hydroxyestradiol, activate AMP-activated protein kinase in C2C12 myotubes. Obesity 2008, 16, 1284–1288. [Google Scholar] [CrossRef]
- Tofovic, S.P.; Dubey, R.K.; Jackson, E.K. 2-Hydroxyestradiol attenuates the development of obesity, the metabolic syndrome, and vascular and renal dysfunction in obese ZSF1 rats. J. Pharmacol. Exp. Ther. 2001, 299, 973–977. [Google Scholar]
- Geddo, F.; Scandiffio, R.; Antoniotti, S.; Cottone, E.; Querio, G.; Maffei, M.E.; Bovolin, P.; Gallo, M.P. PipeNig((R))-FL, a Fluid Extract of Black Pepper (Piper Nigrum L.) with a High Standardized Content of Trans-beta-Caryophyllene, Reduces Lipid Accumulation in 3T3-L1 Preadipocytes and Improves Glucose Uptake in C2C12 Myotubes. Nutrients 2019, 11, 2788. [Google Scholar] [CrossRef] [Green Version]
- Calzada, F.; Valdes, M.; Garcia-Hernandez, N.; Velazquez, C.; Barbosa, E.; Bustos-Brito, C.; Quijano, L.; Pina-Jimenez, E.; Mendieta-Wejebe, J.E. Antihyperglycemic activity of the leaves from annona diversifolia Safford. and farnesol on normal and alloxan-induced diabetic mice. Phcog. Mag. 2019, 15, 5–11. [Google Scholar]
- Belury, M.A.; Mahon, A.; Banni, S. The conjugated linoleic acid (CLA) isomer, t10c12-CLA, is inversely associated with changes in body weight and serum leptin in subjects with type 2 diabetes mellitus. J. Nutr. 2003, 133, 257S–260S. [Google Scholar] [CrossRef] [Green Version]


| Molecular Formula | Suggested Compound | Synonyms (Pubchem) | Suggested Structure (Pubchem) | Annotation | MS/MS (Database Search Score) | Molecular Weight | Retention Time (min) | Max. Area (Arbitrary Unit, 1.0 × 10⁸) | Mean Group Area (Arbitrary Unit, 1.0 × 10⁸) | Mean [Log2 Fold Change (DT Sap/AS Sap)] | |
|---|---|---|---|---|---|---|---|---|---|---|---|
| Full | Partial | ||||||||||
| C15H24 | (1E,5E,9E)-1,5,9-Trimethyl-1,5,9-cyclododecatriene | 1,5,9-Trimethyl cyclododecatriene |  | 2 | 3 | 94.8 * | 204.19 | 21.962 | 260.7 | 274.2 | 8.79 |
| C15H24O | Caryophyllene oxide | (-)-Caryophyllene oxide; beta-Caryophyllene oxide |  | 3 | 3 | 93.6 | 220.18 | 22.201 | 136.9 | 171.4 | 6.51 |
| C15H22 | Curcumene | Alpha-Curcumene; 2-Methyl-6-p-tolyl-2-heptene |  | 2 | 2 | 96.2 * | 202.17 | 21.832 | 130.7 | 165.2 | 5.69 |
| C15H22O2 | 3,5-di-tert-butyl-4-hydroxybenzaldehyde | 3,5-Di-t-butyl-4-hydroxybenzaldehyde |  | 2 | 3 | 85 * | 234.16 | 20.281 | 63.91 | 50.75 | 3.59 |
| C15H24O2 | Capsidiol | (1R,3R,4S,4aR,6R)-6-Isopropenyl-4,4a-dimethyl-1,2,3,4,4a,5,6,7-octahydro-1,3-naphthalenediol |  | 2 | 2 | 87.4 * | 236.18 | 21.501 | 51.11 | 40.85 | 6.98 |
| C18H24O2 | 19-Norandrostenedione | Estr-4-ene-3,17-dione; 19-Norandrost-4-ene-3,17-dione; Norandrostenedione |  | 4 | 2 | 87.2 | 272.18 | 22.014 | 36.15 | 38.09 | 6.44 |
| Estradiol | beta-Estradiol; 17beta-Estradiol |  | |||||||||
| C22H42O8 | Bis [2-(2-butoxyethoxy)ethyl] adipate | Dibutoxyethoxyethyl adipate |  | 2 | 1 | 68.8 * | 434.29 | 21.792 | 36.42 | 36.30 | 1.49 |
| C18H22O2 | Trenbolone | 17beta-Trenbolone; Trienbolone; 17-beta-Hydroxyestra-4,9,11-trien-3-one |  | 3 | 3 | 84.1 | 270.16 | 21.313 | 39.92 | 28.62 | 6.43 |
| C14H22O | o-tert-Octylphenol | t-octylphenol; 2-(2,4,4-trimethylpentan-2-yl)phenol |  | 2 | 1 | 80.6 * | 206.17 | 21.866 | 31.28 | 27.76 | 7.79 |
| C14H18 | 5-Ethyl-3,8-dimethyl-1,7-dihydroazulene | 5-Ethyl-3,8-dimethyl-1,7-dihydroazulene |  | 2 | 0 | 83.8 * | 186.14 | 21.163 | 29.03 | 26.66 | 6.87 |
| C15H26O | Farnesol | trans,trans-Farnesol; (2E,6E)-Farnesol; (E,E)-Farnesol |  | 2 | 2 | 88.3 * | 222.20 | 22.165 | 25.87 | 22.67 | 10.23 |
| C17H27N | Gamfexine | 3-cyclohexyl-N,N-dimethyl-3-phenylpropan-1-amine |  | 2 | 0 | 64.1 * | 245.21 | 22.155 | 19.50 | 23.41 | 9.99 |
| C17H28O2 | (8Z,11Z,14Z)-heptadecatrienoic acid | Norlinolenic acid |  | 2 | 1 | 86.3 * | 264.21 | 20.475 | 12.91 | 10.55 | 8.88 |
| C9 H12 | Cumene | Isopropylbenzene; 2-Phenylpropane |  | 2 | 2 | 94.8 * | 120.09 | 21.986 | 21.04 | 18.09 | 7.66 |
| C18H30O2 | α-Eleostearic acid | alpha-eleostearic acid; Margarolic acid |  | 2 | 3 | 92.8 | 278.22 | 22.430 | 1.716 | 1.519 | 7.46 |
| C30 H48 O2 | oleanolic aldehyde | 3beta-hydroxyolean-12-en-28-al |  | 3 | 1 | 88.6 * | 440.36 | 23.402 | 0.7476 | 0.5755 | 7.36 |
| C17H28O | 2,6-Dimethyl-4-nonylphenol | Phenol, 2,6-dimethyl-4-nonyl- |  | 2 | 1 | 91.6 * | 248.21 | 21.662 | 2.387 | 2.331 | 7.27 |
| C17H29NO | 2,6-Di-tert-butyl-4-(dimethylaminomethyl)phenol | N,N-dimethyl-3,5-di-tert-butyl-4-hydroxybenzylamine |  | 2 | 0 | 78.7 * | 263.22 | 21.865 | 4.091 | 3.238 | 7.20 |
| C18H24O3 | 2-Hydroxyestradiol | 2-OH-Estradiol; 2-hydroxy-estradiol; Estra-1,3,5(10)-triene-2,3,17beta-triol |  | 2 | 2 | 81.6 * | 288.17 | 21.268 | 22.30 | 17.78 | 4.08 |
| C20H25NO2 | Dienogest | Dienogestrel; Dinagest; Endometrion |  | 3 | 0 | 63.1 | 311.19 | 21.276 | 22.67 | 16.19 | 6.85 |
| C20H28O2 | Isotretinoin | 13-cis-Retinoic acid; 3-cis-Vitamin A acid; Accutane |  | 4 | 3 | 81.2 | 300.21 | 22.691 | 7.111 | 5.430 | 0.99 |
| C18H32O2 | Linoleic acid | Linolic acid; Telfairic acid; cis,cis-Linoleic acid |  | 4 | 0 | 94.7 * | 280.24 | 21.686 | 3.033 | 2.935 | 6.45 |
| C15H20O2 | Costunolide | (+)-costunolide; Costunlide; Costus lactone |  | 2 | 2 | 94.8 * | 232.16 | 21.149 | 5.355 | 2.636 | 4.68 |
Publisher’s Note: MDPI stays neutral with regard to jurisdictional claims in published maps and institutional affiliations. |
© 2021 by the authors. Licensee MDPI, Basel, Switzerland. This article is an open access article distributed under the terms and conditions of the Creative Commons Attribution (CC BY) license (https://creativecommons.org/licenses/by/4.0/).
Share and Cite
Lee, A.; Sugiura, Y.; Cho, I.-H.; Setou, N.; Koh, E.; Song, G.J.; Lee, S.; Yang, H.-J. In Vivo Hypoglycemic Effects, Potential Mechanisms and LC-MS/MS Analysis of Dendropanax Trifidus Sap Extract. Nutrients 2021, 13, 4332. https://0-doi-org.brum.beds.ac.uk/10.3390/nu13124332
Lee A, Sugiura Y, Cho I-H, Setou N, Koh E, Song GJ, Lee S, Yang H-J. In Vivo Hypoglycemic Effects, Potential Mechanisms and LC-MS/MS Analysis of Dendropanax Trifidus Sap Extract. Nutrients. 2021; 13(12):4332. https://0-doi-org.brum.beds.ac.uk/10.3390/nu13124332
Chicago/Turabian StyleLee, Ahreum, Yuki Sugiura, Ik-Hyun Cho, Noriko Setou, Eugene Koh, Gyun Jee Song, Seungheun Lee, and Hyun-Jeong Yang. 2021. "In Vivo Hypoglycemic Effects, Potential Mechanisms and LC-MS/MS Analysis of Dendropanax Trifidus Sap Extract" Nutrients 13, no. 12: 4332. https://0-doi-org.brum.beds.ac.uk/10.3390/nu13124332