Article

The Effect of Obesity Class on the Energetics and Mechanics of Walking

by
Julia Primavesi
1,
Aitor Fernández Menéndez
1,
Didier Hans
2,
Lucie Favre
3,
Fabienne Crettaz von Roten
1 and
Davide Malatesta
1,*
1
Institute of Sport Sciences of the University of Lausanne (ISSUL), University of Lausanne, Bâtiment Synathlon, 1015 Lausanne, Switzerland
2
Center for Bone Diseases, Lausanne University Hospital, 1011 Lausanne, Switzerland
3
Lausanne University Hospital (CHUV), Consultation de Prévention et Traitement de L’obésité, 1011 Lausanne, Switzerland
*
Author to whom correspondence should be addressed.
Submission received: 26 October 2021 / Revised: 9 December 2021 / Accepted: 16 December 2021 / Published: 18 December 2021

Abstract

:
Higher mass-normalized net energy cost of walking (NetCw/kg) and mechanical pendular recovery are observed in obese compared to lean adults. This study aimed to investigate the effect of different classes of obesity on the energetics and mechanics of walking and to explore the relationships between body mass, NetCw/kg and gait mechanics by using principal component analysis (PCA). NetCw/kg and gait mechanics were computed in severely obese (SOG; n = 18, BMI = 40.1 ± 4.4 kg·m−2), moderately obese (MOG; n = 17, BMI = 32.2 ± 1.5 kg·m−2) and normal-weight (NWG; n = 13, BMI = 22.0 ± 1.5 kg·m−2) adults during five walking trials (0.56, 0.83, 1.11, 1.39, 1.67 m·s−1) on an instrumented treadmill. NetCw/kg was significantly higher in SOG compared to NWG (p = 0.019), with no significant difference between SOG and MOG (p = 0.14), nor between MOG and NWG (p = 0.27). Recovery was significantly higher in SOG than in NWG (p = 0.028), with no significant difference between SOG and MOG (p = 0.13), nor between MOG and NWG (p = 0.35). PCA models explained between 17.0% and 44.2% of the data variance. This study showed that: (1) obesity class influences the gait energetics and mechanics; (2) PCA was able to identify two components, showing that the obesity class is associated with lower walking efficiency and better pendulum-like characteristics.

1. Introduction

In recent decades, the prevalence of obesity has continued to increase across the world [1], representing a considerable global public health issue [2]. Obesity is defined as an excessive or abnormal fat accumulation, presenting health risks related to multiple chronic conditions [2]. Excess body weight can be assessed by the body mass index (BMI), defined as the ratio between body mass (kg) and the squared height (m2). The World Health Organization (WHO) categorizes obesity and the associated health risks into class I (30.0 ≤ BMI ≤ 34.9 kg·m−2), II (35.0 ≤ BMI ≤ 39.9 kg·m−2), and III (BMI ≥ 40.0 kg·m−2) [2].
Physical activity can be an effective strategy to prevent or minimize weight gain in adults [3] and obesity-related comorbidities [4]. Walking is a common, accessible, and relatively safe type of physical activity [5,6], and is recommended for individuals with obesity to prevent obesity-related comorbidities [4]. However, these individuals walk less compared to their lean counterparts [7], partly due to the greater net energy cost of walking (i.e., the energy expenditure per unit of distance above resting energy expenditure) [8,9,10]. Meeting walking recommendations may therefore be particularly challenging for individuals with obesity. Nevertheless, this lower economy can be improved by training [11]. Understanding how obesity influences the energetics of walking is therefore crucial to prescribe adequate physical activity in weight management programs aimed at improving the health of this population.
Several investigators have found that net energy cost of walking is higher in individuals with obesity compared with their leaner counterparts in absolute (J·m−1; NetCw) and relative (J·kg−1·m−1; NetCw/kg) values at predetermined walking speeds [8,9,10,12,13]. This lower economy has been attributed to several factors affecting the gait pattern, including increased body mass [9], decreased body stability [14], greater step width [15,16], and wider lateral limb swing [16]. However, the cumulative effect of these factors should have resulted in a higher NetCw/kg (+80%) [9] than that actually assessed (+10–20%) which may be explained by an improved recovery of mechanical energy during walking (Recovery) [12,13]. In analogy to an inverted pendulum, at each step, the forward kinetic energy (Ek) and the potential energy (Ep) of the center of mass (COM) are transferred (some Ek is converted into Ep and vice versa), reducing the external mechanical work performed (the work done by locomotory muscles to lift and accelerate the COM relative to the surroundings; Wext) and the associated energy expenditure during walking [17].
Recently, Fernandez-Mendez et al. [13] reported a lower walking economy in individuals with class III obesity compared with their lean counterparts. Furthermore, this class seems to have a better-defined influence on NetCw/kg (+19% averaged across all walking speeds) than class I (+8.5%), because individuals with class I obesity showed only a tendency toward a greater NetCw/kg when compared with their lean counterparts [12]. The higher NetCw/kg in individuals with class III obesity was still lower than theoretically expected (+80%) [9] and obtained with higher pendular recovery (+9.5%) along with a lower relative Wext (Wext/kg; J·kg−1·m−1) at all experimental walking speeds (0.56–1.67 m·s−1) [13], whereas individuals with class I obesity mitigated this increase with an improved Recovery (+7%) and lower Wext/kg, but only at fast speeds (>1.1 m·s−1) [12]. The higher NetCw and Recovery in individuals with class III obesity seems to suggest that the obesity level may be involved in the increased NetCw/kg, as well as in pendular exchange optimization. However, it seems that this profitable mechanism runs up to a functional body mass threshold beyond which the increase in NetCw cannot be completely—or at least partially—be compensated by pendular transduction [18], as demonstrated by load-carrying studies. Indeed, the Luo and Kikuyu women (i.e., ethnic groups of East Africa), who are daily accustomed to carrying loads, could carry loads up to 20% of their body mass with no apparent increase in NetCw/kg and with a decrease in Wext/kg, along with a more skillful Recovery. However, for loads beyond 30% of their body mass, the results showed an increase in NetCw/kg and a tendency to maintain a constant Wext/kg, even though Recovery remained improved [18]. This “dissociation” between NetCw and Wext/Recovery may be due to (i) a decrease in muscular efficiency, (ii) an increase in the isometric contractions required to support the load and maintain posture, or (iii) the inadequate/inappropriate muscle strength necessary to carry these loads beyond this amount [18]. If we consider obesity as an added mass walking [19], these data suggest that, in individuals with different classes of obesity, a threshold may occur beyond which the greater NetCw cannot completely be mitigated by a more skillful pendular recovery. Altogether, these results highlight a relationship between the level of obesity and the energetics and mechanics of walking. However, to the best of our knowledge, thus far, no studies have investigated this relationship.
Moreover, the NetCw has many predictors which are time-dependent and often correlated with each other [20]. For these reasons, data reduction is critical in gait analysis [20], and principal component analysis (PCA) can be particularly useful to reduce data dimensionality with maximally preserving data variance [21]. However, PCA, including anthropometric, energetic, and mechanical walking parameters, has not yet been used in individuals with different classes of obesity.
Therefore, the first aim of the study was to investigate the effect of different obesity levels on the energetics and mechanics of walking in individuals with class II–III (severely obese group; SOG) and class I (moderately obese group; MOG) obesity, and normal-weight adults (normal-weight group; NWG) while walking at different speeds. It was hypothesized that NetCw/kg would be higher in SOG than MOG and NWG and this extra cost would be associated with a lower Wext/kg along with greater Recovery in SOG than NWG and MOG. On the other hand, NetCw/kg would be non-significantly higher in MOG than NWG and it would be associated with a lower Wext/kg along with greater Recovery only at fast walking speeds in the former compared with the latter group.
The second aim was to explore the relationships between body mass, NetCw and gait mechanics at different walking speeds by using PCA in order to identify any specific data patterns.

2. Materials and Methods

2.1. Participants

Thirty-five sedentary (no participation in any regular exercise or ≤2 h of physical activity per week over the past year) adults with obesity and thirteen normal-weight adults took part in this study. The median BMI of the participants with obesity (median = 35.1) was used to divide them into SOG (BMI = 40.1 ± 4.4 kg·m−2; n = 18, 3 men and 7 women: class II; 1 man and 7 women: class III) and MOG (BMI = 32.2 ± 1.5 kg·m−2; n = 17, 2 men and 15 women; class I: n = 17), respectively. An NWG (BMI = 22.0 ± 1.5 kg·m−2; n = 13, 5 men and 8 women) was also included. All subjects were in good health and were free of musculoskeletal disorders or other conditions that could affect the gait pattern. This study used pooled data of two previously published studies of our research group [12,13]. The studies were approved by the local ethics committee (CER-VD 136/14—CER-VD 2016-01715). Informed consent was obtained from all subjects involved in the study.

2.2. Experimental Design

Prior to testing, anthropometrical characteristics and body composition were assessed in individuals with obesity through a dual energy X-ray absorptiometric scan (Lunar iDXA; GE Healthcare, Chicago, IL, USA). Subsequently, all study participants visited the laboratory once to perform (1) a 10 min treadmill familiarization session [22] and (2) five 5 min level walking trials at five different and equally spaced speeds (0.56, 0.83, 1.11, 1.39, 1.67 m·s−1) on an instrumented single-belt treadmill (T10-FMT-MED, Arsalis, Belgium). The order of the speeds was determined randomly. A minimum of a 5 min resting period between each walking trial was carried out. Metabolic and mechanical data (10 strides) were collected for each walking speed.

2.3. Assessment

2.3.1. Anthropometry and Body Composition

Standing height was measured using a Harpenden Stadiometer. Body mass was measured to the nearest 0.1 kg using a precision digital scale with the subject wearing shorts and a T-shirt. Total and regional masses for each body segment (i.e., trunk, upper and lower limbs) as well as body composition (i.e., lean and fat mass) were assessed in obese subjects through a dual-energy X-ray absorptiometric scan.

2.3.2. Energetics

Standing Metabolic Rate

Prior to each trial, the metabolic cart (Oxycon Pro, Jaeger, Germany [12]—Quark CPET, CosmedTM®, Italy [13]) was calibrated according to the manufacturer’s recommendations (volume and gas calibration). Afterwards, a 5 min breath-by-breath gas exchange [minute ventilation ( V ˙ E ), oxygen uptake ( V ˙ O 2 ) and CO2 output ( V ˙ CO 2 )] was collected in a standing position and the last minute was averaged to determine the standing metabolic rate (SMR) of each participant.
The two metabolic cards used provide gas exchange measurements that are similar, reliable, and valid relative to each other [23].

Net Energy Cost of Walking

The gas exchange was measured breath-by-breath during walking trials. Steady states for V ˙ O 2 and V ˙ CO 2 were reached during the last minute of the 5 min walking trial, with a respiratory exchange ratio (RER) lower than 1 for each walking speed. Errant breaths caused by coughing or swallowing were discarded when V ˙ O 2 values were higher than 3 standard deviations (3SDs) from the local mean. Subsequently, V ˙ O 2 (mL·min−1) data from the last minute of each walking trial and SMR were averaged. The energy equivalent of 1 L of O2 was then used to compute the gross metabolic rate (W) [24]. The net metabolic rate was calculated by subtracting SMR from the gross metabolic rate and subsequently divided by the corresponding walking speed to obtain the absolute NetCw (J·m−1); the relative was obtained by dividing this latter by the body mass (NetCw/kg; J·kg−1·m−1).

2.3.3. Mechanics

Spatiotemporal Parameters

For each walking trial, step length (i.e., the distance between the initial contact of one foot and the initial contact of the opposite one; m) and frequency (number of steps per second; Hz) were assessed during twenty consecutive steps in the last minute of each walking trial using the instrumented treadmill (sampling rate: 1000 Hz).

Mechanical Works and Potential Kinetic Energy Transduction

The mechanical energy fluctuations of the COM in the 3 axes were computed from the vertical (Fv), forward (Ff) and lateral (Fl) components of the ground reaction forces (GRFs) for the 20 steps selected. These components, along with the body mass of each subject, were used to calculate the 3D accelerations of the COM following the method described previously by Massaad et al. [25] The beginning and the end of a step were defined as the instant when Ff was equal to zero [12]. Consequently, a primary mathematical integration of these accelerations was applied to obtain the velocities of the COM in vertical, forward and lateral directions (i.e., Vv, Vf and Vl, respectively). A second mathematical integration of Vv and Vl was applied to assess the COMv and COMl. To guarantee step consistency, only steps were selected in which the sum of the increments of the three components did not differ by more than 25% from the sum of decrements [25]. Instantaneous vertical, forward and lateral kinetic energies (i.e., Ekv, Ekf, and Ekl) of the COM were then calculated and used to assess the instantaneous Ek of the COM (Equation (1)).
Ek = Ekv + Ekf + Ekl = 0.5·m·(V2v + V2f + V2l)
where m is the body mass.
Using the vertical position of COM (h), m and gravity constant (g = 9.81 m·s−2), instantaneous Ep of the COM was calculated (Equation (2)).
Ep = m·g·h
Subsequently, the instantaneous total mechanical energy (Etot) of the COM was computed as the sum of the instantaneous Ek and Ep (Equation (3)).
Etot = Ek + Ep = Ekv + Ekf + Ekl + Ep
The amount of the external mechanical work done per step was defined as the sum of the positive increments in Etot. Throughout this study, the external mechanical work is expressed in absolute (J·m−1; Wext) and relative (J·kg−1·m−1; Wext/kg) terms.
Then, the amount of mechanical energy saved via the pendular energy transduction was assessed by Recovery (Equation (4)).
Recovery   ( % ) = W k + W p + W ext W k + W p   ×   100
where W k and W p represent the sum of the increments in the Ek and Ep curves, respectively.
The phase shift between the Ek and Ep curves was computed by determining α (i.e., the time difference between the maximum Ek and the minimum Ep), as previously described by Cavagna et al. [26] (Equation (5)).
α = 360° (tpk+·τ−1)
where τ represents the step period, tpk+ indicates the difference between the period at which Ek and Ep increase simultaneously (i.e., when the COM starts the upward displacement and concludes the forward acceleration; Wext is performed). Given this definition of α, if Ek and Ep curves are 180° out of phase, α would be equal to 0° [26]. The difference in amplitude between the above curves was assessed by the Wk:Wp−1 ratio.

2.3.4. Net Locomotor Efficiency

Net locomotor efficiency (NetE) was computed as the ratio of the Wext to NetCw and expressed as a percentage for each walking speed [12].

2.4. Statistical Analysis

Descriptive statistics (mean ± SD) were performed to characterize the sample. Chi-squared tests (precisely, Fisher’s exact test for small numbers) were used for testing sex differences among groups. A one-way ANOVA with Tukey correction was applied to test the difference between groups concerning a first set of the participant’s characteristics (age, height, BMI, total and regional masses, and SMRs). Data normality and homogeneity of variances were assessed by using Shapiro–Wilk’s and Leven’s tests, respectively. If the normality assumption was violated, non-parametric tests were employed. Independent-sample t-tests were performed to test the differences in a few experimental variables between SOG and MOG.
Linear mixed models (LMMs) were used to determine differences in energetics and mechanics between groups while walking at different speeds (0.56, 0.83, 1.11, 1.39, and 1.67 m·s−1). A random subject effect was introduced in the models (i.e., intercept|Subject) to account for repeated measures for each subject. Fixed effects were added (group and speed with all the interactions of these factors). Holm correction was applied to identify where statistical differences (Group; Speed × Group) occurred. The main effects of speed are omitted in the presentation of results, because it is well accepted that it affects metabolic and mechanics observations [27]. Before these LMM analyses, to exclude an order effect of walking speeds, we included the sequence of the speeds (fixed effect) as an addition to the model. There was no significant order effect for all energetic and mechanical variables.
Theses analyses were performed with Jamovi software, version 1.6.14.0, and R software 4.1.1, with a level of significance set at p ≤ 0.05.
Based on sample size (between 5 and 10 subjects for each item) [28] and relevance, six variables were chosen for PCA. PCA was applied to reduce the data dimensionality of the original, correlated variables, while preserving the maximal data variation [21] at five walking speeds; the sixth was discarded because a few participants with severe obesity (n = 6) were not able to complete the 5 min walking trial at 1.67 m·s−1. The analysis process comprised various steps (calculation of the correlation matrix, extraction and rotation of the initial components, and interpretation of the component’s loadings). Kaiser–Meyer–Olkin (KMO) and Barlett’s tests were performed to confirm the suitability for PCA. Only PCs that explained ≥70% of the data variance were retained [29]. Loadings with a contribution <0.5 and/or that were presented in more than one PC were removed from the interpretation [30]; the others were retained and contributed to the definition of the component name. For each walking speed, the individual value on a given PC (explained variance ≥70%) was computed (PC scores). A series of one-way ANOVAs with Tukey or Games–Howell correction were then performed on these scores. Data normality and homogeneity of variance were tested by using Shapiro–Wilk’s and Levene’s tests, respectively; if assumptions were violated, non-parametric analysis and Welch’s tests were used. This procedure was performed with SPSS software, version 25, with a level of significance set at p ≤ 0.05.

3. Results

3.1. Participant’s Characteristics

The participant’s characteristics are presented in Table 1.
Sex was not significantly different among groups (p < 0.22). Age was significantly higher in SOG compared to NWG and MOG (p < 0.001 for both), with no significant difference between MOG and NWG (p = 0.15). Height was significantly lower in SOG compared to NWG and MOG (p < 0.001 for both), with no significant difference between MOG and NWG (p = 0.49). BMI and body mass were significantly higher in SOG compared to NWG and MOG (p < 0.001 for both) and in MOG compared to NWG (p < 0.001). Lean and fat body masses (kg and %) were significantly higher in SOG compared to MOG (p = 0.017 and p < 0.001, respectively). Head and trunk, upper limb, and lower limb masses were significantly higher in SOG than in MOG (p < 0.001, p < 0.001 and p = 0.037, respectively). Lower limb lean and fat masses (kg and %) were not significantly different between these groups (p = 0.30, p = 0.16 and p = 0.60, respectively).

3.2. Energetics

3.2.1. Standing Metabolic Rates

The standing metabolic rates of the participants are presented in Table 1.
The SMR was significantly higher in SOG compared to NWG and MOG (p = 0.008 and p = 0.006, respectively), with no significant difference between MOG and NWG (p = 1.0).
The SMR/kg was significantly lower in SOG compared to NWG (p < 0.001) and between MOG and NWG (p < 0.001), with no significant difference between SOG and MOG (p = 0.83).

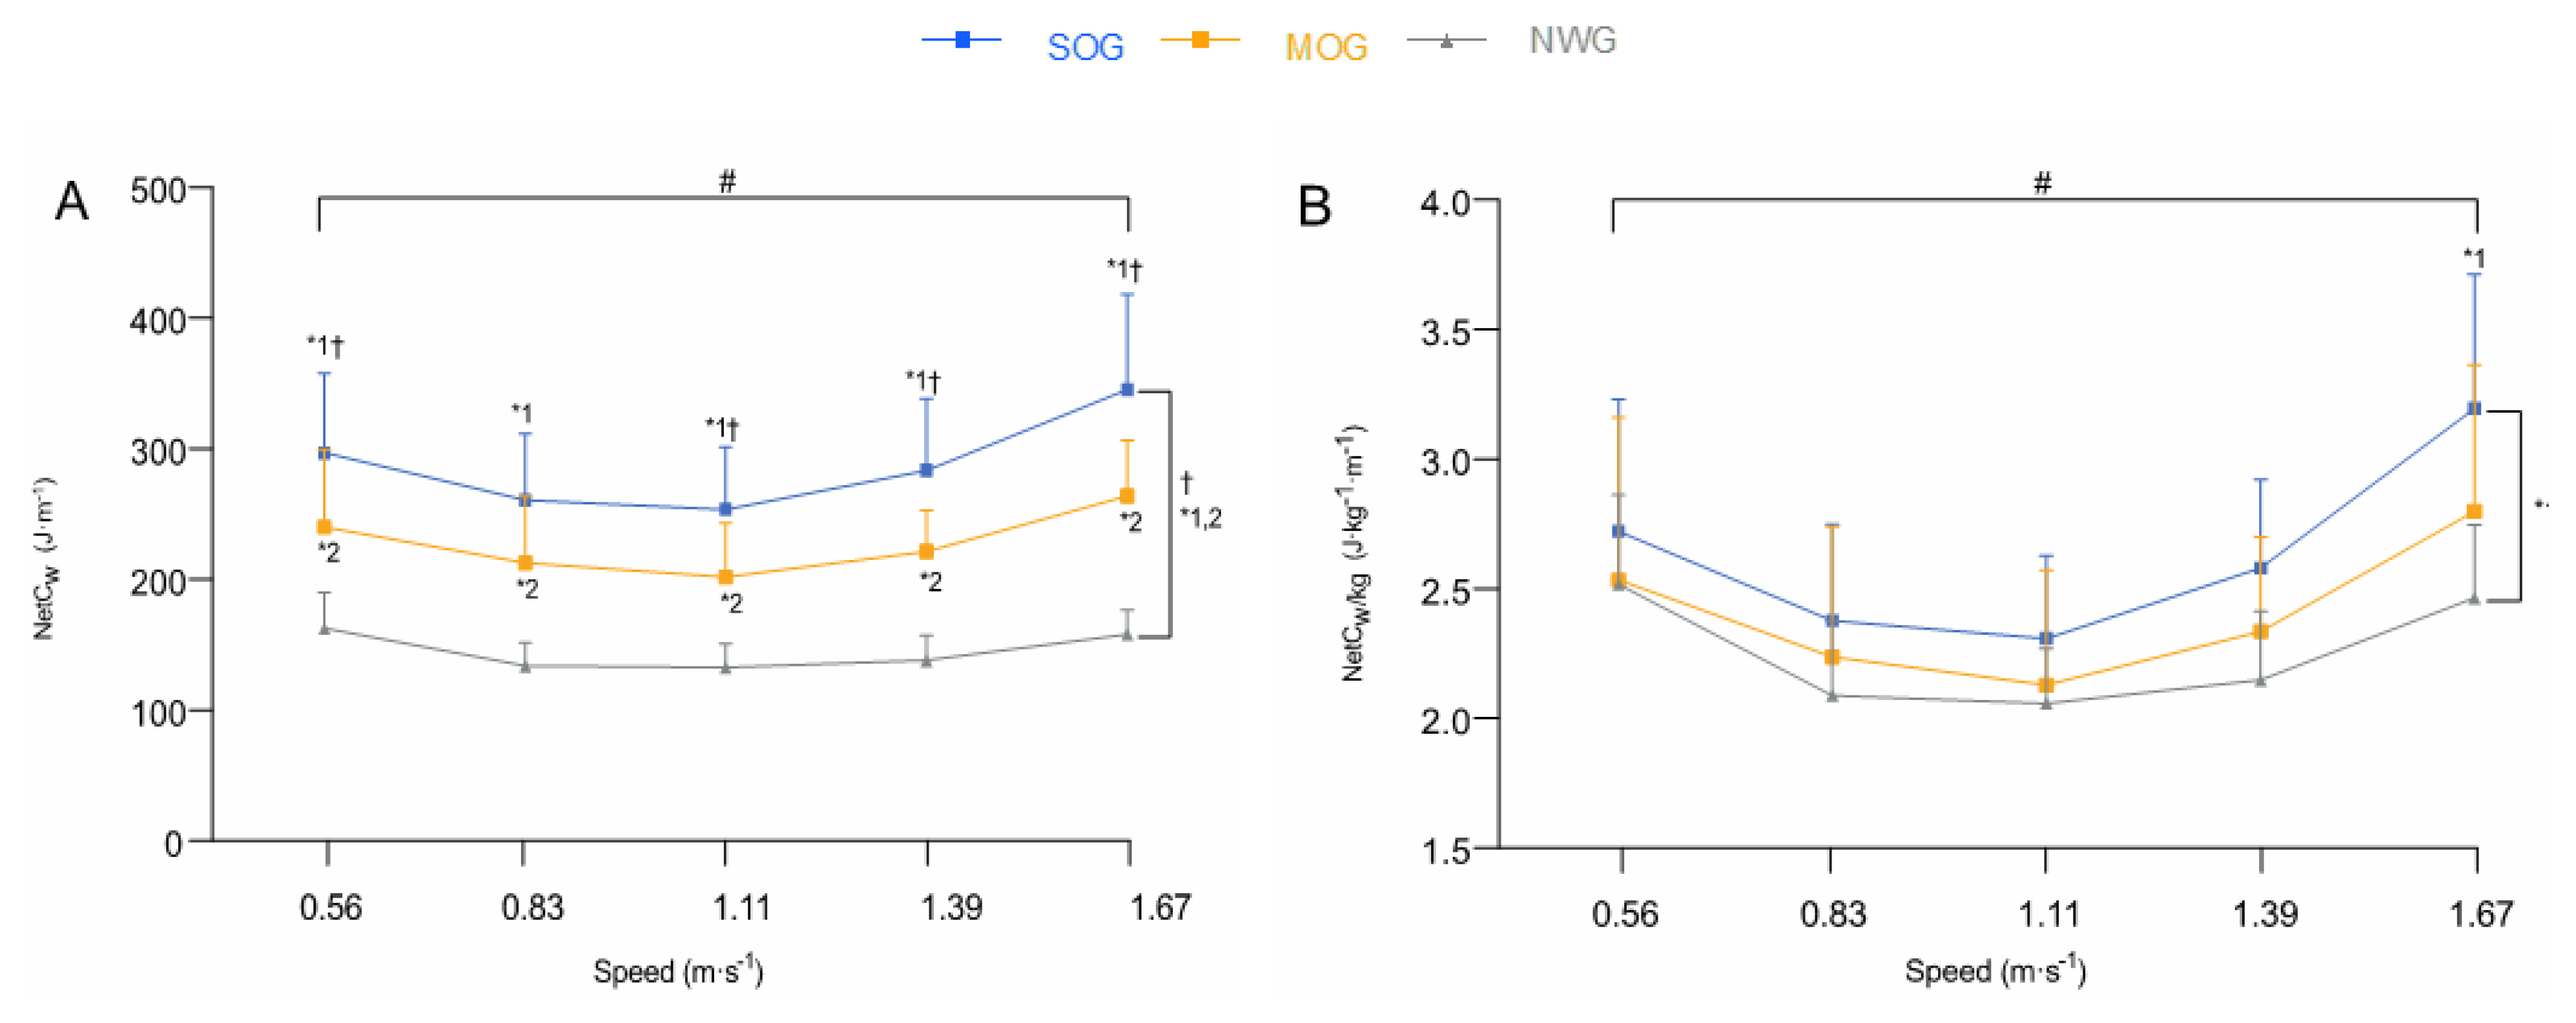
3.2.2. Net Energy Cost of Walking

The NetCw was significantly higher in SOG than in MOG and NWG (p < 0.001 for both) and in MOG than NWG (p < 0.001). There was a significant interaction effect (p < 0.001). The NetCw was significantly higher in SOG compared to MOG at all walking speeds, except at 0.83 m·s−1 (p = 1.0) (Figure 1A).
The NetCw/kg was significantly higher in SOG compared to NWG (p = 0.019), with no significant difference between the former and MOG (p = 0.14), nor between MOG and NWG (p = 0.27). There was a significant interaction effect (p = 0.006). The NetCw/kg was significantly higher in SOG than in NWG at the fastest speed (1.67 m·s−1) (p = 0.019) (Figure 1B).

3.3. Mechanics

3.3.1. Spatiotemporal Parameters and Vertical and Lateral Displacements of the Center of Mass

The spatiotemporal parameters, COMv and COMl at the experimental walking speeds are presented in Table 2.
Step length was significantly lower in SOG compared to MOG (p = 0.002), with no significant difference between the former and NWG (p = 0.06), nor between MOG and NWG (p = 0.28). When normalized by height, step length was not significantly different among the three groups (p = 0.61).
Step frequency was significantly higher in SOG compared to NWG and MOG (p = 0.026 and p = 0.014, respectively), with no significant difference between MOG and NWG (p = 0.85).
There was no significant group main effect on COMv (p = 1.0).
COMl was significantly higher in SOG compared to NWG (p = 0.052), with no significant difference in the former compared with MOG (p = 0.30) and in MOG compared with NWG (p = 0.30).
For all these analyses, no significant interaction was found (p ≥ 0.07).

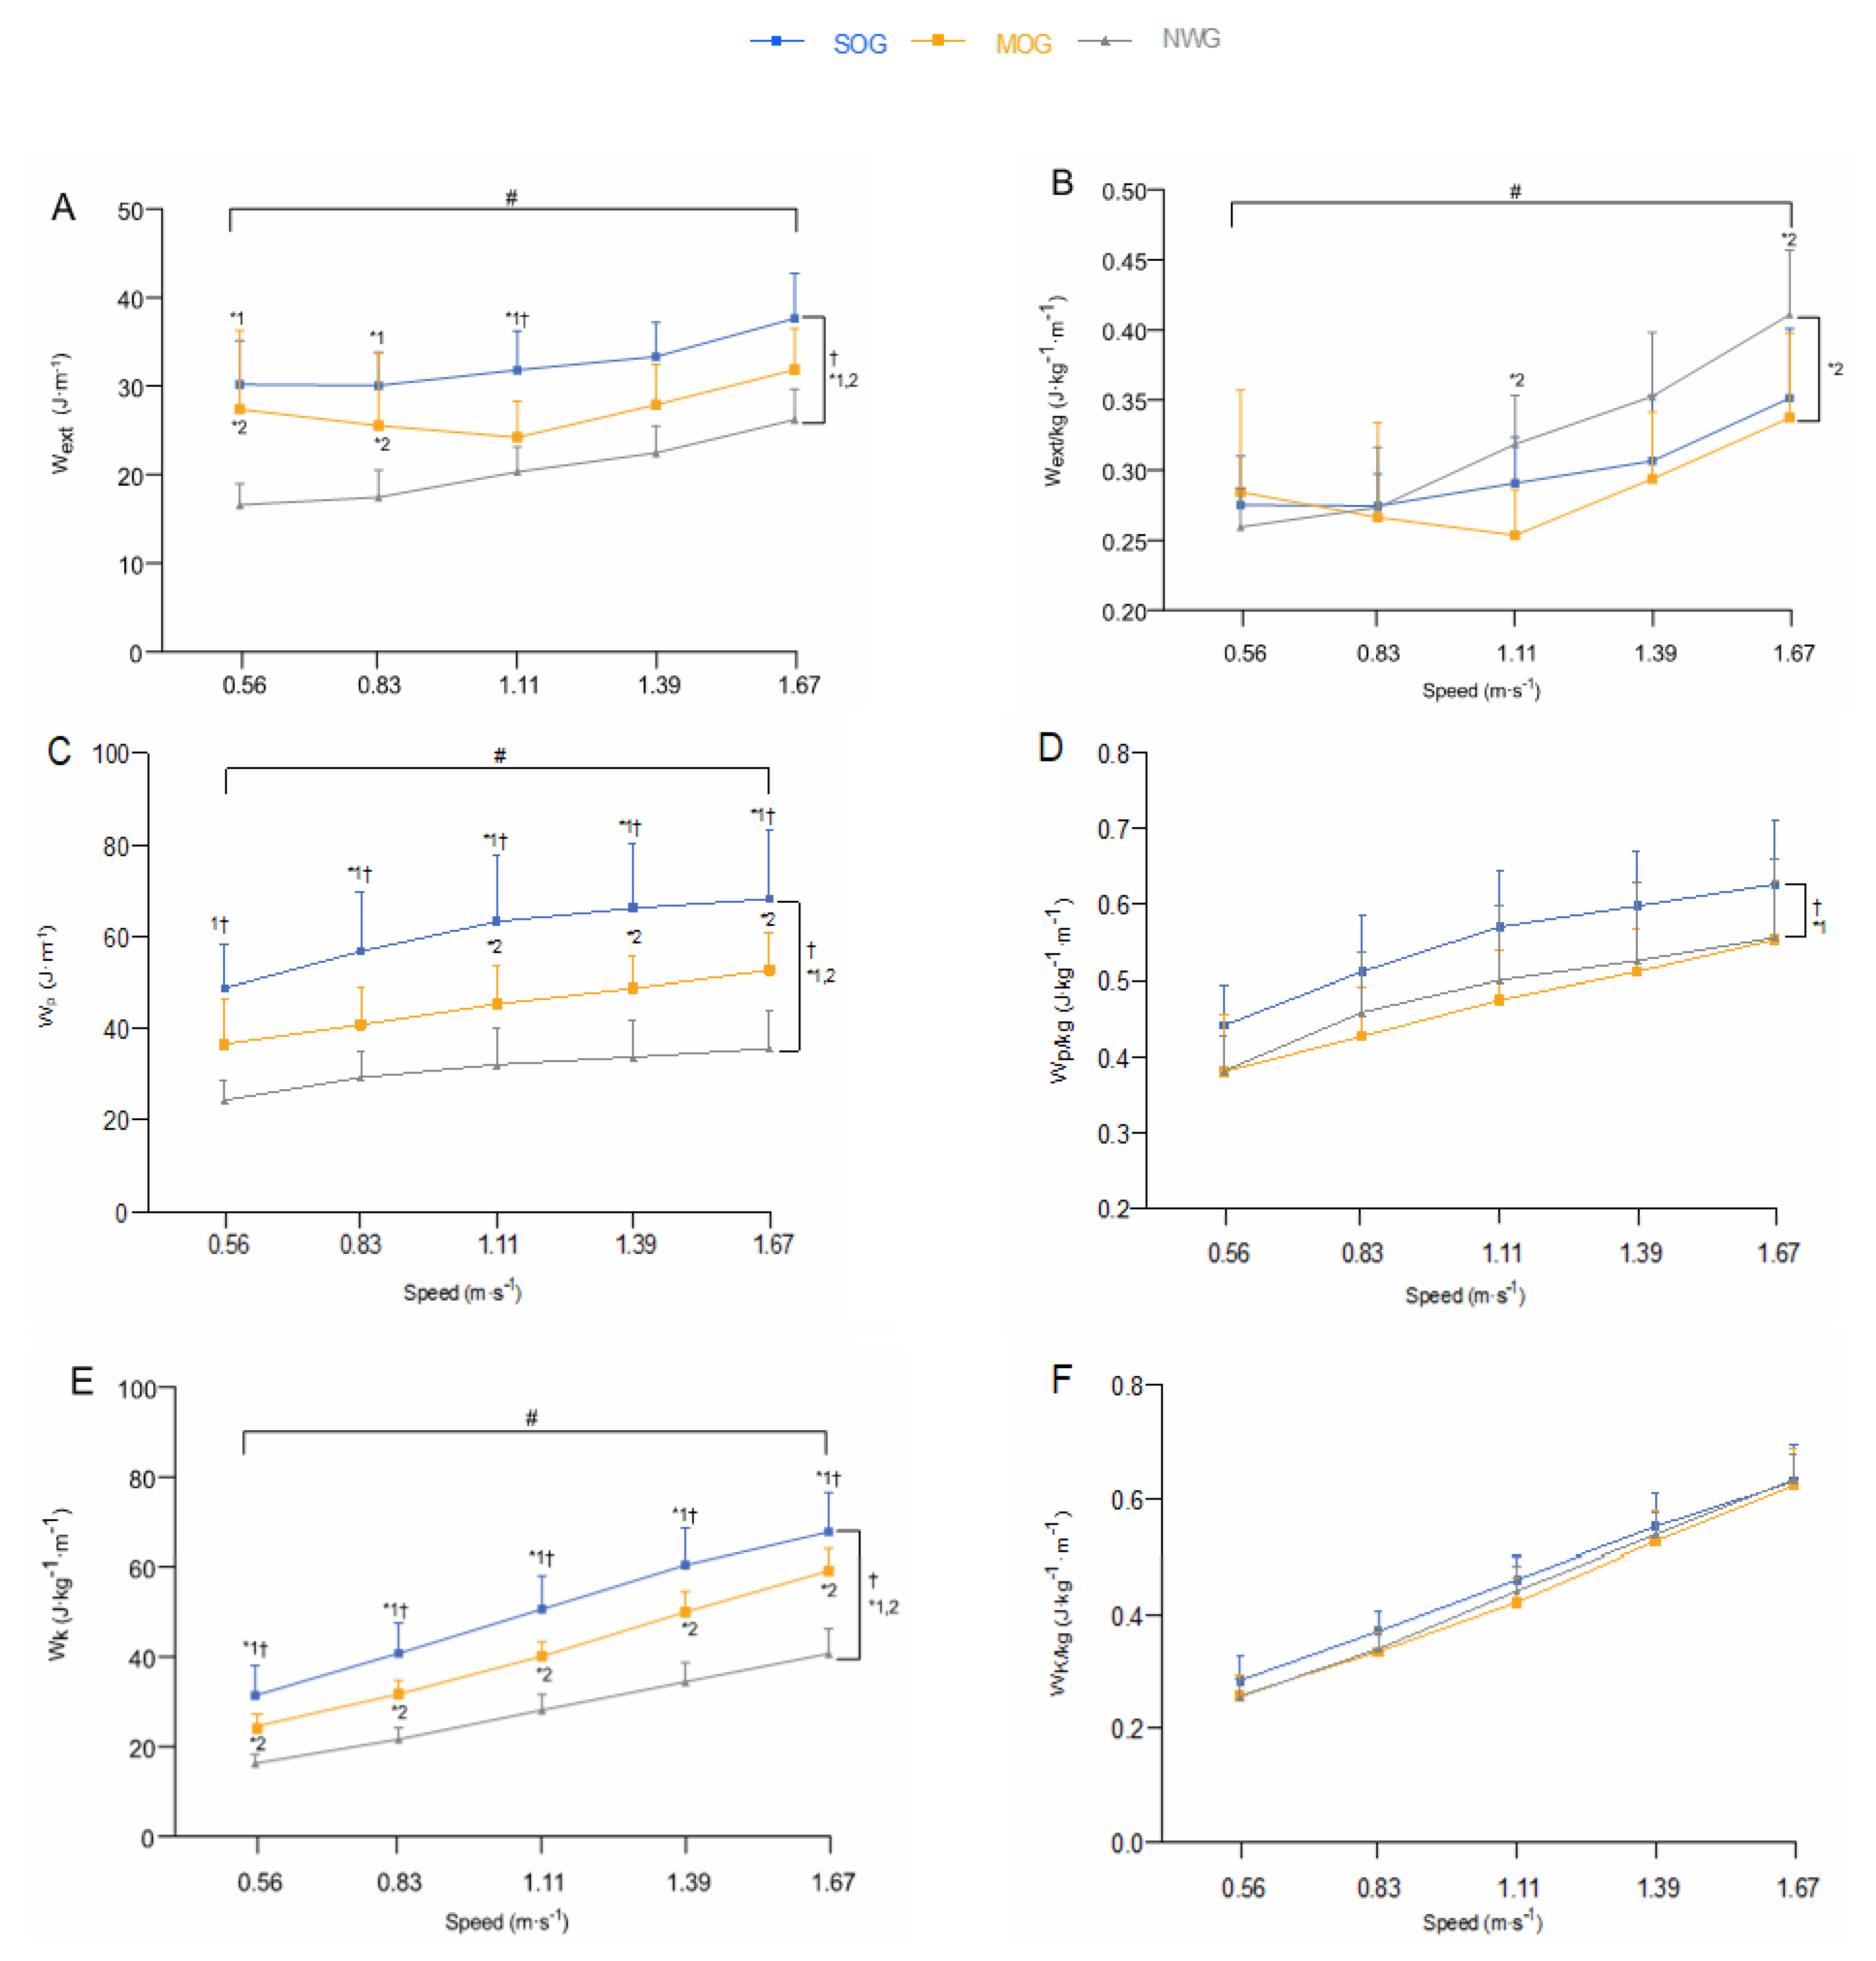
3.3.2. Mechanical Works

The Wext, Wp and Wk were significantly higher in SOG than NWG and MOG (p < 0.001 and p ≤ 0.01, respectively) and in MOG than NWG (p < 0.001 for all). There was a significant interaction effect for these three variables (p ≤ 0.005) (Figure 2A,C,E).
The Wext/kg was significantly lower in MOG than in NWG (p = 0.022), with no significant difference between SOG and NWG (p = 0.16), nor between the former and MOG (p = 0.26). There was a significant interaction effect (p < 0.001). Wext/kg was significantly lower in MOG than in NWG at 1.11 and at 1.67 m·s−1 (p = 0.003) (Figure 2B).
The Wp/kg was significantly higher in SOG compared to NWG and MOG (p = 0.018 and p = 0.002, respectively) with no significant difference between MOG and NWG (p = 0.53). There was no significant interaction effect (p = 0.73) (Figure 2D).
There was neither a significant group main effect on Wk/kg (p = 0.13) nor a significant interaction effect (p = 0.22) (Figure 2F).

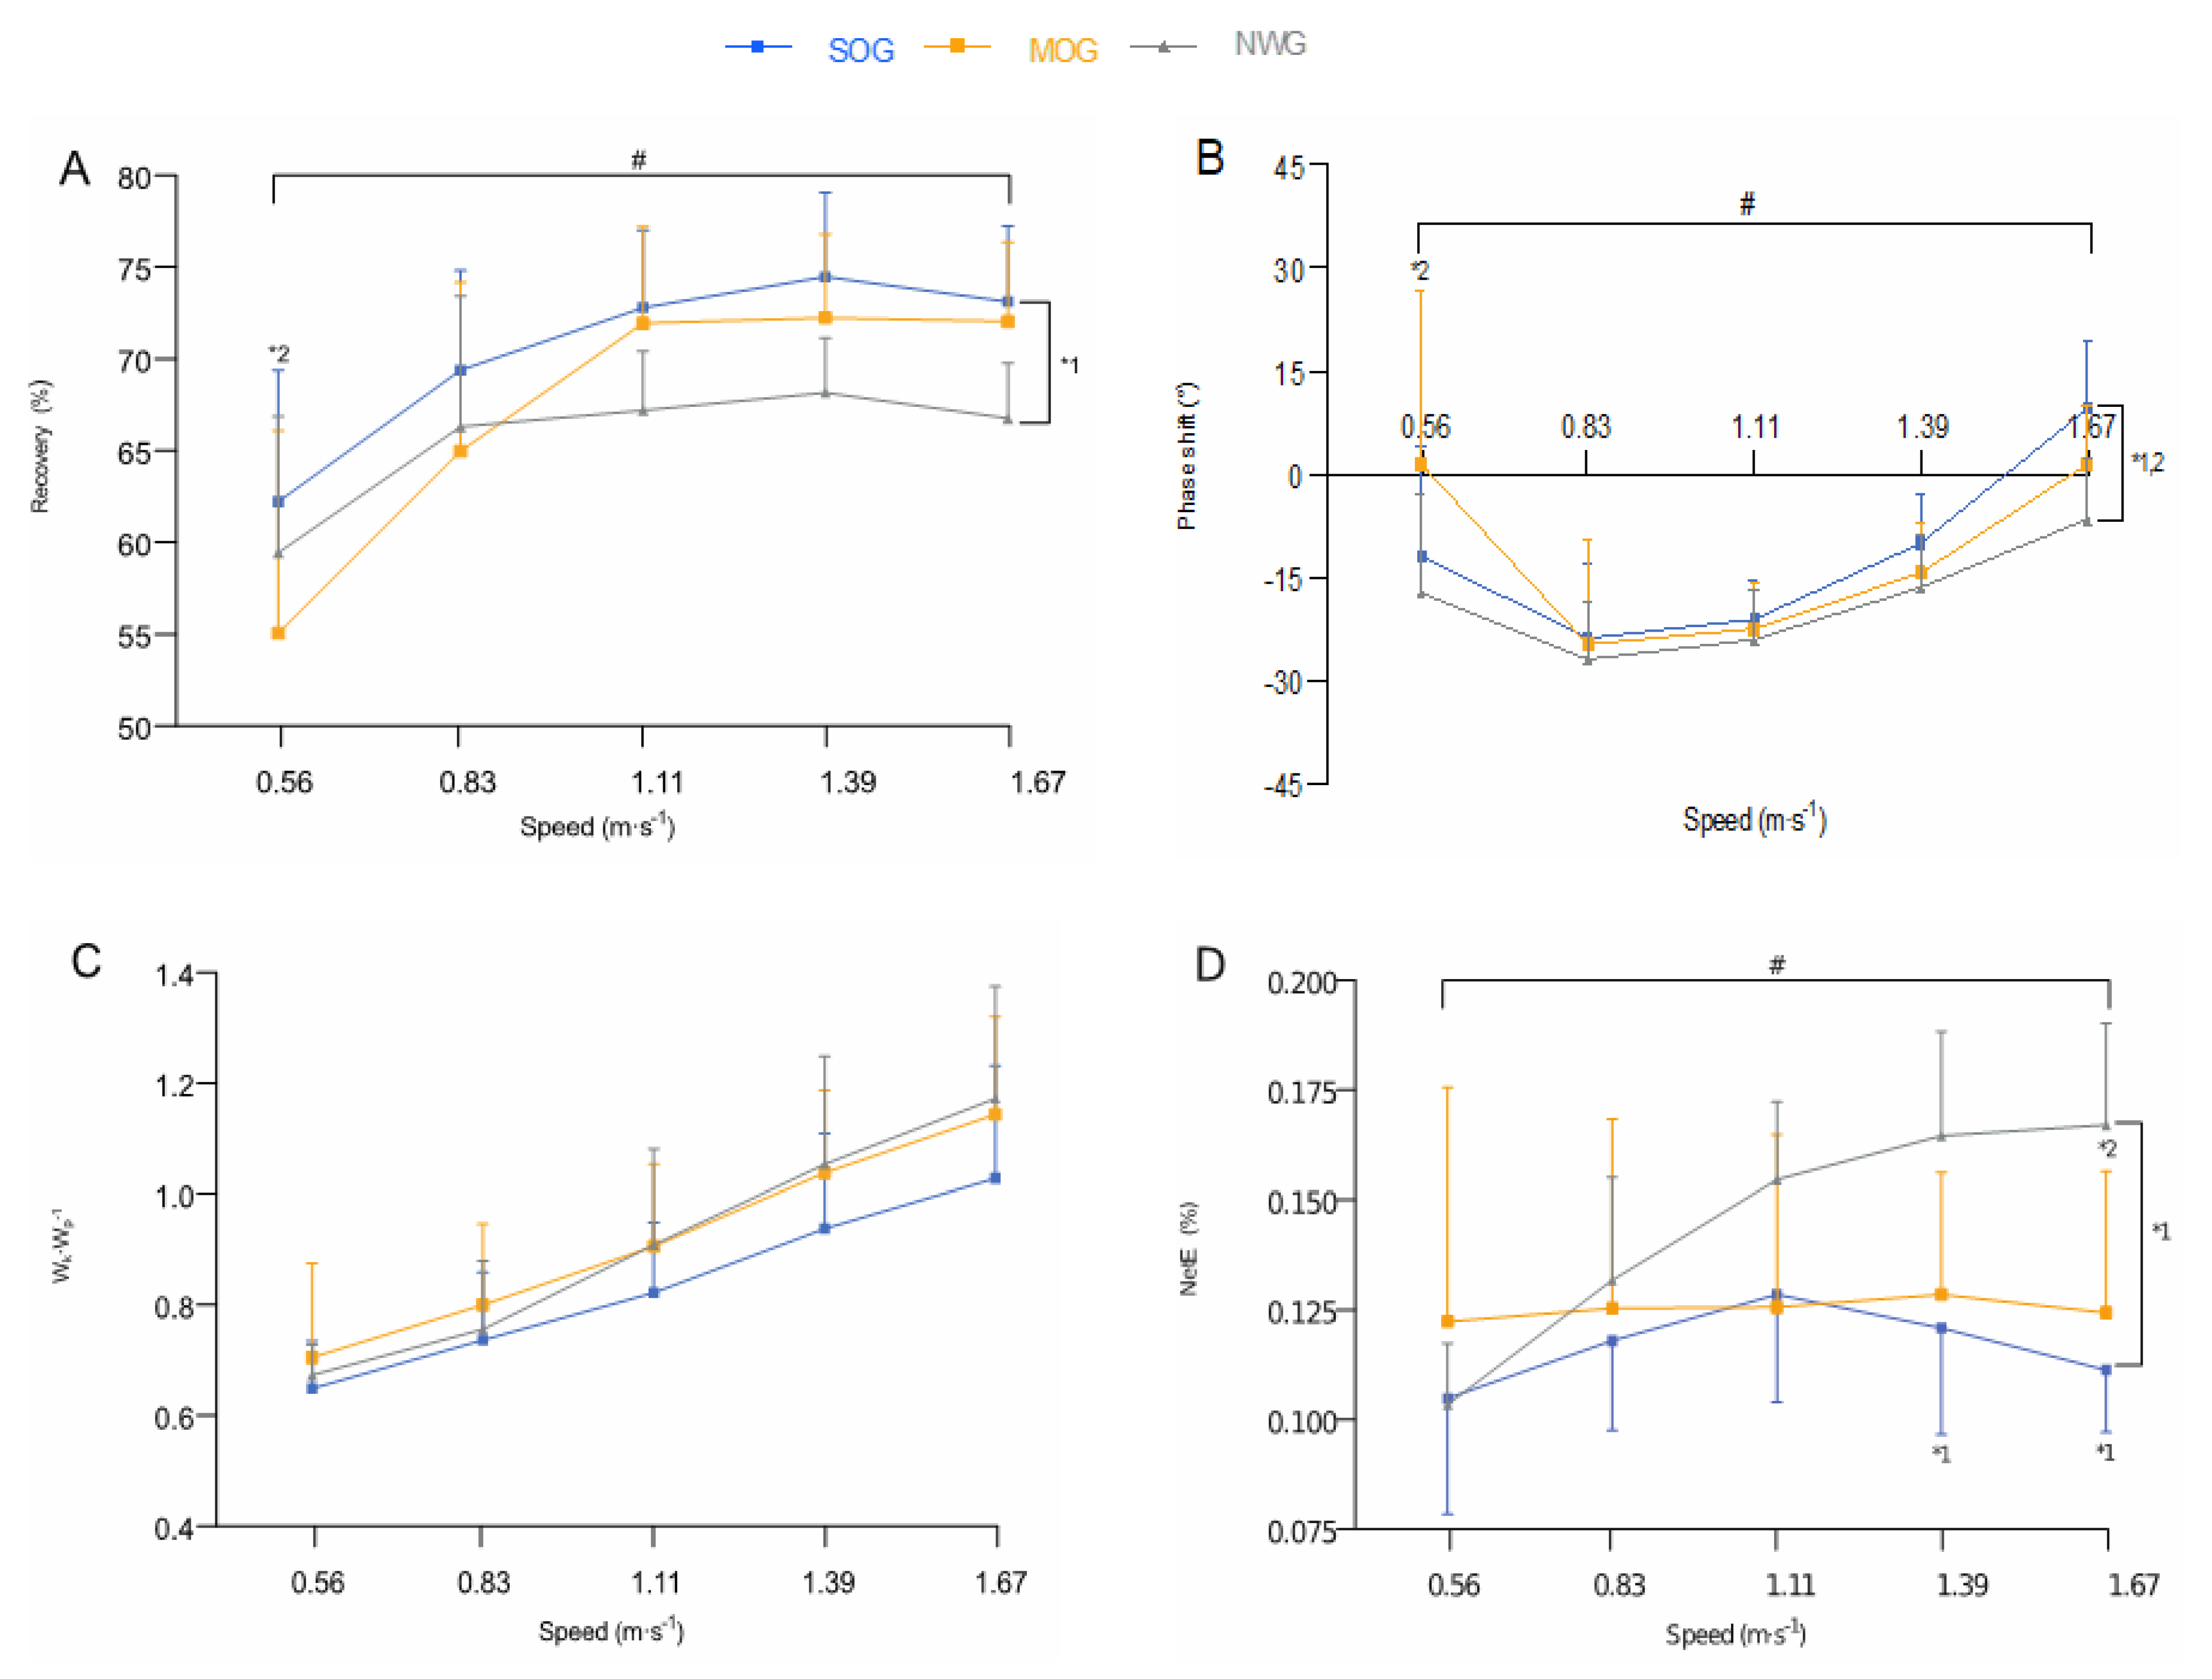
3.3.3. Potential Kinetic Energy Transduction and Factors affecting Recovery

Recovery was significantly higher in SOG than in NWG (p = 0.028), with no significant difference between the former and MOG (p = 0.13), nor between the latter and NWG (p = 0.35). There was a significant interaction effect (p < 0.001). Recovery was significantly lower in MOG than in NWG at the slowest speed (0.56 m·s−1) (p = 0.050) (Figure 3A).
The phase shift was significantly higher in SOG than in NWG (p = 0.039) and in MOG than in NWG (p = 0.039) with no significant difference between SOG and MOG (p = 0.94). There was a significant interaction effect (p = 0.002). The phase shift was significantly higher in MOG than NWG at the slowest speed (0.56 m·s−1) (p = 0.002) (Figure 3B).
There was neither a significant group main effect on Wk·Wp−1 (p = 0.14), nor a significant interaction effect (p = 0.23) (Figure 3C).

3.4. Net Locomotor Efficiency

The NetE was significantly lower in SOG than in NWG (p = 0.014), with no significant difference between the former and MOG (p = 0.34), nor between the latter and NWG (p = 0.09). There was a significant interaction effect (p < 0.001). The NetE was significantly lower in SOG than in NWG at the fastest speeds (1.39 and 1.67 m·s−1, respectively) (p < 0.001), and in MOG than in NWG only at 1.67 m·s−1 (p = 0.017) (Figure 3D).

3.5. Patterns among Body Mass, Net Cost of Walking, and Gait Mechanics

KMO measures were 0.5, 0.5, 0.7, and 0.6 at 0.56, 0.83, 1.11, and 1.39 m·s1, respectively, indicating an acceptable sample adequacy for PCA. Barlett’s test of sphericity was statistically significant for each walking speed (p < 0.001). PCA models explained between 17.0% and 44.2% of the data variance. Body mass, Wext, and NetCw were loaded highest on PC1 (labeled walking efficiency) at all walking speeds, whereas Recovery and COMl were loaded highest on PC2 (labeled pendulum-like characteristics) at 0.83, 1.11, and 1.39 m·s−1 (Table 3).

3.6. Usefulness of PC Scores to Identify Gait Pattern Similarities between Groups

At 0.56 m·s−1, PC1 scores were significantly higher in SOG than in NWG and MOG (p < 0.001 and p = 0.012, respectively) and in MOG than in NWG (p < 0.001). PC2 and PC3 scores were not significantly different between groups (p = 0.11 and p = 0.82, respectively) (Table 4).
At 0.83 m·s−1, PC1 scores were significantly higher in SOG than in NWG and MOG (p < 0.001 and p = 0.010, respectively) and in MOG than in NWG (p = 0.001). PC2 and PC3 scores were not significantly different between groups (p = 0.26 and p = 0.16, respectively) (Table 4).
At 1.11 m·s−1, PC1 scores were significantly higher in SOG compared to NWG and MOG (p < 0.001 for both) and in MOG than in NWG (p < 0.001). PC2 scores were also significantly higher in SOG than in NWG (p = 0.016) and in MOG than in NWG (p = 0.019), with no significant difference between SOG and MOG (p = 0.99). PC3 scores were not significantly different between groups (p = 0.13) (Table 4).
At 1.39 m·s−1, PC1 scores were significantly higher in SOG than in NWG (p < 0.001) and MOG (p = 0.026) and in MOG than in NWG (p = 0.001). PC2 scores were significantly higher in SOG compared to NWG (p = 0.024) with no significant different between the former and MOG (p = 0.59) nor between MOG and NWG (p = 0.18) (Table 4).

4. Discussion

The main findings of the present study were that individuals with severe obesity exhibited both a greater NetCw/kg and higher Recovery than normal-weight adults, regardless of the lower Wext/kg performed which, in turn, was significantly lower in subject with moderate obesity than in their normal-weight counterparts, despite similar Recovery and NetCw/kg. PCA was able to identify two components: walking efficiency and pendulum-like characteristics. PC scores were sensitive to distinguish individuals with obesity with lower walking efficiency from their normal-weight counterparts and to differentiate adults with severe obesity with better pendulum-like characteristics from other groups, especially at the fastest walking speeds.
As expected, NetCw/kg in SOG was 15% greater (Figure 1B) than NWG and it was non-significantly 6% greater (averaged values across all walking speeds; Figure 1B) in MOG than in NWG, which corroborates previous studies that reported similar results, but showed a greater difference between obese and lean adults [8,9,12,13]. The lower increase in NetCw/kg observed could be attributed to the lower level of obesity of our participants [9]. These findings revealed that (i) the extra cost of walking in individuals with obesity is not only related to body mass increase, and (ii) their lower economy may also be explained by several mechanical gait factors [9,14,15,16,31]. The relative contribution of these factors to NetCw/kg seems to be dependent on the differences in the level of obesity between groups. However, even though our analysis showed that the BMI differences between each comparison were significant (Table 1), these may not be substantial enough to alter the gait mechanics [31] and walking economy in SOG and MOG (Figure 2B).
Although SOG had a greater NetCw/kg compared to NWG, the energetic cost of walking was always lower than theoretically expected (+80%) [9]. This was due to a more skillful Recovery, which was significantly higher in SOG than in NWG (+7%; averaged across all speeds; Figure 3A) and was associated with the optimal phase shift (i.e., α ∼ 0; Figure 3B). These findings are in line with recent data from Fernandez-Mendez et al. [13], who reported similarly higher Recovery (+9.5%; averaged across all speeds) in adults with class III obesity compared to their lean counterparts across all walking speeds tested. This more skillful pendular mechanism may be due to an ingenious utilization of lateral motion which can improve mechanical energy recovery—a useful strategy that has been observed in penguins [32]. Our findings seem to corroborate this hypothetical strategy, which was further supported by our PCA results. In fact, SOG showed significantly larger COMl (+31%; averaged across all speeds) than in NWG across all walking speeds tested (Table 2), along with significantly higher PC2 score at 1.11 and 1.39 m·s−1 compared to NWG (Table 4). These data highlight strong relationships between Recovery and COMl (Table 3) in individuals with class II and III obesity (SOG) at these “intermediate speeds” when Recovery reaches the greater/optimum values [33]. The larger lateral movements in SOG may be related to greater thigh girth due to an excessive amount of adipose tissue and/or poor dynamic stability during walking [14,16], and may explain the nonsignificant difference in Recovery between SOG and MOG (Figure 3A). Indeed, our results did not reveal any significant difference between the lower limb fat mass of these groups (Table 1). Unexpectedly, Recovery did not increase at fastest speeds in MOG compared with NWG, which supports the idea that COMl plays a key role in the conservation of mechanical energy during walking. Indeed, MOG compared with NWG presented a nonsignificant COMl (Table 2), along with a nonsignificant PC2 score across all walking speeds tested, except at 1.11 m·s−1 (Table 4). Altogether, it seems that the lower obesity level of moderately obese participants (who are placed midway between severely and normal-weight subjects) was not substantial enough to significantly affect the walking speed–Recovery relationship. This corroborates similar findings reported by Fernandez-Mendez et al. [12], reinforcing the hypothesis that the level of obesity plays a key role in pendular exchange optimization.
In contrast to our hypothesis, Wext/kg was not significantly different between SOG and NWG (Figure 2B), despite a more skillful pendular energy transduction (Figure 3A). This unpredictable nonsignificant difference on Wext, along with the apparent discrepancy between Recovery and Wext/kg, might be explained by the relative amplitude between the Ek and Ep curves. Although nonsignificant in itself, the Wk·Wp−1 ratio was 10% greater in SOG than in NWG (Figure 3C). This is further supported by a significantly higher Wp/kg in the former (Figure 2D), thus suggesting that obesity may positively affect the pendular mechanism by making these energies more out of phase (Figure 3B), but at the expense of a poorer magnitude optimization (i.e., Wk·Wp−1 < 1; Figure 3C). The higher Wp/kg in SOG compared to NWG would appear to be a consequence of greater knee flexion during the foot strike [34]—a load-protective mechanism used to absorb the impact-related ground reaction forces [35]. This more bouncy walking seems to be related to the larger body mass, because after very large weight loss, the knee flexion in the early stance phase was reduced along with a lower Wp/kg [34]. Consequently, greater work against gravity needs to be done by the muscles of the trailing leg to raise COM during the single contact phase. However, less work is needed to accelerate the COM during double contact due to a greater amount of Ep available to be converted into Ek. This energy mismatch [36] may increase the Wext/kg performed to redirect the COM velocity from one arc to the next [37], and contribute to explaining the nonsignificant lower Wext/kg observed in adults with class II and III obesity (SOG) compared to their normal-weight counterparts (Figure 2B). On the other hand, as hypothesized, the Wext/kg was significantly lower in MOG compared to NWG, especially at the fastest speeds (Figure 2B), which confirms the previous results [12]. This lower Wext/kg appears to be related to improved timing between the heel strike and the toe-off impulse generated by the plantar flexor muscles of the trailing leg. This allows reduction of the dissipation of mechanical energy and, consequently, the work performed to redirect the COM during step-to-step transitions [37,38], thus limiting the increase in NetCw/kg. Interestingly, an artificial reduction in the ankle push-off substantially decreases the walking economy [39], which might explain why individuals with severe obesity have a less efficient walking propulsion and exert more energy over a stride compared to their lean counterparts. This finding further supports the concept of a functional body mass threshold, beyond which the NetCw/kg cannot be compensated completely by the improved pendular energy transduction. As speculated by Heglund et al. [18] and confirmed by our study, the greater NetCw/kg, concomitantly with the nonsignificant lower Wext/kg found in SOG compared to NWG, resulted in a significantly lower NetE (−19%; across all walking speeds) in the former (Figure 3D), thus corroborating previous studies that have observed lower mechanical efficiency in individuals with obesity than in their lean counterparts [10,12]. PCA appears to confirm the lower NetE with significantly higher PC1 score in SOG and MOG than NWG at all walking speeds (Table 4). However, despite this lower mechanical efficiency in individuals with obesity compared to lean individuals, it may be premature to conclude that mechanical efficiency is impaired in the former, given that the mechanical work has been only partially quantified (Wint was not assessed in our study). However, previous results from Fernandez-Mendez et al. [13] have shown that adults with class III obesity present a similar amount of relative Wint and greater NetCw/kg compared to their lean counterparts, which suggests that swinging of the limbs is not responsible for the extra energy cost in this population. For this reason, we can assume that the NetE (Wext·NetCw−1) assessed in our study can well approximate the overall mechanical efficiency (Wtot·NetCw−1). The lower NetE found in SOG compared to NWG may be explained by a more knee-flexed lower limb at the heel strike [34], which may produce disadvantageous joint loads that would require more muscular tension to prevent the joints from collapsing and to support the body mass [36,40]. Interestingly, an unfavorable joint moment due to considerable load carrying was directly linked to a proportional increase in NetCw [41]. Thus, it seems plausible that individuals with class II and III obesity (SOG) exert more energy due to an increase in muscle co-contractions when their body mass extends beyond a functional body mass threshold. Indeed, below this threshold, adults with class I obesity (MOG) presented a lower increase in NetCw/kg, which might be better (albeit not completely) cushioned, by a lower Wext/kg. Moreover, the lower the level of obesity, the higher the critical speed at which mechanical efficiency is penalized (Figure 3D), because a lower level of obesity would enable generation of an advantageous burst of positive power [42] and to produce appropriate forces to support the body’s weight during walking.
Practical applications. Health behavior such as physical activity and diet are essential for body weight control [43]. A greater NetCw/kg therefore represents a potential target for morbid obesity management through the daily total energy expenditure increase (TEE), especially in sedentary people with obesity who are in the so-called “unregulated zone”, in which appetite and food intake are not affected by TEE; thus, food intake drives body weight gain [44]. Although increasing physical activity using walking and its associated higher NetCw/kg could be useful to shift individuals with obesity into the “regulated zone”, in which appetite and food intake are affected by physical activity [44], the role of the latter in energy balance and weight loss remains controversial [44,45,46]. Nevertheless, decreasing the greater NetCw/kg in adults with obesity may be beneficial to increase non-exercise activity thermogenesis (NEAT) [11], and thus, light physical activity energy expenditure (1.6–2.9 metabolic equivalents; METs), which is inversely related to sedentary time [47] and has complementary effects to improve health [48].
Some methodological limitations need to be addressed. First, our groups were not matched for age, sex, or height. However, all subjects in our study were no older than ∼65 years, which is considered the critical age when the energetics and mechanics of walking change substantially [49,50]. Sex distribution in the three groups was not significantly different. The difference in height among the three groups may be involved in the differences found in step length. However, the height difference among the groups was small and negligible and did not influence COMv and mechanical work during walking [51]. This corroborates that age, sex, and height did not represent confounding factors of gait analysis in comparing our three groups. Second, the combined limbs method (CLM) used neglects the simultaneous positive and negative work done by the trailing and leading legs during double support stances, and therefore may have underestimated the measured Wext [52]. However, CLM is the basis for computing Recovery [53]. Third, our study was based on a relatively small sample size that reflected the recruitment challenges—a difficulty that has also been reported by others [54]. Therefore, our findings should be interpreted with caution and require further exploration in more representative samples.

5. Conclusions

In conclusion, this study shows that obesity class appears to have an effect on the energetic and mechanics of walking. Individuals with obesity (class II-III, and I) have a greater NetCw/kg compared to their normal-weight counterparts. This extra cost is partially mitigated only in adults with class II–III obesity (SOG) by a more skillful pendular mechanism, consequent to the optimal exploitation of lateral movements that enhance the phase shift between the Ep and Ek curves at the expense of amplitude optimization. This energy mismatch seems to explain the nonsignificant lower Wext/kg that may relate to the attainment and/or the exceeding of a functional body mass threshold. Indeed, obesity level may be paradoxically associated with lower mechanical efficiency and with better pendulum-like characteristics during walking.

Author Contributions

Conceptualization, A.F.M. and D.M.; Methodology, A.F.M. and D.M.; Validation, J.P., A.F.M., D.H., L.F., F.C.v.R. and D.M.; Formal Analysis, J.P., A.F.M., F.C.v.R. and D.M.; Investigation, A.F.M. and D.M.; Writing—Original Draft Preparation, J.P.; Writing—Review and Editing, J.P., A.F.M., D.H., L.F., F.C.v.R. and D.M.; Visualization, J.P.; Supervision, F.C.v.R. and D.M.; Project Administration, D.M. All authors have read and agreed to the published version of the manuscript.

Funding

This research received no external funding.

Institutional Review Board Statement

The study was conducted according to the guidelines of the Declaration of Helsinki, and approved by Ethics Committee Commission cantonale d’éthique de la recherche sur l’être humain [CER-VD 136/14 (14/01/2015)—CER-VD 2016-01715 (11/01/2017)].

Informed Consent Statement

Informed consent was obtained from all subjects involved in the study.

Acknowledgments

The authors warmly thank the participants for their time and cooperation.

Conflicts of Interest

The authors declare no conflict of interest.

Abbreviations

αPhase shift between Ek and Ep curves
BMIBody mass index
COMCenter of mass
COMlCenter of mass lateral displacements
COMvCenter of mass vertical displacements
EkMechanical kinetic energy
EkfForward mechanical kinetic energy
EklLateral mechanical kinetic energy
EkvVertical mechanical kinetic energy
EpMechanical potential energy
EtotTotal mechanical energy
FfForward ground reaction force
FlLateral ground reaction force
FvVertical ground reaction force
gGravity
GRFGround reaction force
hVertical position of the COM
iDXADual-energy X-ray absorptiometry
KMOKaiser–Meyer–Olkin Test
LMMLinear Mixed Model
mBody mass
METMetabolic equivalent
MOGModerately obese group
NEATNon-exercise activity thermogenesis
NetCwAbsolute net energy cost of walking
NetCw/kgRelative net energy cost of walking
NetENet locomotor efficiency
NWGNormal-weight group
PCPrincipal component
PC1Principal component 1
PC2Principal component 2
PC3Principal component 3
PCAPrincipal component analysis
RERRespiratory exchange ratio
SDStandard deviation
SMRAbsolute standing metabolic rate
SMR/kgRelative standing metabolic rate
SOGSeverely obese group
TEETotal energy expenditure
τStep period
tpk+Difference between the time period at which Ek and Ep curves increase simultaneously
V ˙ CO 2 Carbon dioxide production
V ˙ O 2 Oxygen uptake
V ˙ E Ventilation
VfForward velocity of the COM
VlLateral velocity of the COM
VvVertical velocity of the COM
WextAbsolute external mechanical work
Wext/kgRelative external mechanical work
WkAbsolute kinetic mechanical work
Wk/kgRelative kinetic mechanical work
WpAbsolute potential mechanical work
Wp/kgRelative kinetic mechanical work
WtotTotal mechanical work

References

  1. NCD Risk Factor Collaboration. Trends in adult body-mass index in 200 countries from 1975 to 2014: A pooled analysis of 1698 population-based measurement studies with 19.2 million participants. Lancet 2016, 387, 1377–1396. [Google Scholar] [CrossRef] [Green Version]
  2. World Health Organization. Obesity: Preventing and managing the global epidemic. Report of a WHO consultation. World Health Organ. Tech. Rep. Ser. 2000, 894, 1–253. [Google Scholar]
  3. Jakicic, J.M.; Powell, K.E.; Campbell, W.W.; Dipietro, L.; Pate, R.R.; Pescatello, L.S.; Collins, K.A.; Bloodgood, B.; Piercy, K.L.; Physical Activity Guidelines Advisory, C. Physical Activity and the Prevention of Weight Gain in Adults: A Systematic Review. Med. Sci. Sports Exerc. 2019, 51, 1262–1269. [Google Scholar] [CrossRef]
  4. Bouchard, C.; Depres, J.P.; Tremblay, A. Exercise and obesity. Obes. Res. 1993, 1, 133–147. [Google Scholar] [CrossRef]
  5. Hootman, J.M.; Macera, C.A.; Ainsworth, B.E.; Addy, C.L.; Martin, M.; Blair, S.N. Epidemiology of musculoskeletal injuries among sedentary and physically active adults. Med. Sci. Sports Exerc. 2002, 34, 838–844. [Google Scholar] [CrossRef]
  6. Yamanouchi, K.; Shinozaki, T.; Chikada, K.; Nishikawa, T.; Ito, K.; Shimizu, S.; Ozawa, N.; Suzuki, Y.; Maeno, H.; Kato, K.; et al. Daily Walking Combined with Diet Therapy Is a Useful Means for Obese Niddm Patients Not Only to Reduce Body-Weight but Also to Improve Insulin Sensitivity. Diabetes Care 1995, 18, 775–778. [Google Scholar] [CrossRef]
  7. Levine, J.A.; McCrady, S.K.; Lanningham-Foster, L.M.; Kane, P.H.; Foster, R.C.; Manohar, C.U. The role of free-living daily walking in human weight gain and obesity. Diabetes 2008, 57, 548–554. [Google Scholar] [CrossRef] [Green Version]
  8. Browning, R.C.; Baker, E.A.; Herron, J.A.; Kram, R. Effects of obesity and sex on the energetic cost and preferred speed of walking. J. Appl. Physiol. 2006, 100, 390–398. [Google Scholar] [CrossRef] [PubMed] [Green Version]
  9. Browning, R.C.; Kram, R. Energetic cost and preferred speed of walking in obese vs. normal weight women. Obes. Res. 2005, 13, 891–899. [Google Scholar] [CrossRef] [PubMed] [Green Version]
  10. Lafortuna, C.L.; Agosti, F.; Galli, R.; Busti, C.; Lazzer, S.; Sartorio, A. The energetic and cardiovascular response to treadmill walking and cycle ergometer exercise in obese women. Eur. J. Appl. Physiol. 2008, 103, 707–717. [Google Scholar] [CrossRef]
  11. Hunter, G.R.; Fisher, G.; Neumeier, W.H.; Carter, S.J.; Plaisance, E.P. Exercise Training and Energy Expenditure following Weight Loss. Med. Sci. Sports Exerc. 2015, 47, 1950–1957. [Google Scholar] [CrossRef] [Green Version]
  12. Fernandez Menendez, A.; Saubade, M.; Millet, G.P.; Malatesta, D. Energy-saving walking mechanisms in obese adults. J. Appl. Physiol. 2019, 126, 1250–1258. [Google Scholar] [CrossRef] [PubMed]
  13. Fernandez Menendez, A.; Uva, B.; Favre, L.; Hans, D.; Borrani, F.; Malatesta, D. Mass-normalized internal mechanical work in walking is not impaired in adults with class III obesity. J. Appl. Physiol. 2020, 129, 194–203. [Google Scholar] [CrossRef] [PubMed]
  14. McGraw, B.; McClenaghan, B.A.; Williams, H.G.; Dickerson, J.; Ward, D.S. Gait and postural stability in obese and nonobese prepubertal boys. Arch. Phys. Med. Rehabil. 2000, 81, 484–489. [Google Scholar] [CrossRef] [PubMed]
  15. Browning, R.C.; Kram, R. Effects of obesity on the biomechanics of walking at different speeds. Med. Sci. Sports Exerc. 2007, 39, 1632–1641. [Google Scholar] [CrossRef]
  16. Spyropoulos, P.; Pisciotta, J.C.; Pavlou, K.N.; Cairns, M.A.; Simon, S.R. Biomechanical gait analysis in obese men. Arch. Phys. Med. Rehabil. 1991, 72, 1065–1070. [Google Scholar] [PubMed]
  17. Cavagna, G.A.; Kaneko, M. Mechanical work and efficiency in level walking and running. J. Physiol. 1977, 268, 467–481. [Google Scholar] [CrossRef]
  18. Heglund, N.C.; Willems, P.A.; Penta, M.; Cavagna, G.A. Energy-saving gait mechanics with head-supported loads. Nature 1995, 375, 52–54. [Google Scholar] [CrossRef]
  19. Browning, R.C.; Reynolds, M.M.; Board, W.J.; Walters, K.A.; Reiser, R.F., 2nd. Obesity does not impair walking economy across a range of speeds and grades. J. Appl. Physiol. 2013, 114, 1125–1131. [Google Scholar] [CrossRef]
  20. Chau, T. A review of analytical techniques for gait data. Part 1: Fuzzy, statistical and fractal methods. Gait Posture 2001, 13, 49–66. [Google Scholar] [CrossRef]
  21. Jolliffe, I.T.; Cadima, J. Principal component analysis: A review and recent developments. Philos. Trans. A Math. Phys. Eng. Sci. 2016, 374, 20150202. [Google Scholar] [CrossRef] [PubMed]
  22. Wall, J.C.; Charteris, J. A Kinematic Study of Long-Term Habituation to Treadmill Walking. Ergonomics 1981, 24, 531–542. [Google Scholar] [CrossRef] [PubMed]
  23. Kaviani, S.; Schoeller, D.A.; Ravussin, E.; Melanson, E.L.; Henes, S.T.; Dugas, L.R.; Dechert, R.E.; Mitri, G.; Schoffelen, P.F.M.; Gubbels, P.; et al. Determining the Accuracy and Reliability of Indirect Calorimeters Utilizing the Methanol Combustion Technique. Nutr. Clin. Pract. 2018, 33, 206–216. [Google Scholar] [CrossRef] [PubMed]
  24. Astrand, P.O.K.R. Textbook of Work Physiology; McGraw-Hill Series in Health Edition: New York, NY, USA, 1986; p. 756. [Google Scholar]
  25. Massaad, F.; Lejeune, T.M.; Detrembleur, C. The up and down bobbing of human walking: A compromise between muscle work and efficiency. J. Physiol. 2007, 582, 789–799. [Google Scholar] [CrossRef] [PubMed]
  26. Cavagna, G.A.; Willems, P.A.; Legramandi, M.A.; Heglund, N.C. Pendular energy transduction within the step in human walking. J. Exp. Biol. 2002, 205, 3413–3422. [Google Scholar] [CrossRef] [PubMed]
  27. Mian, O.S.; Thom, J.M.; Ardigo, L.P.; Narici, M.V.; Minetti, A.E. Metabolic cost, mechanical work, and efficiency during walking in young and older men. Acta Physiol. 2006, 186, 127–139. [Google Scholar] [CrossRef]
  28. De Vellis, R.F. (Ed.) Factor Analysis. In Scale Development: Theory and Applications, 2nd ed.; Sage Publications: Thousand Oaks, CA, USA, 2003; pp. 102–137. [Google Scholar]
  29. Hair, J.F.; Black, W.C.; Babin, B.J.; Anderson, R.E. (Eds.) Exploratory factor analysis. In Multivariate Data Analysis: Pearson New International Edition, 7th ed.; Pearson Prentice Hall: Upper Saddle River, NJ, USA, 2013; pp. 107–151. [Google Scholar]
  30. Stevens, J. (Ed.) What loadings should be used for interpretation? In Applied Multivariate Statistics for the Social Sciences, 5th ed.; Taylor & Francis Group: New York, NY, USA, 2002; pp. 331–332. [Google Scholar]
  31. Browning, R.C.; McGowan, C.P.; Kram, R. Obesity does not increase external mechanical work per kilogram body mass during walking. J. Biomech. 2009, 42, 2273–2278. [Google Scholar] [CrossRef] [Green Version]
  32. Griffin, T.M.; Kram, R. Penguin waddling is not wasteful. Nature 2000, 408, 929. [Google Scholar] [CrossRef]
  33. Cavagna, G.A.; Thys, H.; Zamboni, A. The sources of external work in level walking and running. J. Physiol. 1976, 262, 639–657. [Google Scholar] [CrossRef]
  34. Malatesta, D.; Favre, J.; Ulrich, B.; Hans, D.; Suter, M.; Favre, L.; Fernandez Menendez, A. Effect of very large body mass loss on energetics, mechanics and efficiency of walking in adults with obesity: Mass-driven versus behavioural adaptations. J. Physiol. 2021. [Google Scholar] [CrossRef]
  35. Majumdar, D.; Pal, M.S.; Majumdar, D. Effects of military load carriage on kinematics of gait. Ergonomics 2010, 53, 782–791. [Google Scholar] [CrossRef] [PubMed]
  36. Ortega, J.D.; Farley, C.T. Minimizing center of mass vertical movement increases metabolic cost in walking. J. Appl. Physiol. 2005, 99, 2099–2107. [Google Scholar] [CrossRef] [PubMed]
  37. Kuo, A.D.; Donelan, J.M.; Ruina, A. Energetic consequences of walking like an inverted pendulum: Step-to-step transitions. Exerc. Sport Sci. Rev. 2005, 33, 88–97. [Google Scholar] [CrossRef] [PubMed]
  38. Zelik, K.E.; Huang, T.W.; Adamczyk, P.G.; Kuo, A.D. The role of series ankle elasticity in bipedal walking. J. Theor. Biol. 2014, 346, 75–85. [Google Scholar] [CrossRef] [Green Version]
  39. Huang, T.W.; Shorter, K.A.; Adamczyk, P.G.; Kuo, A.D. Mechanical and energetic consequences of reduced ankle plantar-flexion in human walking. J. Exp. Biol. 2015, 218, 3541–3550. [Google Scholar] [CrossRef] [Green Version]
  40. Grabowski, A.; Farley, C.T.; Kram, R. Independent metabolic costs of supporting body weight and accelerating body mass during walking. J. Appl. Physiol. 2005, 98, 579–583. [Google Scholar] [CrossRef] [Green Version]
  41. Griffin, T.M.; Roberts, T.J.; Kram, R. Metabolic cost of generating muscular force in human walking: Insights from load-carrying and speed experiments. J. Appl. Physiol. 2003, 95, 172–183. [Google Scholar] [CrossRef] [PubMed] [Green Version]
  42. Zelik, K.E.; Adamczyk, P.G. A unified perspective on ankle push-off in human walking. J. Exp. Biol. 2016, 219, 3676–3683. [Google Scholar] [CrossRef] [Green Version]
  43. Thom, G.; Lean, M. Is There an Optimal Diet for Weight Management and Metabolic Health? Gastroenterology 2017, 152, 1739–1751. [Google Scholar] [CrossRef] [PubMed] [Green Version]
  44. Blundell, J.E.; Gibbons, C.; Caudwell, P.; Finlayson, G.; Hopkins, M. Appetite control and energy balance: Impact of exercise. Obes. Rev. 2015, 16 (Suppl. 1), 67–76. [Google Scholar] [CrossRef] [Green Version]
  45. Pontzer, H.; Durazo-Arvizu, R.; Dugas, L.R.; Plange-Rhule, J.; Bovet, P.; Forrester, T.E.; Lambert, E.V.; Cooper, R.S.; Schoeller, D.A.; Luke, A. Constrained Total Energy Expenditure and Metabolic Adaptation to Physical Activity in Adult Humans. Curr. Biol. 2016, 26, 410–417. [Google Scholar] [CrossRef] [PubMed] [Green Version]
  46. Careau, V.; Halsey, L.G.; Pontzer, H.; Ainslie, P.N.; Andersen, L.F.; Anderson, L.J.; Arab, L.; Baddou, I.; Bedu-Addo, K.; Blaak, E.E.; et al. Energy compensation and adiposity in humans. Curr. Biol. 2021, 31, 4659–4666.e2. [Google Scholar] [CrossRef]
  47. Pate, R.R.; O’Neill, J.R.; Lobelo, F. The evolving definition of “sedentary”. Exerc. Sport Sci. Rev. 2008, 36, 173–178. [Google Scholar] [CrossRef] [PubMed]
  48. Le Roux, E.; De Jong, N.P.; Blanc, S.; Simon, C.; Bessesen, D.H.; Bergouignan, A. Physiology of physical inactivity, sedentary behaviours and non-exercise activity: Insights from the space bedrest model. J. Physiol. 2021. [Google Scholar] [CrossRef]
  49. Malatesta, D.; Simar, D.; Dauvilliers, Y.; Candau, R.; Borrani, F.; Prefaut, C.; Caillaud, C. Energy cost of walking and gait instability in healthy 65- and 80-yr-olds. J. Appl. Physiol. 2003, 95, 2248–2256. [Google Scholar] [CrossRef] [Green Version]
  50. Malatesta, D.; Vismara, L.; Menegoni, F.; Galli, M.; Romei, M.; Capodaglio, P. Mechanical external work and recovery at preferred walking speed in obese subjects. Med. Sci. Sports Exerc. 2009, 41, 426–434. [Google Scholar] [CrossRef] [PubMed]
  51. Cavagna, G.A.; Franzetti, P. The determinants of the step frequency in walking in humans. J. Physiol. 1986, 373, 235–242. [Google Scholar] [CrossRef] [PubMed]
  52. Donelan, J.M.; Kram, R.; Kuo, A.D. Mechanical work for step-to-step transitions is a major determinant of the metabolic cost of human walking. J. Exp. Biol. 2002, 205, 3717–3727. [Google Scholar] [CrossRef] [PubMed]
  53. Cavagna, G.A.; Willems, P.A.; Heglund, N.C. The role of gravity in human walking: Pendular energy exchange, external work and optimal speed. J. Physiol. 2000, 528, 657–668. [Google Scholar] [CrossRef]
  54. Hortobagyi, T.; Herring, C.; Pories, W.J.; Rider, P.; Devita, P. Massive weight loss-induced mechanical plasticity in obese gait. J. Appl. Physiol. 2011, 111, 1391–1399. [Google Scholar] [CrossRef] [Green Version]
Figure 1. Absolute net energy cost of walking (NetCw; J·m−1) (A), relative net energy cost of walking (NetCw/kg; J·kg·m−1) (B). Values are the mean ± SD. The blue line corresponds to the severely obese group (SOG; n = 18), with orange line to the moderately obese group (MOG; n = 17), with grey line to the normal-weight group (NWG; n = 13). Significant difference between SOG and MOG. *1 Significant difference between SOG and NWG. *2 Significant difference between MOG and NWG. # Significant speed × group interaction effect.
Nutrients 13 04546 g001
Figure 2. Absolute external mechanical work (Wext; J·m−1) (A), relative external mechanical work (Wext/kg; J·kg−1·m−1) (B), absolute mechanical potential energy (Wp; J·m−1) (C), relative mechanical potential energy (Wp/kg; J·kg−1·m−1) (D), absolute mechanical kinetic energy (Wk; J·m−1) (E), relative mechanical kinetic energy (Wk/kg; J·kg−1·m−1) (F) as a function of the walking speed. Values are the mean ± SD. The blue line corresponds to the severely obese group (SOG; n = 18), orange line to the moderately obese group (MOG; n = 17), and grey line to the normal-weight group (NWG; n = 13). Significant difference between SOG and MOG. *1 Significant difference between SOG and NWG. *2 Significant difference between MOG and NWG. # Significant speed × group interaction effect.
Nutrients 13 04546 g002
Figure 3. Recovery (%) (A), phase shift (°) (B), amplitude (Wk·Wp−1) (C), net locomotor efficiency (NetE; %) (D) as a function of the walking speed. Values are mean ± SD. The blue line corresponds to the severely obese group (SOG; n = 18), orange line to the moderately obese group (MOG; n = 17), and solid grey line to the normal-weight group (NWG; n = 13). *1 Significant difference between SOG and NWG. *2 Significant difference between MOG and NWG. # Significant speed × group interaction effect.
Nutrients 13 04546 g003
Table 1. Participant’s characteristics across groups.
SOG
n = 18
(4 M, 14 W)
MOG
n = 17
(2 M, 15 W)
NWG
n = 13
(5 M, 8 W)
Variables
Age, years37.2 ± 7.8 *l32.4 ± 7.529.5 ± 5.7
Height, m1.66 ± 0.07 *l1.72 ± 0.071.70 ± 0.08
BMI, kg·m−240.1 ± 4.4 *l32.2 ± 1.5 *222.0 ± 1.5
Body mass, kg109.7 ± 12.74 *l95.28 ± 8.23 *264.21 ± 8.35
Lean body mass, kg53.8 ± 7.6 50.6 ± 7.7
Fat body mass, kg53.1 ± 11.5 41.8 ± 4.6
Fat body mass, %49.3 ± 6.4 45.4 ± 5.0
Head and trunk mass, kg54.2 ± 6.7 44.1 ± 5.237.1 ± 4.8
Upper limbs mass, kg12.2 ± 1.6 10.4 ± 1.43.21 ± 0.4
Lower limbs mass, kg38.4 ± 6.4 36.0 ± 4.210.3 ± 1.3
Lower limbs lean mass, kg19.1 ± 3.318.9 ± 3.0
Lower limbs fat mass, kg17.3 ± 5.816.0 ± 3.4
Lower limbs fat mass, %45.2 ± 9.045.8 ± 7.6
SMR, W132.5 ± 18.23 *l112.85 ± 19.7112.32 ± 12.53
SMR/kg, W·kg−1 body mass1.21 ± 0.13 *11.18 ± 0.15 *21.76 ± 0.15
Values are mean ± SD. Significant difference between SOG and MOG. *1 Significant difference between SOG and NWG. *2 Significant difference between MOG and NWG.—not made for NWG. BMI, body mass index; M, men; MOG, moderately obese group (class I: n = 17); NWG, normal-weight group (n = 12); SMR, absolute standing metabolic rate; SMR/kg, relative standing metabolic rate; SOG, severely obese group (class III: n = 8; class II: n = 10); W, women.
Table 2. Spatiotemporal parameters and vertical and lateral displacements of the center of mass at the experimental walking speeds.
VariablesStep Length, m Step Length/HeightStep Frequency, Hz *1COMv, cmCOMl, cm *1
0.56 m·s−1
SOG0.43 ± 0.040.26 ± 0.031.29 ± 0.132.06 ± 0.307.61 ± 2.55
MOG0.47 ± 0.050.28± 0.041.20 ± 0.141.88 ± 0.366.61 ± 1.75
NWG0.47 ± 0.020.28 ± 0.021.17 ± 0.141.98 ± 0.296.09 ± 1.20
0.83 m·s−1
SOG0.54 ± 0.030.33 ± 0.021.54 ± 0.102.95 ± 0.425.50 ± 1.66
MOG0.57 ± 0.030.33 ± 0.031.47 ± 0.092.57 ± 0.394.79 ± 1.27
NWG0.56 ± 0.020.33 ± 0.011.48 ± 0.062.81 ± 0.524.23 ± 0.81
1.11 m·s−1
SOG0.63 ± 0.030.38 ± 0.021.76 ± 0.083.80 ± 0.514.26 ± 1.32
MOG0.66 ± 0.030.38 ± 0.021.70 ± 0.083.33 ± 0.433.73 ± 0.89
NWG0.64 ± 0.020.38 ± 0.011.71 ± 0.063.52 ± 0.693.10 ± 0.68
1.39 m·s−1
SOG0.71 ±.0.030.43 ± 0.021.94 ± 0.094.47 ± 0.623.30 ± 0.79
MOG0.75 ± 0.030.44 ± 0.021.86 ± 0.084.08 ± 0.452.95 ± 0.51
NWG0.73 ± 0.030.43 ± 0.011.88 ± 0.074.14 ± 0.862.66 ± 0.71
1.67 m·s−1
SOG0.79 ± 0.040.48 ± 0.022.09 ± 0.105.29 ± 0.842.84 ± 0.72
MOG0.83 ± 0.030.48 ± 0.022.02 ± 0.084.88 ± 0.692.51 ± 0.45
NWG0.81 ± 0.030.48 ± 0.012.04 ± 0.084.84 ± 0.982.34 ± 0.53
Values are mean ± SD. Significant difference between SOG and MOG. *1 Significant difference between SOG and NWG. *2 Significant difference between MOG and NWG. COMl, lateral displacements of the center of mass; COMv, vertical displacements of the center of mass; MOG, moderately obese group (class I: n = 17); NWG, normal-weight group (n = 13); SOG, severely obese group (class III: n = 8; class II: n = 10).
Table 3. Explained variance and loadings above the cutoff of different variables on each PC at 0.56, 0.83, 1.11, and 1.39 m·s−1.
PC1PC2PC3
0.56 m·s−1
Explained variance, %44.221.519.3
Variables
Body mass0.96
Walking efficiencyWext0.87
NetCw0.80
Pendulum-like characteristicsRecovery 0.98
COMl 0.75
Step frequency −0.74
0.83 m·s−1
Explained variance, %44.122.717.7
Variables
Walking efficiencyBody mass0.93
Wext0.92
NetCw0.84
Pendulum-like characteristicsRecovery 0.92
COMl 0.59
Step frequency 0.92
1.11 m·s−1
Explained variance, %40.729.817.0
Variables
Walking efficiencyWext0.95
Body mass0.89
NetCw0.82
Pendulum-like characteristicsRecovery 0.87
COMl 0.83
Step frequency 0.99
1.39 m·s−1
Explained variance, %37.233.0
Variables
Walking efficiencyWext0.98
Body mass0.79
NetCw0.77
Pendulum-like characteristicsRecovery 0.92
COMl 0.76
Step frequency
COMl, lateral displacements of the center of mass; NetCw, absolute net energy cost of walking; PC, principal component (1, 2, and 3, respectively); Wext, absolute external mechanical work.
Table 4. Comparison of PC scores between groups at 0.56, 0.83, 1.11, and 1.39 m·s−1.
SOGMOGNWG
0.56 m·s−1
PC10.85 ± 0.58 *10.08 ± 0.58 *2−1.28 ± 0.36
PC20.37 ± 0.76−0.45 ± 1.260.08 ± 0.70
PC3−0.13 ± 1.360.07 ± 0.870.09 ± 0.50
0.83 m·s−1
PC10.81 ± 0.55 *10.10 ± 0.70 *2−1.25 ± 0.36
PC20.30 ± 0.89−0.22 ± 1.17−0.14 ± 0.86
PC30.36 ± 1.18−0.26 ± 0.94−0.16 ± 0.67
1.11 m·s−1
PC10.88 ± 0.74 *1−0.09 ± 0.61 *2−1.10 ± 0.42
PC20.28 ± 1.09 *10.16 ± 1.09 *2−0.59 ± 0.60
PC30.35 ± 1.04−0.33 ± 1.01−0.05 ± 0.82
1.39 m·s−1
PC10.82 ± 0.65 *1−0.01 ± 0.76 *2−1.13 ± 0.38
PC20.37 ± 1.09 *10.05 ± 0.970.58 ± 0.65
Significant difference between SOG and MOG. *1 Significant difference between SOG and NWG. *2 Significant difference between MOG and NWG. MOG, moderately obese group; NWG, normal-weight group; PC, principal component (1, 2, 3); SOG, severely obese group.
Publisher’s Note: MDPI stays neutral with regard to jurisdictional claims in published maps and institutional affiliations.

