1. Introduction
Fasting and postprandial hypertriglyceridemia (HTG) affects approximately 20% of the adult population in industrialized countries [
1,
2,
3] and represents an established risk factor for atherosclerosis and acute pancreatitis [
4,
5,
6,
7]. Numerous studies indicate that subjects with elevated triglycerides have an increased risk for cardiovascular events compared to their respective normotriglyceridemic counterparts [
6,
8,
9,
10]. Data derived from Mendelian randomization studies indicate that this association is causal in nature [
11,
12]. Hypertriglyceridemia is usually classified on the basis of fasting triglyceride levels, although most people following a typical eating pattern of three or more meals a day are on average in a postprandial state for 20 out of 24 h [
13,
14]. Furthermore, studies suggest that postprandial hypertriglyceridemia in particular increases the risk of myocardial infarction [
15,
16]. In clinical practice, HTG is diagnosed if fasting triglycerides are above 150 mg/dL (1.7 mmol/L) and can be subdivided into mild to moderate HTG (150–1000 mg/dL; 1.7–11.4 mmol/L) and severe HTG (>1000 mg/dL; >11.4 mmol/L) [
5].
For postprandial triglycerides, such cut-off values are not established, although postprandial triglycerides in normolipidemic subjects (unlike in HTG where massive increases can be observed) rarely exceed 400 mg/dL [
5]. This lack of threshold values to diagnose and classify postprandial HTG also reflects the fact that the evaluation of postprandial lipid metabolism is not standardized and test meals differing in fat content, fat composition, and the content of other macronutrients (carbohydrates and/or protein) are used to evaluate postprandial lipid metabolism.
Considering that postprandial hypertriglyceridemia is a relevant residual risk factor for cardiovascular disease, it seems obvious to evaluate whether lipid modifying interventions also affect postprandial lipid metabolism. Such studies have been performed for statins [
17,
18], fibrates [
19], ezetimibe [
20], proprotein convertase subtilisin/kexin type 9 (PCSK9) inhibitors [
21], and niacin [
22,
23], generally showing that these drugs affect postprandial lipid metabolism in a positive way. However, studies on the effect of dietary interventions on postprandial lipid metabolism are sparse.
Medium chain triglycerides (MCT) and medium chain fatty acids (MCFA; C-6–C-12) are metabolized differently from long-chain triglycerides (LCT) and long-chain fatty acids (LCFA; >C-14). While LCT are hydrolyzed in the intestine, “packed” into chylomicrons, and subsequently secreted into the lymph, from where they reach the circulation, MCFA directly enter portal blood and are transported to the liver [
24]. MCT therefore cause significantly lower postprandial triglyceridemia than LCT and are used for prevention in HTG-induced acute pancreatitis and other gastrointestinal diseases like pancreatic insufficiency or short bowel syndrome [
25]. While MCT are established in the treatment of severe HTG, little data is available for patients with mild to moderate HTG and healthy subjects.
We evaluated postprandial triglyceride metabolism after an oral fat-meal with either MCFA, saturated fatty acids (SFA) or monounsaturated fatty acids (MUFA) in normolipidemic subjects and patients with mild to moderate HTG.
2. Materials and Methods
The study was registered at ClinicalTrials.gov (NCT03846908) and performed between November 2018 and February 2020 at the University of Munich Medical Center.
Subjects: The study was planned to include five healthy normolipidemic subjects (controls) and ten mildly to moderately hypertriglyceridemic patients. Due to the COVID-19 pandemic, the study was terminated prematurely and only eight patients and five controls completed the study.
Patients were screened for mild to moderate HTG (inclusion criterion: casual fasting triglycerides 150–900 mg/dL (1.7–10.3 mmol/L) over a minimum period of three months and measured on at least two and up to four occasions; if triglycerides were outside the acceptable range at any time point, patients were not recruited). Key exclusion criteria were evidence of alcohol or drug abuse, diabetes mellitus, clinically relevant atherosclerotic disease, kidney (glomerular filtration rate < 60 mL/min) or liver disease of any etiology, uncontrolled thyroid disease or any other endocrine disease, acute or chronic inflammatory disease, any active malignancy, major surgical interventions within three months or planned, current or previous (3 months) treatment with antidiabetic or lipid lowering drugs, or a BMI over 35 kg/m2.
Healthy, normolipidemic controls were screened for normal fasting lipids (triglycerides 50–150 mg/dL; LDL-cholesterol < 190 mg/dL), with key exclusion criteria being any acute or chronic disease except medically controlled hypothyroidism (stable dose of L-thyroxine > 3 months) and any ongoing medication except contraception.
Study design: All participating subjects received three different isocaloric fat-meals on separate occasions in a randomized sequence (simple randomization, performed by KGP), spaced 7 to 28 days apart. Each fat-meal contained 80 g (absolute amount) of either MCT oil (Kanso
®-nutrition. Dr Schär AG, Burgstall, Italy), SFA (Butaris
®, Uelzena eG, Uelzen, Germany; commercially available butter fat), or MUFA (Rapso
®, Rapso GmbH, Aschach, Austria; commercially available rapeseed oil), and was dissolved in a standardized “fat-shake” solution consisting of 100 mL water, 9 g de-oiled cacao-powder, one teaspoon of Stevia, and optionally 3.5 g of soluble coffee powder. Details of the test meals are shown in
Table 1.
Subjects were blinded as to the fat-meal they received and no differences in taste were reported. Subjects were instructed to abstain from any alcohol consumption (for 2 days) and sports (for 1 day), and to consume an identical dinner in the evening prior to each test-meal in order to ensure comparable baseline values. During the 10 h testing period only water and unsweetened tea were consumed.
Methods: Using standard ethylenediaminetetraacetic acid (EDTA) and serum tubes (Sarstedt), blood samples were drawn in the fasting state (0 h) and after 1, 2, 4, 6, 8, and 10 h (EDTA; lipid parameters), and 1, 2, and 6 h (serum; insulin) after consumption of the fat-meal. Plasma/serum was obtained by centrifugation.
The analytical methods have been described in detail before [
17]. In short, plasma samples were over-layered with a solution of d = 1.006 g/mL and ultra-centrifuged for 20 min at 20,000 rpm to isolate chylomicrons in the supranatant. Chylomicron triglycerides were then measured with a standard photometric kit. The infranatant was then again overlayered (d = 1.006 g/mL) and ultra-centrifuged for 18 h at 50,000 rpm in order to isolate chylomicron remnants (CR)/very low density lipoproteins (VLDL) in the supranatant and low density lipoproteins (LDL) as well as high density lipoproteins (HDL) in the infranatant. For ultracentrifugation, a Beckman Coulter ultracentrifuge was used.
Cholesterol, total triglycerides, apoB, and glucose were determined with standard photometric kits in plasma. Likewise, VLDL-cholesterol and CR/VLDL-triglycerides were measured in the supranatant, while HDL-and LDL-cholesterol were determined from the infranatant after precipitation with heparin and manganese chloride.
Postprandial metabolism was quantified by calculating the area under the curve (AUC) and the incremental AUC (iAUC) for plasma-, chylomicron-and CR/VLDL-triglycerides. Concentrations obtained over the 10-h period following the ingestion of the fat-meal were used for this calculation as described before [
17,
18]. The iAUC was determined as the area between the plasma concentration and a baseline or fasting concentration observed either at 0 h (if the 10 h value was greater or equal to the 0 h value) or 0 h and 10 h (if the 10 h value was smaller than the 0 h value). The iAUC represents the increase in area above fasting concentrations, resulting from the response to the fat load.
Statistical analysis: Sample size calculation indicated that 10 subjects are sufficient to identify significant differences between the MCT meal and the other fat-meals (effect size 0.9, power 0.8, α 0.5). Differences between parameters obtained during the test meals containing the different fats were evaluated by paired t-test analysis, while differences between the same parameters and the same fat-meal between mildly to moderately hypertriglyceridemic patients and normolipidemic subjects were evaluated by one way analysis of variance (ANOVA). Associations between variables were identified with the Pearson’s product moment correlation coefficient. Values are shown as mean ± standard deviation unless indicated otherwise. All statistical tests were performed using SPSS. Inc. software (SPSS. Inc., Chicago, IL, USA). The critical p value for significance was set at 0.05.
3. Results
The characteristics of the participating subjects and patients are shown in
Table 2. Patients and controls differed significantly on parameters such as body mass index (BMI), fasting triglycerides and HDL-cholesterol.
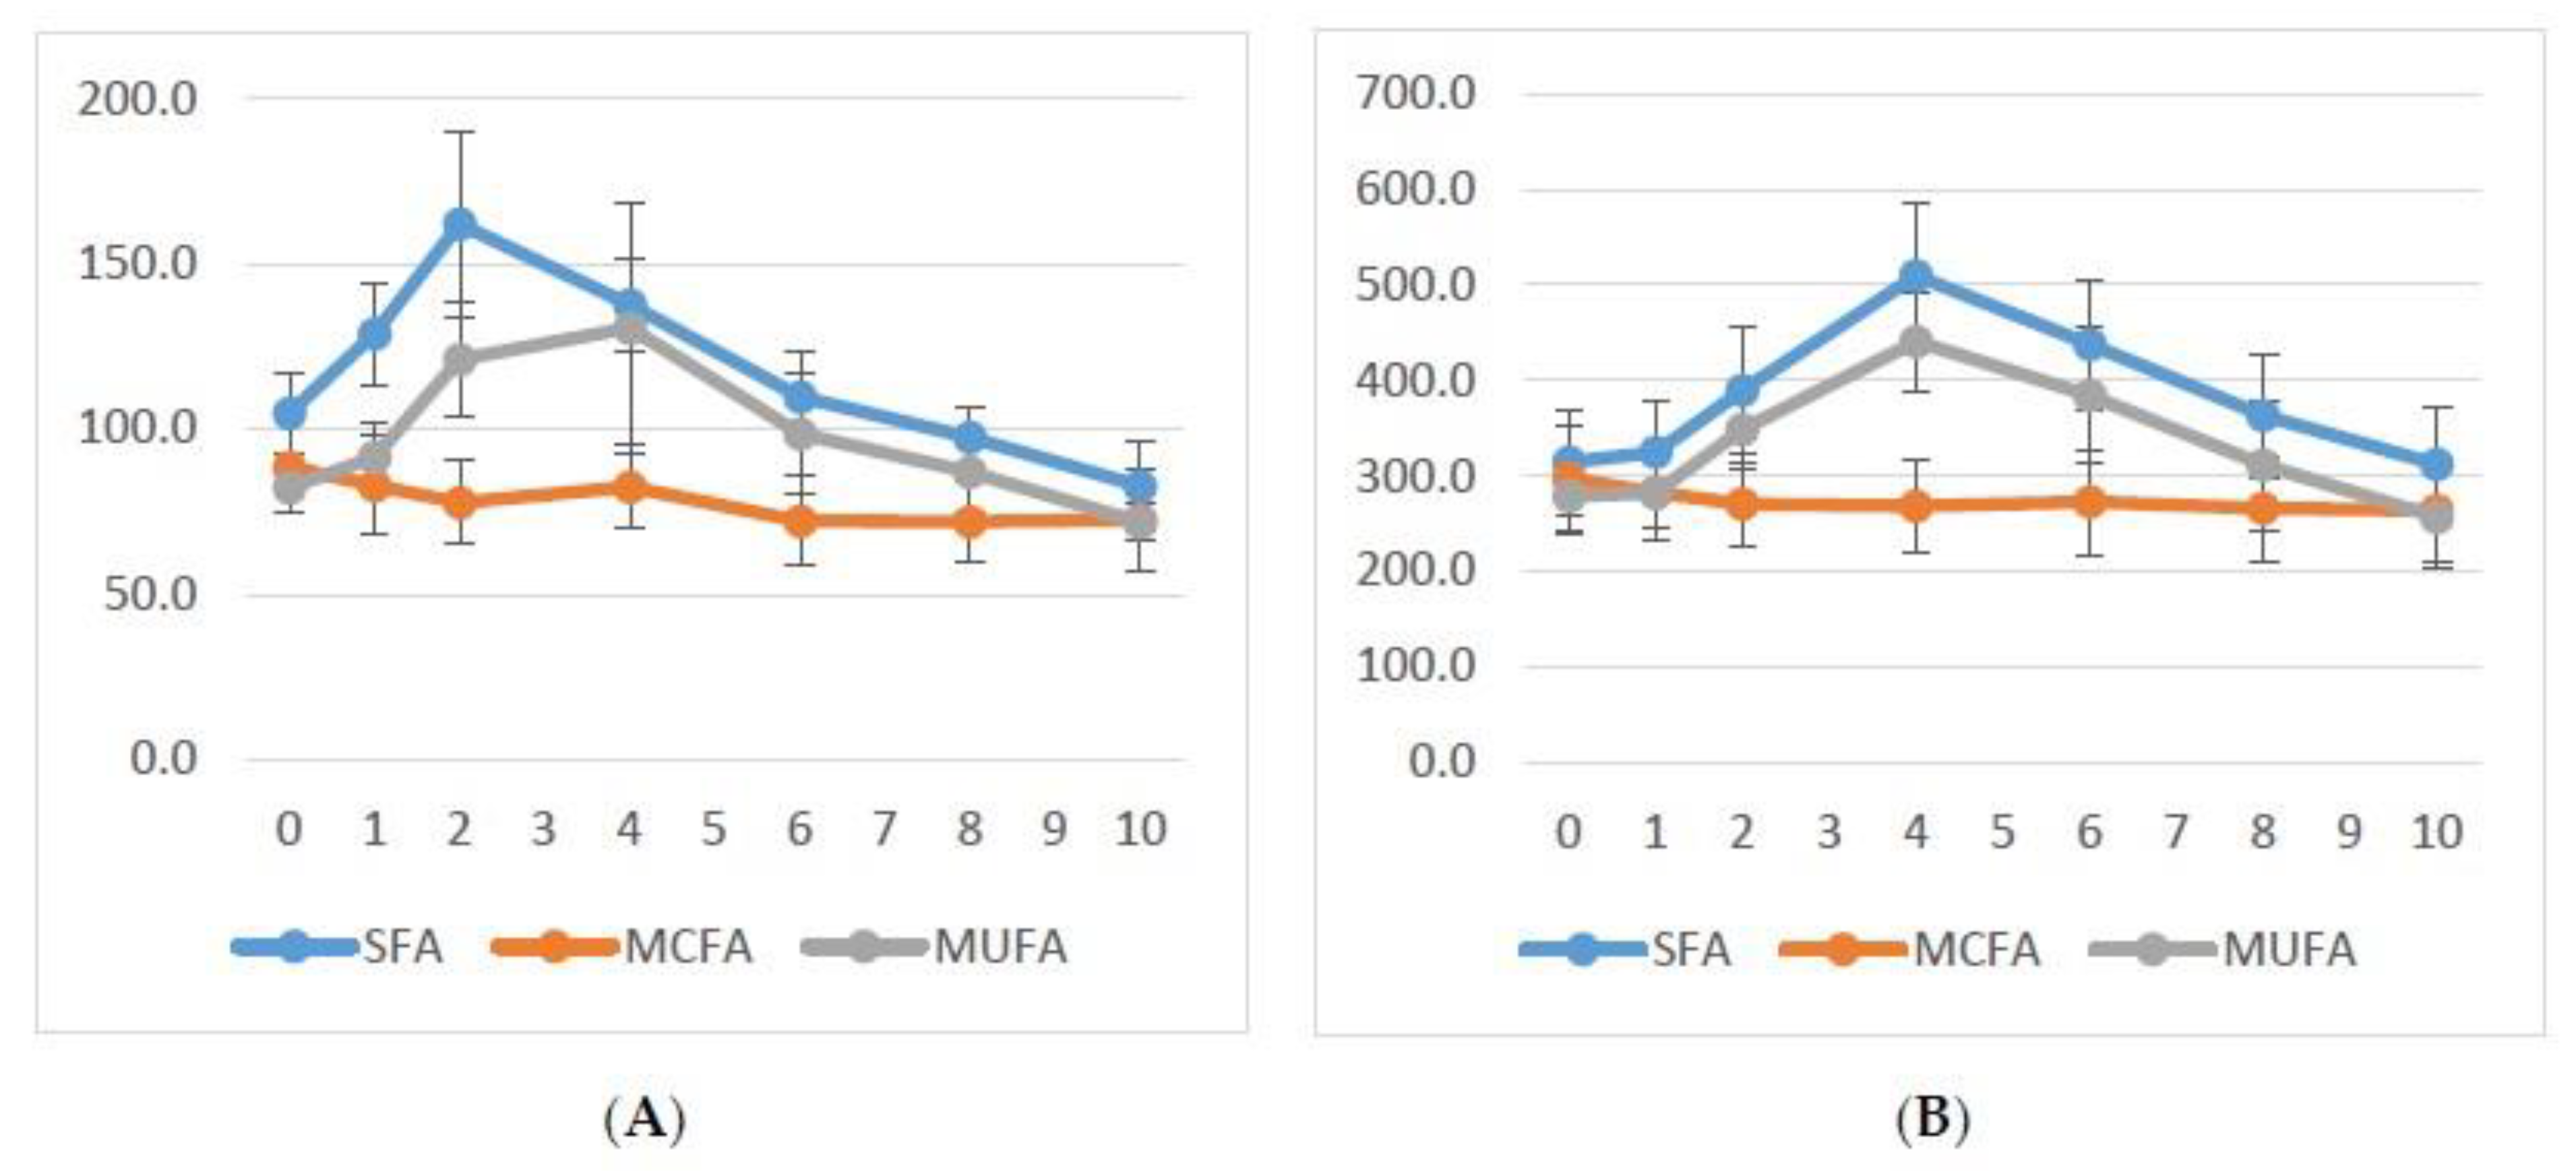
Mean triglyceride levels over time following each meal are shown in
Figure 1 (panel A normolipidemic subjects; panel B mildly to moderately hypertriglyceridemic patients). In both groups, on average no postprandial elevation of mean plasma triglyceride levels is observed if the test meal contains MCFA as fat, while comparable elevations of triglycerides are seen with test meals containing SFA or MUFA.
The mean incremental area under the curve (iAUC) for total triglycerides is shown in
Figure 2 (panel A normolipidemic controls; panel B hypertriglyceridemic patients). For hypertriglyceridemic patients, the mean iAUC following the MCFA fat-meal is 152 mg*h/dL, and therefore significantly lower than for both SFA (1006 mg*h/dL;
p = 0.03) and MUFA (962 mg*h/dL;
p < 0.01). There is no significant difference between SFA and MUFA (
p = 0.87). For normolipidemic controls, the mean iAUC following the MCFA fat-meal is 3 mg*h/dL and therefore lower than for both SFA (247 mg*h/dL;
p = 0.025) and MUFA (248 mg*h/dL;
p = 0.14). Again, there is no significant difference between SFA and MUFA (
p = 0.91).
Hypertriglyceridemic patients peaked significantly higher than normolipidemic controls in terms of absolute plasma triglyceride levels and in terms of increase from 0 h baseline, but not in terms of percentage increase from 0 h baseline. When comparing hypertriglyceridemic patients to normolipidemic controls following both SFA and MUFA fat-meals, the iAUC for patients is significantly higher than for the normolipidemic controls (SFA: p = 0.019; MUFA: p = 0.05), while there is no significant difference for the mean iAUC for MCFA (p = 0.252).
Table 3 summarizes all parameters for hypertriglyceridemic patients and normolipidemic controls. No significant differences between an SFA and MUFA fat-meals were observed for either subject group. When comparing hypertriglyceridemic patients to normolipidemic controls following an MCFA fat-meal, we only found significant differences for the AUC of total triglycerides and CR/VLDL triglycerides and the absolute peak of triglycerides, while all iAUC parameters and the AUC for chylomicron triglycerides did not differ significantly.
Mean plasma chylomicron triglyceride levels over time (not shown) resemble those of total triglycerides on a smaller scale and the iAUC also roughly resembles the pattern described above for total triglycerides. Patients have a higher chylomicron triglyceride AUC than normolipidemic controls (significant for MUFA and approaching significance for SFA).
Total cholesterol, HDL-cholesterol, LDL-cholesterol, VLDL-cholesterol and apoB generally fluctuated slightly around fasting levels during the 10 h period.
While there is no significant difference (
p = 0.15) for the HOMA-IR index between mildly to moderately hypertriglyceridemic patients and normolipidemic controls, patients on average had a HOMA-IR-index of 5.6 with a relatively high variability, while controls were in the normal range (
Table 2). Following any fat-meal (SFA, MCFA, and MUFA), we observed a similar postprandial insulin peak after 1–2 h and a subsequent return to fasting levels. Glucose levels decreased slightly over the 10 h period in a similar fashion for both patients and controls.
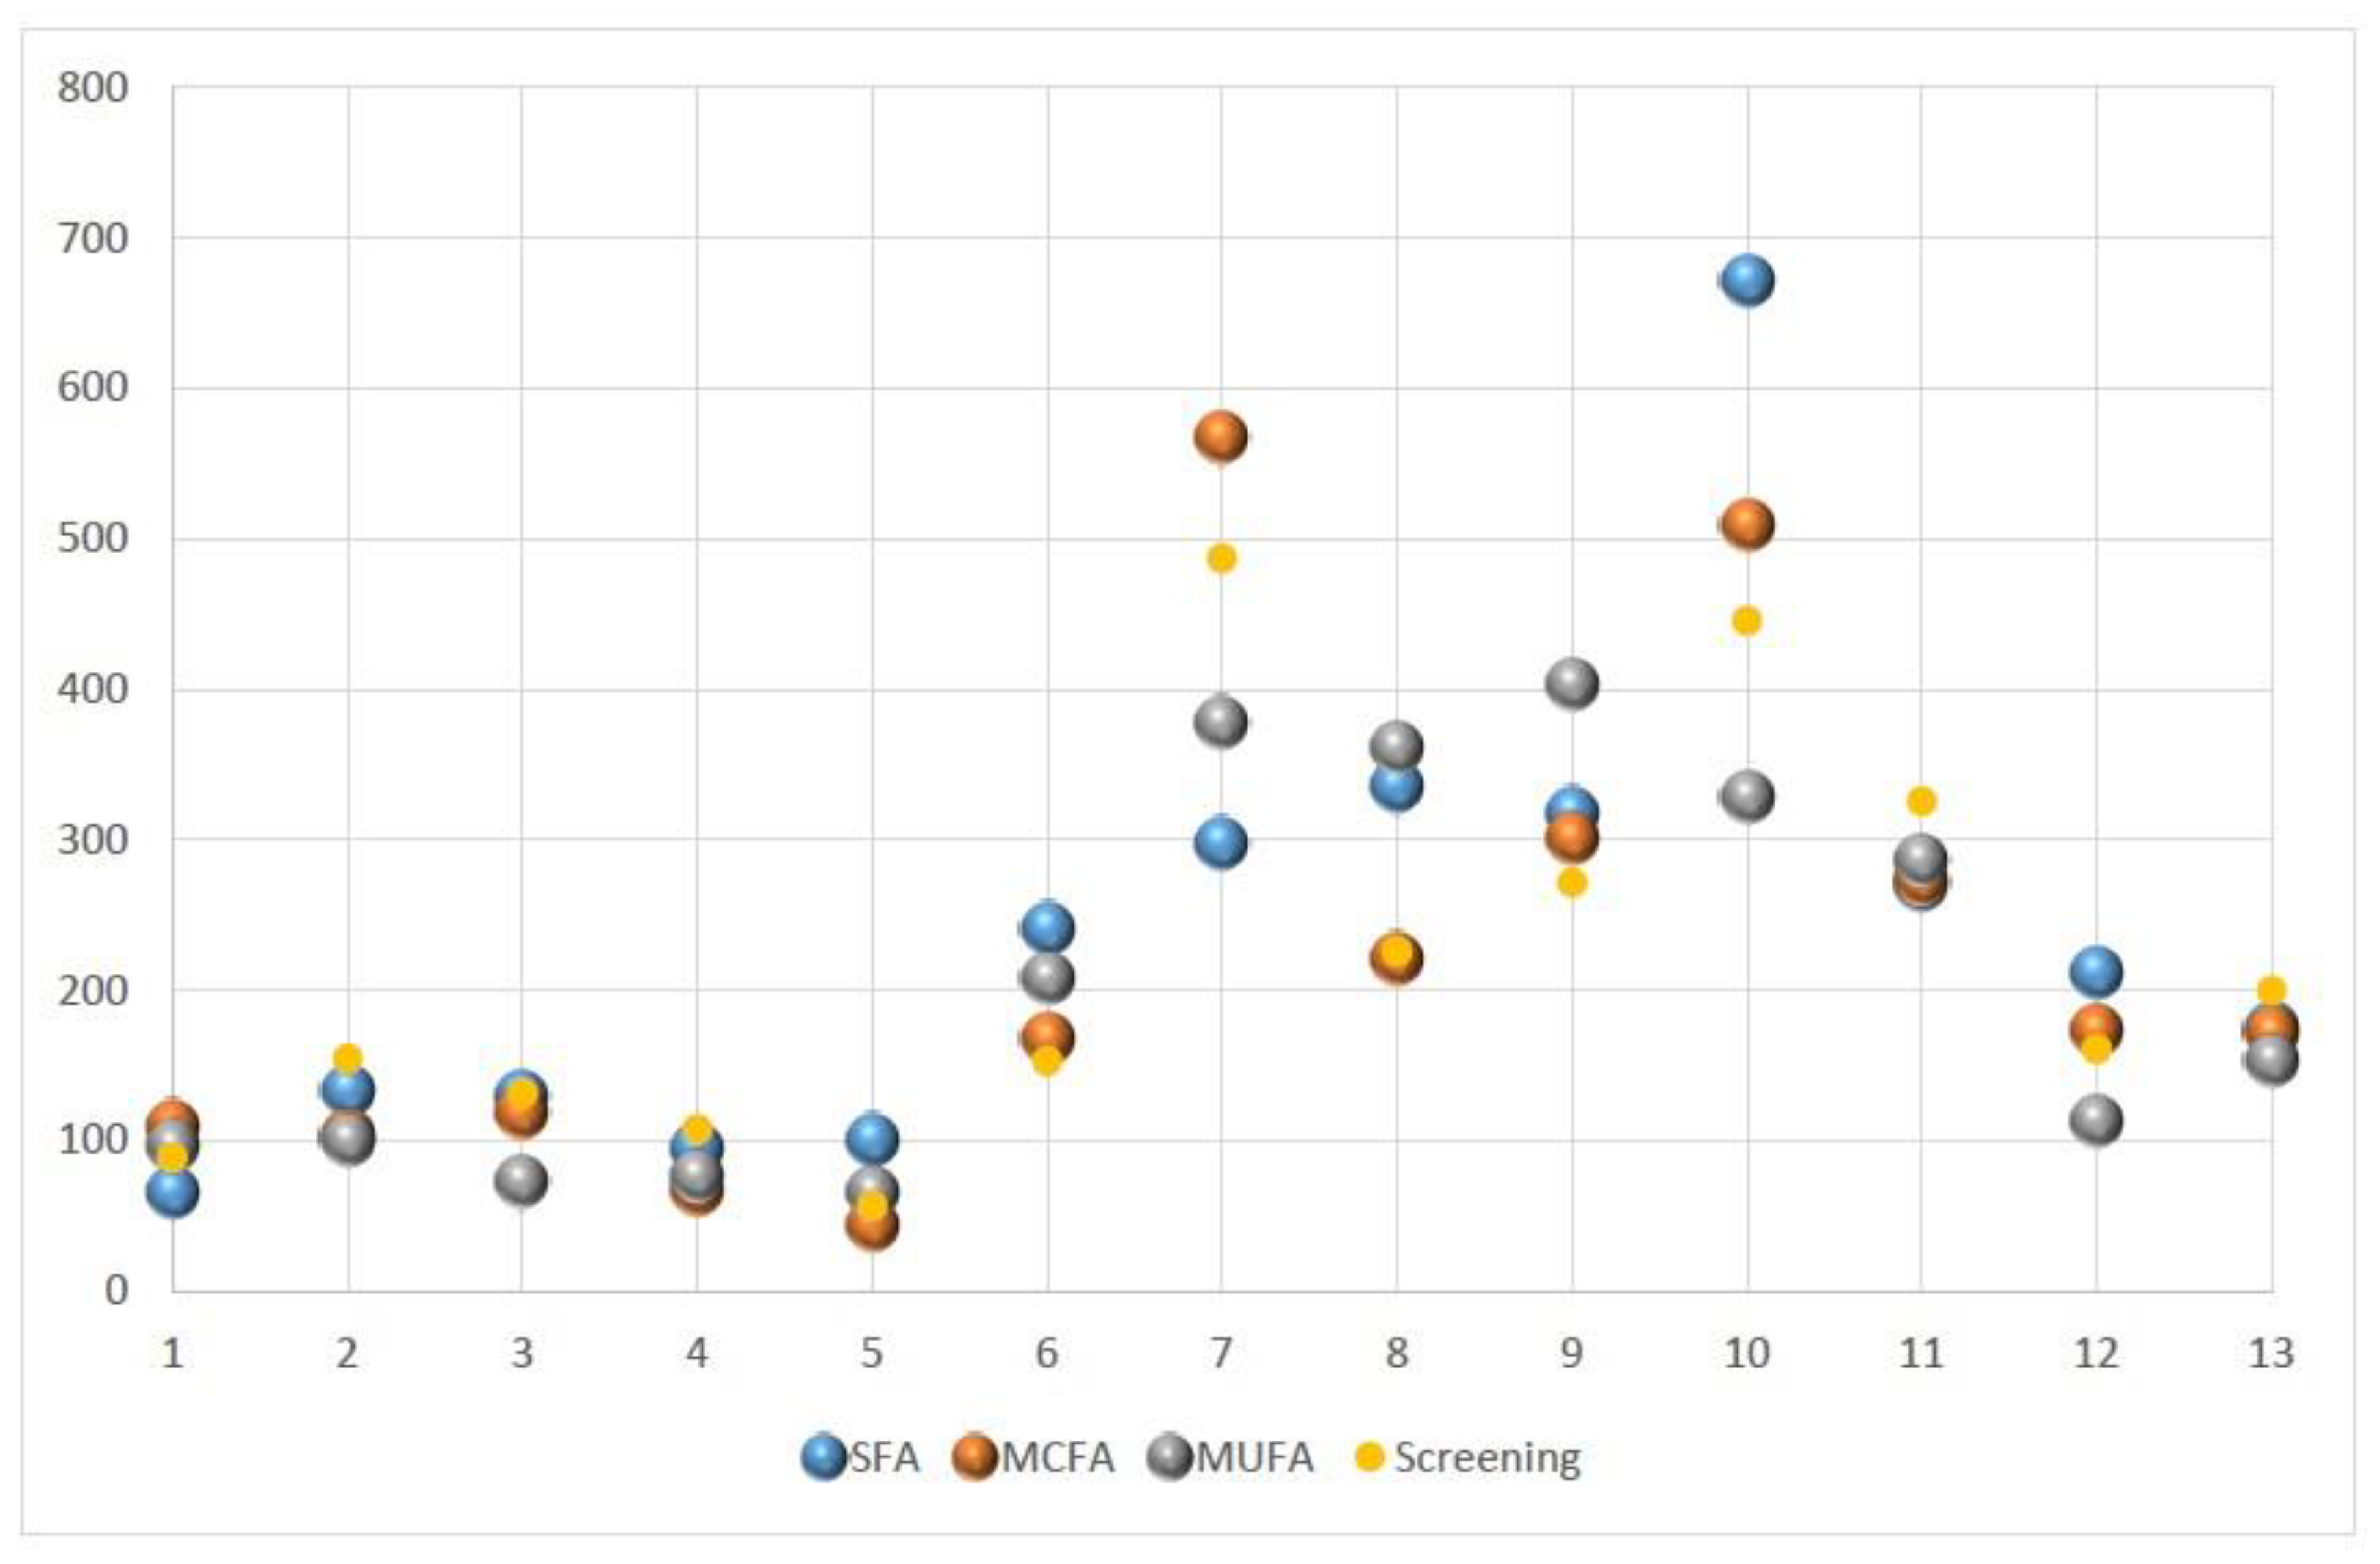
Figure 3 shows fasting triglyceride levels for all subjects obtained prior to the three test-meals and during screening. The fasting triglyceride values for both hypertriglyceridemic patients and normolipidemic controls varied considerably.
Generally, subjects tolerated the fat-meals well, although some gastrointestinal symptoms such as soft or watery stool, stomach pain, or cramps and nausea were reported following the fat challenge. Symptoms were mostly mild and transient but were more frequent and pronounced for MCFA than for MUFA and SFA.
4. Discussion
In this study, we compared and quantified the effects of different LCT (SFA, MUFA) and MCT oil-meals on postprandial lipid metabolism for normolipidemic subjects and mildly to moderately hypertriglyceridemic patients under standardized conditions. Our results show that by substituting an experimental LCT fat-meal with an isocaloric MCT fat-meal, postprandial plasma triglycerides can be significantly reduced, in particular for patients with mild to moderate hypertriglyceridemia.
While both “healthy” (MUFA) as well as “unhealthy” (SFA) LCT-fat-meals lead to a sizeable and significant increase of postprandial plasma triglycerides, an MCT fat-meal does not cause any significant elevation of postprandial plasma triglycerides. This holds equally for both normolipidemic subjects and mildly to moderately hypertriglyceridemic patients. However, the effect of an LCT fat-meal is significantly more pronounced for hypertriglyceridemic patients than for normolipidemic controls: in mildly to moderately hypertriglyceridemic patients, AUC (“postprandial triglyceride load”) is about three times, while iAUC (“postprandial triglyceride elevation”) is approximately four times that of normolipidemic subjects. The “postprandial part” of hypertriglyceridemia, therefore, is much more pronounced than would intuitively be expected by looking at elevated fasting triglyceride levels alone. In contrast, after an MCT fat-meal there is no significant difference in the plasma triglyceride iAUC between normolipidemic subjects and mildly to moderately hypertriglyceridemic patients.
Our results are in line with the fact that LCT are metabolized differently from MCT, as MCFA bypass chylomicron formation and enter the portal bloodstream directly [
24]. This is also reflected in the near zero iAUC for chylomicron triglycerides, in the significantly lower chylomicron AUC that we observed after an MCT oil-meal, and in a largely parallel chylomicron-and total-triglyceride curve (not shown).
Even patients with only mild to moderate fasting hypertriglyceridemia experience a considerable postprandial increase in plasma triglycerides over an extended period of time, after ingesting a standardized LCT fat-meal. This is not the case following an MCT fat-meal. The fact that patients had a higher AUC for total triglycerides and CR/VLDL triglycerides following the MCT fat-meal can be attributed to the higher fasting/baseline levels.
Fasting triglycerides also correlated significantly and positively with absolute postprandial increase in triglycerides but not with percentage increase for both LCT conditions (SFA: r = 0.77, p = 0.002; MUFA: 0.55, p = 0.05).
Figure 2 and
Table 3 show that the iAUC for plasma triglycerides and most of the secondary parameters differ considerably between LCT (SFA and MUFA) on the one hand and MCFA on the other. In our normolipidemic subject group, significance can be demonstrated when comparing SFA to MCFA, but not when comparing MUFA to MCFA. This lack of significance may relate to the small sample size.
There is a consistent trend in the data of both subject groups for almost all examined triglyceride parameters to be smallest after an MCT fat-meal and largest after an SFA fat-meal. The values for triglyceride parameters after a MUFA fat-meal are mostly in between but tend to be more similar to the values of the SFA condition. However, as mentioned above, none of the differences between MUFA and SFA are significant.
The fact that HOMA-IR and fasting insulin where higher and more variable in the patient group indicates that some of the patients were insulin-resistant, which is to be expected in a group of patients suffering from mild to moderate hypertriglyceridemia. However, it should be noted that HOMA-IR is only a crude estimate of insulin sensitivity. The carbohydrate independent postprandial insulin response (similar for all three test meals) is probably mediated by the protein content of the test meals and gastro-intestinal hormones, the secretion of which were stimulated by the ingested volume.
By using standardized and isocaloric fat-meals, only differing in the type of fatty acid, we were able to demonstrate their differential postprandial triglyceride effects on triglyceride metabolism following a single pure-fat-meal. It is unclear whether regular consumption of MCT (replacement of LCT in daily diet) will only affect postprandial triglyceride levels or also decrease fasting triglyceride levels.
It is noteworthy that we observed a relatively high within subject variability of fasting triglyceride levels (
Figure 3), given the fact that we made an effort to minimize/standardize potential known confounders such as sport, alcohol, and food consumption in the days prior to each test-meal.
A limitation of our study is the small subject number, which was further reduced by the COVID-19 pandemic. Due to the small subject number we are unable to provide data on subgroups (by gender, age, BMI, etc.) and more importantly can make no reliable statements on potential differences between MUFA and SFA. Furthermore, it is unclear whether the results would be identical if a mixed meal was used (instead of a pure fat challenge) and it is unclear (although likely) whether the results can be extrapolated to subjects with more severe hypertriglyceridemia. Finally, in the real world, meals are a mixture of different nutrients and interaction between fatty acids and other nutritional aspects (macro-nutrients or caloric balance) may limit the applicability of the study findings to clinical settings.
To conclude, mildly to moderately hypertriglyceridemic patients experience a considerable and, compared to normolipidemic controls, much more pronounced postprandial increase of plasma triglycerides after a single LCT fat-meal. This is not the case after an isocaloric MCT fat-meal. Patients with mild to moderate hypertriglyceridemia may therefore benefit from a substitution of LCT-fats with MCT-fats in their diet, but the mid-to long term effects of such a substitution on both fasting and postprandial lipid parameters should be explored in future trials.
Author Contributions
Conceptualization, K.G.P. and E.W.; methodology, K.G.P. and A.F.; software, A.F. and J.A.; validation, K.G.P.; formal analysis, A.F. and J.A.; investigation, J.A. and K.H.; resources, K.G.P.; data curation, A.F. and J.A.; writing—original draft preparation, A.F. and E.W.; writing—review and editing, K.G.P., A.F., E.W., J.A., and K.H.; visualization, A.F. and J.A.; supervision, K.G.P.; project administration, K.G.P.; funding acquisition, K.G.P. All authors have read and agreed to the published version of the manuscript.
Funding
This work was funded by an unrestricted research grant from Schär A.G. (Burgstall, Italy) to K.G.P.
Institutional Review Board Statement
The study was conducted according to the guidelines of the Declaration of Helsinki, and approved by the Institutional Review Board (or Ethics Committee) of the Faculty of Medicine of the University of Munich (protocol code 18-844, 21 January 2019).
Informed Consent Statement
Informed consent was obtained from all subjects involved in the study.
Acknowledgments
We thank patients and control subjects for participating in the study.
Conflicts of Interest
A.F., E.W., J.A., and K.H. have nothing to declare; K.G.P. has received honoraria for presentations from Schär. The funders had no role in the design of the study, the collection, analyses, or interpretation of data, the writing of the manuscript, or in the decision to publish the results.
References
- Fan, W.; Philip, S.; Granowitz, C.; Toth, P.P.; Wong, N.D. Prevalence of US Adults with Triglycerides >/= 150 mg/dl: NHANES 2007–2014. Cardiol. Ther. 2020, 9, 207–213. [Google Scholar] [CrossRef] [Green Version]
- Retterstol, K.; Narverud, I.; Selmer, R.; Berge, K.E.; Osnes, I.V.; Ulven, S.M.; Halvorsen, B.; Aukrust, P.; Holven, K.B.; Iversen, P.O. Severe hypertriglyceridemia in Norway: Prevalence, clinical and genetic characteristics. Lipids Health Dis. 2017, 16, 115. [Google Scholar] [CrossRef] [Green Version]
- Ruiz-Garcia, A.; Arranz-Martinez, E.; Lopez-Uriarte, B.; Rivera-Teijido, M.; Palacios-Martinez, D.; Davila-Blazquez, G.M.; Rosillo-Gonzalez, A.; Gonzalez-Posada Delgado, J.A.; Marino-Suarez, J.E.; Revilla-Pascual, E.; et al. Prevalence of hypertriglyceridemia in adults and related cardiometabolic factors. SIMETAP-HTG study. Clin. Investig. Arterioscler. 2020, 32, 242–255. [Google Scholar]
- Jackson, K.G.; Poppitt, S.D.; Minihane, A.M. Postprandial lipemia and cardiovascular disease risk: Interrelationships between dietary, physiological and genetic determinants. Atherosclerosis 2012, 220, 22–33. [Google Scholar] [CrossRef]
- Laufs, U.; Parhofer, K.G.; Ginsberg, H.N.; Hegele, R.A. Clinical review on triglycerides. Eur. Heart J. 2020, 41, 99–109c. [Google Scholar] [CrossRef] [Green Version]
- Mach, F.; Baigent, C.; Catapano, A.L.; Koskinas, K.C.; Casula, M.; Badimon, L.; Chapman, M.J.; De Backer, G.G.; Delgado, V.; Ference, B.A.; et al. 2019 ESC/EAS Guidelines for the management of dyslipidaemias: Lipid modification to reduce cardiovascular risk. Eur. Heart J. 2020, 41, 111–188. [Google Scholar] [CrossRef]
- Parhofer, K.G.; Laufs, U. The Diagnosis and Treatment of Hypertriglyceridemia. Dtsch. Arztebl. Int. 2019, 116, 825–832. [Google Scholar] [CrossRef] [PubMed] [Green Version]
- Arca, M.; Veronesi, C.; D’Erasmo, L.; Borghi, C.; Colivicchi, F.; De Ferrari, G.M.; Desideri, G.; Pontremoli, R.; Temporelli, P.L.; Perrone, V.; et al. Association of Hypertriglyceridemia with All-Cause Mortality and Atherosclerotic Cardiovascular Events in a Low-Risk Italian Population: The TG-REAL Retrospective Cohort Analysis. J. Am. Heart Assoc. 2020, 9, e015801. [Google Scholar] [CrossRef] [PubMed]
- Murad, M.H.; Hazem, A.; Coto-Yglesias, F.; Dzyubak, S.; Gupta, S.; Bancos, I.; Lane, M.A.; Erwin, P.J.; Berglund, L.; Elraiyah, T.; et al. The association of hypertriglyceridemia with cardiovascular events and pancreatitis: A systematic review and meta-analysis. BMC Endocr. Disord. 2012, 12, 2. [Google Scholar] [CrossRef] [PubMed] [Green Version]
- Sandesara, P.B.; Virani, S.S.; Fazio, S.; Shapiro, M.D. The Forgotten Lipids: Triglycerides, Remnant Cholesterol, and Atherosclerotic Cardiovascular Disease Risk. Endocr. Rev. 2019, 40, 537–557. [Google Scholar] [CrossRef] [PubMed] [Green Version]
- Ference, B.A.; Kastelein, J.J.P.; Ray, K.K.; Ginsberg, H.N.; Chapman, M.J.; Packard, C.J.; Laufs, U.; Oliver-Williams, C.; Wood, A.M.; Butterworth, A.S.; et al. Association of Triglyceride-Lowering LPL Variants and LDL-C-Lowering LDLR Variants with Risk of Coronary Heart Disease. JAMA 2019, 321, 364–373. [Google Scholar] [CrossRef] [PubMed] [Green Version]
- Holmes, M.V.; Asselbergs, F.W.; Palmer, T.M.; Drenos, F.; Lanktree, M.B.; Nelson, C.P.; Dale, C.E.; Padmanabhan, S.; Finan, C.; Swerdlow, D.I.; et al. Mendelian randomization of blood lipids for coronary heart disease. Eur. Heart J. 2015, 36, 539–550. [Google Scholar] [CrossRef] [PubMed] [Green Version]
- Nordestgaard, B.G. A Test in Context: Lipid Profile, Fasting Versus Nonfasting. J. Am. Coll. Cardiol. 2017, 70, 1637–1646. [Google Scholar] [CrossRef] [PubMed]
- Nordestgaard, B.G.; Langsted, A.; Mora, S.; Kolovou, G.; Baum, H.; Bruckert, E.; Watts, G.F.; Sypniewska, G.; Wiklund, O.; Boren, J.; et al. Fasting is not routinely required for determination of a lipid profile: Clinical and laboratory implications including flagging at desirable concentration cut-points-a joint consensus statement from the European Atherosclerosis Society and European Federation of Clinical Chemistry and Laboratory Medicine. Eur. Heart J. 2016, 37, 1944–1958. [Google Scholar] [PubMed] [Green Version]
- Eberly, L.E.; Stamler, J.; Neaton, J.D.; Multiple Risk Factor Intervention Trial Research Group. Relation of triglyceride levels, fasting and nonfasting, to fatal and nonfatal coronary heart disease. Arch. Intern. Med. 2003, 163, 1077–1083. [Google Scholar] [CrossRef]
- Nordestgaard, B.G.; Benn, M.; Schnohr, P.; Tybjaerg-Hansen, A. Nonfasting triglycerides and risk of myocardial infarction, ischemic heart disease, and death in men and women. JAMA 2007, 298, 299–308. [Google Scholar] [CrossRef] [Green Version]
- Parhofer, K.G.; Barrett, P.H.; Schwandt, P. Atorvastatin improves postprandial lipoprotein metabolism in normolipidemlic subjects. J. Clin. Endocrinol. Metab. 2000, 85, 4224–4230. [Google Scholar]
- Parhofer, K.G.; Laubach, E.; Barrett, P.H. Effect of atorvastatin on postprandial lipoprotein metabolism in hypertriglyceridemic patients. J. Lipid Res. 2003, 44, 1192–1198. [Google Scholar] [CrossRef] [Green Version]
- Koopal, C.; Marais, A.D.; Westerink, J.; van der Graaf, Y.; Visseren, F.L.J. Effect of adding bezafibrate to standard lipid-lowering therapy on post-fat load lipid levels in patients with familial dysbetalipoproteinemia. A randomized placebo-controlled crossover trial. J. Lipid Res. 2017, 58, 2180–2187. [Google Scholar] [CrossRef] [Green Version]
- Nakamura, K.; Miyoshi, T.; Yunoki, K.; Ito, H. Postprandial hyperlipidemia as a potential residual risk factor. J. Cardiol. 2016, 67, 335–339. [Google Scholar] [CrossRef] [Green Version]
- Burggraaf, B.; Pouw, N.M.C.; Arroyo, S.F.; van Vark-van der Zee, L.C.; van de Geijn, G.M.; Birnie, E.; Huisbrink, J.; van der Zwan, E.M.; Mulder, M.T.; Rensen, P.C.N.; et al. A placebo-controlled proof-of-concept study of alirocumab on postprandial lipids and vascular elasticity in insulin-treated patients with type 2 diabetes mellitus. Diabetes Obes. Metab. 2020, 22, 807–816. [Google Scholar] [CrossRef] [PubMed]
- El Khoury, P.; Waldmann, E.; Huby, T.; Gall, J.; Couvert, P.; Lacorte, J.M.; Chapman, J.; Frisdal, E.; Lesnik, P.; Parhofer, K.G.; et al. Extended-Release Niacin/Laropiprant Improves Overall Efficacy of Postprandial Reverse Cholesterol Transport. Arterioscler. Thromb. Vasc. Biol. 2016, 36, 285–294. [Google Scholar] [CrossRef] [PubMed] [Green Version]
- Investigators, A.-H.; Boden, W.E.; Probstfield, J.L.; Anderson, T.; Chaitman, B.R.; Desvignes-Nickens, P.; Koprowicz, K.; McBride, R.; Teo, K.; Weintraub, W. Niacin in patients with low HDL cholesterol levels receiving intensive statin therapy. N. Engl. J. Med. 2011, 365, 2255–2267. [Google Scholar] [CrossRef] [Green Version]
- Papamandjaris, A.A.; MacDougall, D.E.; Jones, P.J. Medium chain fatty acid metabolism and energy expenditure: Obesity treatment implications. Life Sci. 1998, 62, 1203–1215. [Google Scholar] [CrossRef]
- Jeppesen, P.B.; Mortensen, P.B. The influence of a preserved colon on the absorption of medium chain fat in patients with small bowel resection. Gut 1998, 43, 478–483. [Google Scholar] [CrossRef] [PubMed]
| Publisher’s Note: MDPI stays neutral with regard to jurisdictional claims in published maps and institutional affiliations. |
© 2021 by the authors. Licensee MDPI, Basel, Switzerland. This article is an open access article distributed under the terms and conditions of the Creative Commons Attribution (CC BY) license (https://creativecommons.org/licenses/by/4.0/).


