
Poor Dietary Quality and Patterns Are Associated with Higher Perceived Stress among Women of Reproductive Age in the UK


1
Department of Rehabilitation & Sport Sciences, Faculty of Health & Social Sciences, Bournemouth University, Bournemouth BH8 8GP, UK
2
Centre for Midwifery, Maternal & Perinatal Health, Faculty of Health & Social Sciences, Bournemouth University, Bournemouth BH8 8GP, UK
*
Author to whom correspondence should be addressed.
Nutrients 2021, 13(8), 2588; https://0-doi-org.brum.beds.ac.uk/10.3390/nu13082588
Submission received: 2 July 2021
/
Revised: 24 July 2021
/
Accepted: 26 July 2021
/
Published: 28 July 2021
(This article belongs to the Special Issue Dietary Habits, Beneficial Exercise and Chronic Diseases: Latest Advances and Prospects)
Abstract
:The aim of this study was to investigate the association between stress and diet quality/patterns among women of reproductive age in UK. In total, 244 reproductive aged women participated in an online survey consisting of the European Prospective into Cancer and Nutrition food frequency questionnaire in addition to stress, depression, physical-activity, adiposity, and socioeconomic questions. An a-priori diet quality index was derived by assessing the adherence to Alternate Mediterranean Diet (aMD). A-posteriori dietary-patterns (DPs) were explored through factor analysis. Regression models were used to assess the predictors of the DPs. Participants mainly had medium (n = 113) aMD adherence. Higher stress levels were reported by participants with low aMD adherence. Participants with high aMD adherence were of normal BMI. Factor analysis revealed three DPs: fats and oils, sugars, snacks, alcoholic-beverages, red/processed meat, and cereals (DP-1), fish and seafood, eggs, milk and milk-products (DP-2), and fruits, vegetables, nuts and seeds (DP-3). Regression models showed that DP-1 was positively associated with stress (p = 0.005) and negatively with age (p = 0.004) and smoking (p = 0.005). DP-2 was negatively associated with maternal educational-level (p = 0.01) while DP-3 was negatively associated with stress (p < 0.001), BMI (p = 0.001), and white ethnicity (p = 0.01). Stress was negatively associated with healthy diet quality/patterns among reproductive aged women.
1. Introduction
Increased body weight before pregnancy is associated with higher risk of pregnancy complications [1,2,3,4] and of severe maternal morbidity and mortality [5]. A recent meta-analysis has indicated that a healthy diet is crucial to prevent increased weight gain before and during pregnancy and its related complications (e.g., gestational diabetes, preeclampsia, caesarean section delivery) [6].
There are several predictors of diet quality, one of which is perceived stress. Stress is increasing among people and has been associated with poorer diet quality among women of reproductive age [7,8,9,10,11]. However, most studies have focused on the association between stress and individual foods/food groups. For example, a higher level of psychological stress among women of reproductive age was found to be significantly associated with a greater consumption of fat in their diet [12,13,14,15]. Studies have also found that stress has been associated with decreased intake of fruits and vegetables among women of reproductive age [16,17]. Moreover, higher levels of perceived stress have been found to associate with increased consumption of sweets, fast foods, snacks, and saturated fats and decreased intake of fruits, vegetables, and unsaturated oils [18,19]. However, these studies assessed dietary intake through recall questionnaires that do not include a variety and wide range of food items and food groups; this might predispose participants to misreporting [8,20,21,22,23,24,25]. With respect to the evaluation of diet quality, most studies on stress and diet have included only the a-priori dietary approach (based on measuring adherence to diet index) [12,22,25]. To the best of our knowledge, no study on stress and diet have combined both the a-priori and a-posteriori (based on statistical techniques such as factor analysis) approaches which offer comprehensive insight and characterisation of the diet pattern specific to the population group under investigation. Additionally, the small sample sizes and the lack of representativeness in those studies mean that generalising the results is not possible. Not considering confounding factors such as sociodemographic characteristics and physical activity was also a major limitation of some studies [12,16,24,26,27]. Moreover, most studies on the association between stress and diet were conducted among the general adult population, however evidence is scarce among women of reproductive age (18–49 years old) [26,28,29].
In summary, studies on stress and diet in the literature have several limitations. Investigating the factors that affect diet quality in women of reproductive age has crucial importance especially because diet-related morbidity among these women had an increasing trend during the past years [30]. To our knowledge, this study is the first to examine the association between stress and diet quality among women of reproductive age in UK. The aim of this study is to investigate whether higher level of perceived stress is associated with lower diet quality among women of reproductive age in the UK.
2. Materials and Methods
This was a cross sectional study targeting women of reproductive age in the UK. The study used an online questionnaire survey developed and administered via the Bristol Online Surveys (BOS).
The sample was one of convenience and consisted of females of reproductive age (between 18 and 49 years old) who were students and staff at a UK University. There are varying definitions for reproductive age in the literature; the range for this study was chosen to reflect the majority of recent studies [31,32]. Participants were excluded if they were: males at birth, below 18 or above 49 years old, not students or staff, suffering from a chronic illness or disease such as: cancer, Crohn’s disease, diabetes, heart disease, HIV/AIDS/multiple sclerosis, depression, asthma, COPD, cystic fibrosis, or mental health disorder, having any kind of food intolerance or food allergy, pregnant or breastfeeding, or were on any medication known to affect appetite or body weight or have undergone bariatric surgery. The sample size was calculated by applying the correlation sample-size method [33] with a power of 80%, and an α (significance level) of 0.05. A correlation coefficient of 0.18 was chosen for the power calculation and it was based on the lowest correlation coefficient r reported in studies about stress and diet quality in women of reproductive age [24,30]. This yielded a total sample of 240 participants.
Potential participants were targeted through posters and social media advertisements (e.g., twitter). Consent was ascertained on the landing page of the survey.
2.1. Methodological Measurements and Procedures
2.1.1. Diet
Diet quality and patterns were estimated via the European Prospective into Cancer and Nutrition food frequency questionnaire (EPIC FFQ) which has been previously validated among UK adult females [34,35]. The EPIC-FFQ consists of 130 food items and one additional question for milk (131 items). The questionnaire represents either individual food (51%), combination of between two and four individual foods (23%), or food types (26%) that are further described by examples of individual foods. The number and percentage of food types in the list are: vegetables, 25 (19%); fruit and fruit juices, 12 (9%); meats, poultry, fish and eggs, 18 (14%); breads, cereals and starches, 18 (14%); dairy foods and fats, 15 (11%); beverages, 10 (8%); sweets and confectionery items, 14 (11%) and miscellaneous foods, 19 (14%). The food list is associated with a set of nine frequency choices for consumption ranging from ‘never or less than once a month’ to ‘6 or more times per day’. The questionnaire consists of two parts. Part 1, the main part, lists 130 food items. Part 2 includes a set of additional questions that determine further information on the type and brand of breakfast cereal and kind of fat used in frying, roasting, grilling or baking and the amount of visible fat on meat.
2.1.2. Dietary Data Analysis
The FETA software was used to analyse the EPIC FFQ data and calculate the grams/day of nutrients and food groups [36]. Eleven food groups (grams/day) were derived from the EPIC food frequency questionnaire data analysis which included fats and oils, sugars and snacks, cereals, alcoholic beverages, red and processed meat, fish and seafood, eggs, milk and milk products, fruits, vegetables, and nuts and seeds. Adherence to the Alternate Mediterranean Diet Index (aMED) was used to assess the a-priori approach for diet quality assessment. The aMED is an adjustment of the Mediterranean Diet Index, which is based on the evidence suggesting a protective effect of this diet on the risk of chronic diseases, and that was previously developed by Trichopoulou et al. [37]. The aMED is based on the consumption of nine food groups: vegetables (excluding potatoes), fruit, nuts, legumes, fish, whole grains, mono-unsaturated fatty acids to saturated fatty acids ratio, alcohol, and red and processed meat [38]. The a-posteriori approach was based on factor analysis that derived the dietary patterns of participants. The importance of factor analysis (a-posteriori approach) is that it characterises the sample’s variation in dietary intake and provides a more meaningful description of the overall patterns and quality of the diet which complements the a-priori dietary approach [39].
2.1.3. Mental Health Indicators
Perceived stress was measured using the 14-item Perceived Stress Scale (PSS) [40]. PSS measures the level of psychological stress, thoughts, and feelings of each participant over the past month. The scale has been tested in several trials in adult populations and showed significant consistency with Cronbach’s alpha = 0.75 and 0.85 [40]. The PSS is not a diagnostic tool; hence there are no cut-off points that determine if an individual is stressed. PSS was equally divided into two categories: low to medium level of stress (score = 0–27) and medium to high level of stress (score = 28–56) as per previous studies [11,41].
Depression was measured using the 21-item Beck Depression Inventory II (BDI-II) [42]. The BDI-II has become one of the most widely used measures to assess depressive symptoms and their severity in adolescents and adults [43]. The BDI-II is a 21-item self-report measure that taps major depression symptoms according to diagnostic criteria listed in the Diagnostic and Statistical Manual for Mental Disorders [44]. Since its publication, a number of studies have examined the validity and reliability of BDI-II across different populations and countries [45]. Results have consistently shown good internal consistency and test-retest reliability of the BDI-II in community [46,47] adolescent and adult clinical outpatients [48] as well as in adult clinical inpatients [49].
2.1.4. Physical and Socio-Demographic Characteristics
Physical activity was measured using the International Physical Activity Questionnaire (IPAQ) [50]. The IPAQ records the activity of participants of four intensity levels: vigorous-intensity activity such as aerobic, moderate-intensity activity such as leisure cycling, walking, and sitting [50].
Adiposity measures: weight in kg and height in cm were self-reported and body mass index (BMI) in kg/m2 was estimated to classify body weight status [51]. BMI was calculated by dividing weight in kilograms over height squared in centimetres [51]. Previous papers stated that self-reported weight and height are acceptable for determining BMI [52].
2.2. Statistical Analysis
IBM SPSS statistics version 25 (Chicago, IL, USA) was used for data analysis. The normality of the data was assessed by Shapiro–Wilk test. Descriptive data are presented as median and interquartile range (IQR) for data with non-normal distribution. Kruskal–Wallis test was used to compare continuous data among the aMD adherence categories (low, medium, high). Categorical data among the three aMD adherence categories were compared through Chi-squared test. The Bonferroni method was used to correct for multiplicity in data.
The normality of the food groups’ data was assessed, and appropriate transformation was undertaken when high skewness was detected in the data. Kaiser–Meyer–Olkin (KMO) measure of sampling adequacy and Bartlett’s test of sphericity were conducted to check the appropriateness of factor analysis. Results revealed a large KMO of 0.75 (>0.5) and a very significant Bartlett’s test (p < 0.00001) with an approximate Chi-square of 832 and 55 degrees of freedom; therefore, factor analysis was deemed appropriate to use [55]. Additionally, the sample size of the present study (n = 244) is acceptable for conducting factor analysis [56,57]. To derive the number of factors from the food groups’ data, a scree plot was generated showing the factors that have an eigenvalue >1. A varimax rotation was assigned to calculate factor loadings for each factor (dietary pattern) based on the assumption that factors were not correlated. Simple linear regression models carried out for each factor (dietary pattern) were revealed to investigate the association between that factor (dietary pattern) and the following variables separately: perceived stress, depression scores, BMI (kg/m2), PA (Mets) and socioeconomic measures. The predictors with significant association were then included in a multiple linear regression model of the diet pattern along with the other significant predictors. Some categories of the socioeconomic measures were merged together before inclusion in the regression models due to their small size (e.g., marital status (single/divorced/widowed, living together/married), parity (never, once/two times or more), religion (no religion, Christian, other), education (No qualification/Certificate of Secondary School (CSE)/General Certificate of Secondary School (GCSE), A-level/higher education), ethnicity (white, other), smoking status (smoker, non-smoker), income (below the average, above the average), parents occupation (employee, other)).
3. Results
A sample of 252 women participated in the study, and after screening eight were excluded since they did not meet the eligibility criteria (e.g., food intolerance/food allergy/chronic disease). In total, the data of 244 women were included in the analysis of the present study. Overall, participants had an average age of 24 years, were mainly of white ethnicity, single, non-smokers, and their parental educational level was mainly O-level or GCSE examinations taken at 16 years. In addition, 47% of the total sample had a moderate level of physical activity (Table 1 and Table 2).
The participants’ characteristics are reported across the three categories of the Alternate Mediterranean Diet Scores (aMDS: low, medium, and high). The majority of the 244 participants had a medium adherence to aMD (46%), followed by 39% having low adherence, and only 15% of participants had high adherence to aMD.
There was a significant association between perceived stress and diet quality. Medium to high levels of stress were more likely to be reported by participants (73%) with a low adherence to aMDS (X2 (2, n = 244) = 14.08, p = 0.001). Pairwise comparisons showed that stress was different between low and high aMD adherence (p = 0.005) and between low and medium aMD adherence categories (p = 0.003) but not between medium and high adherence categories (p = 0.467).
BMI was also found to be different among aMD adherence groups (X2 (4, n = 244) = 14.815, p = 0.005) (Table 1). Participants who had normal BMI were more likely to have high aMDS (72%) compared to those who were underweight (8%) and overweight/obese (17%). The physical activity level of participants differed across the three categories (X2 (4, n = 244) = 11.92, p = 0.018). A higher percentage of participants with high aMDS adherence were engaging in moderate (56%) and high (33%) physical activity levels whereas those with low aMDS adherence were engaging in low (41%) and moderate (41%) physical activity levels.
Income per year showed a significant, but weak, association with adherence to aMDS (X2 (10, n = 244) = 18.48, p = 0.047). However, adherence to aMD was not associated with any other socio-demographic characteristics (Table 2).
Factor Analysis
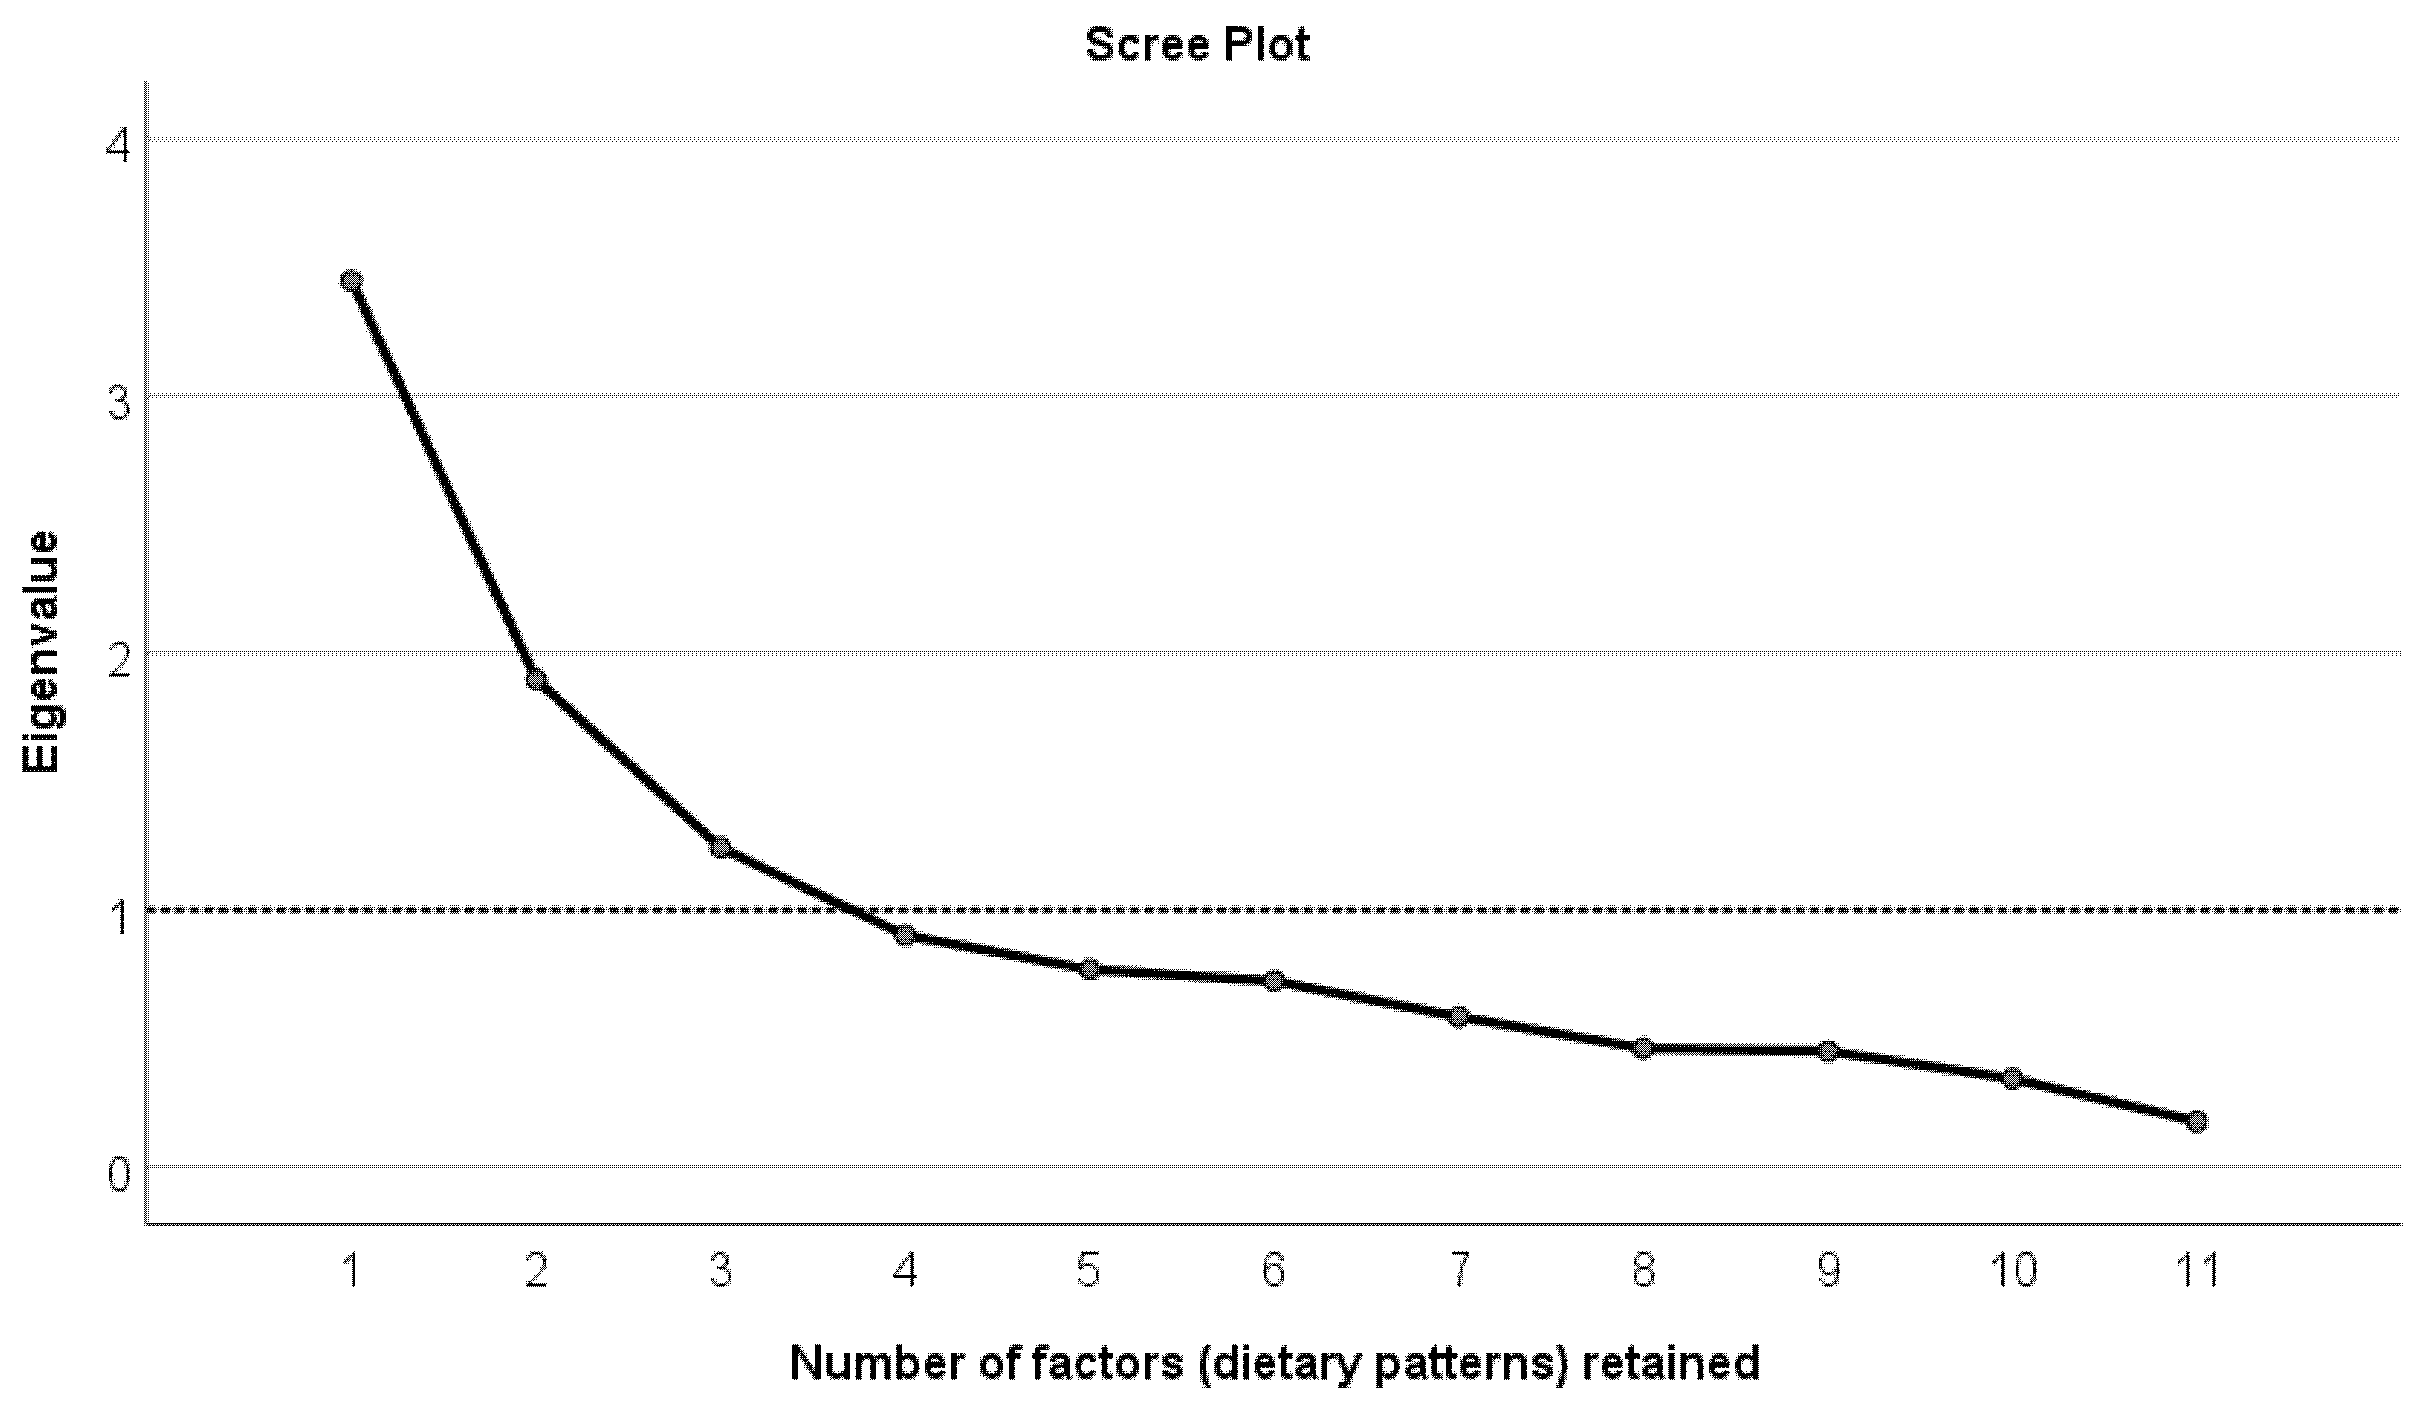
Figure 1 demonstrates a scree plot showing the number of factors (dietary patterns) retained from factor analysis. As shown in the scree plot, the number of factors (dietary patterns) with eigenvalue ≥1 is 3. The three factors (dietary patterns) explained 60% of the total variance in data.
Table 3 demonstrates the 11 food groups with factor loadings for the three factors (dietary patterns). Coefficients with absolute value below 0.3 for each factor were suppressed, therefore five food groups were assigned to factor 1 (DP-1), three to factor 2 (DP-2), and three to factor 3 (DP-3). The first dietary pattern (DP-1) had high factor loadings for the following food groups: fats and oils, sugars and snacks, alcoholic beverages, cereals, and red and processed meat and was labelled “Western-style” dietary pattern. DP-2 had high factor loadings for food groups such as fish and seafood, eggs, and milk and milk products and was labelled “high-quality protein” dietary pattern. The third dietary pattern (DP-3) was labelled “vegetarian-like” dietary pattern with factor loadings high for fruits, vegetables, and nuts and seeds food groups.
Regression analysis that was used to examine the association between the three dietary patterns (DPs), which were derived from factor analysis, and all other variables indicated the following: In the first model, DP-1 was positively associated with stress (p = 0.005) and negatively with age (p = 0.004) and smoking (p = 0.005) (Table 4). DP-1 was common among young, smokers, and highly stressed women. Model 2 of the second dietary pattern showed that DP-2 was negatively associated with mother’s educational level (p = 0.019) (Table 4). The second dietary pattern (DP-2) was common among participants who had mothers with lower educational level. The third dietary pattern (DP-3) was common among normal weight people who had low stress level and non-white. As shown in Table 4, DP-3 was negatively associated with stress (p < 0.001), BMI (p = 0.001), and ethnicity (p = 0.013).
4. Discussion
This is the first study to investigate the association between perceived stress and diet quality/patterns among women of reproductive age in the UK. The association between stress and diet quality/patterns has recently gained the interest of health researchers, especially that diet is a main modifiable risk factor of obesity and many chronic diseases [21]. In the present study, diet quality/patterns analysis was used, rather than individual-nutrient assessment, because it allows the description of the whole diet of the population and is considered essential in understanding the relationship between dietary consumption and diet-related diseases [16]. Additionally, the association between stress and single nutrients is difficult to investigate since they are never consumed separately but rather within meals, and they metabolically interact with one another [16]. Our findings indicate that stress is associated with lower diet quality where 73% of participants who had low adherence to the alternate Mediterranean Diet (aMD) had a high stress level. Therefore, stress-coping strategies and programs for women of reproductive age should be implemented to prevent unhealthy eating habits and poor diet quality and their adverse health consequences.
Participants in this study were recruited from a university setting and included both students and employees (18–49 years old) to provide a more representative sample of reproductive aged women of this setting.
The a-priori assessment of diet quality indicated an overall medium adherence to the alternate Mediterranean Diet index (46% of the total sample). Similar results were found in the US where 43% of women of reproductive age (n = 248) had a moderate adherence to the Mediterranean Diet [58] and in the UK where most workplace females (n = 426) were moderate adherers to the Mediterranean Diet Index (n = 346) [59]. Similarly, our research team has previously assessed diet quality by the Mediterranean Diet Index, among 123 women of reproductive age in the UK and also reported an overall moderate adherence [60]; the alternate Mediterranean Diet Index was used in the present study because it has been considered more reflective of MD for non-Mediterranean countries such as the UK [61]. In this context, women of reproductive age should be supported with nutrition counselling and education, in addition to reproductive health care services, to further enhance their diet quality [62].
The a-posteriori dietary approach (Table 4) corroborated further the negative association between stress and healthy diet quality/patterns and offered additional dietary insight by highlighting the types of food groups that might contribute to this association. It showed that stress was positively associated with the Western-style dietary pattern (DP-1) consisting of fats and oils, sugar and snacks, alcoholic beverages, red/processed meat, and cereals (p = 0.005) and negatively with the vegetarian-like dietary pattern (DP-3) consisting of fruits, vegetables, nuts and seeds (p < 0.001). These findings agree with other studies targeting the association between stress and diet. For instance, El-Ansari et al. [16] assessed stress levels using the Perceived Stress Scale and nutritional habits through a 12-food item FFQ and found that among female university students in the UK, stress was significantly associated with poorer diet quality resembled by high intake of sugar, snacks, fat, and low intake of unsaturated fats, fruits, and vegetables. Additionally, Isasi et al. [25] found that stress was negatively linked with diet quality (Alternate-Healthy Eating Index 2010) among Hispanic/Latino females in the US. Similarly, Groesz et al. [63] targeted 561 females from the US and found that highly stressed females reported high consumption of unhealthy foods (fast food, sweets, etc.) and low consumption of whole grains, fruits, and vegetables as assessed via a food frequency questionnaire. In another study conducted among females across three countries (Germany, Poland, and Bulgaria), a positive association between stress and poor dietary patterns was reported [26]. Habhab et al. [64] also assessed the link between stress and food restraint and diet quality/patterns among 40 women of childbearing age via mixed-design analysis of variance and found that women with poorer diet quality had a high stress level. These findings were corroborated by our recent systematic review and meta-analysis [30] that was the first to examine the association between perceived stress and diet quality in women of reproductive age. The systematic literature review included 24 studies (8 had diet quality as the primary outcome and 16 assessed food frequency of consumption) with a total of 41,033 participants. Overall, the 16 studies on food intake and frequency of consumption (n = 33,477) found that stress was associated with high intake of fat, fast food, sweets, processed foods, and low intake of fruits, vegetables, whole grains, and legumes. The meta-analysis included the 8 studies on diet quality (n = 7556) and reported a significantly negative association between stress and diet quality (r = −0.35, p < 0.001, 95% CI (−0.56; −0.15)).
On the contrary, some studies reported different findings. For example, Richardson et al. [24] assessed stress through the 14-item PSS and diet quality via Healthy Eating Index-2010 among 101 childbearing aged women (aged 18–44 years) and found no association between stress and diet quality. Similarly, Ferranti et al. [65] found no association between perceived stress and diet quality among 433 females in the US who were university and health centre employees. The study assessed stress via the 14-item PSS and diet quality via a-priori approach using three diet quality indices: Alternate Healthy Eating Index, Mediterranean Diet Index, and Dietary Approach to Stop Hypertension Index. Two other studies in Egypt [66] and Iran [67] among women of childbearing age also found no significant association between diet quality and stress.
Discrepancies in findings between these studies and the present study might be explained by variations in sample sizes, diversity of the tools used to assess variables, and difference in the population from which the sample was taken. For instance, Richardson et al. [24] recruited 101 women and Widaman et al. [23] recruited 75 females. On the other hand, the present study recruited 244 participants. Secondly, most studies on the association between perceived stress and diet quality in women of reproductive age have used 24-h recalls as the dietary assessment tool [21,22,23,24,25] whereas the EPIC food frequency questionnaire, which measures a wide variety of food items and the frequency of consumption over the past one year, was used in the present study.
In understanding the stress/diet relationship, studies have argued that the association between perceived stress and dietary quality/patterns is bidirectional: psychological stress symptoms could be associated with behaviours that are considered “health-compromising” that put the individual at risk of health problems [16]. For example, in a group of female students, high stress levels were associated with weight dissatisfaction and other health-compromising behaviours such as alcohol intake, binge eating and smoking, skipping breakfast [68]. Stressed people tend to consume high energy-dense foods to taper down their stressful emotions [69]. Adam et al. [69] suggested that the important reason behind these eating behaviours resulting from negative emotions and stress is the lack of eating control. This is when the consumption of high caloric and palatable foods relates to satisfaction and reward and becomes comfort eating during the stressful periods [69]. However, the absence of significant association between perceived stress and diet quality/patterns in some studies does not support these views. The findings of these studies can be explained by the following coping strategies that are not related to food such as spirituality that could attenuate the effect of stress on dietary behaviour [70]. Although these studies show no significant associations between perceived stress and diet quality, some environmental factors including stress coping strategies, cultural food traditions, cognitive factors (such as the knowledge of nutrition), and the cost of food might contribute to the dietary pattern and quality and must be further studied. Another explanation of the stress/diet relationship is derived from the fact that perceived stress causes physiological changes (in addition to psychological changes) to the human body that trigger food craving [71]. Upon stress, the hypothalamus and central nervous system secrete the hormone cortisol into the bloodstream which leads, if in high circulating concentrations, to the formation and accumulation of visceral fat in the body [69]. Additionally, several studies have pointed out that elevated levels of stress cortisol can be associated with increased food intake [72,73]. This is because perceived stress, and elevated serum cortisol, stimulate the secretion of the gastric hormone Ghrelin that increases appetite and food craving [71].
Strengths and Limitations
The study has several strengths. To our knowledge, it is the first to assess the association between perceived stress and diet quality in women of reproductive age in the United Kingdom. Diet quality/patterns were assessed comprehensively through two approaches: the a-priori (hypothesis-driven) and the a-posteriori (data-driven) which gave robust results and clearer insight about the overall dietary quality/patterns of the study’s participants. Another strength of this study is the fact that the tools used to assess all variables were validated and standardised, such as the Perceived Stress Scale to assess stress levels [40], Becks Depression Inventory II to assess depression [42], in addition to the anthropometric and socioeconomic questions [74,75,76]. Furthermore, while most studies on the association between stress and diet utilised dietary recalls to assess dietary intake, this study used the EPIC food frequency questionnaire which is considered a gold standard dietary assessment tool [34,35].
On the other hand, there are several limitations which are worth acknowledging. The cross-sectional design of the study made it hard to draw and generalise a definitive conclusion about the association between perceived stress and diet quality/patterns among women of reproductive age. Additionally, the convenience sample that was selected from a population of a UK university setting and consequently might not be representative of the general population of women of reproductive age. Although all variables were measured using validated and standardised tools, they have been self-reported by participants, which might have caused inaccuracy in the results. For example, anthropometric measures would be better estimated using advanced and more accurate tools such as Dual-Energy X-ray Absorptiometry (DEXA) which measures the whole-body composition including weight, height, fat mass, and fat-free body mass [77]. Similarly, the Perceived Stress Scale, that was used to assess stress levels of participants, was self-reported and hence participants might not have accurately recalled the stressful situations that occurred over the past weeks. A more accurate measure of stress should be used in future studies such as blood or salivary cortisol [78]. Moreover, food intake biomarkers (such as urinary and blood samples), which objectively measure the nutritional intake of individuals, should complement the food frequency questionnaires and other self-reported measures of dietary intake [79].
5. Conclusions
In conclusion, the negative association between perceived stress and diet quality (in both a-priori and a-posteriori approaches) that was found among a sample of women of reproductive age in the present study is important and merits further investigation. The results of this study have implications for future interventions which should include not only dietary but also other behavioural aspects to support lifestyle changes among women of reproductive age. In other words, the interventions are complex; they are more than simply changing the diet alone. Women of reproductive age seem to eat depending on the level of stress and therefore dietary interventions need to take that into consideration when applying it. Future randomised controlled trials with accurate measures should be implemented to further confirm this negative association.
Author Contributions
Conceptualization, K.K., F.T. and V.H.; methodology, K.K., F.T. and V.H.; formal analysis, K.K.; data curation, K.K.; writing—original draft preparation, K.K.; writing—review and editing, K.K., F.T. and V.H.; visualization, K.K., F.T. and V.H.; supervision, F.T. and V.H. All authors have read and agreed to the published version of the manuscript.
Funding
This research received no external funding.
Institutional Review Board Statement
The study was conducted according to the guidelines of the Declaration of Helsinki and approved by the Institutional Review Board (or Ethics Committee) of Bournemouth University (protocol code 22344) on 27 January 2020.
Informed Consent Statement
Informed consent was obtained from all subjects involved in the study.
Acknowledgments
The authors would like to thank Laya Awada for her help in data cleaning. As authors, who have used the FETA software for the analysis of the EPIC FFQ data in the present study, we are asked by FETA-software team to acknowledge the following: The EPIC-Norfolk study (DOI 10.22025/2019.110.1105.00004) has received funding from the Medical Research Council (MR/N003284/1 and MC-UU_112015/1) and Cancer Research UK (C864/A14136). We are grateful to all the participants who have been part of the project and to the many members of the study teams at the University of Cambridge who have enabled this research.
Conflicts of Interest
The authors declare no conflict of interest.
References
- Durst, J.K.; Tuuli, M.G.; Stout, M.J.; Macones, G.A.; Cahill, A.G. Degree of obesity at delivery and risk of preeclampsia with severe features. Am. J. Obstet. Gynecol. 2016, 214, 651.e1–651.e5. [Google Scholar] [CrossRef]
- Guelinckx, I.; Devlieger, R.; Beckers, K.; Vansant, G. Maternal obesity: Pregnancy complications, gestational weight gain and nutrition. Obes. Rev. 2008, 9, 140–150. [Google Scholar] [CrossRef] [PubMed]
- Wei, Y.-M.; Yang, H.; Zhu, W.-W.; Liu, X.-Y.; Meng, W.-Y.; Wang, Y.-Q.; Shang, L.-X.; Cai, Z.-Y.; Ji, L.-P.; Wang, Y.-F.; et al. Risk of adverse pregnancy outcomes stratified for pre-pregnancy body mass index. J. Matern. Neonatal Med. 2015, 29, 2205–2209. [Google Scholar] [CrossRef] [PubMed]
- Sun, Y.; Shen, Z.; Zhan, Y.; Wang, Y.; Ma, S.; Zhang, S.; Liu, J.; Wu, S.; Feng, Y.; Chen, Y.; et al. Effects of pre-pregnancy body mass index and gestational weight gain on maternal and infant complications. BMC Pregnancy Childbirth 2020, 20, 1–13. [Google Scholar] [CrossRef]
- Lisonkova, S.; Muraca, G.; Potts, J.; Liauw, J.; Chan, W.-S.; Skoll, A.; Lim, K.I. Association Between Prepregnancy Body Mass Index and Severe Maternal Morbidity. JAMA 2017, 318, 1777–1786. [Google Scholar] [CrossRef] [PubMed]
- International Weight Management in Pregnancy (i-WIP) Collaborative Group. Effect Of Diet And Physical Activity Based Interventions In Pregnancy On Gestational Weight Gain And Pregnancy Outcomes: Meta-Analysis Of Individual Participant Data From Randomised Trials. BMJ 2017, 358, j3991. [Google Scholar]
- Ng, D.M.; Jeffery, R.W. Relationships Between Perceived Stress and Health Behaviors in a Sample of Working Adults. Health Psychol. 2003, 22, 638–642. [Google Scholar] [CrossRef]
- Tseng, M.; Fang, C. Stress is Associated with Unfavorable Patterns of Dietary Intake Among Female Chinese Immigrants. Annal. Behav. Med. 2011, 41, 324–332. [Google Scholar] [CrossRef] [Green Version]
- Bayram, N.; Bilgel, N. The prevalence and socio-demographic correlations of depression, anxiety and stress among a group of university students. Soc. Psychiatry Psychiatr. Epidemiol. 2008, 43, 667–672. [Google Scholar] [CrossRef] [PubMed]
- Bauer, K.W.; Hearst, M.O.; Escoto, K.; Berge, J.; Neumark-Sztainer, D. Parental employment and work-family stress: Associations with family food environments. Soc. Sci. Med. 2012, 75, 496–504. [Google Scholar] [CrossRef] [PubMed] [Green Version]
- Laugero, K.D.; Falcon, L.M.; Tucker, K. Relationship between perceived stress and dietary and activity patterns in older adults participating in the Boston Puerto Rican Health Study. Appetite 2011, 56, 194–204. [Google Scholar] [CrossRef] [PubMed] [Green Version]
- Vidal, E.J.; Alvarez, D.; Martinez-Velarde, D.; Vidal-Damas, L.; Yuncar-Rojas, K.A.; Julca-Malca, A.; Bernabe-Ortiz, A. Perceived stress and high fat intake: A study in a sample of undergraduate students. PLoS ONE 2018, 13, e0192827. [Google Scholar] [CrossRef] [PubMed]
- Wichianson, J.R.; Bughi, S.A.; Unger, J.; Spruijt-Metz, D.; Nguyen-Rodriguez, S.T. Perceived stress, coping and night-eating in college students. Stress Health 2009, 25, 235–240. [Google Scholar] [CrossRef]
- Nastaskin, R.S.; Fiocco, A.J. A survey of diet self-efficacy and food intake in students with high and low perceived stress. Nutr. J. 2015, 14, 1–8. [Google Scholar] [CrossRef] [Green Version]
- Roohafza, H.; Sarrafzadegan, N.; Sadeghi, M.; Rafieian-Kopaei, M.; Sajjadi, F.; Khosravi-Boroujeni, H. The Association Be-tween Stress Levels And Food Consumption Among Iranian Population. Arch. Iran. Med. 2013, 16, 145–148. [Google Scholar]
- El Ansari, W.; Adetunji, H.; Oskrochi, R. Food and Mental Health: Relationship between Food and Perceived Stress and Depressive Symptoms among University Students in the United Kingdom. Central Eur. J. Public Health 2014, 22, 90–97. [Google Scholar] [CrossRef] [Green Version]
- Papier, K.; Ahmed, F.; Lee, P.; Wiseman, J. Stress and dietary behaviour among first-year university students in Australia: Sex differences. Nutrients 2015, 31, 324–330. [Google Scholar] [CrossRef]
- O’Connor, D.B.; O’Connor, R.C. Perceived changes in food intake in response to stress: The role of conscientiousness. Stress Health 2004, 20, 279–291. [Google Scholar] [CrossRef]
- Tryon, M.; Carter, C.; DeCant, R.; Laugero, K. Chronic Stress Exposure May Affect the Brain’s Response to High Calorie Food Cues And Predispose To Obesogenic Eating Habits. Physiol. Behav. 2013, 120, 233–242. [Google Scholar] [CrossRef]
- Hwang, J.; Lee, S.; Kim, S.; Chung, H.; Kim, W. Psychological Distress Is Associated with Inadequate Dietary Intake In Viet-namese Marriage Immigrant Women In Korea. J. Am. Diet. Assoc. 2010, 110, 779–785. [Google Scholar] [CrossRef] [PubMed]
- Fowles, E.R.; Bryant, M.; Kim, S.; Walker, L.O.; Ruiz, R.J.; Timmerman, G.M.; Brown, A. Predictors of Dietary Quality in Low-Income Pregnant Women. Nurs. Res. 2011, 60, 286–294. [Google Scholar] [CrossRef] [PubMed] [Green Version]
- Fowles, E.R.; Stang, J.; Bryant, M.; Kim, S. Stress, Depression, Social Support, and Eating Habits Reduce Diet Quality in the First Trimester in Low-Income Women: A Pilot Study. J. Acad. Nutr. Diet. 2012, 112, 1619–1625. [Google Scholar] [CrossRef] [PubMed] [Green Version]
- Widaman, A.; Witbracht, M.G.; Forester, S.M.; Laugero, K.D.; Keim, N.L. Chronic Stress is Associated with Indicators of Diet Quality in Habitual Breakfast Skippers. J. Acad. Nutr. Diet. 2016, 116, 1776–1784. [Google Scholar] [CrossRef]
- Richardson, A.S.; Arsenault, J.E.; Cates, S.C.; Muth, M.K. Perceived stress, unhealthy eating behaviors, and severe obesity in low-income women. Nutr. J. 2015, 14, 1–10. [Google Scholar] [CrossRef] [Green Version]
- Isasi, C.; Parrinello, C.; Jung, M.; Carnethon, M.; Birnbaum-Weitzman, O.; Espinoza, R.; Penedo, F.; Perreira, K.; Schneiderman, N.; Sotres-Alvarez, D.; et al. Psychosocial Stress Is Associated with Obesity and Diet Quality in Hispanic/Latino Adults. Annal. Epidemiol. 2015, 25, 84–89. [Google Scholar] [CrossRef] [Green Version]
- Mikolajczyk, R.T.; El Ansari, W.; Maxwell, A.E. Food consumption frequency and perceived stress and depressive symptoms among students in three European countries. Nutr. J. 2009, 8, 31. [Google Scholar] [CrossRef] [Green Version]
- González, A.M.; Cruz, S.Y.; Ríos, J.L.; Pagán, I.; Fabián, C.; Betancourt, J.; Rivera-Soto, W.T.; González, M.J.; Palacios, C. Alcohol consumption and smoking and their associations with socio-demographic characteristics, dietary patterns, and perceived academic stress in Puerto Rican college students. Puerto Rico Health Sci. J. 2013, 32, 82–88. [Google Scholar]
- Fulkerson, J.E.; Sherwood, N.E.; Perry, C.L.; Neumark-Sztainer, D.; Story, M. Depressive symptoms and adolescent eating and health behaviors: A multifaceted view in a population-based sample. Prev. Med. 2004, 38, 865–875. [Google Scholar] [CrossRef]
- Liu, C.; Xie, B.; Chou, C.-P.; Koprowski, C.; Zhou, D.; Palmer, P.; Sun, P.; Guo, Q.; Duan, L.; Sun, X.; et al. Perceived stress, depression and food consumption frequency in the college students of China seven cities. Physiol. Behav. 2007, 92, 748–754. [Google Scholar] [CrossRef] [PubMed]
- Khaled, K.; Tsofliou, F.; Hundley, V.; Helmreich, R.; Almilaji, O. Perceived stress and diet quality in women of reproductive age: A systematic review and meta-analysis. Nutr. J. 2020, 19, 1–15. [Google Scholar] [CrossRef] [PubMed]
- Morema, E.N.; Atieli, H.E.; Onyango, R.O.; Omondi, J.H.; Ouma, C. Determinants of Cervical screening services uptake among 18–49 year old women seeking services at the Jaramogi Oginga Odinga Teaching and Referral Hospital, Kisumu, Kenya. BMC Health Serv. Res. 2014, 14, 1–7. [Google Scholar] [CrossRef] [Green Version]
- Proportion of Women of Reproductive Age (Aged 15–49 Years) Who Have Their Need for Family Planning Satisfied with Modern Methods (SDG 3.7.1). Available online: https://www.who.int/data/maternal-newborn-child-adolescent-ageing/indicator-explorer-new/mca/proportion-of-women-of-reproductive-age-(aged-15–49-years)-who-have-their-need-for-family-planning-satisfied-with-modern-methods (accessed on 22 July 2021).
- Hulley, S.; Cummings, S.; Browner, W.; Grady, D.; Newman, T. Designing Clinical Research, 4th ed.; Wolters Kluwer/Lippincott Williams & Wilkins: Philadelphia, PA, USA, 2013. [Google Scholar]
- Verkasalo, P.K.; Appleby, P.N.; Allen, N.E.; Davey, G.; Adlercreutz, H.; Key, T.J. Soya intake and plasma concentrations of daidzein and genistein: Validity of dietary assessment among eighty British women (Oxford arm of the European Prospective Investigation into Cancer and Nutrition). Br. J. Nutr. 2001, 86, 415–421. [Google Scholar] [CrossRef] [Green Version]
- Welch, A.A.; Luben, R.; Khaw, K.T.; Bingham, S.A. The CAFE computer program for nutritional analysis of the EPIC-Norfolk food frequency questionnaire and identification of extreme nutrient values. J. Hum. Nutr. Diet. 2005, 18, 99–116. [Google Scholar] [CrossRef]
- Mulligan, A.A.; Luben, R.; Bhaniani, A.; Parry-Smith, D.J.; O’Connor, L.; Khawaja, A.; Forouhi, N.; Khaw, K.-T. A new tool for converting food frequency questionnaire data into nutrient and food group values: FETA research methods and availability. BMJ Open 2014, 4, e004503. [Google Scholar] [CrossRef] [PubMed] [Green Version]
- Trichopoulou, A.; Costacou, T.; Bamia, C.; Trichopoulos, D. Adherence to a Mediterranean Diet and Survival in a Greek Population. N. Engl. J. Med. 2003, 348, 2599–2608. [Google Scholar] [CrossRef] [PubMed] [Green Version]
- Fung, T.; McCullough, M.; Newby, P.; Manson, J.; Meigs, J.; Rifai, N.; Willett, W.; Hu, F. Diet-Quality Scores and Plasma Concentrations Of Markers Of Inflammation And Endothelial Dysfunction. Am. J. Clin. Nutr. 2005, 82, 163–173. [Google Scholar] [CrossRef] [PubMed]
- Zhao, J.; Li, Z.; Gao, Q.; Zhao, H.; Chen, S.; Huang, L.; Wang, W.; Wang, T. A review of statistical methods for dietary pattern analysis. Nutr. J. 2021, 20, 1–18. [Google Scholar] [CrossRef]
- Cohen, S.; Kamarck, T.; Mermelstein, R. A Global Measure of Perceived Stress. J. Health Soc. Behav. 1983, 24, 385. [Google Scholar] [CrossRef]
- Tavolacci, M.P.; Ladner, J.; Grigioni, S.; Richard, L.; Villet, H.; Dechelotte, P. Prevalence and association of perceived stress, substance use and behavioral addictions: A cross-sectional study among university students in France, 2009–2011. BMC Public Health 2013, 13, 724. [Google Scholar] [CrossRef]
- Beck, A.; Steer, R.; Brown, G. Manual for the Beck Depression Inventory-II, 2nd ed.; Psychological Corporation: San Antonio, TX, USA, 1996. [Google Scholar]
- García-Batista, Z.E.; Guerra-Peña, K.; Cano-Vindel, A.; Herrera-Martínez, S.X.; Medrano, L.A. Validity and reliability of the Beck Depression Inventory (BDI-II) in general and hospital population of Dominican Republic. PLoS ONE 2018, 13, e0199750. [Google Scholar] [CrossRef] [PubMed]
- American Psychiatric Association. Diagnostic and Statistical Manual of Mental Disorders, 4th ed.; American Psychiatric Association: Washington, DC, USA, 2011. [Google Scholar]
- Wang, Y.-P.; Gorenstein, C. Psychometric properties of the Beck Depression Inventory-II: A comprehensive review. Rev. Bras. Psiquiatr. 2013, 35, 416–431. [Google Scholar] [CrossRef] [PubMed] [Green Version]
- Gomes-Oliveira, M.H.; Gorenstein, C.; Neto, F.L.; Andrade, L.H.; Wang, Y.P. Validation of the Brazilian Portuguese Version of the Beck Depression Inventory-II in a community sample. Rev. Bras. Psiquiatr. 2012, 34, 389–394. [Google Scholar] [CrossRef] [PubMed]
- Segal, D.L.; Coolidge, F.L.; Cahill, B.S.; O’Riley, A.A. Psychometric Properties of the Beck Depression Inventory—II (BDI-II) Among Community-Dwelling Older Adults. Behav. Modif. 2008, 32, 3–20. [Google Scholar] [CrossRef] [Green Version]
- Grothe, K.B.; Dutton, G.R.; Jones, G.; Bodenlos, J.; Ancona, M.; Brantley, P.J. Validation of the Beck Depression Inventory-II in a Low-Income African American Sample of Medical Outpatients. Psychol. Assess. 2005, 17, 110–114. [Google Scholar] [CrossRef] [PubMed] [Green Version]
- Subica, A.M.; Fowler, J.C.; Elhai, J.D.; Frueh, B.C.; Sharp, C.; Kelly, E.L.; Allen, J.G. Factor structure and diagnostic validity of the Beck Depression Inventory–II with adult clinical inpatients: Comparison to a gold-standard diagnostic interview. Psychol. Assess. 2014, 26, 1106–1115. [Google Scholar] [CrossRef] [PubMed] [Green Version]
- Craig, C.L.; Marshall, A.; Sjöström, M.; Bauman, A.E.; Booth, M.L.; Ainsworth, B.E.; Pratt, M.; Ekelund, U.; Yngve, A.; Sallis, J.F.; et al. International Physical Activity Questionnaire: 12-Country Reliability and Validity. Med. Sci. Sports Exerc. 2003, 35, 1381–1395. [Google Scholar] [CrossRef] [Green Version]
- World Health Organization. Obesity: Preventing and Managing the Global Epidemic: Report of a WHO Consultation; WHO: Geneva, Switzerland, 2000. [Google Scholar]
- Nikolaou, C.K.; Hankey, C.R.; Lean, M.E.J. Accuracy of on-line self-reported weights and heights by young adults. Eur. J. Public Health 2017, 27, 898–903. [Google Scholar] [CrossRef] [Green Version]
- Martorell, R.; Kettel Khan, L.; Hughes, M.; Grummer-Strawn, L. Obesity in Women From Developing Countries. Eur. J. Clin. Nutr. 2000, 54, 247–252. [Google Scholar] [CrossRef] [Green Version]
- Monteiro, C.A.; Conde, W.L.; Lu, B.; Popkin, B. Obesity and inequities in health in the developing world. Int. J. Obes. 2004, 28, 1181–1186. [Google Scholar] [CrossRef] [Green Version]
- Matore, E.; Khairani, A.; Adnan, R. Exploratory Factor Analysis (EFA) For Adversity Quotient (AQ) Instrument among Youth. J. Crit. Rev. 2019, 6, 234–242. [Google Scholar]
- MacCallum, R.; Widaman, K.; Zhang, S.; Hong, S. Sample Size in Factor Analysis. Psychol. Methods 1999, 4, 84–99. [Google Scholar] [CrossRef]
- de Winter, J.; Dodou, D.; Wieringa, P.A. Exploratory Factor Analysis with Small Sample Sizes. Multivar. Behav. Res. 2009, 44, 147–181. [Google Scholar] [CrossRef] [PubMed]
- Boghossian, N.S.; Yeung, E.H.; Mumford, S.L.; Zhang, C.; Gaskins, A.J.; Wactawski-Wende, J.; Schisterman, E.; for the BioCycle Study Group. Adherence to the Mediterranean diet and body fat distribution in reproductive aged women. Eur. J. Clin. Nutr. 2013, 67, 289–294. [Google Scholar] [CrossRef] [Green Version]
- Papadaki, A.; Wood, L.; Sebire, S.J.; Jago, R. Adherence to the Mediterranean diet among employees in South West England: Formative research to inform a web-based, work-place nutrition intervention. Prev. Med. Rep. 2015, 2, 223–228. [Google Scholar] [CrossRef] [PubMed] [Green Version]
- Khaled, K.; Hundley, V.; Almilaji, O.; Koeppen, M.; Tsofliou, F. A Priori and a Posteriori Dietary Patterns in Women of Childbearing Age in the UK. Nutrients 2020, 12, 2921. [Google Scholar] [CrossRef] [PubMed]
- Chen, G.-D.; Dong, X.-W.; Zhu, Y.-Y.; Tian, H.-Y.; He, J.; Chen, Y.-M. Adherence to the Mediterranean diet is associated with a higher BMD in middle-aged and elderly Chinese. Sci. Rep. 2016, 6, 25662. [Google Scholar] [CrossRef] [PubMed] [Green Version]
- Nestle, M. Obesity. Halting the obesity epidemic: A public health policy approach. Public Health Rep. 2000, 115, 12–24. [Google Scholar] [CrossRef] [PubMed]
- Groesz, L.M.; McCoy, S.; Carl, J.; Saslow, L.; Stewart, J.; Adler, N.; Laraia, B.; Epel, E. What is eating you? Stress and the drive to eat. Appetite 2012, 58, 717–721. [Google Scholar] [CrossRef] [PubMed] [Green Version]
- Habhab, S.; Sheldon, J.; Loeb, R. The Relationship Between Stress, Dietary Restraint, And Food Preferences in Women. Appetite 2009, 52, 437–444. [Google Scholar] [CrossRef]
- Ferranti, E.P.; Dunbar, S.B.; Higgins, M.; Dai, J.; Ziegler, T.R.; Frediani, J.; Reilly, C.; Brigham, K.L. Psychosocial factors associated with diet quality in a working adult population. Res. Nurs. Health 2013, 36, 242–256. [Google Scholar] [CrossRef] [Green Version]
- El Ansari, W.; Berg-Beckhoff, G. Nutritional Correlates of Perceived Stress among University Students in Egypt. Int. J. Environ. Res. Public Health 2015, 12, 14164–14176. [Google Scholar] [CrossRef] [Green Version]
- Valipour, G.; Esmaillzadeh, A.; Azadbakht, L.; Afshar, H.; Hassanzadeh, A.; Adibi, P. Adherence To The DASH Diet In Re-lation To Psychological Profile Of Iranian Adults. Eur. J. Nutr. 2015, 56, 309–320. [Google Scholar] [CrossRef] [PubMed]
- Stice, E.; Presnell, K.; Spangler, D. Risk Factors For Binge Eating Onset In aAdolescent Girls: A 2-Year Prospective Investiga-tion. Health Psychol. 2002, 21, 131–138. [Google Scholar] [CrossRef] [PubMed]
- Adam, T.; Epel, E. Stress, Eating And The Reward System. Physiol. Behav. 2007, 91, 449–458. [Google Scholar] [CrossRef]
- Musgrave, C.F.; Allen, C.E.; Allen, G.J. Spirituality and Health for Women of Color. Am. J. Public Health 2002, 92, 557–560. [Google Scholar] [CrossRef] [PubMed]
- Azzam, I.; Gilad, S.; Limor, R.; Stern, N.; Greenman, Y. Ghrelin Stimulation by Hypothalamic–Pituitary–Adrenal Axis Acti-vation Depends On Increasing Cortisol Levels. Endo. Connect. 2017, 6, 847–855. [Google Scholar] [CrossRef] [Green Version]
- Herhaus, B.; Ullmann, E.; Chrousos, G.; Petrowski, K. High/low cortisol reactivity and food intake in people with obesity and healthy weight. Transl. Psychiatry 2020, 10, 1–8. [Google Scholar] [CrossRef] [Green Version]
- Hewagalamulage, S.; Lee, T.; Clarke, I.; Henry, B. Stress, Cortisol, And Obesity: A Role For Cortisol Responsiveness in Iden-tifying Individuals Prone To Obesity. Domes. Anim. Endocrinol. 2016, 56, S112–S120. [Google Scholar] [CrossRef]
- Flint, E.; Webb, E.; Cummins, S. Change in commute mode and body-mass index: Prospective, longitudinal evidence from UK Biobank. Lancet Public Health 2016, 1, e46–e55. [Google Scholar] [CrossRef] [Green Version]
- Prady, S.L.; Pickett, K.E.; Croudace, T.; Fairley, L.; Bloor, K.; Gilbody, S.; Kiernan, K.E.; Wright, J. Psychological Distress during Pregnancy in a Multi-Ethnic Community: Findings from the Born in Bradford Cohort Study. PLoS ONE 2013, 8, e60693. [Google Scholar] [CrossRef] [Green Version]
- Bowman, S.A. A comparison of the socioeconomic characteristics, dietary practices, and health status of women food shoppers with different food price attitudes. Nutr. Res. 2006, 26, 318–324. [Google Scholar] [CrossRef]
- Shepherd, J.A.; Ng, B.K.; Sommer, M.J.; Heymsfield, S.B. Body composition by DXA. Bone 2017, 104, 101–105. [Google Scholar] [CrossRef] [PubMed]
- Hellhammer, D.; Wüst, S.; Kudielka, B. Salivary Cortisol as A Biomarker in Stress Re-search. Psychoneuroendocrinology 2009, 34, 163–171. [Google Scholar] [CrossRef] [PubMed]
- Picó, C.; Serra, F.; Rodríguez, A.; Keijer, J.; Palou, A. Biomarkers of Nutrition and Health: New Tools For New Approaches. Nutrients 2019, 11, 1092. [Google Scholar] [CrossRef] [PubMed] [Green Version]
Figure 1.
Scree plot showing the number of factors (dietary patterns) retained from factor analysis on the X-axis and the eigenvalues on Y-axis.
Figure 1.
Scree plot showing the number of factors (dietary patterns) retained from factor analysis on the X-axis and the eigenvalues on Y-axis.


Table 1.
Physical and mental characteristics of participants (n = 244).
| Participants’ Characteristics(N (%)) | Total Sample | Alternate Mediterranean Diet Adherence Categories | p-Value | ||
|---|---|---|---|---|---|
| Low aMDS (0–3) | Medium aMDS (4–6) | High aMDS (7–9) | |||
| 95 (39) | 113 (46) | 36 (15) | |||
| Physical and lifestyle characteristics | |||||
| Age (years) # | 24.0 (21.0–32.0) | 23.0 (21.0–29.0) | 25.0 (21.5–32.0) | 24.0 (20.3–35.0) | 0.277 |
| Age (years) * | 0.09 | ||||
| 18–24 | 124 (51) | 54 (57) | 51 (45) | 19 (53) | |
| 25–34 | 77 (32) | 26 27) | 44 (39) | 7 (19) | |
| 35–49 | 43 (17) | 15 (16) | 18 (16) | 10 (28) | |
| BMI (kg/m2) # | 23.7 (20.9–27.9) | 26.1 (21.5–49.4) | 23.7 (20.6–27.5) | 21.9 (20.3–23.9) | 0.093 |
| BMI * | 0.005 | ||||
| Underweight | 14 (6) | 4 (4) | 7 (6) | 3 (8) | |
| Normal Weight | 120 (49) | 38 (40) | 56 (50) | 26 (72) | |
| Overweight/obese | 108 (44) | 52 (56) | 50 (44) | 6 (17) | |
| Physical Activity (METs-h/wk) # | 1429 (464.3–2824.5) | 1159 (330.0–2615.0) | 1440 (479.3–2886.3) | 2380 (1325.5–3464.3) | 0.336 |
| Physical Activity level * | 0.018 | ||||
| Low (<600 MET minutes/week) | 76 (31) | 39 (41) | 33 (29) | 4 (11) | |
| Moderate (>600 MET minutes/week) | 114 (47) | 39 (41) | 55 (49) | 20 (56) | |
| High (>3000 MET minutes/week) | 54 (22) | 17 (18) | 25 (22) | 12 (33) | |
| Mental Health Indicator | |||||
| Stress # | 29 (22.0–33.0) | 31 (26.0–34.0) | 27 (22.0–27.0) | 26.5 (18.0–31.8) | 0.002 |
| Stress * | 0.001 | ||||
| Low-Medium | 103 (42) | 26 (27) | 58 (51) | 19 (53) | |
| Medium-High | 141 (58) | 69 (73) | 55 (49) | 17 (47) | |
| Depression # | 5 (2.0–12.0) | 5 (2.0–13.0) | 5 (2.0–11.0) | 5 (1.0–13.0) | 0.926 |
| Depression * | 0.07 | ||||
| Minimal (0–13) | 191 (78) | 73 (77) | 90 (80) | 28 (78) | |
| Mild (14–19) | 28 (11) | 15 (16) | 10 (9) | 3 (8) | |
| Moderate (20–28) | 12 (5) | 4 (4) | 8 (7) | 0 (0) | |
| Severe (29–63) | 13 (5) | 3 (3) | 5 (4) | 5 (14) | |
METs-h/wk: Metabolic equivalents of tasks-hours per week, BMI: body mass index., GCSE: General Certificate of Secondary Education, O-level: ordinary level. p-values were derived through a Chi-squared test of independence to display differences in physical activity, mental health indicators, and BMI of participants across the three Alternate Mediterranean diet (aMD) scores categories. The differences between median (IQR) of physical, mental health, and lifestyle characteristics were explored with Kruskal–Wallis test and post-hoc pairwise comparisons. * represents N (%). # represents median (IQR). aMDS: alternate Mediterranean Diet Score.
Table 2.
Socio-demographic characteristics of participants (n = 244).
| Participants’ Characteristics (N (%)) | Total Sample N (%) | Alternate Mediterranean Diet Adherence Categories | p-Value | ||
|---|---|---|---|---|---|
| Low aMDS (0–3) | Medium aMDS (4–6) | High aMDS (7–9) | |||
| 95 (39) | 113 (46) | 36 (15) | |||
| Father’s education | 0.626 | ||||
| No qualifications | 23 (9) | 8 (8) | 11 (10) | 4 (11) | |
| Certificate of Secondary education (CSE) taken at 14–16 years at a lower level than GCSE | 57 (23) | 28 (29) | 25 (22) | 4 (11) | |
| O-level or GCSE examinations taken at 16 years | 71 (29) | 23 (24) | 35 (31) | 13 (36) | |
| A-level school examinations taken at 18 years | 45 (18) | 18 (19) | 19 (17) | 8 (22) | |
| Higher education | 48 (20) | 18 (19) | 23 (20) | 7 (19) | |
| Mother’s education | 0.399 | ||||
| No qualifications | 16 (7) | 5 (5) | 9 (8) | 2 (6) | |
| Certificate of Secondary education (CSE) taken at 14–16 years at a lower level than GCSE | 47 (19) | 24 (25) | 20 (18) | 3 (8) | |
| O-level or GCSE examinations taken at 16 years | 82 (34) | 26 (27) | 41 (36) | 15 (42) | |
| A-level school examinations taken at 18 years | 44 (18) | 17 (18) | 18 (16) | 9 (25) | |
| Higher education | 55 (23) | 23 (24) | 25 (22) | 7 (19) | |
| Father’s occupation | 0.424 | ||||
| Working as an employee | 92 (38) | 35 (37) | 42 (37) | 15 (42) | |
| On a government sponsored training scheme | 5 (2) | 4 (4) | 1 (1) | 0 (0) | |
| Self-employed or freelance | 68 (28) | 28 (29) | 30 (27) | 10 (28) | |
| Working paid or unpaid for your own or your family’s business | 31 (13) | 13 (14) | 15 (13) | 3 (8) | |
| Doing any other kind of paid work | 9 (4) | 6 (6) | 1 (1) | 2 (6) | |
| Retired (whether receiving a pension or not) | 36 (15) | 8 (8) | 22 (19) | 6 (17) | |
| Long-term sick or disabled | 3 (1) | 1 (1) | 2 (2) | 0 (0) | |
| Mother’s occupation | 0.266 | ||||
| Working as an employee? | 101 (41) | 38 (40) | 43 (38) | 20 (56) | |
| On a government sponsored training scheme | 9 (4) | 4 (4) | 5 (4) | 0 (0) | |
| Self-employed or freelance | 25 (10) | 6 (6) | 14 (12) | 5 (14) | |
| Working paid or unpaid for your own or your family’s business | 17 (7) | 9 (9) | 7 (6) | 1 (3) | |
| 20 (8) | 11 (12) | 6 (5) | 3 (8) | ||
| Doing any other kind of paid work | |||||
| Retired (whether receiving a pension or not) | 34 (14) | 8 (8) | 22 (19) | 4 (11) | |
| Looking after home or family | 27 (11) | 14 (15) | 11 (10) | 2 (6) | |
| Long-term sick or disabled | 11 (5) | 5 (5) | 5 (4) | 1 (3) | |
| Income per year | 0.047 | ||||
| <£13,000 | 119 (49) | 43 (45) | 54 (48) | 22 (61) | |
| £13,000 to £33,800 | 99 (40) | 45 (48) | 47 (41) | 7 (19) | |
| >£33,800 | 26 (11) | 7 (7) | 12 (11) | 7 (19) | |
| Parents’ annual income | 0.432 | ||||
| <£13,000 | 36 (15) | 14 (15) | 15 (13) | 7 (19) | |
| £13,000 to £23,400 | 51 (21) | 21 (22) | 25 (22) | 5 (14) | |
| >£23,400 to £33,800 | 69 (28) | 31 (33) | 33 (29) | 5 (14) | |
| >£33,800 to £52,000 | 47 (19) | 16 (17) | 20 (18) | 11 (31) | |
| >£52,000 | 41 (17) | 13 (14) | 20 (18) | 8 (22) | |
| Marital Status | 0.46 | ||||
| Single | 176 (72) | 67 (71) | 84 (74) | 25 (69) | |
| Married | 43 (18) | 16 (17) | 18 (16) | 9 (25) | |
| Divorced | 17 (7) | 9 (9) | 8 (7) | 0 (0) | |
| Separated but still legally married | 6 (2) | 3 (3) | 2 (2) | 1 (3) | |
| Widowed | 2 (1) | 0 (0) | 1 (1) | 1 (3) | |
| Smoking | 0.47 | ||||
| Current Smoker | 56 (23) | 25 (26) | 23 (20) | 8 (22) | |
| Ex-smoker | 27 (11) | 10 (11) | 11 (10) | 6 (17) | |
| Never smoked | 161 (66) | 60 (63) | 79 (70) | 22 (61) | |
| Religion | 0.437 | ||||
| No religion | 104 (43) | 36 (38) | 53 (47) | 15 (42) | |
| Christian | 105 (43) | 45 (47) | 42 (37) | 18 (50) | |
| Buddhist | 7 (3) | 2 (2) | 5 (4) | 0 (0) | |
| Hindu | 9 (4) | 5 (5) | 3 (3) | 1 (3) | |
| Jewish | (0) | (0) | (0) | (0) | |
| Muslim | 19 (8) | 7 (7) | 10 (9) | 2 (6) | |
| Sikh | (0) | (0) | (0) | (0) | |
| Ethnicity | 0.231 | ||||
| Mixed/multiple ethnic groups | 10 (4) | 5 (5) | 4 (4) | 1 (3) | |
| White | 177 (73) | 61 (64) | 82 (73) | 34 (34) | |
| Asian/Asian British | 35 (14) | 18 (19) | 16 (14) | 1 (3) | |
| Black/African/Caribbean/Black British | 15 (6) | 7 (7) | 8 (7) | 0 (0) | |
| Other ethnic group | 7 (3) | 4 (4) | 3 (3) | 0 (0) | |
| Parity | 0.229 | ||||
| Never | 189 (77) | 72 (76) | 92 (81) | 25 (69) | |
| Once | 26 (11) | 14 (15) | 6 (5) | 6 (17) | |
| Two times or more | 29 (12) | 9 (9) | 15 (13) | 5 (14) | |
aMDS: alternate Mediterranean Diet Score. GCSE: General Certificate of Secondary Education, O-level: ordinary level. p-values were derived through a Chi-squared test of independence to display differences in socio-demographics of participants across the three alternate Mediterranean diet scores (aMDS) categories.
Table 3.
Orthogonally rotated (varimax) factor loadings for the 3 factors (dietary patterns) of the 11 food groups (grams/day).
Table 3.
Orthogonally rotated (varimax) factor loadings for the 3 factors (dietary patterns) of the 11 food groups (grams/day).
| 11 Food Groups Derived from the European Prospective into Cancer and Nutrition (EPIC) Food Frequency Questionnaire | Factors (Dietary Patterns) | ||
|---|---|---|---|
| 1 | 2 | 3 | |
| Fats and Oils (grams/day) | 0.838 | ||
| Sugars and Snacks (grams/day) | 0.738 | ||
| Cereals (grams/day) | 0.712 | ||
| Alcoholic beverages (grams/day) | 0.665 | ||
| Red and processed meat (grams/day) | 0.553 | ||
| Fish and Seafood (grams/day) | 0.821 | ||
| Eggs (grams/day) | 0.809 | ||
| Milk and milk products (grams/day) | 0.518 | ||
| Fruits (grams/day) | 0.750 | ||
| Vegetables (grams/day) | 0.747 | ||
| Nuts and Seeds (grams/day) | 0.619 | ||
Table 4.
Multiple regression models showing the association between each a-posteriori-derived diet pattern and its predictor variables.
Table 4.
Multiple regression models showing the association between each a-posteriori-derived diet pattern and its predictor variables.
| Model | Predictor | Coefficient Estimate | p-Value |
|---|---|---|---|
| 1 (DP-1) “fats & oils, sugars & snacks, alcoholic beverages, red and processed meat, and cereals” DP | Intercept | 0.419 | <0.001 |
| Stress | 0.003 | 0.005 | |
| Physical activity (METs-h/wk) | −0.0000002 | 0.395 | |
| BMI | 0.002 | 0.062 | |
| Age | −0.003 | 0.004 | |
| Father’s educational level (A-level/higher) | −0.027 | 0.107 | |
| Mother’s educational level (A-level/higher) | −0.006 | 0.713 | |
| Ethnicity (white) | 0.026 | 0.128 | |
| Father’s occupation (other) | 0.015 | 0.369 | |
| Mother’s occupation (other) | 0.022 | 0.174 | |
| Smoking status (smoker) | −0.05 | 0.005 | |
| Participant’s income (above average) | 0.026 | 0.098 | |
| 2 (DP-2) “fish & seafood, eggs, and milk & milk products” DP | Intercept | 0.441 | <0.0001 |
| Stress | −0.002 | 0.14 | |
| Depression | 0.0001 | 0.676 | |
| Mother’s education (A-level/higher) | −0.038 | 0.019 | |
| Father’s occupation (other) | 0.035 | 0.057 | |
| Mother’s occupation (other) | 0.018 | 0.313 | |
| Participant’s income (above average) | 0.033 | 0.069 | |
| 3 (DP-3) “fruits, vegetables, and nuts & seeds” DP | Intercept | 0.653 | <0.001 |
| Stress | −0.005 | <0.001 | |
| Physical activity (METs-h/wk) | 0.0000006 | 0.115 | |
| BMI | −0.005 | 0.001 | |
| Ethnicity (white) | −0.047 | 0.013 | |
| Parent’s income (above average) | 0.023 | 0.184 | |
| Smoking (smoker) | 0.033 | 0.092 |
DP: dietary pattern. METs-h/wk: metabolic equivalents of tasks-hours per week. Model 1 of the first dietary pattern was based on the following formula: DP − 1 = β0 + β1 Stress + β2 Physical activity + β3 BMI + β4 Age + β5 Father’s educational level + β6 Mother’s educational level + β7 Ethnicity + β8 Father’s occupation + β9 Mother’s occupation + β10 Smoking status + β11 Participant’s income. Model 2 of the second dietary pattern was based on the following formula: DP − 2 = β0 + β1 Stress + β2 Depression + β3 Mother’s education + β4 Father’s occupation + β5 Mother’s occupation + β6 Participant’s income. Model 3 of the third dietary pattern was based on the following formula: DP − 3 = β0 + β1 Stress + β2 Physical activity + β3 BMI + β4 Ethnicity + β5 Parent’s income + β6 Smoking.
Publisher’s Note: MDPI stays neutral with regard to jurisdictional claims in published maps and institutional affiliations. |
© 2021 by the authors. Licensee MDPI, Basel, Switzerland. This article is an open access article distributed under the terms and conditions of the Creative Commons Attribution (CC BY) license (https://creativecommons.org/licenses/by/4.0/).
Share and Cite
MDPI and ACS Style
Khaled, K.; Hundley, V.; Tsofliou, F. Poor Dietary Quality and Patterns Are Associated with Higher Perceived Stress among Women of Reproductive Age in the UK. Nutrients 2021, 13, 2588. https://0-doi-org.brum.beds.ac.uk/10.3390/nu13082588
AMA Style
Khaled K, Hundley V, Tsofliou F. Poor Dietary Quality and Patterns Are Associated with Higher Perceived Stress among Women of Reproductive Age in the UK. Nutrients. 2021; 13(8):2588. https://0-doi-org.brum.beds.ac.uk/10.3390/nu13082588
Chicago/Turabian StyleKhaled, Karim, Vanora Hundley, and Fotini Tsofliou. 2021. "Poor Dietary Quality and Patterns Are Associated with Higher Perceived Stress among Women of Reproductive Age in the UK" Nutrients 13, no. 8: 2588. https://0-doi-org.brum.beds.ac.uk/10.3390/nu13082588
Note that from the first issue of 2016, this journal uses article numbers instead of page numbers. See further details here.