
Metabolic and Blood Pressure Effects of Consuming Two Kiwifruit Daily for 7 Weeks: A Randomised Controlled Trial


Abstract
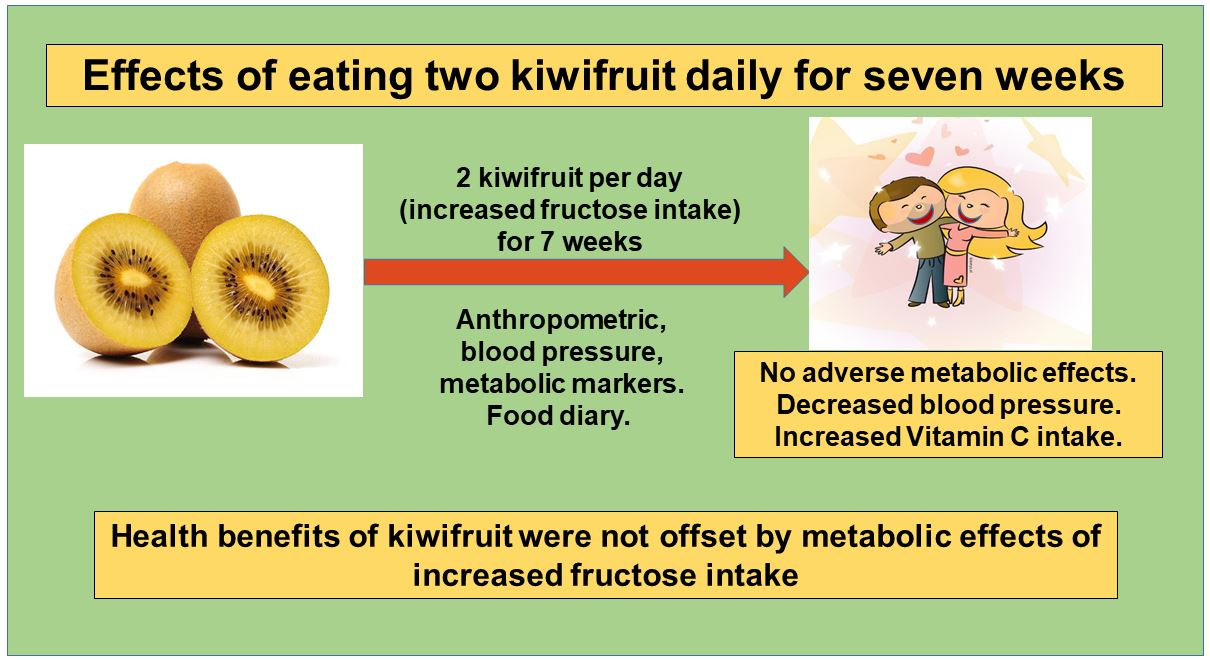
:
1. Introduction
2. Materials and Methods
2.1. Study Protocol
2.2. Clinical Measures
2.3. Statistical Analysis
3. Results
4. Discussion
5. Conclusions
Author Contributions
Funding
Institutional Review Board Statement
Informed Consent Statement
Data Availability Statement
Acknowledgments
Conflicts of Interest
References
- Angelino, D.; Godos, J.; Ghelfi, F.; Tieri, M.; Titta, L.; Lafranconi, A.; Marventano, S.; Alonzo, E.; Gambera, A.; Sciacca, S.; et al. Fruit and vegetable consumption and health outcomes: An umbrella review of observational studies. Int. J. Food Sci. Nutr. 2019, 70, 652–667. [Google Scholar] [CrossRef] [PubMed]
- Radavelli-Bagatini, S.; Blekkenhorst, L.C.; Sim, M.; Prince, R.L.; Bondonno, N.P.; Bondonno, C.P.; Woodman, R.; Anokye, R.; Dimmock, J.; Jackson, B.; et al. Fruit and vegetable intake is inversely associated with perceived stress across the adult lifespan. Clin. Nutr. 2021, 40, 2860–2867. [Google Scholar] [CrossRef] [PubMed]
- Lu, X.; Lu, J.; Fan, Z.; Liu, A.; Zhao, W.; Wu, Y.; Zhu, R. Both Isocarbohydrate and Hypercarbohydrate Fruit Preloads Curbed Postprandial Glycemic Excursion in Healthy Subjects. Nutrients 2021, 13, 2470. [Google Scholar] [CrossRef] [PubMed]
- Havel, P.J. Dietary fructose: Implications for dysregulation of energy homeostasis and lipid/carbohydrate metabolism. Nutr. Rev. 2005, 63, 133–157. [Google Scholar] [CrossRef] [PubMed]
- Stanhope, K.L. Role of Fructose-Containing Sugars in the Epidemics of Obesity and Metabolic Syndrome. Annu. Rev. Med. 2012, 63, 329–343. [Google Scholar] [CrossRef]
- Stanhope, K.L.; Schwarz, J.M.; Keim, N.L.; Griffen, S.C.; Bremer, A.A.; Graham, J.L.; Hatcher, B.; Cox, C.L.; Dyachenko, A.; Zhang, W.; et al. Consuming fructose-sweetened, not glucose-sweetened, beverages increases visceral adiposity and lipids and decreases insulin sensitivity in overweight/obese humans. J. Clin. Investig. 2009, 119, 1322–1334. [Google Scholar] [CrossRef] [Green Version]
- E Perez-Pozo, S.; Schold, J.; Nakagawa, T.; Sanchez-Lozada, L.-G.; Johnson, R.J.; Lillo, J.L. Excessive fructose intake induces the features of metabolic syndrome in healthy adult men: Role of uric acid in the hypertensive response. Int. J. Obes. 2009, 34, 454–461. [Google Scholar] [CrossRef] [Green Version]
- Caliceti, C.; Calabria, D.; Roda, A.; Cicero, A.F.G. Fructose Intake, Serum Uric Acid, and Cardiometabolic Disorders: A Critical Review. Nutrients 2017, 9, 395. [Google Scholar] [CrossRef] [Green Version]
- White, S.J.; Carran, E.L.; Reynolds, A.N.; Haszard, J.J.; Venn, B.J. The effects of apples and apple juice on acute plasma uric acid concentration: A randomized controlled trial. Am. J. Clin. Nutr. 2018, 107, 165–172. [Google Scholar] [CrossRef]
- Laughlin, M.R. Normal Roles for Dietary Fructose in Carbohydrate Metabolism. Nutrients 2014, 6, 3117–3129. [Google Scholar] [CrossRef] [Green Version]
- Ford, E.S.; Will, J.C.; Bowman, B.A.; Narayan, K.M.V. Diabetes Mellitus and Serum Carotenoids: Findings from the Third National Health and Nutrition Examination Survey. Am. J. Epidemiol. 1999, 149, 168–176. [Google Scholar] [CrossRef] [PubMed]
- Harasym, J.; Oledzki, R. Effect of fruit and vegetable antioxidants on total antioxidant capacity of blood plasma. Nutrition 2014, 30, 511–517. [Google Scholar] [CrossRef] [PubMed]
- Lubransky, A.; Monro, J.; Mishra, S.; Yu, H.; Haszard, J.J.; Venn, B.J. Postprandial Glycaemic, Hormonal and Satiety Responses to Rice and Kiwifruit Preloads in Chinese Adults: A Randomised Controlled Crossover Trial. Nutrients 2018, 10, 1110. [Google Scholar] [CrossRef] [Green Version]
- Chen, Y.-H.; Lee, Y.-C.; Tsao, Y.-C.; Lu, M.-C.; Chuang, H.-H.; Yeh, W.-C.; Tzeng, I.-S.; Chen, J.-Y. Association between high-fasting insulin levels and metabolic syndrome in non-diabetic middle-aged and elderly populations: A community-based study in Taiwan. BMJ Open 2018, 8, e016554. [Google Scholar] [CrossRef]
- Sung, K.-C.C.; Seo, M.-H.H.; Rhee, E.-J.J.; Wilson, A.M. Elevated fasting insulin predicts the future incidence of metabolic syndrome: A 5-year follow-up study. Cardiovasc. Diabetol. 2011, 10, 108. [Google Scholar] [CrossRef] [PubMed] [Green Version]
- Appel, L.J.; Moore, T.J.; Obarzanek, E.; Vollmer, W.M.; Svetkey, L.P.; Sacks, F.M.; Bray, G.A.; Vogt, T.M.; Cutler, J.A.; Windhauser, M.M.; et al. A clinical trial of the effects of dietary patterns on blood pressure. DASH Collaborative Research Group. N. Engl. J. Med. 1997, 336, 1117–1124. [Google Scholar] [CrossRef] [PubMed] [Green Version]
- Roberts, C.K.; Vaziri, N.D.; Barnard, R.J. Effect of diet and exercise intervention on blood pressure, insulin, oxidative stress, and nitric oxide availability. Circulation 2002, 106, 2530–2532. [Google Scholar] [CrossRef] [Green Version]
- Murphy, M.M.; Barraj, L.M.; Spungen, J.H.; Herman, D.R.; Randolph, R.K. Global assessment of select phytonutrient intakes by level of fruit and vegetable consumption. Br. J. Nutr. 2014, 112, 1004–1018. [Google Scholar] [CrossRef] [Green Version]
- Tsubota-Utsugi, M.; Ohkubo, T.; Kikuya, M.; Metoki, H.; Kurimoto, A.; Suzuki, K.; Fukushima, N.; Hara, A.; Asayama, K.; Satoh, H.; et al. High fruit intake is associated with a lower risk of future hypertension determined by home blood pressure measurement: The OHASAMA study. J. Hum. Hypertens. 2010, 25, 164–171. [Google Scholar] [CrossRef]
- The New Zealand Institute for Plant and Food Research Limited and the Ministry of Health. Available online: https://www.foodcomposition.co.nz/search/multifood?report=full-alphabetical (accessed on 29 August 2021).
- Bourne, M. Trapezoidal Rule. Available online: Intmath.com (accessed on 11 November 2021).
- Wallace, I.R.; McEvoy, C.T.; Hunter, S.J.; Hamill, L.L.; Ennis, C.N.; Bell, P.M.; McKinley, M.C. Dose-response effect of fruit and vegetables on insulin resistance in people at high risk of cardiovascular disease: A randomized controlled trial. Diabetes Care 2013, 36, 3888–3896. [Google Scholar] [CrossRef] [Green Version]
- Wang, B.; Liu, K.; Mi, M.; Wang, J. Effect of Fruit Juice on Glucose Control and Insulin Sensitivity in Adults: A Meta-Analysis of 12 Randomized Controlled Trials. PLoS ONE 2014, 9, e95323. [Google Scholar] [CrossRef] [PubMed] [Green Version]
- Suksomboon, N.; Poolsup, N.; Lin, W. Effect of kiwifruit on metabolic health in patients with cardiovascular risk factors: A systematic review and meta-analysis. Diabetes Metab. Syndr. Obes. Targets Ther. 2019, 12, 171–180. [Google Scholar] [CrossRef] [PubMed] [Green Version]
- John, J.H.; Ziebland, S.; Yudkin, P.; Roe, L.S.; Neil, H.A.W.; for the Oxford Fruit and Vegetable Study Group. Effects of fruit and vegetable consumption on plasma antioxidant concentrations and blood pressure: A randomised controlled trial. Lancet 2002, 359, 1969–1974. [Google Scholar] [CrossRef]
- Sivakumaran, S.; Huffman, L.; Sivakumaran, S.; Drummond, L. The nutritional composition of Zespri(R) SunGold Kiwifruit and Zespri(R) Sweet Green Kiwifruit. Food Chem. 2018, 238, 195–202. [Google Scholar] [CrossRef]
- Petersen, K.F.; Laurent, D.; Yu, C.; Cline, G.W.; Shulman, G.I. Stimulating Effects of Low-Dose Fructose on Insulin-Stimulated Hepatic Glycogen Synthesis in Humans. Diabetes 2001, 50, 1263–1268. [Google Scholar] [CrossRef] [PubMed] [Green Version]
- Juraschek, S.; Guallar, E.; Appel, L.J.; Miller, E.R. Effects of vitamin C supplementation on blood pressure: A meta-analysis of randomized controlled trials. Am. J. Clin. Nutr. 2012, 95, 1079–1088. [Google Scholar] [CrossRef] [PubMed]
- Aburto, N.J.; Hanson, S.; Gutierrez, H.; Hooper, L.; Elliott, P.; Cappuccio, F.P. Effect of increased potassium intake on cardiovascular risk factors and disease: Systematic review and meta-analyses. BMJ 2013, 346, f1378. [Google Scholar] [CrossRef] [Green Version]
- Svendsen, M.; Tonstad, S.; Heggen, E.; Pedersen, T.R.; Seljeflot, I.; Bøhn, S.K.; Bastani, N.E.; Blomhoff, R.; Holme, I.M.; Klemsdal, T.O. The effect of kiwifruit consumption on blood pressure in subjects with moderately elevated blood pressure: A randomized, controlled study. Blood Press. 2014, 24, 48–54. [Google Scholar] [CrossRef]
- Sims, I.M.; Monro, J.A. Fiber: Composition, structures, and functional properties. Adv. Food Nutr. Res. 2013, 68, 81–99. [Google Scholar]
- Chang, C.-C.; Lin, Y.-T.; Lu, Y.-T.; Liu, Y.-S.; Liu, J.-F. Kiwifruit improves bowel function in patients with irritable bowel syndrome with constipation. Asia Pac. J. Clin. Nutr. 2010, 19, 451–457. [Google Scholar]
- Rush, E.C.; Patel, M.; Plank, L.D.; Ferguson, L.R. Kiwifruit promotes laxation in the elderly. Asia Pac. J. Clin. Nutr. 2002, 11, 164–168. [Google Scholar] [CrossRef]
- Carlsen, M.H.; Halvorsen, B.L.; Holte, K.; Bøhn, S.K.; Dragland, S.; Sampson, L.; Blomhoff, R. The total antioxidant content of more than 3100 foods, beverages, spices, herbs and supplements used worldwide. Nutr. J. 2010, 9, 3. [Google Scholar] [CrossRef] [PubMed]
- Collins, A.R. Kiwifruit as a Modulator of DNA Damage and DNA Repair. Adv. Food Nutr. Res. 2013, 68, 283–299. [Google Scholar] [CrossRef]
- Rush, E.; Ferguson, L.R.; Cumin, M.; Thakur, V.; Karunasinghe, N.; Plank, L. Kiwifruit consumption reduces DNA fragility: A randomized controlled pilot study in volunteers. Nutr. Res. 2006, 26, 197–201. [Google Scholar] [CrossRef]
- Loffredo, L.; Violi, F. COVID-19 and cardiovascular injury: A role for oxidative stress and antioxidant treatment? Int. J. Cardiol. 2020, 312, 136. [Google Scholar] [CrossRef] [PubMed]
- Skingley, A.; Bungay, H.; Clift, S.; Warden, J. Experiences of being a control group: Lessons from a UK-based randomized controlled trial of group singing as a health promotion initiative for older people. Heal. Promot. Int. 2013, 29, 751–758. [Google Scholar] [CrossRef] [PubMed] [Green Version]
- University of Otago and Ministry of Health. A Focus on Nutrition: Key findings of the 2008/09 New Zealand Adult Nutrition Survey; Ministry of Health: Wellington, New Zealand, 2011. [Google Scholar]
- Gammon, C.S.; Kruger, R.; Minihane, A.M. Kiwifruit consumption favourably affects plasma lipids in a randomized controlled trial in hypercholesterolaemic men. BMJ 2013, 109, 2208–2218. [Google Scholar]


| Characteristic | Total | Control Group | Intervention Group | |
|---|---|---|---|---|
| Sex | Male | 11 | 7 | 4 |
| Female | 32 | 16 | 16 | |
| Age, y—mean (SD) | 21.9 (2.8) | 21.9 (2.0) | 21.9 (3.5) | |
| BMI, kg/m2—mean (SD) | 22.0 (3.0) | 21.6 (3.4) | 22.4 (2.5) | |
| Carbonated Water (n = 18) | Kiwifruit (n = 14) | Mean Difference (95% CI) | ||||
|---|---|---|---|---|---|---|
| Baseline | Change at 4 wk a | Baseline | Change at 4 wk a | Change over 4 wk b | p-Value | |
| Energy (kJ) | 1863 (706) | −277 (1176) | 2100 (968) | −528 (774) | −398 (−1048, 251) | 0.220 |
| Fructose (g) | 3.3 (3.1) | −1.0 (4.4) | 7.1 (9.5) | 4.4 (5.6) | 7.6 (5.1, 10.2) | <0.001 |
| Fibre (g) | 5.8 (3.5) | −0.5 (4.7) | 6.8 (5.0) | −1.7 (3.8) | −0.5 (−2.9, 1.8) | 0.654 |
| Vitamin C (mg) | 11.9 (17.0) | −1.2 (32.4) | 21.5 (47.2) | 233.5 (80) | 240 (198, 281) | <0.001 |
| Vitamin E (mg) | 3.0 (4.0) | −1.5 (4.3) | 2.3 (1.6) | 1.1 (2.0) | 1.8 (0.9, 2.8) | 0.001 |
| Carbohydrate (% energy) | 43.9 (16.6) | −1.1 (15.3) | 56.0 (12.8) | 8.0 (18.8) | 16.0 (4.3, 27.7) | 0.009 |
| Fat (% energy) | 37.7 (15.5) | −0.9 (14.9) | 28.6 (10.7) | −6.6 (16.8) | −12.6 (−21.9, −3.2) | 0.010 |
| Protein (% energy) | 17.4 (7.1) | 2.4 (10.9) | 14.3 (4.3) | −2.0 (6.7) | −3.2 (−10.1, 3.8) | 0.355 |
| Carbonated Water (n = 22) | Kiwifruit (n = 20) | Mean Difference (95% CI) | ||||
|---|---|---|---|---|---|---|
| Baseline a | Change at 7 wk a | Baseline a | Change at 7 wk a | Change over 7 wk b | p-Value | |
| Overnight fasting venous measures | ||||||
| Insulin (μU/mL) | 8.5 (3.6) | 2.1 (4.1) | 8.7 (2.9) | 0.3 (2.0) | −1.62 (−3.48, 0.25) | 0.089 |
| Glucose (mmol/L) | 5.0 (0.3) | 0.0 (0.3) | 4.9 (0.4) | 0.1 (0.3) | 0.00 (−0.15, 0.16) | 0.979 |
| Uric acid (μmol/L) | 304 (80) | 9 (33) | 288 (60) | −1 (26) | −13.0 (−30.4, 4.4) | 0.144 |
| Triglycerides (mmol/L) | 0.87 (0.24) | 0.06 (0.23) | 0.88 (0.44) | −0.05 (0.31) | −0.10 (−0.22, 0.03) | 0.126 |
| Total cholesterol (mmol/L) | 4.5 (1.1) | 0.0 (0.4) | 4.4 (0.8) | 0.0 (0.3) | −0.05 (−0.24, 0.14) | 0.584 |
| Oral glucose tolerance test c iAUC (mmol/L × min) | 273 (135) | 4 (140) | 262 (120) | 55 (81) | 46 (−19, 111) | 0.163 |
| Overnight fasting capillary measures | ||||||
| Glucose (mmol/L) | 5.1 (0.4) | 0.0 (0.3) | 5.0 (0.5) | 0.1 (0.4) | 0.09 (−0.06, 0.24) | 0.224 |
| Blood pressure | ||||||
| Systolic (mmHg) | 112 (8) | 1 (6) | 111 (11) | −1 (4) | −2.7 (−5.5, 0.0) | 0.048 |
| Diastolic (mmHg) | 65 (5) | −1 (5) | 68 (7.5) | −4 (6) | −1.4 (−4.4, 1.6) | 0.368 |
| Anthropometry | ||||||
| Weight (kg) | 60.4 (9.3) | 0.1 (2.3) | 59.0 (13.1) | 0.1 (1.1) | −0.12 (1.19, 0.94) | 0.822 |
| BMI (kg/m2) | 22.4 (2.5) | 0.1 (0.9) | 21.6 (3.3) | 0.0 (0.4) | −0.12 (−0.60, 0.32) | 0.591 |
| Waist circumference (cm) | 73 (7) | 0 (3) | 74 (9) | 0 (2) | 0.3 (−1.1, 1.8) | 0.644 |
Publisher’s Note: MDPI stays neutral with regard to jurisdictional claims in published maps and institutional affiliations. |
© 2022 by the authors. Licensee MDPI, Basel, Switzerland. This article is an open access article distributed under the terms and conditions of the Creative Commons Attribution (CC BY) license (https://creativecommons.org/licenses/by/4.0/).
Share and Cite
Monro, J.; Lubransky, A.; Mishra, S.; Haszard, J.; Venn, B. Metabolic and Blood Pressure Effects of Consuming Two Kiwifruit Daily for 7 Weeks: A Randomised Controlled Trial. Nutrients 2022, 14, 2678. https://0-doi-org.brum.beds.ac.uk/10.3390/nu14132678
Monro J, Lubransky A, Mishra S, Haszard J, Venn B. Metabolic and Blood Pressure Effects of Consuming Two Kiwifruit Daily for 7 Weeks: A Randomised Controlled Trial. Nutrients. 2022; 14(13):2678. https://0-doi-org.brum.beds.ac.uk/10.3390/nu14132678
Chicago/Turabian StyleMonro, John, Alex Lubransky, Suman Mishra, Jillian Haszard, and Bernard Venn. 2022. "Metabolic and Blood Pressure Effects of Consuming Two Kiwifruit Daily for 7 Weeks: A Randomised Controlled Trial" Nutrients 14, no. 13: 2678. https://0-doi-org.brum.beds.ac.uk/10.3390/nu14132678