Article

Population Genetic Structure and Chemotype Diversity of Fusarium graminearum Populations from Wheat in Canada and North Eastern United States

by
Abbot O. Oghenekaro
1,
Maria A. Oviedo-Ludena
2,
Mitra Serajazari
3,
Xiben Wang
4,
Maria A. Henriquez
4,
Nancy G. Wenner
5,
Gretchen A. Kuldau
5,
Alireza Navabi
3,†,
Hadley R. Kutcher
2 and
W. G. Dilantha Fernando
1,*
1
Department of Plant Science, University of Manitoba, 66 Dafoe Road, Winnipeg, MB R3T 2N2, Canada
2
Department of Plant Sciences, University of Saskatchewan, 51 Campus Drive, Saskatoon, SK S7N 5A8, Canada
3
Department of Plant Agriculture, University of Guelph, 50 Stone Road E Guelph, Guelph, ON N1G 2W1, Canada
4
Agriculture and Agri-Food Canada (AAFC), Morden Research and Development Centre, 101 Route 100, Morden, MB R6M 1Y5, Canada
5
Department of Plant Pathology and Environmental Microbiology, Pennsylvania State University, 211 Buckhout Lab, University Park, PA 16802, USA
*
Author to whom correspondence should be addressed.
Deceased on 10 March 2019.
Submission received: 1 February 2021 / Revised: 19 February 2021 / Accepted: 22 February 2021 / Published: 1 March 2021
(This article belongs to the Special Issue New Insight into Fusarium Toxins and Aflatoxins)

Abstract

:
Fusarium head blight (FHB) is a major disease in wheat causing severe economic losses globally by reducing yield and contaminating grain with mycotoxins. In Canada, Fusarium graminearum is the principal etiological agent of FHB in wheat, producing mainly the trichothecene mycotoxin, deoxynivalenol (DON) and its acetyl derivatives (15-acetyl deoxynivalenol (15ADON) and 3-acetyl deoxynivalenol (3ADON)). Understanding the population biology of F. graminearum such as the genetic variability, as well as mycotoxin chemotype diversity among isolates is important in developing sustainable disease management tools. In this study, 570 F. graminearum isolates collected from commercial wheat crops in five geographic regions in three provinces in Canada in 2018 and 2019 were analyzed for population diversity and structure using 10 variable number of tandem repeats (VNTR) markers. A subset of isolates collected from the north-eastern United States was also included for comparative analysis. About 75% of the isolates collected in the Canadian provinces of Saskatchewan and Manitoba were 3ADON indicating a 6-fold increase in Saskatchewan and a 2.5-fold increase in Manitoba within the past 15 years. All isolates from Ontario and those collected from the United States were 15ADON and isolates had a similar population structure. There was high gene diversity (H = 0.803–0.893) in the F. graminearum populations in all regions. Gene flow was high between Saskatchewan and Manitoba (Nm = 4.971–21.750), indicating no genetic differentiation between these regions. In contrast, less gene flow was observed among the western provinces and Ontario (Nm = 3.829–9.756) and USA isolates ((Nm = 2.803–6.150). However, Bayesian clustering model analyses of trichothecene chemotype subpopulations divided the populations into two clusters, which was correlated with trichothecene types. Additionally, population cluster analysis revealed there was more admixture of isolates among isolates of the 3ADON chemotypes than among the 15ADON chemotype, an observation that could play a role in the increased virulence of F. graminearum. Understanding the population genetic structure and mycotoxin chemotype variations of the pathogen will assist in developing FHB resistant wheat cultivars and in mycotoxin risk assessment in Canada.
Key Contribution: Identification of pattern of genetic structuring of F. graminearum populations in Canada. Trichothecene chemotypes of F. graminearum in Canada and some parts of the United States cluster together irrespective of geographic regions.

1. Introduction

Fusarium head blight (FHB) is a global disease affecting small grain cereals including wheat, barley and oat [1,2,3,4] The disease is caused by several Fusarium species of which Fusarium graminearum Schwabe is the primary etiological agent in wheat crops in Canada based on the frequency of isolation and impact on grain yield and quality [5,6,7,8]. In addition to a reduction in yield, F. graminearum produces the type B trichothecene mycotoxins, deoxynivalenol (DON) and its acetylated derivatives (15-acetyl-DON (15ADON) and 3-acetyl-DON (3ADON)) in Canada [7,9]. The contamination of wheat by mycotoxins is a serious health concern for both humans and animals. This has led to strict DON tolerance limits in Canada that are established at 2 mg kg−1 body weight for unprocessed grain and 0.2 mg kg−1 for baby food [10].
Epidemics of FHB in western Canada started in the early 1980s when grain samples of wheat from Manitoba showed symptoms of bleached kernels and detectable levels of DON mycotoxin [11,12]. Ever since, increasingly frequent FHB epidemic years occurred in Canadian prairies with the worst outbreak in 2016 in Saskatchewan (SK) and Manitoba (MB) [13]. More recently, outbreaks have extended to the Province of Alberta. Comprehensive surveys of MB and SK wheat fields in the last three years have shown an FHB prevalence (proportion of fields affected) ranging from mild to very serious. One of the most recent epidemics occurred in 2016 with 87% FHB prevalence among wheat fields in Manitoba [8,14,15]. High precipitation, relative humidity and warm temperatures during and after anthesis favors FHB development in wheat [16]. Epidemics of FHB is also enhanced by rapid evolution of Fusarium pathogens and the ability of the disease to spread through airborne ascospores over large areas [17]. These important factors increase the risk of the development of FHB epidemics in the future.
In Canada, FHB outbreaks lead to serious losses in terms of yield coupled with grain contaminated by mycotoxins. Moderately resistant FHB cultivars have been developed through breeding efforts and are used extensively in western Canada; these include AAC Brandon, Cardale and Carberry [18] with AAC Brandon being the predominant cultivar with 66.2% of the acreage in Manitoba in 2019 [19]. Despite the moderate resistance achieved in many cultivars, the percentage of diseased spikes can increase dramatically in severe epidemics. Several surveys and molecular mycotoxin profiling over the last 20 years have shown a temporal and spatial increase in the 3ADON isolates compared to the 15ADON isolates, with a 3ADON vs 15ADON frequency of 10.7% and 31% 3ADON in Saskatchewan and Manitoba, respectively, between 1984 and 2004 [7,9,20]. However, these studies did not consider the mycotoxin sub-structuring profile within the geographic locations in the provinces in Canada.
Population biology studies are critical in providing information that can be utilized to predict disease epidemics and also assist in setting up trials in developing FHB resistant cultivars. Genetic variation in a population is a strong indicator of frequent sexual reproduction and the rapid evolution of a pathogen. Such populations with high genetic variation can quickly adapt to resistant cultivars and fungicide modes of action [21]. The ability of genes or genotypes to migrate to new geographic areas can be predicted by the amount of gene flow between populations [22]. Surveys of Fusarium species associated with FHB in wheat across Canada have shown F. graminearum to be predominant at up to 90% of the Fusarium spp. [7,23,24]. Population genetic studies of F. graminearum collected from wheat in Canada are few and either limited to a single province or performed with isolates collected about 15 years ago. A large-scale population structure study of Canadian isolates collected in 2005–2007 was investigated by [7] revealing a one-fold increase in the 3ADON populations in 2005–2007. Population genetic studies in Manitoba was carried out on isolates collected in 2004–2005 [23,25]. A more recent study in the Province of Ontario utilized isolates collected in 2010–2012 [24]. Pathogen populations can be dynamic in terms of evolutionary rates over space and time, and coupled with changing agronomic practices, can have a huge influence on pathogen population dynamics in a particular geographic location. It is therefore necessary to monitor F. graminearum populations in wheat to detect changes in population structure and understand how these changes can influence the proliferation and development of FHB.
Molecular markers that are unambiguous and polymorphic are important tools in the study of the population biology of plant pathogens [21]. Several genetic markers have been utilized to study genetic diversity in F. graminearum populations. These include random amplified polymorphic DNA, restriction fragment length polymorphism, amplified fragment length polymorphism, microsatellite or simple-sequence repeats and sequence-related amplified polymorphisms [23,26,27,28,29]. For this study, we used the variable number of tandem repeats (VNTR) developed by [30] from the genome of F. graminearum PH−1 (NRRL31084). These markers are more suited to genetic diversity studies than other markers because of the simplicity of polymorphic data collection [30].
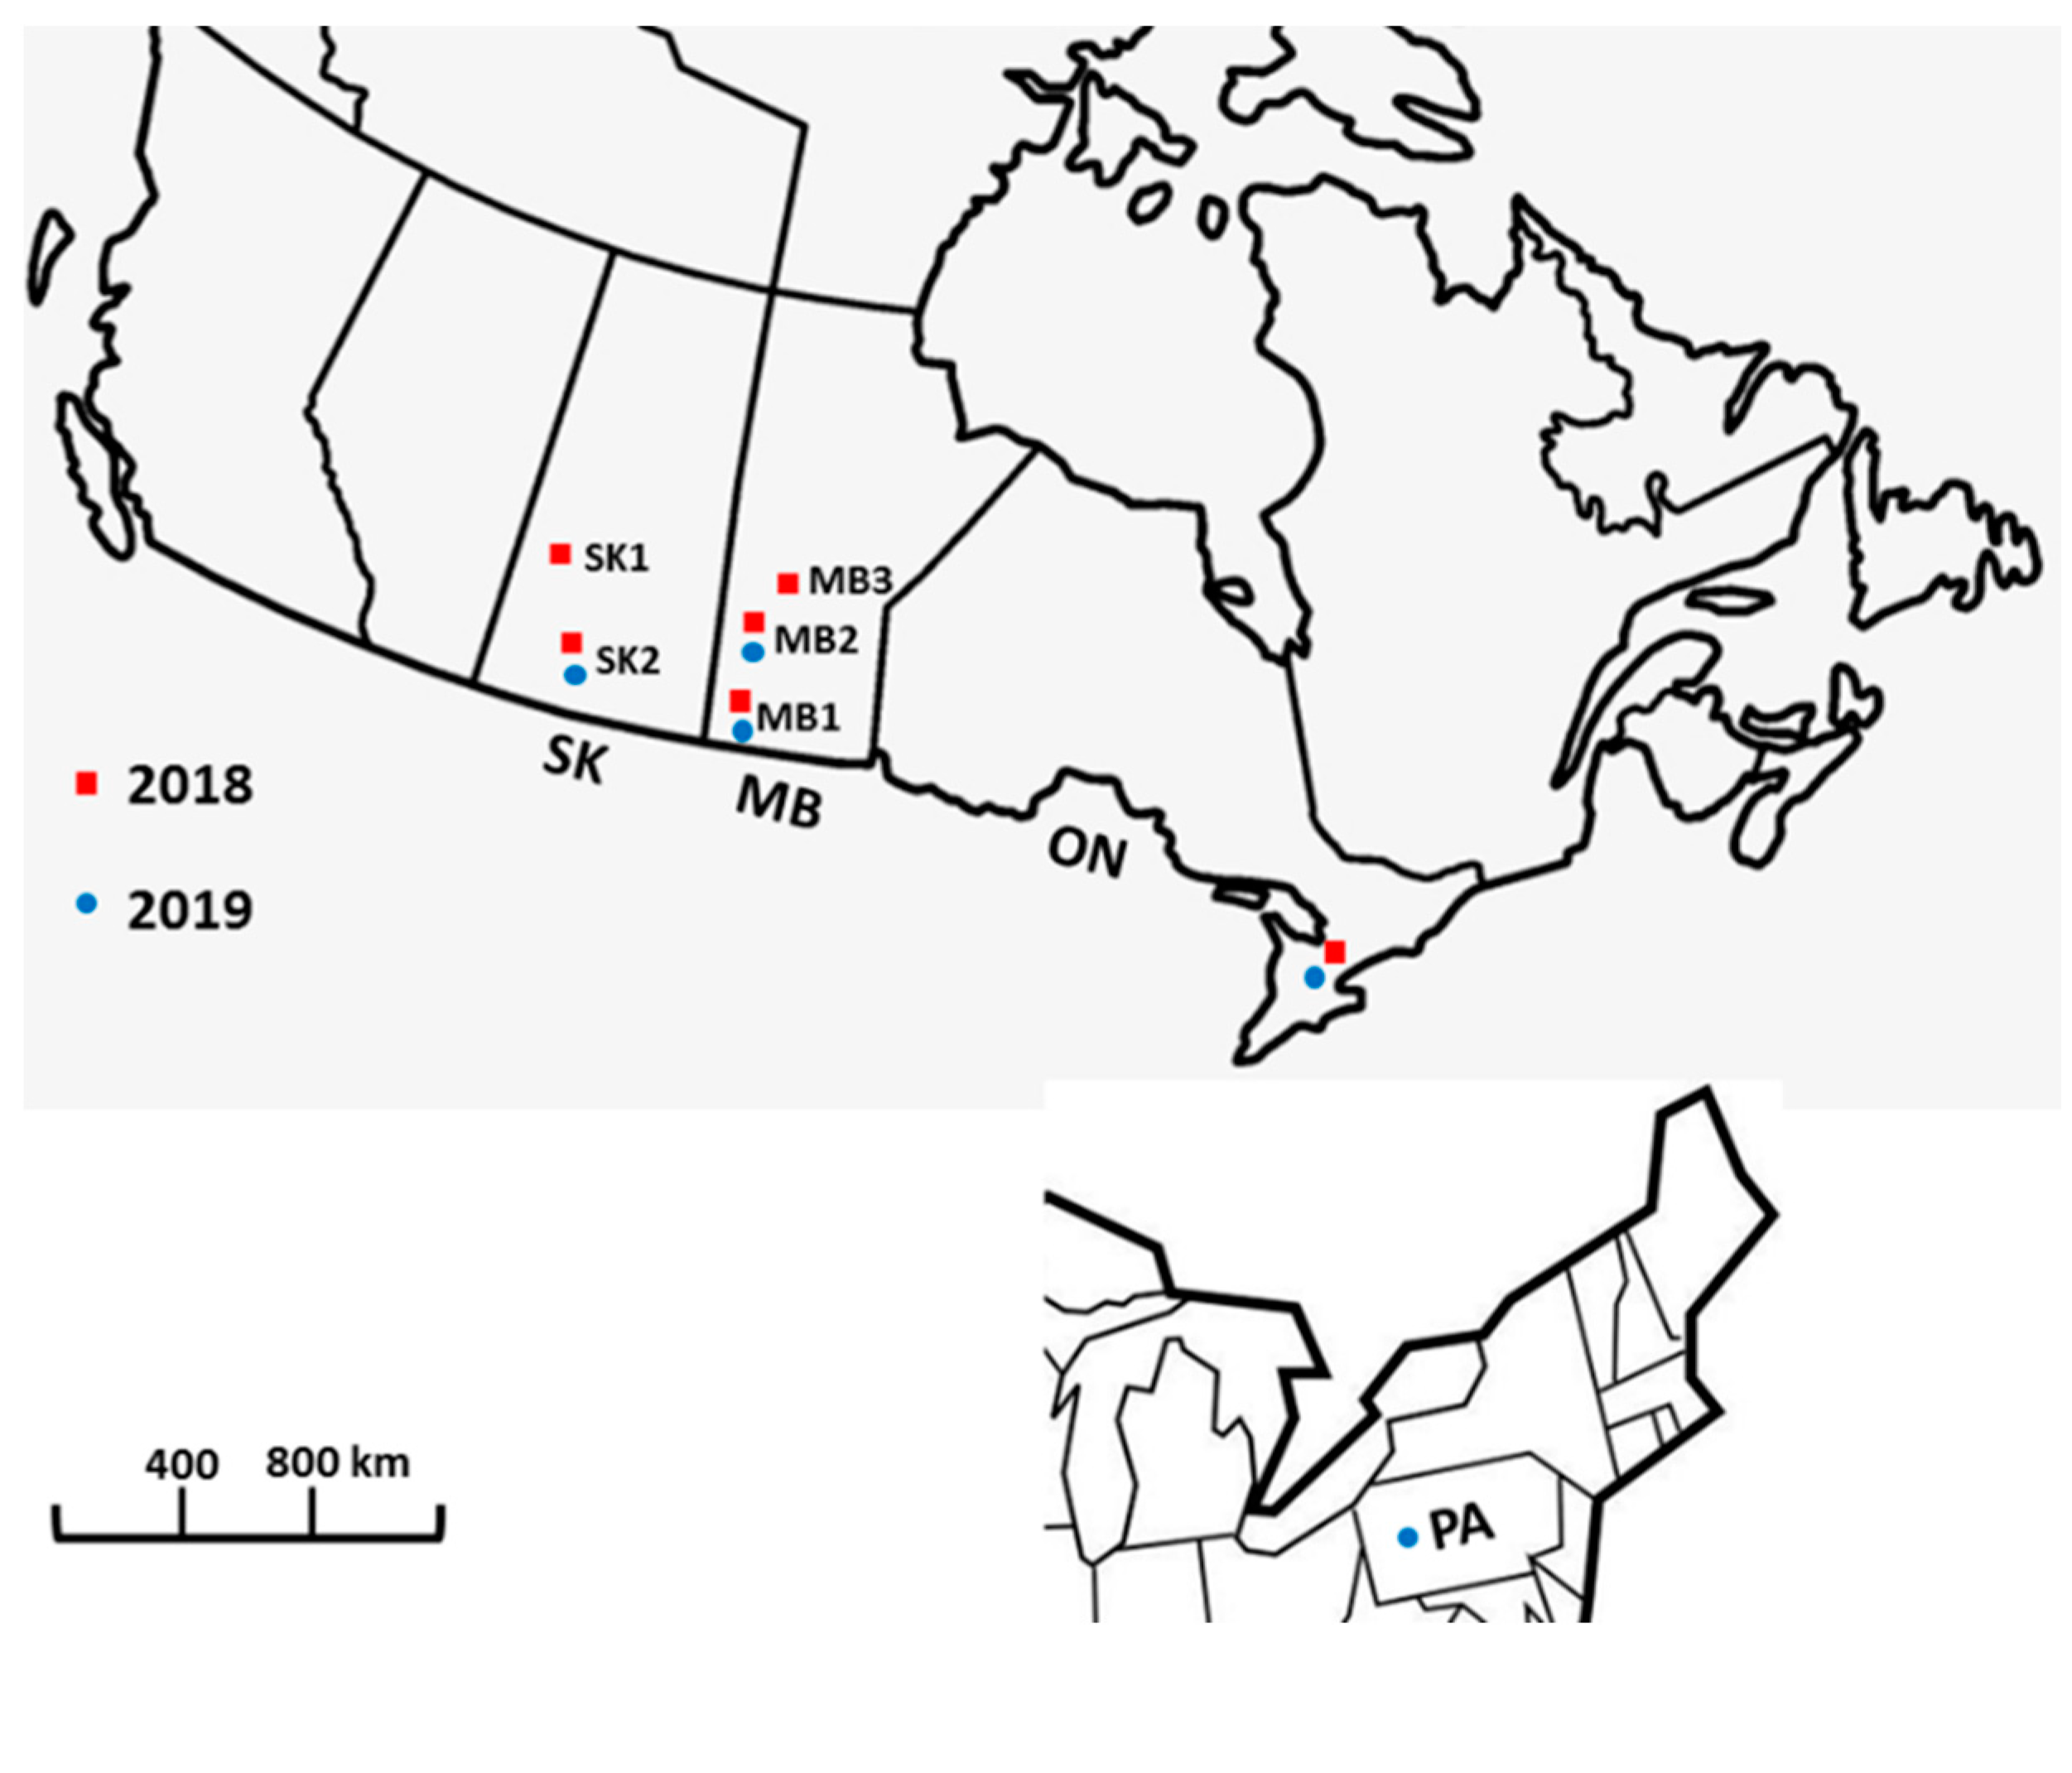
We hypothesize that the mycotoxin chemotype pattern of F. graminearum in wheat is reflected in the population structure within and between provinces in western Canada. The specific objectives were to: (i) investigate the genetic variability and population structure of F. graminearum, and the patterns of relatedness of the populations in Manitoba and Saskatchewan, (ii) investigate the level of gene flow and to determine the correlation of genetic distance with genetic identity, and (iii) determine the DON chemotype distribution within and between the provinces and their relationship with population genetic structure.

2. Results

2.1. Sample Collections

Three provinces in Canada (Saskatchewan, Manitoba and Ontario) were sampled in 2018 and 2019. These includes two geographic regions in Saskatchewan and three in Manitoba. A subset of isolates from The State of Pennsylvania in northeastern USA was also added to the analysis. In total, 570 isolates of F. graminearum were recovered and used for genetic structure analysis and chemotype diversity (Figure 1).

2.2. Trichothecene Chemotype Profiling of F. graminearum

Trichothecene chemotype prediction using multiplex PCR primers (3CON, 3NA, 3D3A and 3D15A) identified the 570 F. graminearum isolates collected in this study as DON chemotypes; either the 3ADON or 15ADON genotype. The 3ADON chemotypes predominated in Saskatchewan and Manitoba in both 2018 and 2019 (Figure 2, Table S1). The frequency of 3ADON chemotypes was >70% in all five geographic regions in western Canada (two in SK and three in MB) except in southern SK in 2019 where it was 68.4%. The frequency of 3ADON chemotypes at the provincial level was 80.2% and 68.4% in 2018 and 2019 for SK and 72.6% and 75.5% for MB (Figure 2, Table S1). The 91 isolates from Ontario (61 in 2018 and 30 in 2019) and 31 isolates from Pennsylvania, USA had 100% 15ADON composition (Figure 2, Table S1). In 2018, 40 out of 41 isolates from Melfort (SK1) and 35 out of 36 isolates from Indian Head (SK2), were of the 3ADON chemotype (Table S1). In some locations in MB, all isolates were 3ADON: 14 collected from Elton and North Cypress in Crop District 2 and 10 isolates from McDonald in Crop District 7 (Table S1).

2.3. Population Genetic Structure Analyses of Geographic Regions

The 10 VNTR markers utilized for genotyping the F. graminearum isolates were highly polymorphic in all geographic regions. The amplicon size ranged from 120–366 bp, while the allelic frequencies ranged from 0.001–0.302 (Table 1). The number of amplified alleles per locus ranged from 14 (HK913, HK917, HK967) to 31 (HK957) making the VNTR locus, HK957 located on chromosome 1, the most polymorphic marker (Table 1).
The genetic diversity statistics of the seven geographic regions were analyzed with GenAlEx. There were 562 unique multilocus haplotypes (98.6% haplotype diversity) in all samples (Table 2). Shannon’s diversity indices (I) were high for all geographic regions (Table 2), ranging from 1.834 (Parkland region of SK) to 2.390 (central MB). High genetic diversity was found in all geographic regions studied. The lowest and highest unbiased gene diversities (uH) were also found in the Parkland region of SK, (0.803) and central MB (0.893), respectively. The number of effective alleles (Ne) within a population ranged from 5.692 in PA to 9.679 in central MB (Table 2).
Pairwise comparisons of genetic identity across the seven geographic regions ranged from 0.416 (MB3 and PA) to 0.889 (SK2 and MB1). Genetic distance pairwise comparisons ranged from 0.118 (SK2 and MB1) to 0.877 (MB2 and PA) (Table 3).
The estimated pairwise FST values between the geographic regions were generally very low between the regions in western Canada, but statistically high when compared to the ON and PA isolates. It ranged from 0.011 (SK2 and MB1/MB1 and MB2) to 0.082 (MB3 and PA). The southwest MB and central MB population pair showed the highest gene flow (Nm = 21.750), while the lowest gene flow (Nm = 4.971) was recorded between the interlake region of MB and PA (Table 4).
The analysis of molecular variance using GenAlEx showed that a large proportion (96%) of the observed genetic variance was explained by allelic variation within the geographic regions and 4% between geographic regions (Table 5).
The STRUCTURE program was utilized to analyze and identify possible structuring of subpopulations as geographic regions among the F. graminearum isolates. The highest rate of change in log-likelihood values was obtained at K = 2, ΔK (>75). Values of ΔK for all other K tested was <30 (Figure 3). Thus, dividing the isolates into two genetic clusters captured the major genetic structure in the data (Figure 4). Assignment of the 562 clone-corrected F. graminearum isolates into the two clusters, designated as CL1 and CL2 based on the Bayesian model-based structuring implemented in the program STRUCTURE is shown in Table 6. The proportion of membership (q), of each cluster, ranging from 0 to 1, for each isolate in the seven populations was determined and the isolates were assigned to the cluster with the highest proportion. The number of isolates assigned to the two clusters was 309 (55%) for CL1 and 253 (45%) for CL2 (Table 7). The clusters, CL1 (Red) and CL2 (green) contained isolates from all geographic regions except Ontario and Pennsylvania, which had quite all isolates from CL2. A higher percentage of isolates from the five western Canadian regions (SK1, SK2, MB1, MB2 and MB3) belong to the CL1 cluster, which indicated no genetic structuring among these regions (Table 6). In contrast and interestingly, all isolates from Ontario, eastern Canada and PA eastern USA belong to the CL2 cluster indicating no genetic structuring between these two regions (Table 6). The cluster grouping indicated that populations in western Canada are different from those in eastern Canada and the USA. Population structure and admixture estimates of all the isolates for each cluster are shown in Figure 4a indicating no genetic structure between Saskatchewan and Manitoba isolates, but a clear genetic structure if compared to the Ontario and Pennsylvania populations. Further proof of this structuring was observed if the analysis is done with only isolates with membership proportion greater than 0.8 for both CL1 and CL2 (Figure 4b).

2.4. Population Genetic Structure Analyses of Chemotype Populations

The chemotypes were also assigned to the clusters generated from STRUCTURE analysis. Both clusters (CL1 and CL2) had high Shannon Information index (I) and gene diversity (H) of 2.221 and 2.356 and 0.859 and 0.880, respectively (Table 7). Cluster 1 (CL1) had a higher proportion of the 3ADON chemotype (77.4%), while cluster 2 had a higher proportion of the 15ADON (63.2%). Population structure and admixture estimates of the isolates were grouped according to chemotypes and analyzed with STRUCTURE (Figure 5). Interestingly, the 3ADON and 15ADON isolates from Saskatchewan, Manitoba, Ontario and Pennsylvania showed a genetic structuring which grouped according to chemotype regardless of geographic origin, indicating a strong correlation to trichothecene type (Figure 5a). Interestingly, a higher number of admixture isolates (isolates with close to equal coefficient of membership of CL1 and CL2) was observed among the 3ADON isolates compared to the 15ADON (Figure 5a). Further proof of this chemotype structuring was detected when the analysis was done on isolates with membership proportion greater than 0.8 for both CL1 and CL2 (Figure 5b).

3. Discussion

Fusarium graminearum is an economically important plant pathogenic fungus because it is the primary causal agent of FHB in small grain cereals. In Canada, it causes substantial damage to wheat. The optimum conditions for the proliferation of FHB are warm temperatures and high (>90%) relative humidity during flowering [34]. This is a strong indication that the pathogen will continue to be a subject of interest in the future due to the impact of climate change and global warming [35]. In the present study, we used VNTR markers to analyze and characterize the population genetic diversity and structure of F. graminearum isolates collected in three provinces in Canada and in the northeastern USA.
The F. graminearum VNTR markers have been widely used in F. graminearum population genetic analysis [7,9,24,36,37,38,39,40,41,42,43]. In the current study, a high level of polymorphism was detected as indicated by the relatively high Shannon Index values across the geographic regions. This was also identified in the ten VNTR markers used in this study, which proved that it is an appropriate type of marker system for population genetic studies of F. graminearum. The high polymorphism and unique haplotypes (98.6%) identified showed the high genetic diversity and very limited clonal populations of F. graminearum in wheat in Canada.
The present work is the most recent wide-scale study of F. graminearum population structure in Canada. Previous population genetic analysis of F. graminearum in Canada has been done on isolates collected in 2001–2008 [7,9,23]. Our study indicates very high gene flow among isolates from different geographic regions in the two neighboring western provinces: Saskatchewan and Manitoba. The high gene flow points to subpopulations within the two provinces that are part of a larger population that allows for frequent random mating. High gene flow between the eastern Canadian province of Ontario and PA in northeast USA also indicates they probably belong to one population. However, some level of genetic structure was observed for the two trichothecene chemotypes (3ADON and 15ADON) irrespective of geographical locations. This is in agreement with previous results of the clustering of 3ADON and 15ADON chemotypes across Canada [7,9] and the USA [27].
Previous reports have shown that the majority of F. graminearum isolates in wheat in Canada exhibit two longitudinal clines explaining the distribution of the 3ADON and 15ADON chemotypes. The 15ADON chemotype is predominant in eastern Canada (Ontario and Quebec) where the ratio of 15ADON to 3ADON remained relatively constant over the last 15–20 years [7,24]. In contrast, the 3ADON chemotype is predominant in the western provinces of Canada (Alberta, Saskatchewan and Manitoba) and there has been a temporal and spatial increase in 3ADON isolates over the last 20 years [7,
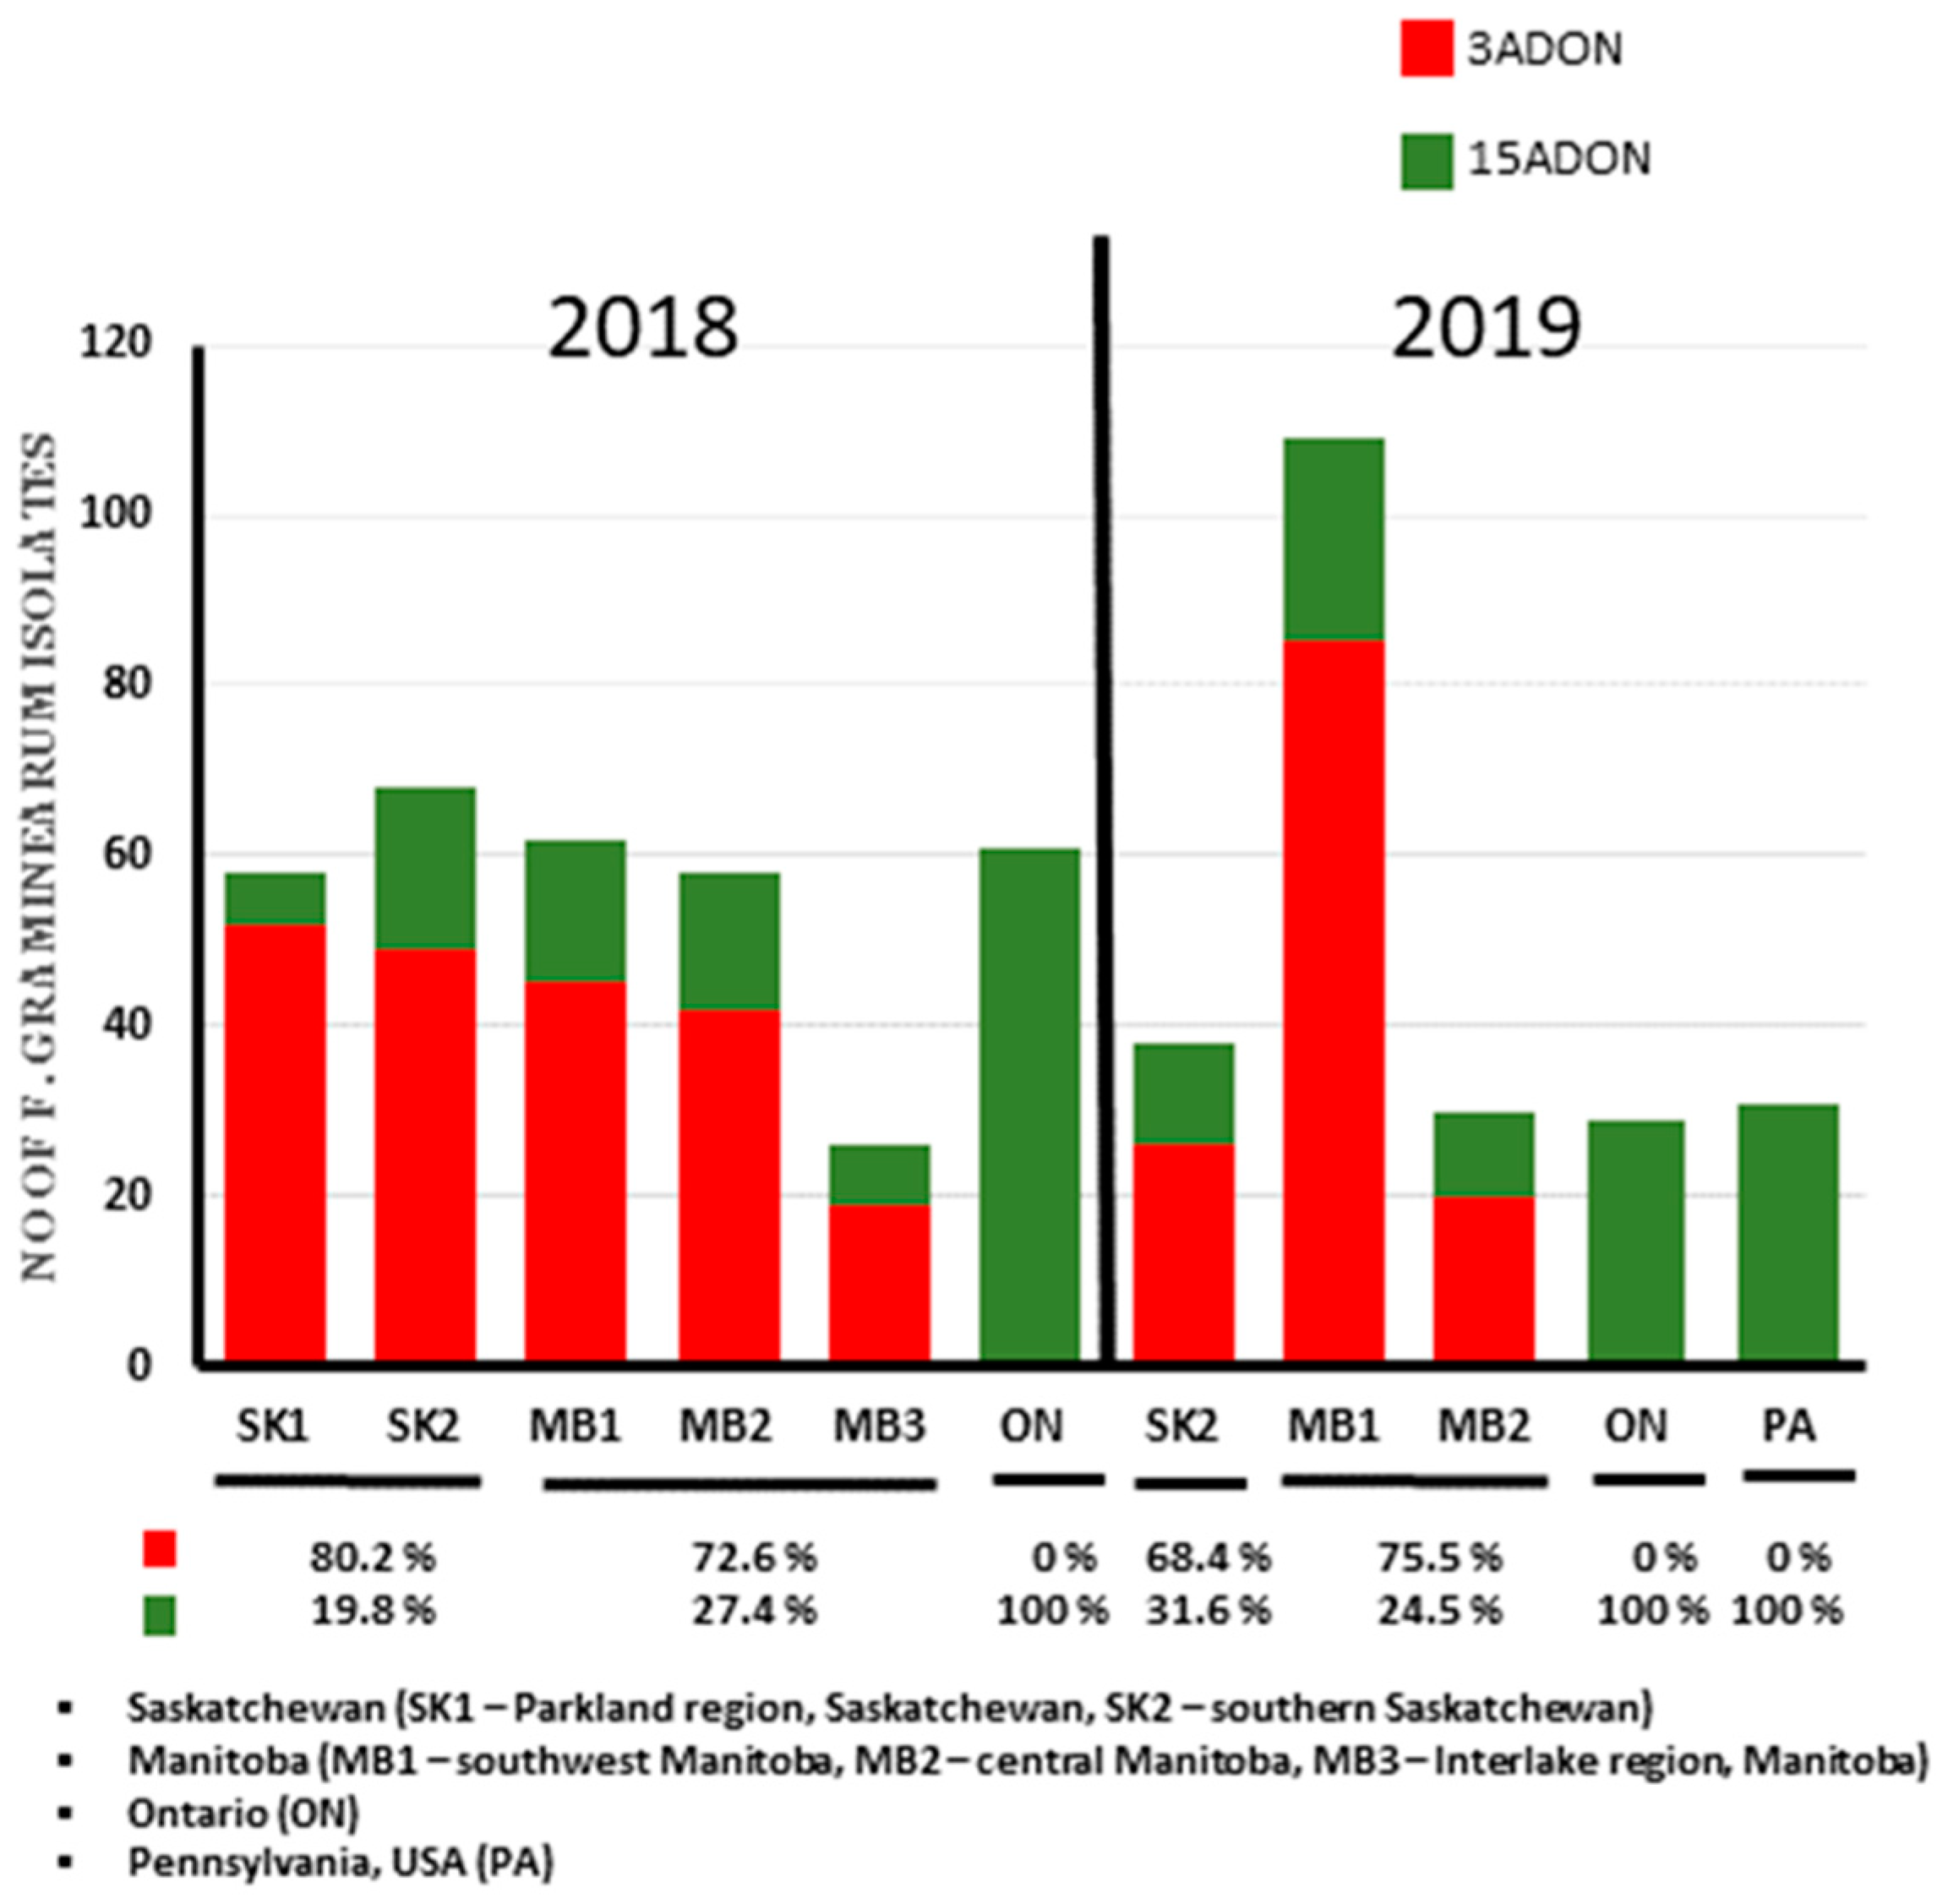
9]. Results from this study support the temporal increase in 3ADON chemotypes in western Canada as over 70% of the isolates were of the 3ADON genotypes. Ref. [9] reported a 10.7% and 31% 3ADON chemotype percentage in 2004 for Saskatchewan and Manitoba. Breakdown of the results of this study show that the 3ADON chemotype increased in Saskatchewan more than 6-fold between 2004 (10.7%) and 2019 (68.4%) and increase in Manitoba 3ADON more than 2.5-fold between 2004 (31%) and 2019 (75.5%). Ref. [23] reported 33.7% 3ADON isolates from 291 isolates of F. graminearum, while the 3ADON percentage in this study of 570 isolates was above ≥70% in both 2018 and 2019. In addition, two regions sampled by [23] from Manitoba (Towns of Killarney and Cartier), which had ≥72% 15ADON composition had a chemotype shift that is now ≥75% 3ADON as recorded in this study. The exact reason for this chemotype shift is a subject of debate but may be due to adaptation as suggested by [9], as the 3ADON isolates have been reported to be more aggressive than their 15ADON counterparts. The higher admixture level observed in the 3ADON isolates might play a role in its higher virulence compared to the 15 ADON isolates [39]. Fungal pathogens with high admixture can significantly influence and speed the evolution of virulence [44].
The chemotype composition of F. graminearum in western Canada was the opposite of that observed in eastern Canada. The 15ADON chemotype is predominant in eastern Canada and PA in the United States. Ref. [24] and [45], respectively, reported a 98% and 97% 15ADON composition of F. graminearum isolates collected from wheat in the Province of Ontario in 2008–2013. After extensive sampling and chemotyping in the mid-west United States, researchers have reported a high 15ADON composition [46,47,48]. Interestingly in this study, all isolates collected from wheat in Ontario and Pennsylvania (northeastern USA) were of the 15ADON chemotype. The high proportion of 3ADON isolates recorded in both Saskatchewan and Manitoba in this study emphasizes the need for regular temporal and spatial monitoring of trichothecene chemotypes across Canada. In addition, Bayesian model population structure analysis identified a different population structure that is associated with trichothecene chemotype differences. This study as well as previous studies on chemotype populations have demonstrated a significant temporal chemotype change in western Canada, which might be strongly linked to differences in local selective pressures among provinces in Canada. This further emphasizes the need for regional solutions to FHB management.
Spatial variability and relatedness of populations from the seven geographic regions were inferred from the genetic identity and genetic distance. Our population genetics analysis suggested that the five F. graminearum populations (SK1, SK2, MB1, MB2 and MB3) from western Canada were genetically similar. This is mainly supported by the high gene flow (Nm, 4.971–21.750) and low genetic differentiation (FST, 0.011–0.048) among regions. Lower gene flow and relatively high genetic differentiation (FST, 0.026–0.082) between the populations in the western provinces and that in Ontario and PA indicated a genetic structure between eastern and western regions. A similar correlation between genetic distance/identity and geographic location was reported for F. graminearum isolates collected from Alberta, Saskatchewan and Manitoba [49]. Ref. [23] also found high gene flow (Nm = 11.176) among 15 subpopulations of F. graminearum in Manitoba. Similarly, high gene flow (Nm = 19.483) was reported among F. graminearum populations collected in wheat fields in Alberta, Saskatchewan and Manitoba [49]. Similar high gene was also recorded between populations from central and southwestern Ontario [24]. The AMOVA results buttressed the points above, since very high genetic variation (96%) was found among individuals within the subpopulations compared with a very low genetic variation (4%) among the subpopulations. This suggests a greater probability of sexual reproduction among the F. graminearum populations in the regions studied. There was no significant difference in the population structure of the geographic regions studied, which agrees with previous studies of F. graminearum isolates collected across Manitoba using sequence-related amplified polymorphism [23]. Trade-in wheat seed between the two provinces is likely a major contributor to the high gene flow between isolates from the different geographic regions. Long-distance spore transfer as shown for F. graminearum [50] might also be a factor responsible for the high gene flow.
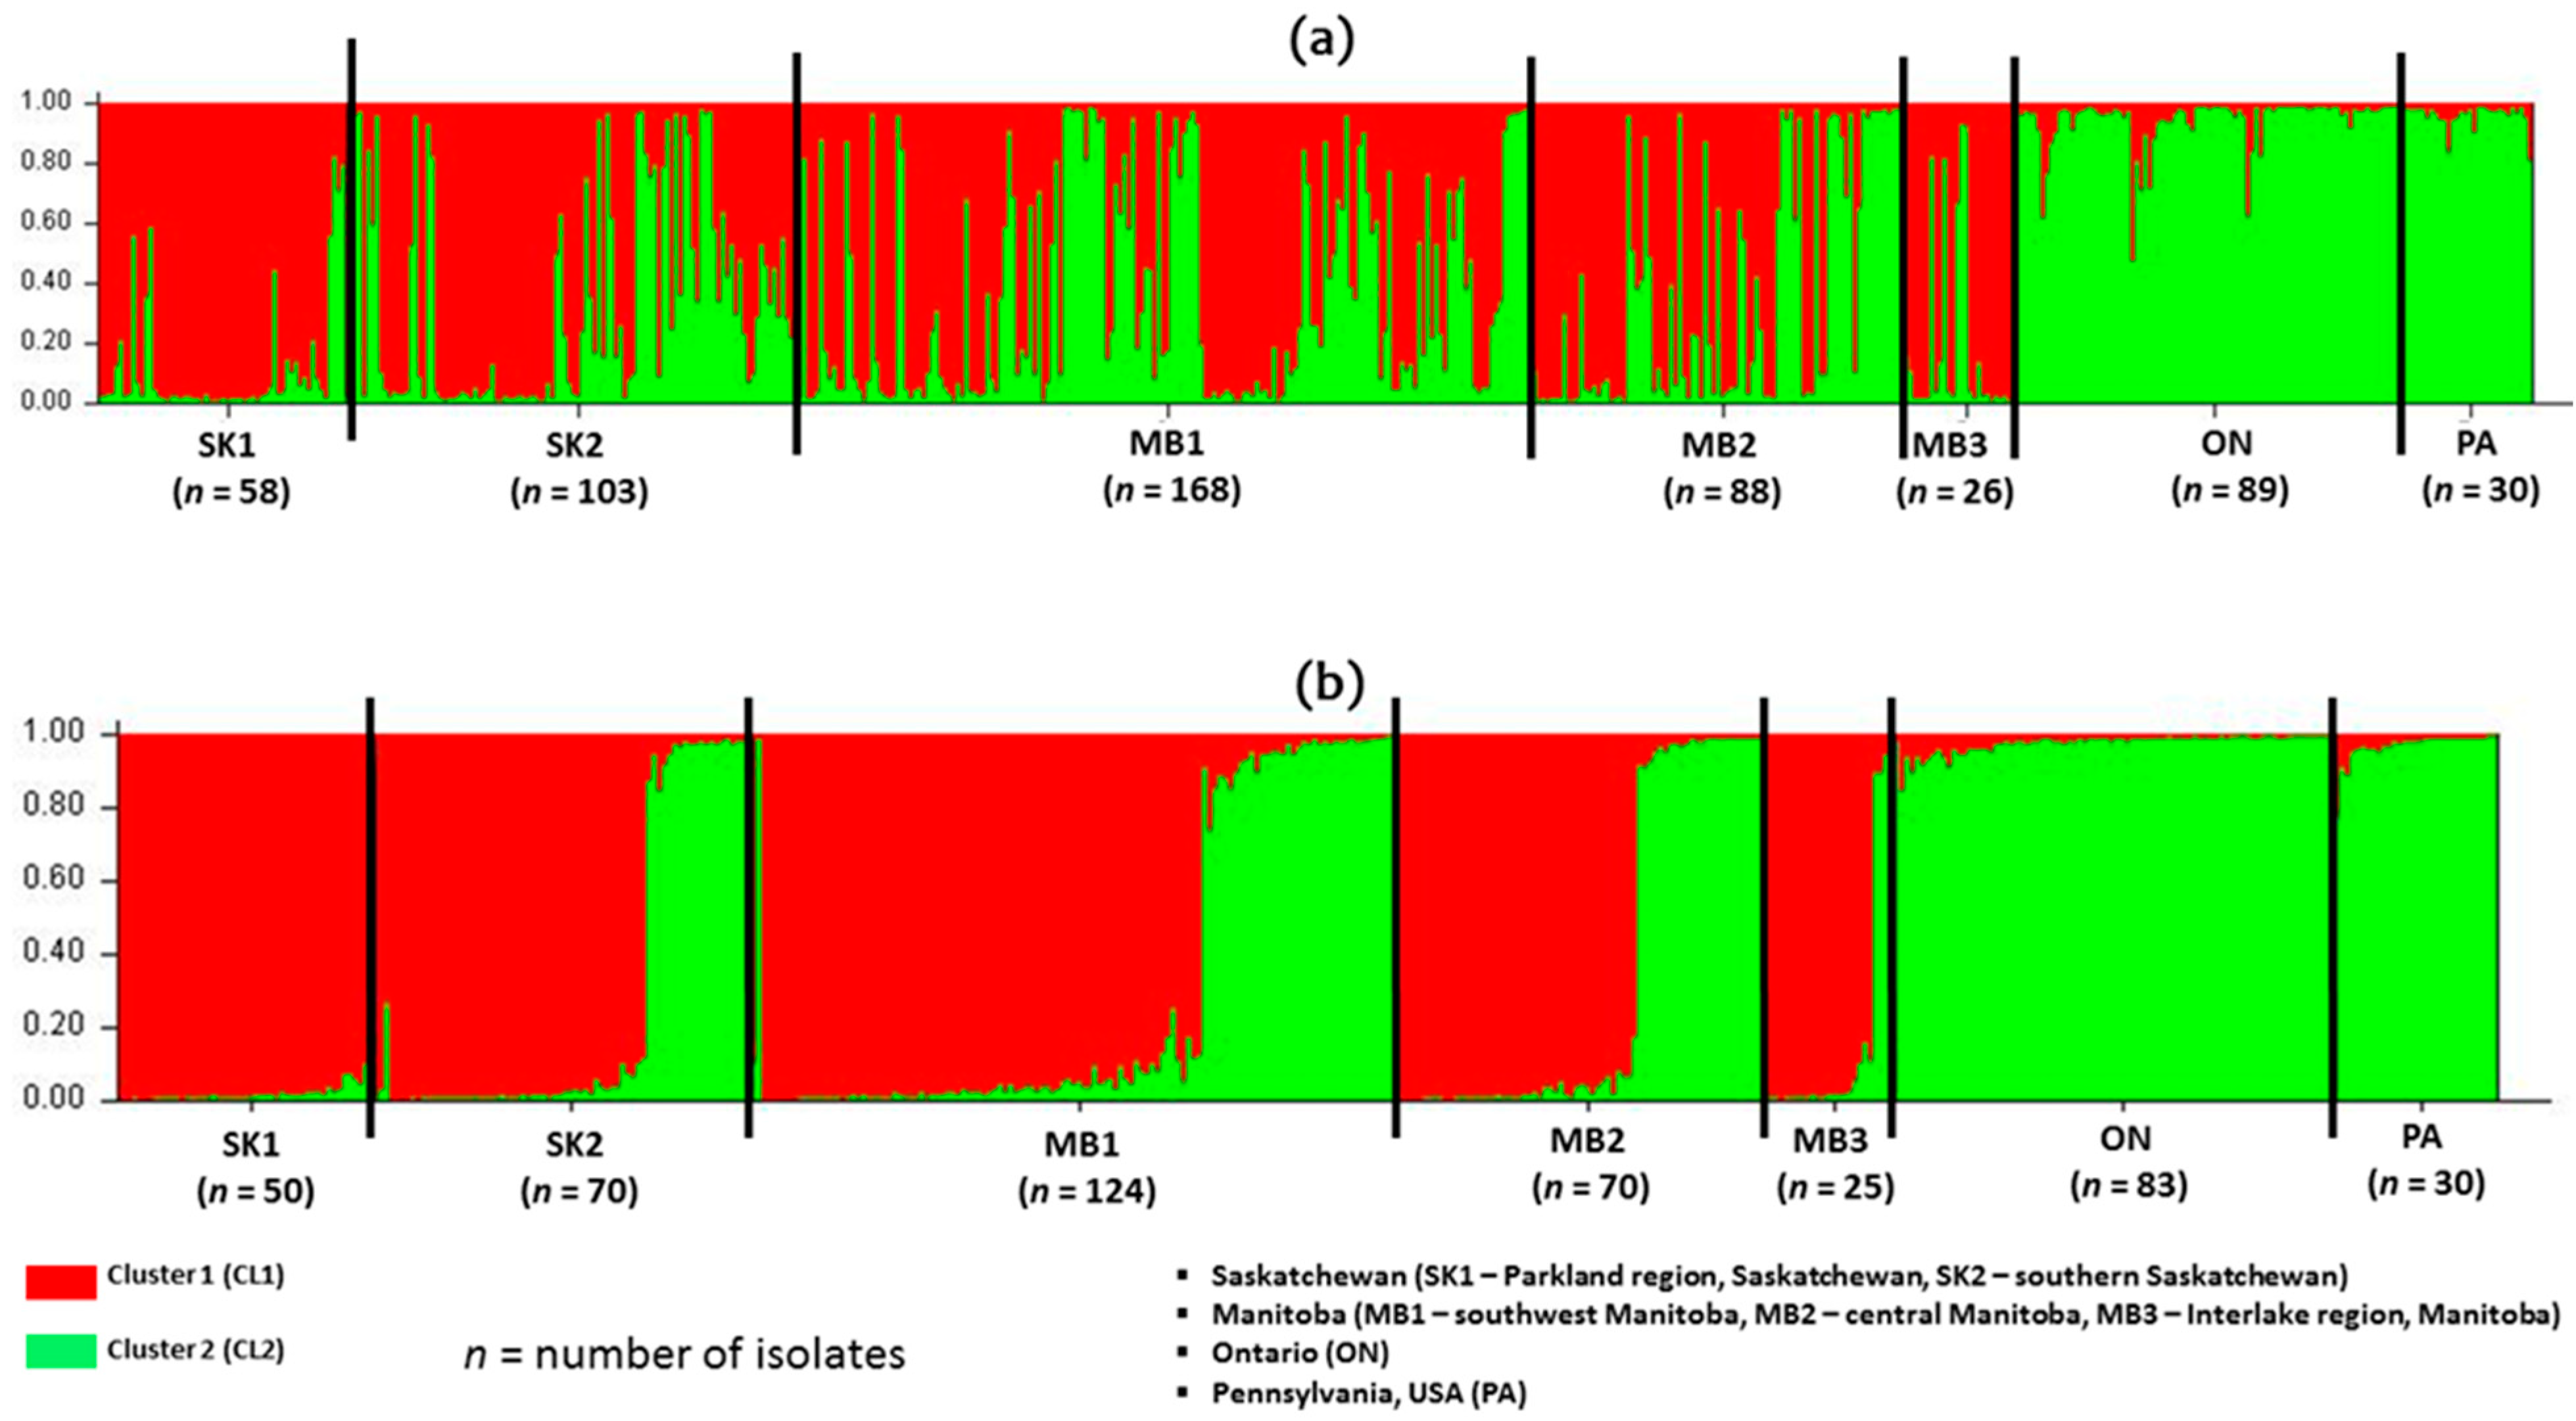
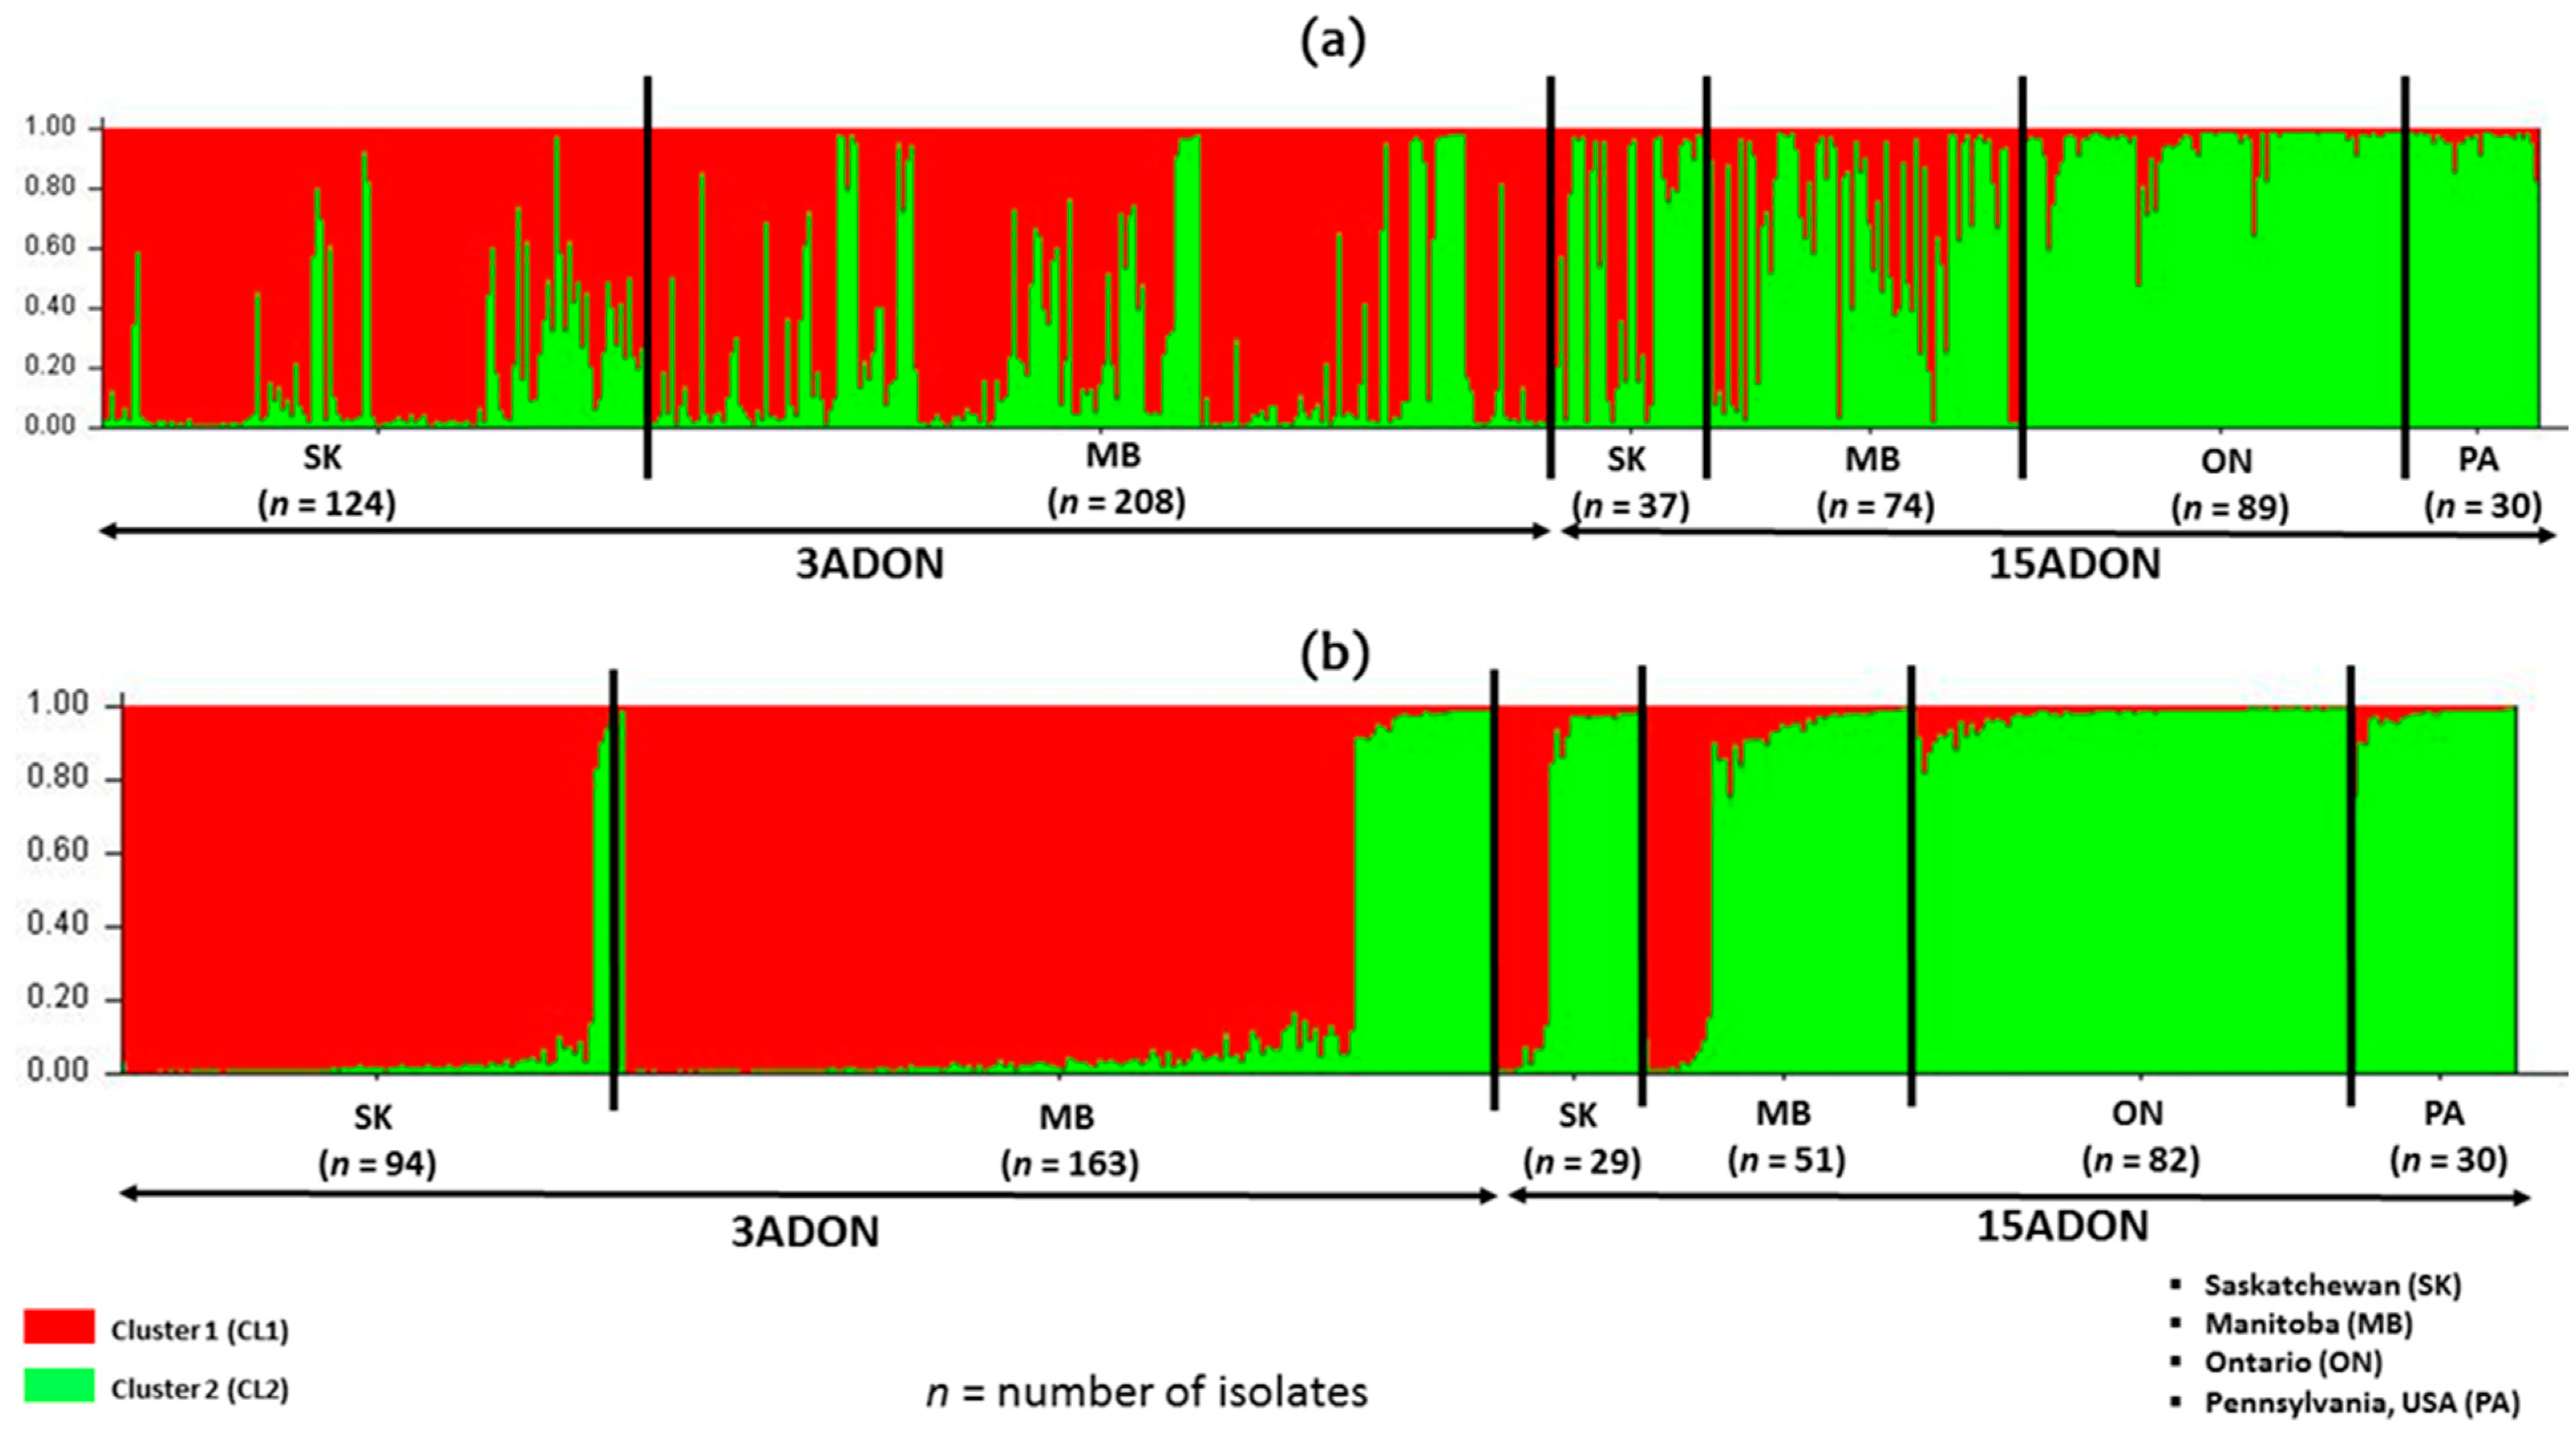
The 3ADON and 15ADON trichothecene chemotype populations from this study appear to be homogenous for chemotype and genetically similar with STRUCTURE Bayesian modelling analysis of cluster isolates. Homogeneity is more visible in the 15ADON chemotype isolates than the 3ADON chemotype isolates. Ref. [51] reported a similar homogenous grouping of 15ADON isolates from Canada, but the main reason for this homogeneity is unclear. This structuring might be limited as there is continuous gene flow between the two-chemotype populations, which may explain the chemotype shifts observed over the years in western Canada. The limited genetic structuring by trichothecene chemotype suggests populations that are not specific to either province or chemotypes might not be a very good indicators of population structure at the provincial level.
This study has provided current information on the population structure and chemotype diversity of F. graminearum isolates in wheat in three important wheat-producing provinces in Canada and on a state in the USA. The class B-Trichothecene profile of F. graminearum isolates world-wide recently reviewed by [52] is very variable in different regions. Management strategies should be geared towards chemotyping studies in local areas in order to correctly estimate and predicts risks in the face of climate changes and agronomic practices like crop rotation. Genetic analysis using VNTR data has revealed high levels of gene flow and genetic variation within the regions studied in the Provinces of Manitoba and Saskatchewan. The higher genetic diversity in Manitoba compared to Saskatchewan might result in more F. graminearum populations with better adaptation to current control strategies including resistant cultivars and fungicides. This is a result of constant sexual recombination between isolates that may suggest a drive towards more pathogenic F. graminearum isolates through mating. The F. graminearum isolates in this study were correlated with trichothecene chemotypes (3ADON and 15ADON) according to stringent genetic structure analyses. An understanding of the correlation of chemotype between or among populations and genetic structure would require more in-depth studies of thousands of isolates collected more recently from across Canada and the United States. In addition, this should contribute to the identification of any fitness attributes that might be associated with the frequency of chemotype shifts observed in this study. Finally, this information on genetic variation among subpopulations will contribute to genetic resistance breeding in wheat, as well as help in mycotoxin risk assessment and the monitoring the of FHB infected seed across Canada.

4. Materials and Methods

4.1. Collection and Fungal Isolation

Wheat heads showing characteristic FHB symptoms were collected in 2018 and 2019 from the provinces of SK, MB and Ontario (ON), Canada and from the State of Pennsylvania (PA) in the northeastern USA. Twenty symptomatic wheat heads were collected from each location. Sampling was designed to cover as much of the geographic region as possible. Information on crop districts and locations sampled was recorded (Table S1). The symptomatic heads were collected randomly at each location and stored in paper envelopes. Infected kernels from the wheat heads were selected and surface sterilized in a 1% sodium hypochlorite solution for 1 min, rinsed in sterile distilled water and air-dried on sterile filter paper. Kernels were plated on potato dextrose agar (PDA; Difco Laboratories) and incubated at 25 °C for 7 days under fluorescent light. Pure cultures of Fusarium spp. were transferred onto Spezieller Nahrstoffarmer agar (SNA) media to allow sporodochia formation and further production of macroconidium cultures. These single spore isolates were stored in PDA media for further use. Fusarium graminearum isolates were identified based on morphological characteristics [53,54].

4.2. Genomic DNA Extraction and PCR Based Species Identification of F. graminearum

Genomic DNA was extracted according to Fernando et al. (2006). Fusarium graminearum isolates were confirmed using molecular markers (Fg16F and Fg16R) specific to F. graminearum [55], which produces an amplification of 450 bp. The PCR amplification reaction (25 µL) consisted of 20 ng template DNA, 2.5 µL 10× PCR buffer containing MgCl2 (FroggaBio, Concord, ON, Canada), 1 μL of dNTP (2.5 mM each), 0.25 μL of each primer (10 mM) and 0.5 U Taq DNA polymerase (FroggaBio, Concord, ON, Canada). Thermal cycling conditions consisted of an initial denaturation at 95 °C for 3 min; followed by 35 cycles of 30 s at 95 °C, 1 min at 56.7 °C, 1 min at 72 °C; and a final extension of 72 °C for 5 min. PCR products were run on a 1% agarose gel.

4.3. Trichothecene Genotype Identification

Multiplex PCR primers 3CON, 3NA, 3D3A and 3D15A [9] were employed to determine trichothecene chemotype of the F. graminearum isolates. This multiplex assay generates an 840 bp fragment for the NIV chemotype, 610 bp fragment for the 15ADON chemotype and 243 bp for the 3ADON chemotype. The PCR amplification reaction (25 µL) consisted of 20 ng template DNA, 2.5 µL 10× PCR buffer containing MgCl2 (FroggaBio, Concord, Canada), 1 μL of dNTP (2.5 mM each), 0.25 μL of each primer (10 mM) and 0.5 U Taq DNA polymerase (FroggaBio, Concord, Canada). The PCR thermal cycling conditions consisted of an initial denaturation at 94 °C for 4 min; followed by 35 cycles of 1 min at 94 °C, 40 s at 58 °C, 40 s at 72 °C; and a final extension of 72 °C for 6 min. PCR amplicons were separated on a 1.5 % agarose gel in 1× TAE buffer stained with RedSafe (FroggaBio, Concord, Canada) and sizes were estimated with a 100 bp DNA ladder.

4.4. Generation of VNTR Data

Isolate genotyping was performed with 10 VNTR markers (HK1043, HK913, HK913, HK957, HK965, HK967, HK1059, HK977, HK630, HK1073) developed by [30]. In total, 570 F. graminearum isolates were collected from the sampled wheat kernels in 2018 and 2019. All isolates were analysed by VNTR PCR. The PCR amplification reaction (25 µL) consisted of 20 ng template DNA, 2.5 µL 10× PCR buffer containing MgCl2 (FroggaBio, Concord, Canada), 2 μL of dNTP (2.5 mM each), 0.5 μL of each primer (10 mM) and 1.25 U Taq DNA polymerase (FroggaBio, Concord, Canada). PCR thermal cycling conditions consisted of an initial denaturation at 94°C for 10 min; followed by 35 cycles of 40 s at 94 °C, 40 s at 58 °C, 1 min at 72 °C; and a final extension of 72 °C for 10 min. The VNTR PCR products were visualised in high resolution 3% MetaPhor (Lonza, Basel, Switzerland) agarose gels. A 100 bp DNA ladder (New England Biolabs) was loaded in the gel and used to estimate band size. Isolates were clone-corrected in which isolates that have identical multilocus genotypes (identical alleles at all ten loci) were represented just once in each population. These resulted in 562 isolates used in the genetic structure analysis. Fusarium graminearum isolates with the same DNA band size were considered the same allele for each VNTR marker. The isolates were grouped into populations (provinces) and sub-populations (geographic regions within each province) based on geography (Figure 1; Table S1). Allelic sizes of all 10 markers estimated from bands observed on gels are listed in Table S1. Data of all 10 VNTR loci were combined to produce a multilocus genotype (G).

4.5. Population Genetic Analysis

Population genetic analysis of F. graminearum was performed to decipher population structure and determine the effects of geographic region and trichothecene genotypes. The provincial populations in Canada were divided into six geographic regions as sub-populations. We used GenAlEx v 6.5 [31,32] to estimate genetic diversity (H), Shannon’s information index (I), analysis of molecular variance (AMOVA), genetic distance based on ΦPT (a standardized equivalent of FST), genetic identity and pairwise gene flow (Nm) for the geographic locations. The AMOVA determined the proportion of variation contributed by the geographic regions. The Nm was calculated based on ΦPT as Nm = 0.5[(1⁄ΦPT) − 1], where ΦPT was calculated as the proportion of the variance among populations relative to the total. We also determined the genetic variation between and within populations with AMOVA, by partitioning covariance components and their levels of significance (p < 0.05 or p < 0.01) using 1000 permutations. Genetic structure and admixture among populations were carried out with Bayesian clustering analyses of VNTR data using STRUCTURE v 2.3.4 [56]. We used the independent allele frequency and admixture (mixed ancestry) models in the analysis [56]. The number of simulated clusters (K) ranged from one to five after performing 100,000 Monte Carlo Markov Chain (MCMC) iterations following a 25,000-iteration burn-in for each run. Ten replicate runs were performed for each K value and STRUCTURE HARVESTER V. A.2 [57] was used to select the optimal model that maximized the rate of change in log-likelihood values (ΔK) based on the Evanno et al. (2005) method. The proportion of membership (q) in each of the K clusters was determined and isolates were assigned to the cluster that had the highest proportion of the membership.

Supplementary Materials

The following are available online at https://0-www-mdpi-com.brum.beds.ac.uk/2072-6651/13/3/180/s1, Table S1, Sample information for 570 F. graminearum isolates used in this study and the VNTR data obtained.

Author Contributions

A.O.O.: Conceptualization, Methodology, Data curation, Formal analysis, Writing—original draft. M.A.O.-L.: Methodology, Writing—review and editing, M.S.: Methodology, Writing—review and editing, X.W.: Methodology, Writing—review and editing, M.A.H.: Methodology, Writing—review and editing, N.G.W.: Methodology, Writing—review and editing, G.A.K.: Writing—review and editing A.N.: Methodology, H.R.K.: Writing—review and editing, W.G.D.F.: Conceptualization, Funding acquisition, Writing—review and editing. All authors have read and agreed to the published version of the manuscript.

Funding

This work was funded by the Western Grains Research Foundation (WGRF), Canada grant awarded to W.G.D.F.

Acknowledgments

The WGRF funding composed of the following organizations enthusiastically supporting our research through funding, and we gratefully acknowledge them; Alberta Wheat Commission; Brewing and Malting Barley Research; Saskatchewan Barley Development Commission; Saskatchewan Wheat Development Commission. We acknowledge support from USDA, National Institute of Food and Agriculture under Federal Appropriations under Project PEN04593, Accession Number 1007124 to G.A.K.

Conflicts of Interest

The authors declare that they have no conflict of interest.

References

  1. McMullen, M.; Jones, R.; Gallenberg, D. Scab of Wheat and Barley: A Re-emerging Disease of Devastating Impact. Plant Dis. 1997, 81, 1340–1348. [Google Scholar] [CrossRef] [Green Version]
  2. Gilbert, J.; Tekauz, A. Review: Recent developments in research on fusarium head blight of wheat in Canada. Can. J. Plant Pathol. 2000, 22, 1–8. [Google Scholar] [CrossRef]
  3. Summerell, B.A.; Laurence, M.H.; Liew, E.C.Y.; Leslie, J.F. Biogeography and Phylogeography of Fusarium: A Review. Fungal Divers. 2010, 44, 3–13. [Google Scholar] [CrossRef]
  4. van der Lee, T.; Zhang, H.; van Diepeningen, A.; Waalwijk, C. Biogeography of Fusarium graminearum species complex and chemotypes: A review. Food Addit. Contam. Part A Chem. Anal. Control Expo. Risk Assess. 2015, 32, 453–460. [Google Scholar] [CrossRef] [Green Version]
  5. Sarver, B.A.; Ward, T.J.; Gale, L.R.; Broz, K.; Kistler, H.C.; Aoki, T.; Nicholson, P.; Carter, J.; O’Donnell, K. Novel Fusarium head blight pathogens from Nepal and Louisiana revealed by multilocus genealogical concordance. Fungal Genet. Biol. 2011, 48, 1096–1107. [Google Scholar] [CrossRef]
  6. Amarasinghe, C.C.; Tittlemier, S.A.; Fernando, W.G.D. Nivalenol-Producing Fusarium cerealis Associated with Fusarium Head Blight in Winter Wheat in Manitoba, Canada. Plant Pathol. 2015, 64, 988–995. [Google Scholar] [CrossRef]
  7. Kelly, A.C.; Clear, R.M.; O’Donnell, K.; McCormick, S.; Turkington, T.K.; Tekauz, A.; Gilbert, J.; Kistler, H.C.; Busman, M.; Ward, T.J. Diversity of Fusarium head blight populations and trichothecene toxin types reveals regional differences in pathogen composition and temporal dynamics. Fungal Genet. Biol. 2015, 82, 22–31. [Google Scholar] [CrossRef] [PubMed]
  8. Henriquez, M.A.; Derksen, H.; Doherty, J.; Miranda, D.E.; Gruenke, O. Fusarium head blight of spring wheat in Manitoba in 2018. Can. Plant Dis. Surv. 2019, 99, 94–95. [Google Scholar]
  9. Ward, T.J.; Clear, R.M.; Rooney, A.P.; O’Donnell, K.; Gaba, D.; Patrick, S.; Starkey, D.E.; Gilbert, J.; Geiser, D.M.; Nowicki, T.W. An adaptive evolutionary shift in Fusarium head blight pathogen populations is driving the rapid spread of more toxigenic Fusarium graminearum in North America. Fungal Genet. Biol. 2008, 45, 473–484. [Google Scholar] [CrossRef]
  10. Codex DON MLs. Maximum Levels for DON in Cereals and Cereal Products: Update on Codex and Health Canada Activities. 2015. Available online: https://static1.squarespace.com/static/56be29e022482ec146a7c5b8/t/58406f5d6a496371af57670a/1480617822134/CWFHB-S14-Elliott.pdf (accessed on 23 May 2020).
  11. Clear, R.M.; Abramson, D. Occurrence of fusarium head blight and deoxynivalenol (vomitoxin) in two samples of Manitoba wheat in 1984. Can. Plant Dis. Surv. 1986, 66, 9–11. [Google Scholar]
  12. Clear, R.M.; Patrick, S.K. Fusarium head blight pathogens isolated from fusarium-damaged kernels in western Canada 1993–1998. Can. J. Plant Pathol. 2000, 22, 51–60. [Google Scholar] [CrossRef]
  13. Canada Grain Commission. Frequency and Severity of Fusarium Damaged Kernels in Wheat Samples from Manitoba, Saskatchewan and Alberta Crop Districts, 2003 to 2019. 2020. Available online: https://www.grainscanada.gc.ca/en/grain-research/export-quality/cereals/wheat/western/annual-fusarium-damage/canada-western-red-spring/?wbdisable=true (accessed on 23 May 2020).
  14. Henriquez, M.A.; Derksen, H.; Doherty, J.; Miranda, D.E.; Gruenke, O. Fusarium head blight of spring wheat in Manitoba in 2016. Can. Plant Dis. Surv. 2017, 97, 125–126. [Google Scholar]
  15. Henriquez, M.A.; Derksen, H.; Doherty, J.; Miranda, D.E.; Gruenke, O. Fusarium head blight of spring wheat in Manitoba in 2017. Can. Plant Dis. Surv. 2018, 98, 121–122. [Google Scholar]
  16. Rossi, V.; Ravanetti, A.; Pattori, E.; Giosuè, S. Influence of temperature and humidity on the infection of wheat spikes by some fungi causing fusarium head blight. J. Plant Pathol. 2001, 83, 189–198. [Google Scholar]
  17. Fernando, W.D.; Oghenekaro, A.O.; Tucker, J.R.; Badea, A. Building on a foundation: Advances in epidemiology, resistance breeding, and forecasting research for reducing the impact of fusarium head blight in wheat and barley. Can. J. Plant Pathol. 2021, 1–32. [Google Scholar] [CrossRef]
  18. Seed Manitoba. Manitoba Agriculture and Rural Development, Manitoba Seed Growers’ Association; Manitoba Co-Operator: Winnipeg, MB, Canada, 2020; Available online: https://www.seedmb.ca/digital-edition/seed-manitoba_2020-01-01/ (accessed on 19 May 2020).
  19. Manitoba Agricultural Services Corporation (MASC). Variety Market Share Report. 2019. Available online: https://www.masc.mb.ca/masc.nsf/sar_varieties_2019.pdf (accessed on 19 May 2020).
  20. Amarasinghe, C.; Sharanowski, B.; Fernando, W.G.D. Molecular Phylogenetic Relationships, Trichothecene Chemotype Diver-sity and Aggressiveness of Strains in a Global Collection of Fusarium graminearum Species. Toxins 2019, 11, 263. [Google Scholar] [CrossRef] [Green Version]
  21. McDonald, B.A.; McDermott, J.M. Population Genetics of Plant Pathogenic Fungi. Bioscience 1993, 43, 311–319. [Google Scholar] [CrossRef]
  22. Milgroom, M.; Fry, W. Contributions of Population Genetics to Plant Disease Epidemiology and Management. Adv. Bot. Res. 1997, 24, 1–30. [Google Scholar] [CrossRef]
  23. Guo, X.W.; Fernando, W.G.D.; Seow-Brock, H.Y. Population Structure, Chemotype Diversity, and Potential Chemotype Shifting of Fusarium graminearum in Wheat Fields of Manitoba. Plant Dis. 2008, 92, 756–762. [Google Scholar] [CrossRef] [PubMed] [Green Version]
  24. Burlakoti, R.R.; Tamburic-Ilincic, L.; Limay-Rios, V.; Burlakoti, P. Comparative Population Structure and Trichothecene Mycotoxin Profiling of Fusarium graminearum from Corn and Wheat in Ontario, Central Canada. Plant Pathol. 2017, 66, 14–27. [Google Scholar] [CrossRef] [Green Version]
  25. Fernando, W.G.D.; Zhang, J.X.; Dusabenyagasani, M.; Guo, X.W.; Ahmed, H.; McCallum, B. Genetic Diversity of Gibberella zeae Isolates from Manitoba. Plant Dis. 2006, 90, 1337–1342. [Google Scholar] [CrossRef] [PubMed]
  26. Tóth, B.; Mesterházy, Á.; Horváth, Z.; Bartók, T.; Varga, M.; Varga, J. Genetic variability of central european isolates of the Fusarium graminearum species complex. Eur. J. Plant Pathol. 2005, 113, 35–45. [Google Scholar] [CrossRef]
  27. Liang, J.; Xayamongkhon, H.; Broz, K.; Dong, Y.; McCormick, S.; Abramova, S.; Ward, T.; Ma, Z.; Kistler, H. Temporal dynamics and population genetic structure of Fusarium graminearum in the upper Midwestern United States. Fungal Genet. Biol. 2014, 73, 83–92. [Google Scholar] [CrossRef]
  28. Astolfi, P.; Reynoso, M.M.; Ramirez, M.L.; Chulze, S.N.; Alves, T.C.A.; Tessmann, D.J.; Del Ponte, E.M. Genetic population structure and trichothecene genotypes of Fusarium graminearum isolated from wheat in southern Brazil. Plant Pathol. 2012, 61, 289–295. [Google Scholar] [CrossRef]
  29. Mahfooz, S.; Srivastava, A.; Srivastava, A.K.; Arora, D.K. A Comparative Analysis of Distribution and Conservation of Microsatellites in the Transcripts of Sequenced Fusarium Species and Development of Genic-SSR Markers for Poly-morphism Analysis. FEMS Microbiol. Lett. 2015, 362, fnv131. [Google Scholar] [CrossRef] [Green Version]
  30. Suga, H.; Gale, L.R.; Kistler, H.C. Development of VNTR markers for two Fusarium graminearum clade species. Mol. Ecol. Notes 2004, 4, 468–470. [Google Scholar] [CrossRef]
  31. Peakall, R.; Smouse, P.E. GENALEX 6: Genetic analysis in Excel. Population genetic software for teaching and research. Mol. Ecol. Notes 2006, 6, 288–295. [Google Scholar] [CrossRef]
  32. Peakall, R.; Smouse, P.E. GenAlEx 6.5: Genetic analysis in Excel. Population genetic software for teaching and research—An update. Bioinformatics 2012, 28, 2537–2539. [Google Scholar] [CrossRef] [Green Version]
  33. Evanno, G.; Regnaut, S.; Goudet, J. Detecting the number of clusters of individuals using the software structure: A simulation study. Mol. Ecol. 2005, 14, 2611–2620. [Google Scholar] [CrossRef] [PubMed] [Green Version]
  34. Shah, D.A.; De Wolf, E.D.; Paul, P.A.; Madden, L.V. Functional Data Analysis of Weather Variables Linked to Fusarium Head Blight Epidemics in the United States. Phytopathology 2019, 109, 96–110. [Google Scholar] [CrossRef] [PubMed] [Green Version]
  35. Vaughan, M.; Backhouse, D.; Del Ponte, E.M. Climate Change Impacts on the Ecology of Fusarium graminearum Species Complex and Susceptibility of Wheat to Fusarium Head Blight: A Review. World Mycotoxin J. 2016, 9, 685–700. [Google Scholar] [CrossRef] [Green Version]
  36. Burlakoti, R.R.; Ali, S.; Secor, G.A.; Neate, S.M.; McMullen, M.P.; Adhikari, T.B. Genetic Relationships among Populations of Gibberella zeae from Barley, Wheat, Potato, and Sugar Beet in the Upper Midwest of the United States. Phytopathology 2008, 98, 969–976. [Google Scholar] [CrossRef] [PubMed] [Green Version]
  37. Burlakoti, R.R.; Neate, S.M.; Adhikari, T.B.; Gyawali, S.; Salas, B.; Steffenson, B.J.; Schwarz, P.B. Trichothecene Profiling and Population Genetic Analysis of Gibberella zeae from Barley in North Dakota and Minnesota. Phytopathology 2011, 101, 687–695. [Google Scholar] [CrossRef] [Green Version]
  38. Karugia, G.W.; Suga, H.; Gale, L.R.; Nakajima, T.; Tomimura, K.; Hyakumachi, M. Population Structure of the Fusarium graminearum Species Complex from a Single Japanese Wheat Field Sampled in Two Consecutive Years. Plant Dis. 2009, 93, 170–174. [Google Scholar] [CrossRef] [PubMed] [Green Version]
  39. Puri, K.D.; Saucedo, E.S.; Zhong, S. Molecular Characterization of Fusarium Head Blight Pathogens Sampled from a Naturally Infected Disease Nursery Used for Wheat Breeding Programs in China. Plant Dis. 2012, 96, 1280–1285. [Google Scholar] [CrossRef] [Green Version]
  40. Boutigny, A.–L.; Ward, T.J.; Ballois, N.; Iancu, G.; Ioos, R. Diversity of the Fusarium graminearum Species Complex on French Cereals. Eur. J. Plant Pathol. 2014, 138, 133–148. [Google Scholar] [CrossRef]
  41. Aamot, H.U.; Ward, T.J.; Brodal, G.; Vrålstad, T.; Larsen, G.B.; Klemsdal, S.S.; Elameen, A.; Uhlig, S.; Hofgaard, I.S. Genetic and phenotypic diversity within the Fusarium graminearum species complex in Norway. Eur. J. Plant Pathol. 2015, 142, 501–519. [Google Scholar] [CrossRef] [Green Version]
  42. Qiu, J.; Xu, J.; Shi, J. Molecular characterization of the Fusarium graminearum species complex in Eastern China. Eur. J. Plant Pathol. 2014, 139, 811–823. [Google Scholar] [CrossRef]
  43. Qiu, J.-B.; Sun, J.-T.; Yu, M.-Z.; Xu, J.-H.; Shi, J.-R. Temporal Dynamics, Population Characterization and Mycotoxins Accumulation of Fusarium graminearum in Eastern China. Sci. Rep. 2016, 6, 36350. [Google Scholar] [CrossRef]
  44. Maxwell, C.S.; Sepulveda, V.E.; Turissini, D.A.; Goldman, W.E.; Matute, D.R. Recent admixture between species of the fungal pathogen Histoplasma. Evol. Lett. 2018, 2, 210–220. [Google Scholar] [CrossRef]
  45. Tamburic-Ilincic, L.; Wragg, A.; Schaafsma, A. Mycotoxin accumulation and Fusarium graminearum chemotype diversity in winter wheat grown in southwestern Ontario. Can. J. Plant Sci. 2015, 95, 931–938. [Google Scholar] [CrossRef]
  46. Gale, L.R.; Ward, T.J.; Balmas, V.; Kistler, H.C. Population subdivision of Fusarium graminearum sensu stricto in the upper midwestern United States. Phytopathology 2007, 97, 1434–1439. [Google Scholar] [CrossRef] [Green Version]
  47. Gale, L.R.; Harrison, S.A.; Ward, T.J.; O’Donnell, K.; Milus, E.A.; Gale, S.W.; Kistler, H.C. Nivalenol-type populations of Fusarium graminearum and F. asiaticum are prevalent on wheat in southern Louisiana. Phytopathology 2011, 101, 124–134. [Google Scholar] [CrossRef] [PubMed] [Green Version]
  48. Bec, S.; Ward, T.; Farman, M.; O’Donnell, K.; Hershman, D.; Van Sanford, D.; Vaillancourt, L.J. Characterization of Fusarium Strains Recovered From Wheat With Symptoms of Head Blight in Kentucky. Plant Dis. 2015, 99, 1622–1632. [Google Scholar] [CrossRef] [Green Version]
  49. Mishra, P.K.; Tewari, J.P.; Clear, R.M.; Turkington, T.K. Molecular genetic variation and geographical structuring in Fusarium graminearum. Ann. Appl. Biol. 2004, 145, 299–307. [Google Scholar] [CrossRef]
  50. Keller, M.D.; Bergstrom, G.C.; Shields, E.J. The aerobiology of Fusarium graminearum. Aerobiologia 2013, 30, 123–136. [Google Scholar] [CrossRef]
  51. Mishra, P.K.; Tewari, J.P.; Turkington, T.K.; Clear, R.M. Genetic evidences for a recent expansion of 15-acetyldeoxynivalenol chemotypes of Fusarium graminearum in Canada. Can. J. Plant Pathol. 2009, 31, 468–474. [Google Scholar] [CrossRef]
  52. Yörük, E.; Yli-Mattila, T. Class B-trichothecene profiles of fusarium species as causal agents of head blight. In Advancing Frontiers in Mycology and Mycotechnology: Basic and Applied Aspects of Fungi; Satyanarayana, T., Deshmukh, S.K., Deshpande, M.V., Eds.; Springer: Singapore, 2019; pp. 347–376. [Google Scholar]
  53. Nelson, P.E.; Toussoun, T.A.; Marasas, W.F.O. Fusarium Species: An Illustrated Manual for Identification; Pennsylvania State University Press: University Park, PA, USA, 1983. [Google Scholar]
  54. Leslie, J.F.; Summerell, B.A. The Fusarium Laboratory Manual; Blackwell Publishing: Ames, IA, USA, 2006. [Google Scholar]
  55. Nicholson, P.; Simpson, D.R.; Weston, G.; Rezanoor, H.N.; Lees, A.K.; Parry, D.W.; Joyce, D. Detection and quantification of Fusarium culmorum and Fusarium graminearum in cereals using PCR assays. Physiol. Mol. Plant Pathol. 1998, 53, 17–37. [Google Scholar] [CrossRef]
  56. Pritchard, J.K.; Stephens, M.; Donnelly, P. Inference of population structure using multilocus genotype data. Genetics 2000, 155, 945–959. [Google Scholar] [PubMed]
  57. Earl, D.A.; Vonholdt, B.M. STRUCTURE HARVESTER: A website and program for visualizing STRUCTURE output and implementing the Evanno method. Conserv. Genet. Resour. 2011, 4, 359–361. [Google Scholar] [CrossRef]
Figure 1. Map of Canada and the State of Pennsylvania, USA showing the geographic regions sampled in 2018 and 2019. SK—Saskatchewan (SK1—Parkland region, Saskatchewan, SK2—southern Saskatchewan) MB—Manitoba (MB1—southwest Manitoba, MB2—central Manitoba, MB3—Interlake region, Manitoba) ON—Ontario, PA—Pennsylvania, USA.
Toxins 13 00180 g001
Figure 2. Distribution of 3-acetyl-deoxynivalenol (3ADON) and 15-acetyl-deoxynivalenol (15ADON) chemotypes among 570 Fusarium graminearum isolates from wheat.
Toxins 13 00180 g002
Figure 3. ΔK calculated by the Evanno method [33] showing the K value that had the highest rate of change in log likelihood, here K = 2. The test was performed with VNTR data of all 562 clone corrected Fusarium graminearum isolates with the number of simulated populations (K) ranging from 1 to 5, with 10 replications for each K value.
Toxins 13 00180 g003
Figure 4. Population structure and admixture estimates of 562 clone corrected Fusarium graminearum isolates based on geographic locations (a) All 562 isolates (b) Isolates with membership proportion greater than 0.8 for both CL1 and CL2. Vertical bars represent individual isolates colored to represent the estimated proportion of K membership of each isolate, which ranged from 0 to 1. Each bar represents one isolate.
Toxins 13 00180 g004
Figure 5. Population structure and admixture estimates of 562 clone corrected Fusarium graminearum isolates based on chemotypes; 3ADON and 15ADON (a) All 562 isolates (b) Isolates with membership proportion greater than 0.8 for both CL1 and CL2. Vertical bars represent individual isolates colored to represent the estimated proportion of K membership of each isolate, which ranged from 0 to 1. Each bar represents one isolate.
Toxins 13 00180 g005
Table 1. Amplicon size range, number of alleles and allele frequencies of 10 VNTR markers of 570 Fusarium graminearum isolates analyzed in the study.
VNTR Locus aChromosomeAmplicon Size RangeTotal No. of AllellesAllelic Frequency
HK10431210–360230.001–0.157
HK9131190–270140.001–0.162
HK9171200–290140.001–0.302
HK9571160–366310.001–0.124
HK9652200–355190.001–0.169
HK9672180–266140.001–0.287
HK10593190–290150.001–0.169
HK9773180–300170.002–0.266
HK6306190–300180.001–0.220
HK10736120–290250.001–0.130
a Locus name according to [30].
Table 2. Summary of genetic diversity statistics of Fusarium graminearum isolates from the Canada and northeastern USA.
% ofNTotal
PopulationPL20182019IsolatesMLH NaNeIHuH
SK11005805858Mean9.0005.9251.8340.7890.803
SE1.1160.8410.1400.0370.038
SK21006838106103Mean13.8007.6772.1930.8470.856
SE1.3561.2030.1220.0170.017
MB110062109171168Mean17.2009.1762.3870.8790.885
SE1.5691.0750.1010.0110.011
MB210058308888Mean15.4009.6792.3900.8830.893
SE1.6811.2800.1140.0120.012
MB31002602626Mean8.8006.2341.9210.8190.852
SE0.7720.6690.1090.0220.023
ON10061299089Mean11.6006.6992.0890.8420.852
SE0.8590.4680.0750.0140.014
PA1000313130Mean8.6005.6921.8410.8000.827
SE0.7180.6400.1160.0250.026
Total 333237570562Mean12.0577.2972.0940.8370.852
SE1.1530.8820.1110.0200.020
PL, Polymorphic loci N, No. of isolates within population, MLH, Number of multilocus haplotypes, Na, No. of observed alleles within the population, Ne, No. of effective alleles, I, Shannon’s information index, H, Gene diversity, uH, Unbiased gene diversity; SE, Standard error of mean; SK1—Parkland region, Saskatchewan, SK2—southern Saskatchewan; MB1—southwest Manitoba, MB2—central Manitoba, MB3—Interlake region, Manitoba; ON—Ontario, PA—Pennsylvania, USA.
Table 3. Nei’s Genetic identity (above diagonal) and Genetic distance (below diagonal) of Fusarium graminearum isolates between the regions studied.
PopulationSK1SK2MB1MB2MB3ONPA
SK1****0.8170.7720.7660.6700.5470.430
SK20.202****0.8890.8590.7520.6800.534
MB10.2590.118****0.8770.7520.7180.609
MB20.2670.1520.131****0.7740.7160.581
MB30.4010.2860.2850.256****0.4700.416
ON0.6040.3850.3310.3340.755****0.702
PA0.8440.6270.4960.5420.8770.354****
SK1—Parkland region, Saskatchewan, SK2—southern Saskatchewan; MB1—southwest Manitoba, MB2—central Manitoba, MB3—Interlake region, Manitoba; ON–Ontario, PA—Pennsylvania, USA, ****—not applicable.
Table 4. Pairwise FST values a (below diagonal) and pairwise gene flow b Nm (above diagonal) among Fusarium graminearum from the regions.
PopulationSK1SK2MB1MB2MB3ONPA
SK1****10.2799.0278.5834.9714.6993.038
SK20.024****21.68616.8527.2147.8894.227
MB10.0270.011****21.7507.5909.7565.232
MB20.0280.0150.011****7.9279.4644.828
MB30.0480.0330.0320.031****3.8292.803
ON0.0510.0310.0250.0260.061****6.150
PA0.0760.0560.0460.0490.0820.039****
aFST value was calculated by 1000 randomizations by permutation of individuals among populations. b Gene flow (Nm) was calculated as Nm = 0.5[(1/ΦPT) − 1] with GenAlEx v. 6 [31,32], where ΦPT was calculated as the proportion of the variance among populations with respect to the total variance. SK1—Parkland region, Saskatchewan, SK2—southern Saskatchewan MB1—southwest Manitoba, MB2—central Manitoba, MB3—Interlake region, Manitoba; ON—Ontario, PA—Pennsylvania, USA, USA, ****—not applicable.
Table 5. Analysis of molecular variance of 562 clone corrected Fusarium graminearum isolates from five geographic regions in Saskatchewan and Manitoba, Canada.
Source of VariationdfSSMSEst. Var.%
Among populations6105.23317.5390.1744%
Within populations5552394.7854.3154.31596%
Total5612500.018 4.489100%
Table 6. Assignment of 562 clone-corrected Fusarium graminearum isolates to the genetic clusters, CL1 and CL2 defined by STRUCTURE (K = 2) using 10 VNTR markers. The proportion of membership (q), of each cluster was used to assigned isolates in each geographic region to the clusters. Clusters with the most isolates are in bold.
LocationCL1 (Red)CL2 (Green)Total
Parkland region, Saskatchewan (SK1)52 (89.7%)6 (10.3%)58
Southern Saskatchewan (SK2)73 (70.9%)30 (29.1%)103
Southwest Manitoba (MB1)106 (63.1%)62 (36.9%)168
Central Manitoba (MB2)57 (64.8%)31 (35.2%)88
Interlake region, Manitoba (MB3)21 (80.8%)5 (19.2%)26
Ontario (ON)0 (0.0%)89 (100%)89
Pennsylvania, USA (PA)0 (0.0%)30 (100%)30
Total no. of isolates309 (55%)253 (45%)562
Clusters with the highest percentage in each region are indicated in bold.
Table 7. Trichothecene chemotype profile and genetic diversity parameters for the genetic clusters, CL1 and CL2 populations of 562 clone-corrected Fusarium graminearum analyzed by STRUCTURE (K = 2). Clusters with the highest number of isolates for each chemotype is in bold.
KaIsolatesNebIcHd3ADON15ADON
CL13097.8112.2210.859239 (77.4%)70 (22.6%)
CL22539.0102.3560.88093 (36.8%)160 (63.2%)
aK, population or cluster; bNe, number of effective alleles; cI, Shannon’s information index; dH, unbiased gene diversity. Clusters with the highest percentage in each region are indicated in bold.
Publisher’s Note: MDPI stays neutral with regard to jurisdictional claims in published maps and institutional affiliations.

