Simplified Synthesis and Stability Assessment of Aflatoxin B1-Lysine and Aflatoxin G1-Lysine


1
London Research and Development Centre, Agriculture and Agri-Food Canada, London, ON N5V 4T3, Canada
2
Department of Chemistry, University of Western Ontario, London, ON N6A 3K7, Canada
*
Authors to whom correspondence should be addressed.
Toxins 2022, 14(1), 56; https://0-doi-org.brum.beds.ac.uk/10.3390/toxins14010056
Submission received: 18 December 2021
/
Revised: 7 January 2022
/
Accepted: 11 January 2022
/
Published: 14 January 2022
(This article belongs to the Special Issue Mycotoxin Biomarkers: Innovation and Utility)
Abstract
:Aflatoxins B1 (AFB1) and G1 (AFG1) are carcinogenic mycotoxins that contaminate crops such as maize and groundnuts worldwide. The broadly accepted method to assess chronic human aflatoxin exposure is by quantifying the amount of aflatoxin adducted to human serum albumin. This has been reported using ELISA, HPLC, or LC-MS/MS to measure the amount of AFB1-lysine released after proteolysis of serum albumin. LC-MS/MS is the most accurate method but requires both isotopically labelled and unlabelled AFB1-lysine standards, which are not commercially available. In this work, we report a simplified synthetic route to produce unlabelled, deuterated and 13C6 15N2 labelled aflatoxin B1-lysine and for the first-time aflatoxin G1-lysine. Additionally, we report on the stability of these compounds during storage. This simplified synthetic approach will make the production of these important standards more feasible for laboratories performing aflatoxin exposure studies.
Key Contribution: A straight forward synthetic pathway for AFB1-Lys is presented. A new AFG1-Lys isotopically labelled standard is also presented.

1. Introduction
Aflatoxins are the most important mycotoxins from a human health perspective, especially in developing countries. It is estimated that over 500 million people in parts of Asia, Latin-American, and sub-Saharan Africa are being exposed to aflatoxin B1 (AFB1) mainly through the consumption of maize and groundnuts infected with Aspergillus flavus and/or A. parasiticus [1,2,3].
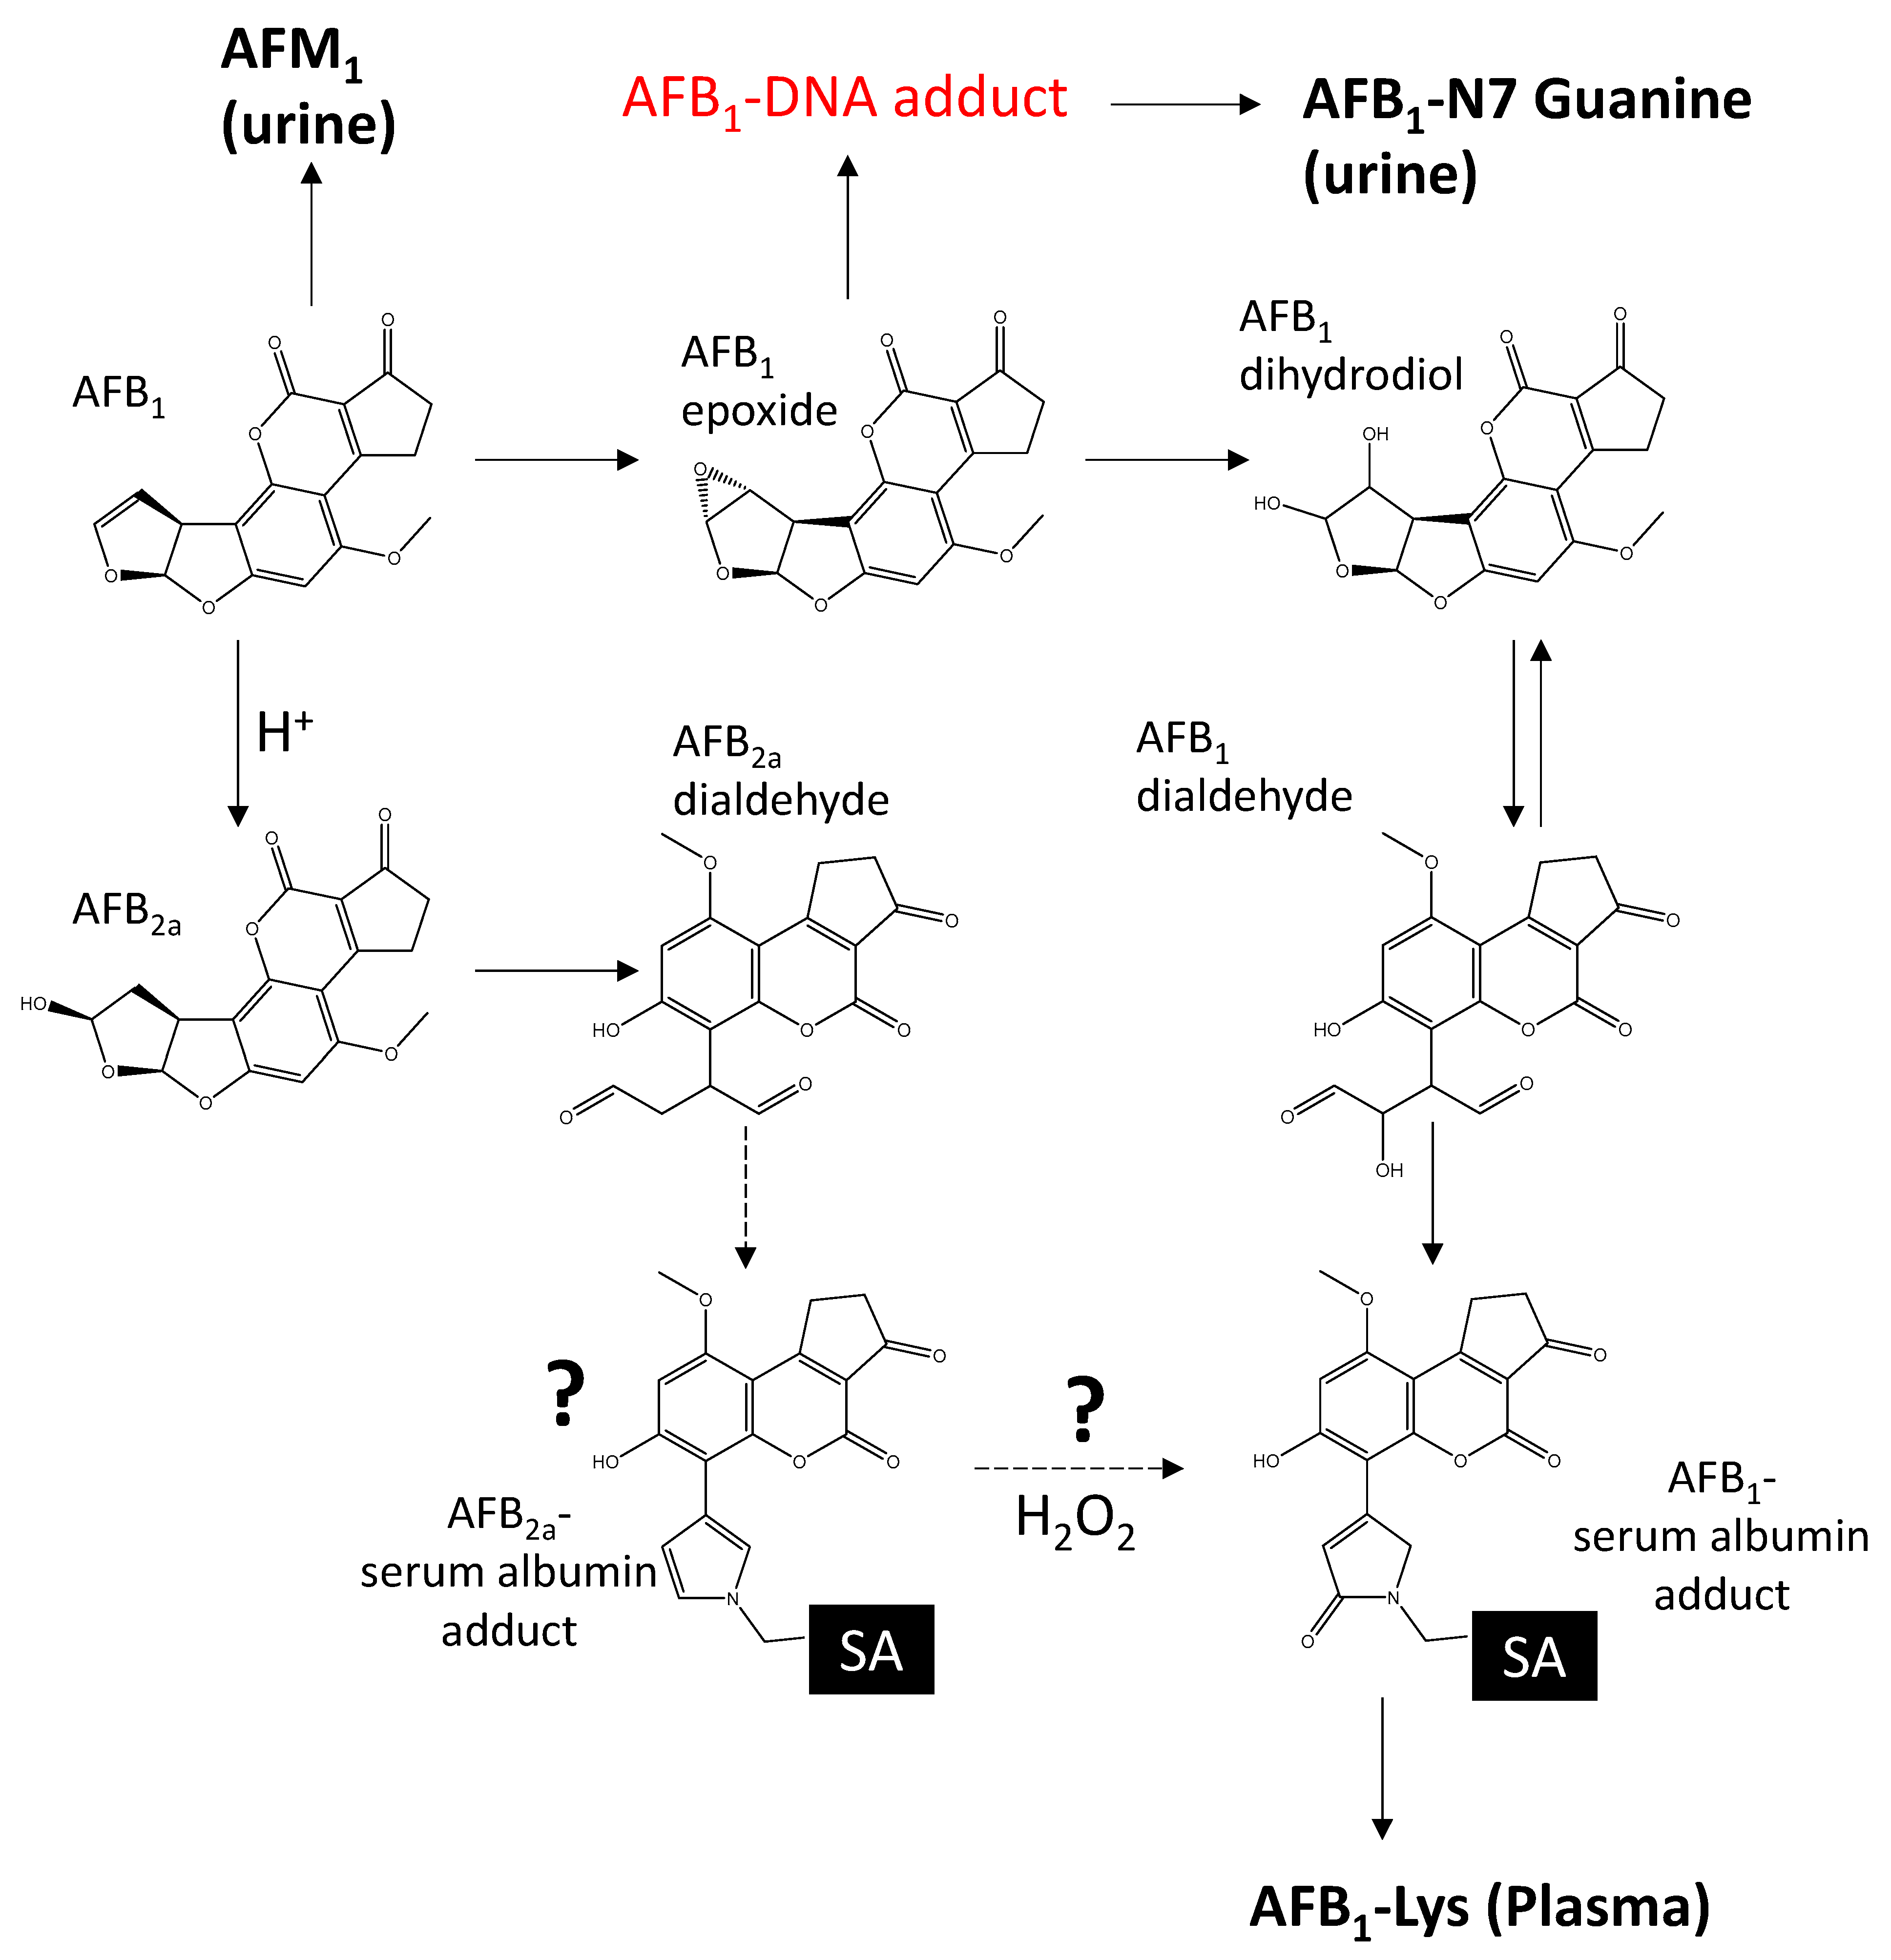
AFB1 is highly mutagenic, arising from epoxidation of the 8,9 vinyl double bond by human liver P450 enzymes (CYP3A4, CYP1A2, and CYP3A5 in some individuals) [4]. AFB1-8,9 exo-epoxide is considered to be one of the most carcinogenic compounds known [5]. It efficiently chelates between DNA base pairs to react with guanine residues leading to base pair mutations [6]. Ingested AFB1 can also be transformed enzymatically into hydroxylated metabolites, such as AFM1, which is far less mutagenic, although it is genotoxic [7,8] or to AFB1-N7-guanine, which is excreted in urine. The carcinogen AFB1-8,9 exo epoxide hydrolyzes rapidly under aqueous conditions to AFB1-dihydrodiol which is in equilibrium with AFB1-dialdehyde [9] (Scheme 1). AFB1-dialdehyde is highly reactive towards amines [10] and forms covalent adducts with lysine residues within human serum albumin [11,12,13].
Aflatoxin exposure can be determined by monitoring the urinary metabolites AFM1 and AFB1–N7-guanine; however, this only accounts for exposures for the preceding day or two. Although these urinary metabolites have frequently been utilized as biomarkers for hepatocellular carcinoma risk, these associations are weak [14,15]. The most robust biomarker for aflatoxin exposure is the AFB1-albumin adduct (AFB1-alb) [16]; the half-life of serum albumin (~21 d) [17] makes it an average of chronic exposure during the past month [1]. Although unmetabolized AFB1 can be detected in the urine, it is not believed to be strongly correlated with aflatoxin exposure [15].
Given the importance of aflatoxin on a global health scale, accurate and standardized methods to quantify the AFB1-adduct are critical, yet there are key shortcomings that still need to be addressed. Specifically, the lack of commercially available analytical aflatoxin biomarker standards and well characterized quality control reference material are major obstacles when comparing and interpreting findings across multiple studies.
The AFB1-alb adduct has been measured using ELISA [18,19], HPLC-fluorescence [20,21], and LC-MS/MS [22] by quantifying AFB1-Lys released by enzymatic digestion. ELISA based measurements have historically reported higher concentrations than HPLC-based approaches or LC-MS/MS by a factor of 2.6 [23]. Although the reason for this discrepancy between methods is unknown, cross-reactivity with other aflatoxin-serum adducts may be responsible. Similar to AFB1, aflatoxin G1 produced by A. parasiticus is an order of magnitude less carcinogenic in animals than B1 (Ayers et al. 1971; Butler et al. 1969). Aflatoxin G1 can also be metabolized to a mutagenic epoxide [24] and can result in formation of AFG1-alb adducts, although they have yet to be reported in humans [25].
AFB2a is produced via acid hydrolysis of AFB1 (Scheme 1) [26,27,28], and has been detected as a major urinary metabolite in some human studies [29]. Since it is missing the critical 8,9 vinyl double bond, AFB2a is significantly less carcinogenic than AFB1 [7]. However, similar to the AFB1-epoxide, it can also rearrange to an amine reactive dialdehyde structure [30,31]. As with AFG1, albumin adducts of AFB2a have not yet been detected in human populations, although it has been suggested they exist [32].
Direct analytical methods such as LC-MS/MS and HPLC require an analytical standard, which to date has been exclusively AFB1-Lys, and therefore, there are no data regarding the presence of other albumin adducts arising from AFB2a, AFG1, or even AFG2a. The synthesis of AFB1-Lys (reviewed in [33]), has generally followed a synthetic approach that mimics the in vivo route (Scheme 1). First, AFB1 is epoxidized with either dimethyldioxirane [24,34], or m-chloroperbenzoic acid [35,36] to form the carcinogen AFB1-epoxide. Synthesis of this intermediate is not without risk and requires careful handling. Following epoxidation, AFB1-epoxide is then hydrolyzed to AFB1-dialdehyde and coupled to free lysine [36]. In previous synthetic routes, the Nα group of lysine has been protected by acetylation [10,37] or complexation with copper [34,38]. Once purified, the concentration of the analytical standard is determined by spectrophotometry using a molar attenuation coefficient ε399 25,400/M·cm or ε400 30,866/M·cm at pH 7.0 and 7.4, respectively [11,37]. To our knowledge, these molar attenuation coefficients are the sole basis for determining synthesized standard concentrations in subsequent studies, and it is unknown how any oxidized or degraded AFB1-Lys present could affect these values.
Recently, a study examining potential interactions between AFB2a and a number of free amino acids showed that AFB2a could be coupled with lysine to form AFB2a-Lys [31]. The authors showed that the addition of a strong oxidizing agent could convert AFB2a-Lys to AFB1-Lys. Although this was performed at a low concentration, this finding is significant for synthetic efforts since it would enable the highly carcinogenic AFB1-epoxide intermediate to be bypassed.
In this work, we address one of the main shortcomings facing the determination of human exposure to AFB1. We undertook a systematic approach to optimize a safer and simplified synthetic route for the production of AFB1-Lys. We also expanded the synthesis from AFB1-Lys to a total of four analytes that should be monitored in a single biological sample: AFB1-Lys, AFB2a-lysine, AFG1-Lys, and AFG2a-Lys. In addition, we generated isotopically labelled materials with Lysine-D4 and Lysine 13C6, 15N2 to serve as internal standards. We then performed a stability assay to determine the best storage conditions for these important standards.
2. Results
2.1. Conversion of AFB1 to AFB2a and AFG1 to AFG2a
The efficient conversion of AFB1 to the hemiacetal AFB2a using 0.1 M citric acid at 28 °C in the range 24–48 h was reported by Ciegler et al. [28]. The authors also showed that hydrolysis was likely occurring with AFG1, but they could not isolate a sufficient quantity for confirmation. The hemiacetal AFB2a can react readily with the amino groups of amino acids and proteins [39]. AFB2a undergoes a structural rearrangement at alkaline pH (pKa 7.1) to form a phenolate ion with two aldehyde groups. These aldehyde groups are necessary for AFB2a to couple with free amino groups [30].
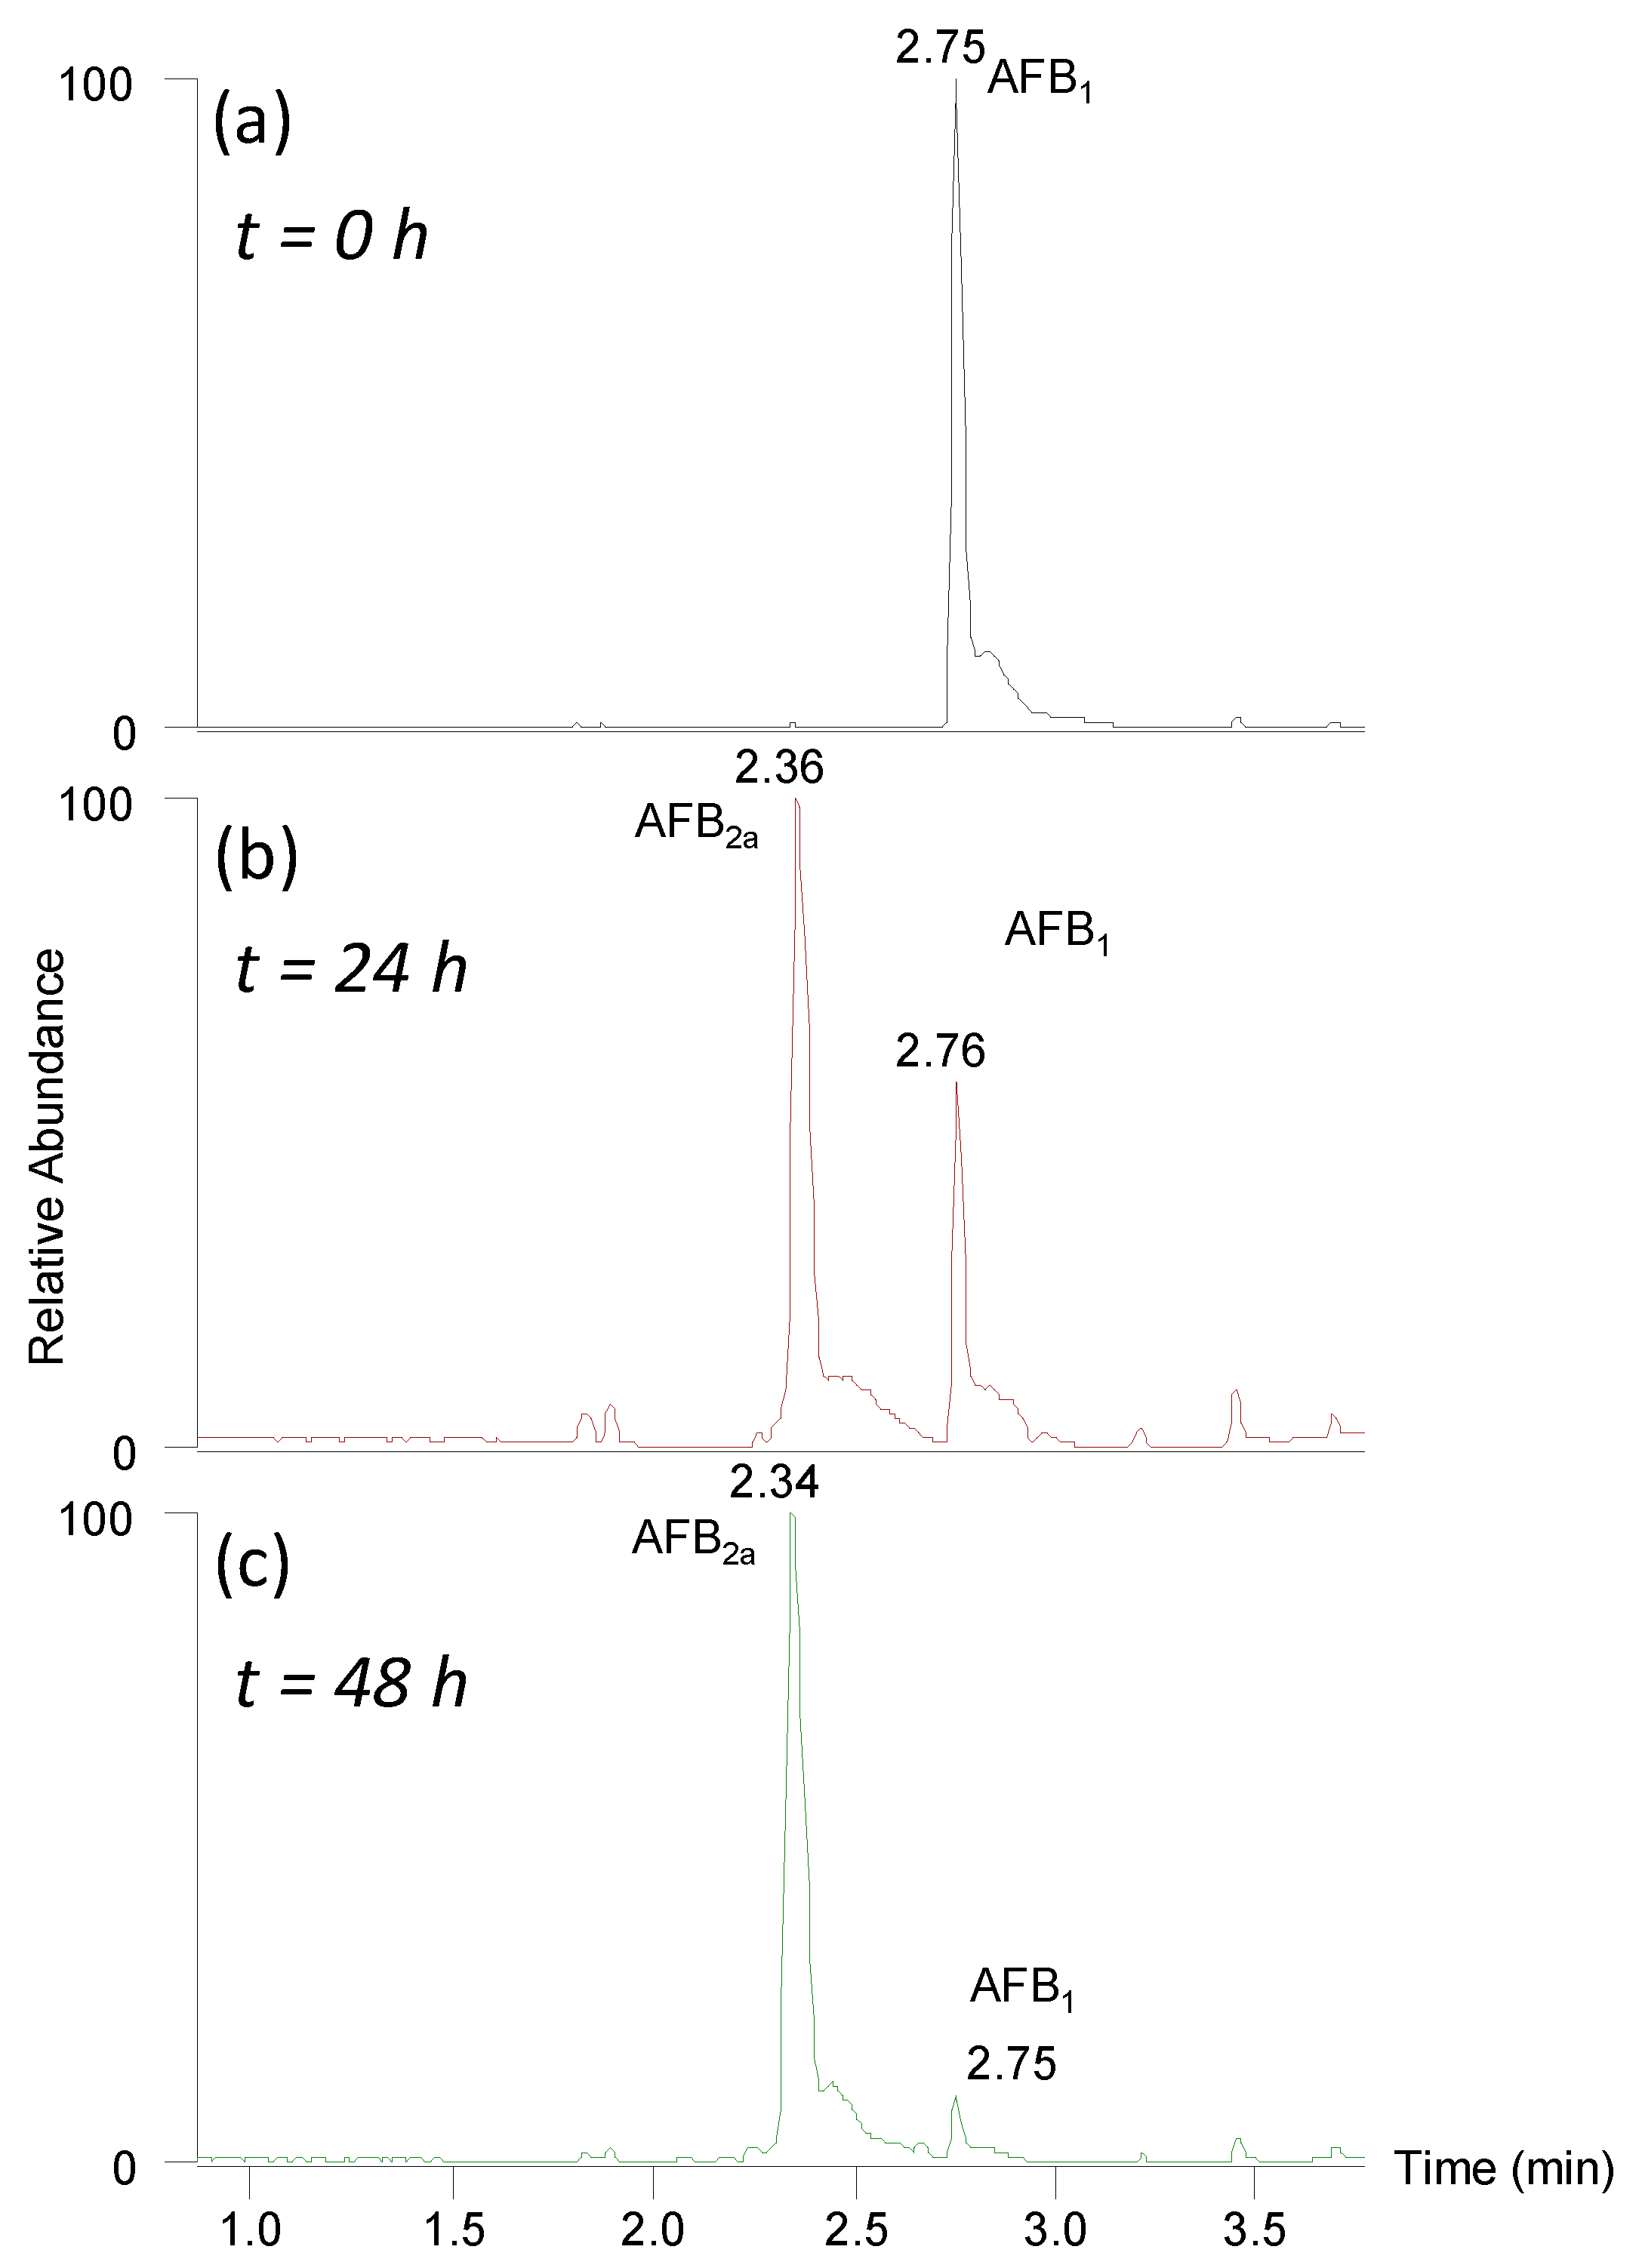
We employed HCl as the acid source because its low vapor pressure allowed for effective removal by evaporation during the synthesis of AFB2a. Over 48 h at 45 °C, AFB1 was readily converted to AFB2a under mild acidic conditions; the conversion of both AFB1 and AFG1 to AFB2a and AFG2a, were >95% (Figure 1)
2.2. Coupling of AFB2a or AFG2a to Lysine
The equivalence point of the hemiacetal AFB2a and AFB2a-dialdehdye (Scheme 1) was measured and shown to occur at pH 7.1 [30]. As the dialdehyde form is necessary for the coupling of AFB2a to amines, reaction conditions within the pH range 7–11 were investigated.
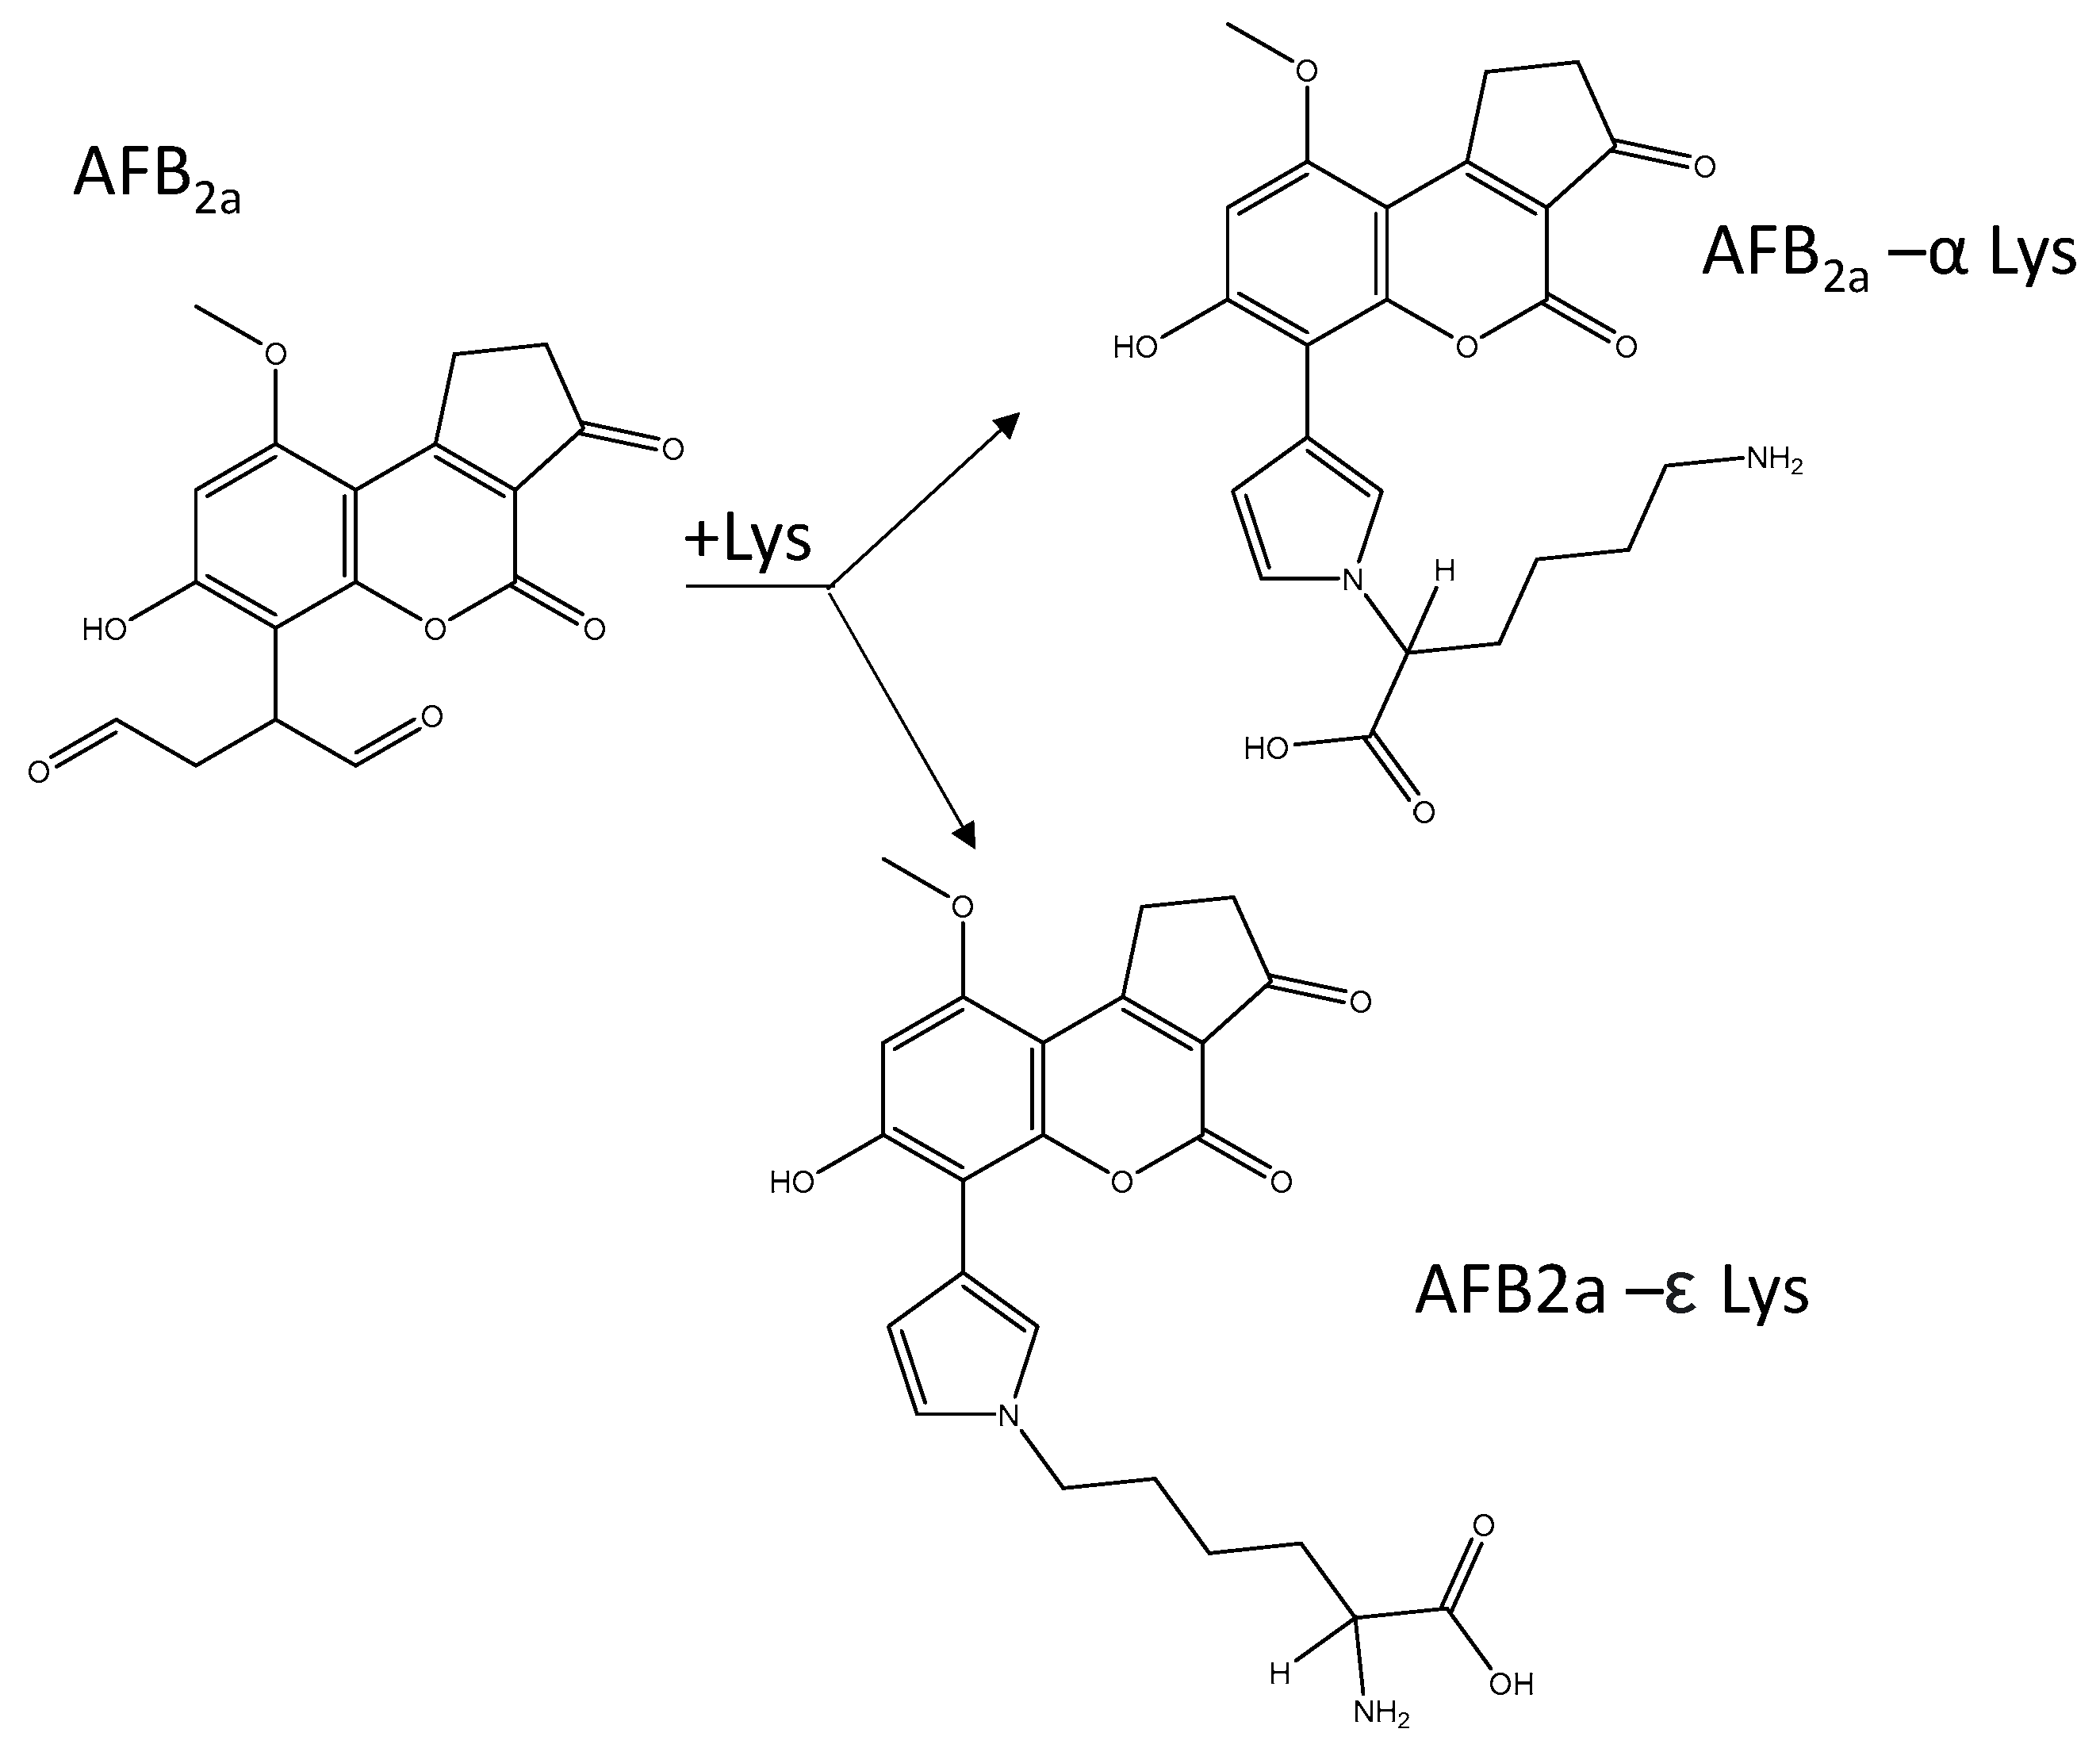
Following the addition of lysine to AFB2a at a 2:1 molar ratio, the aqueous solutions developed into an intense yellow colour. Rushing et al. (2017) identified this coupling to be first order with respect to both reactants and that the reaction rate increased with increasing pH [31]. Lysine contains two primary amines that are able to couple with AFB2a dialdehyde. In order to mimic the reactivity of AFB1 dialdehyde within serum albumin lysine residues, it is necessary to direct the reaction towards the ε-amino group (Scheme 2). This was previously accomplished with AFB1-dialdehyde by protecting the α-amino group by the use of Nα-acetyl-lysine [10,37] or complexation of lysine with copper [34,38]. Reaction with Nαacetyl-lysine necessitates an additional treatment with acylase I. More recently, Sass and et al. showed that when AFB1-dialdehyde was reacted with free lysine, the major product was the desired ε-group [36]. Here we closely monitored the effects of pH on the formation of either the α or ε-coupled AFB2a-Lys.
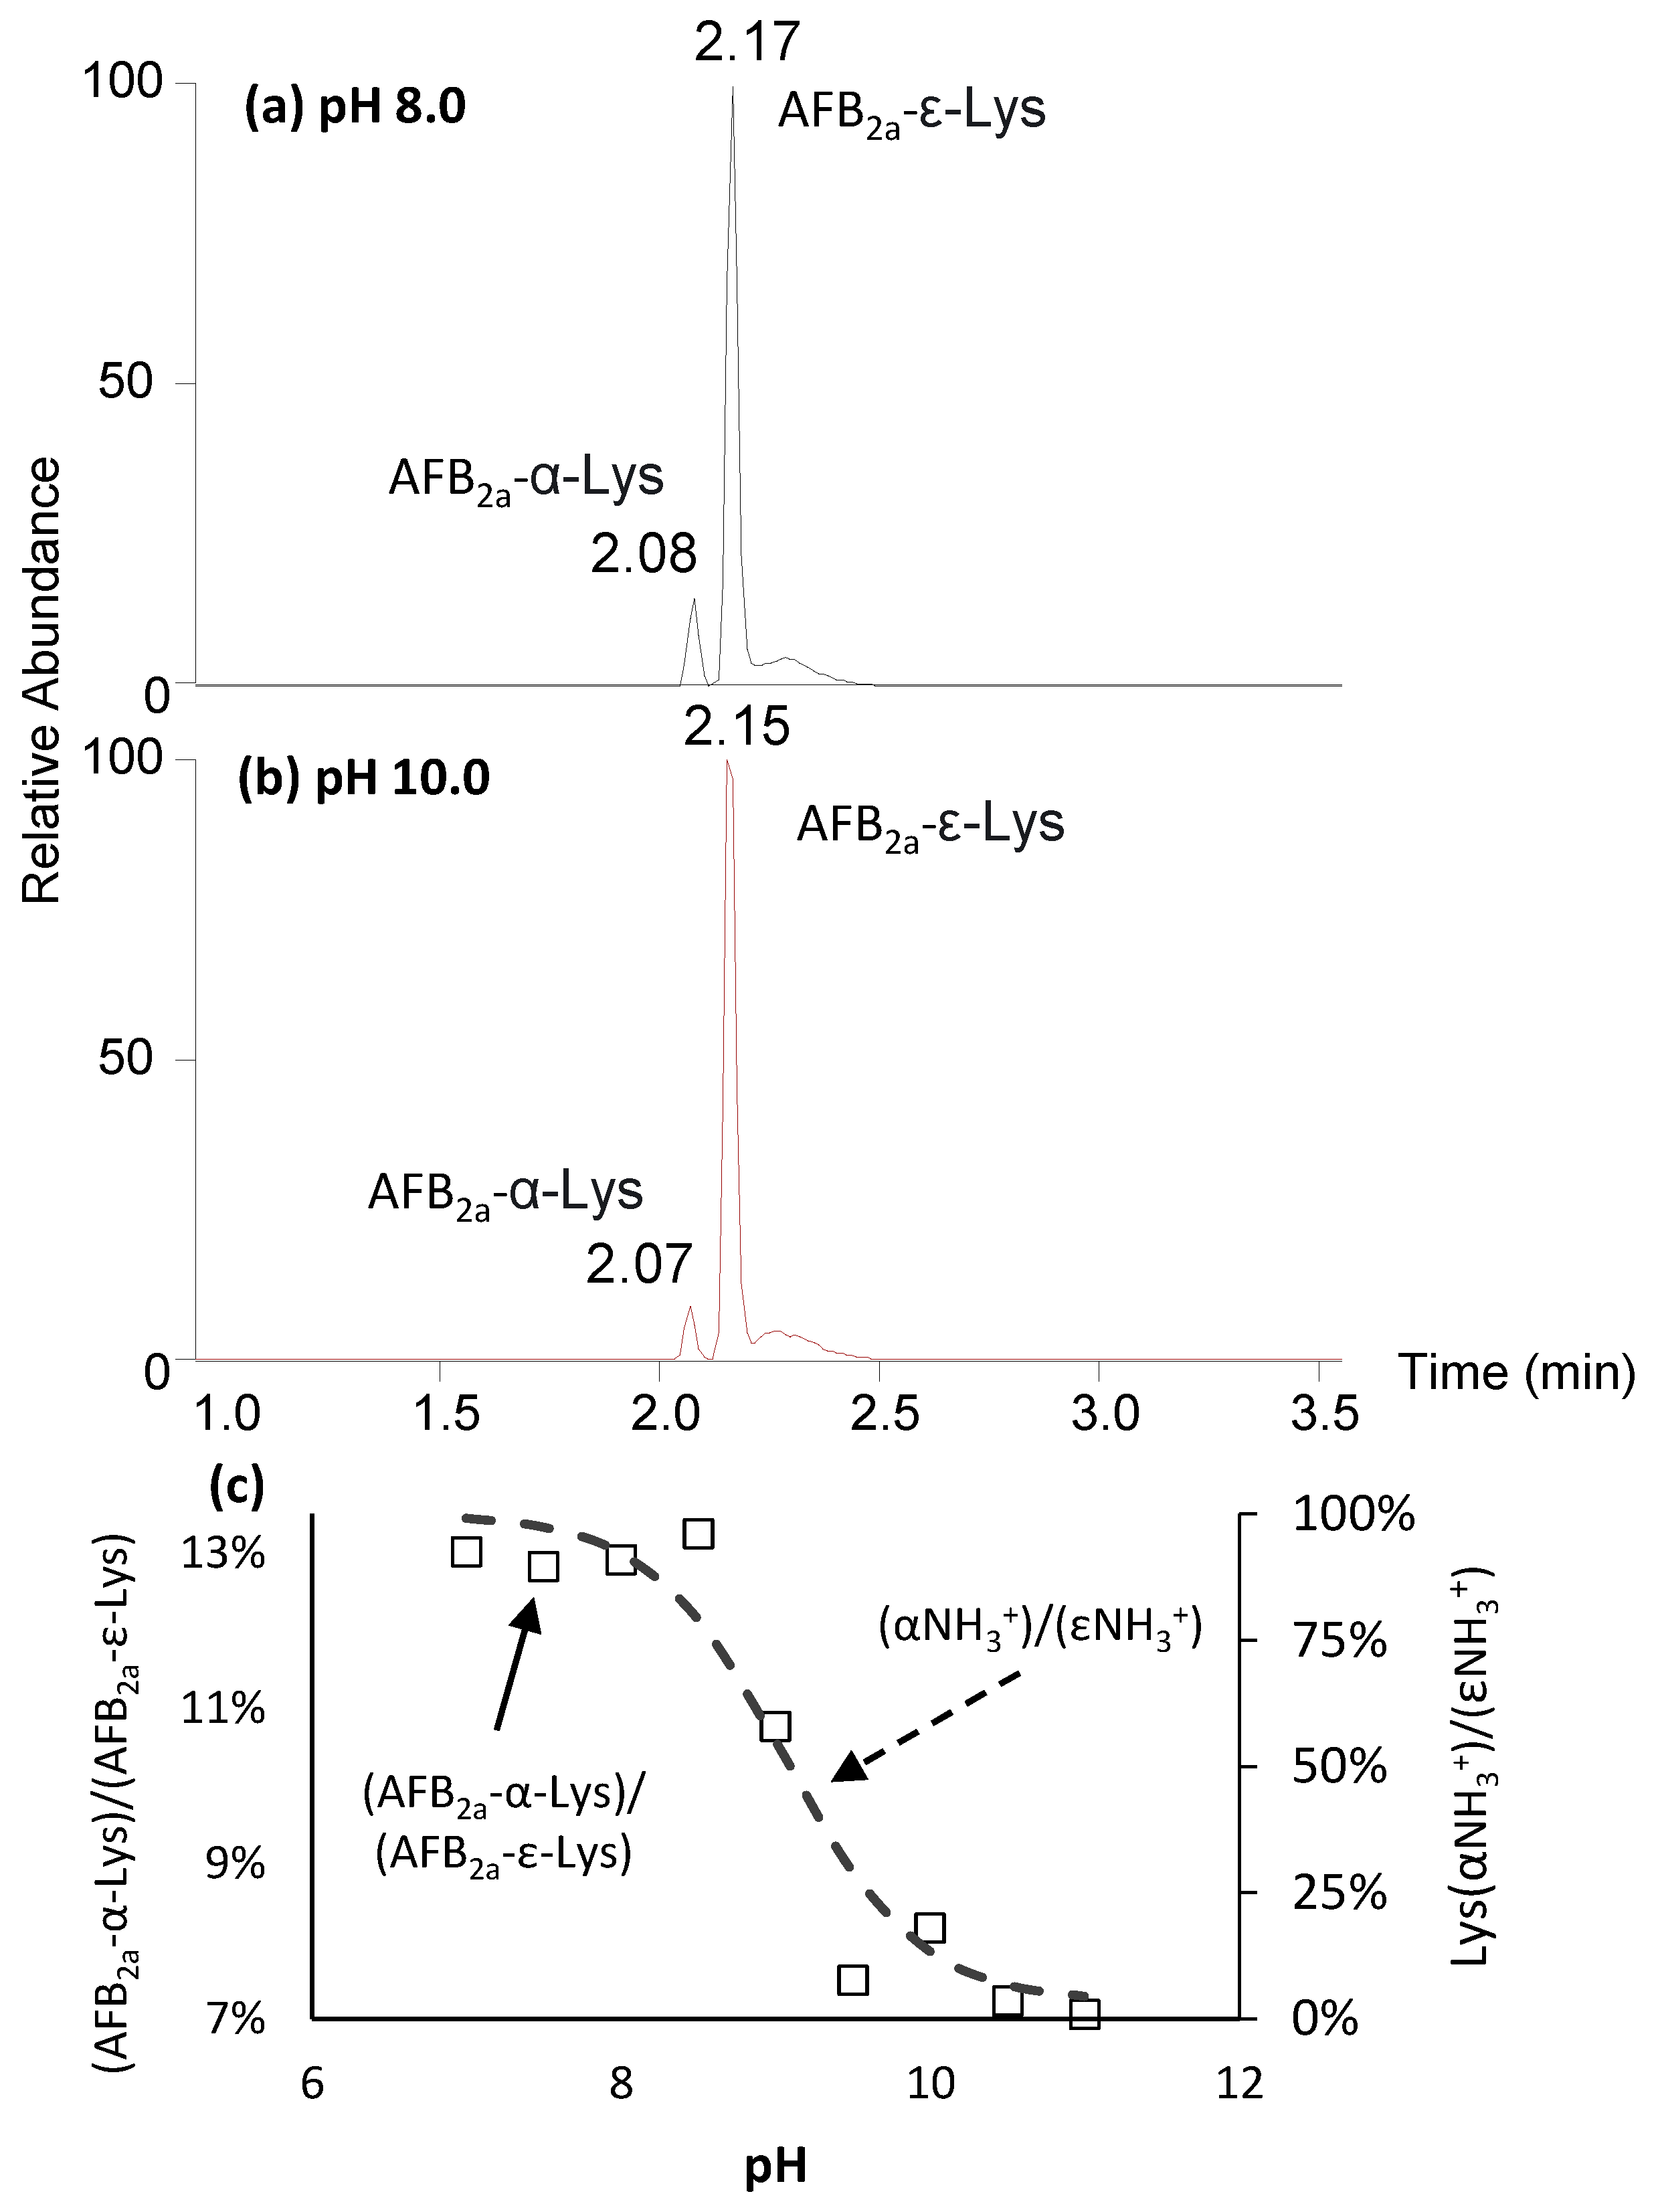
At pH 8.0, we observed the appearance of two isobaric peaks corresponding to the predicted formula of AFB2a-Lys, C23H24N2O7 (Figure 2). The minor and earlier eluting peak corresponded to the AFB2a-dialdehyde coupled to the α-amino group, whereas the major peak is the desired ε-linked product. The order of elution was determined by Rushing et al. (2017) who showed the later eluting peak was exclusively formed with acetyl-lysine reactant, whereas two peaks are observed with free lysine [31].
Figure 2c shows the ratio of the α/ε coupled AFB2a-lysines as a function of pH. At pH 7–8.5, the ratio is fairly constant at 13 ± 0.2%. This ratio decreases to 7 ± 0.5% at pH ≥ 9.5. Although not dramatic, this trend closely follows the ratio of protonation for α-NH3+/ε-NH3+ (Figure 2c). At pH ≤ 9.5, both amino groups of lysine are nearly fully protonated, yet the ε-NH3+ is still highly favoured meaning that steric factors may greatly influence this preference of reactivity (Scheme 2).
Using a pH of 10.0 in subsequent experiments, a series of molar ratios between AFB2a and lysine were investigated. In the absence of lysine, the λmax of AFB2a is 399 nm. Molar ratios of 1:1, 1:2, 1:4, and 1:10 AFB2a:lysine were mixed and the UV–VIS signature taken after 5 min. A clear progression of λmax was observed, with the 1:10 mixture having a λmax of 406 nm (Figure 3a). Following incubation at room temperature for 30 min, all the AFB2a:lysine ratios shifted to λmax values between 406 and 408 nm (Figure 3b). When these solutions were tested by LC-MS, unreacted AFB2a was not detected in any of the samples, while the intensity of the AFB2a-Lys product was slightly lower in the 1:1 mixture compared to mixtures with excess lysine (Supplementary Materials, Figure S1). Therefore, for proceeding reactions, a 1:2 ratio of AFB2a:lysine was used.
2.3. Oxidation of AFB2a-Lys to AFB1-Lys
Rushing et al. (2017) used Oxone® to demonstrate that AFB2a-Lys could be converted to AFB1-Lys via the addition of single oxygen atom [31]. It has been suggested that if AFB2a-alb adducts are present in vivo, its oxidation via natural biochemical processes may result in the formation of AFB1-alb [32], bypassing the formation of AFB1-epoxide (Scheme 1). Therefore, in addition to optimizing this final oxidation step using Oxone®, we also investigated H2O2 due to its presence in cells as a short-lived metabolic by-product.
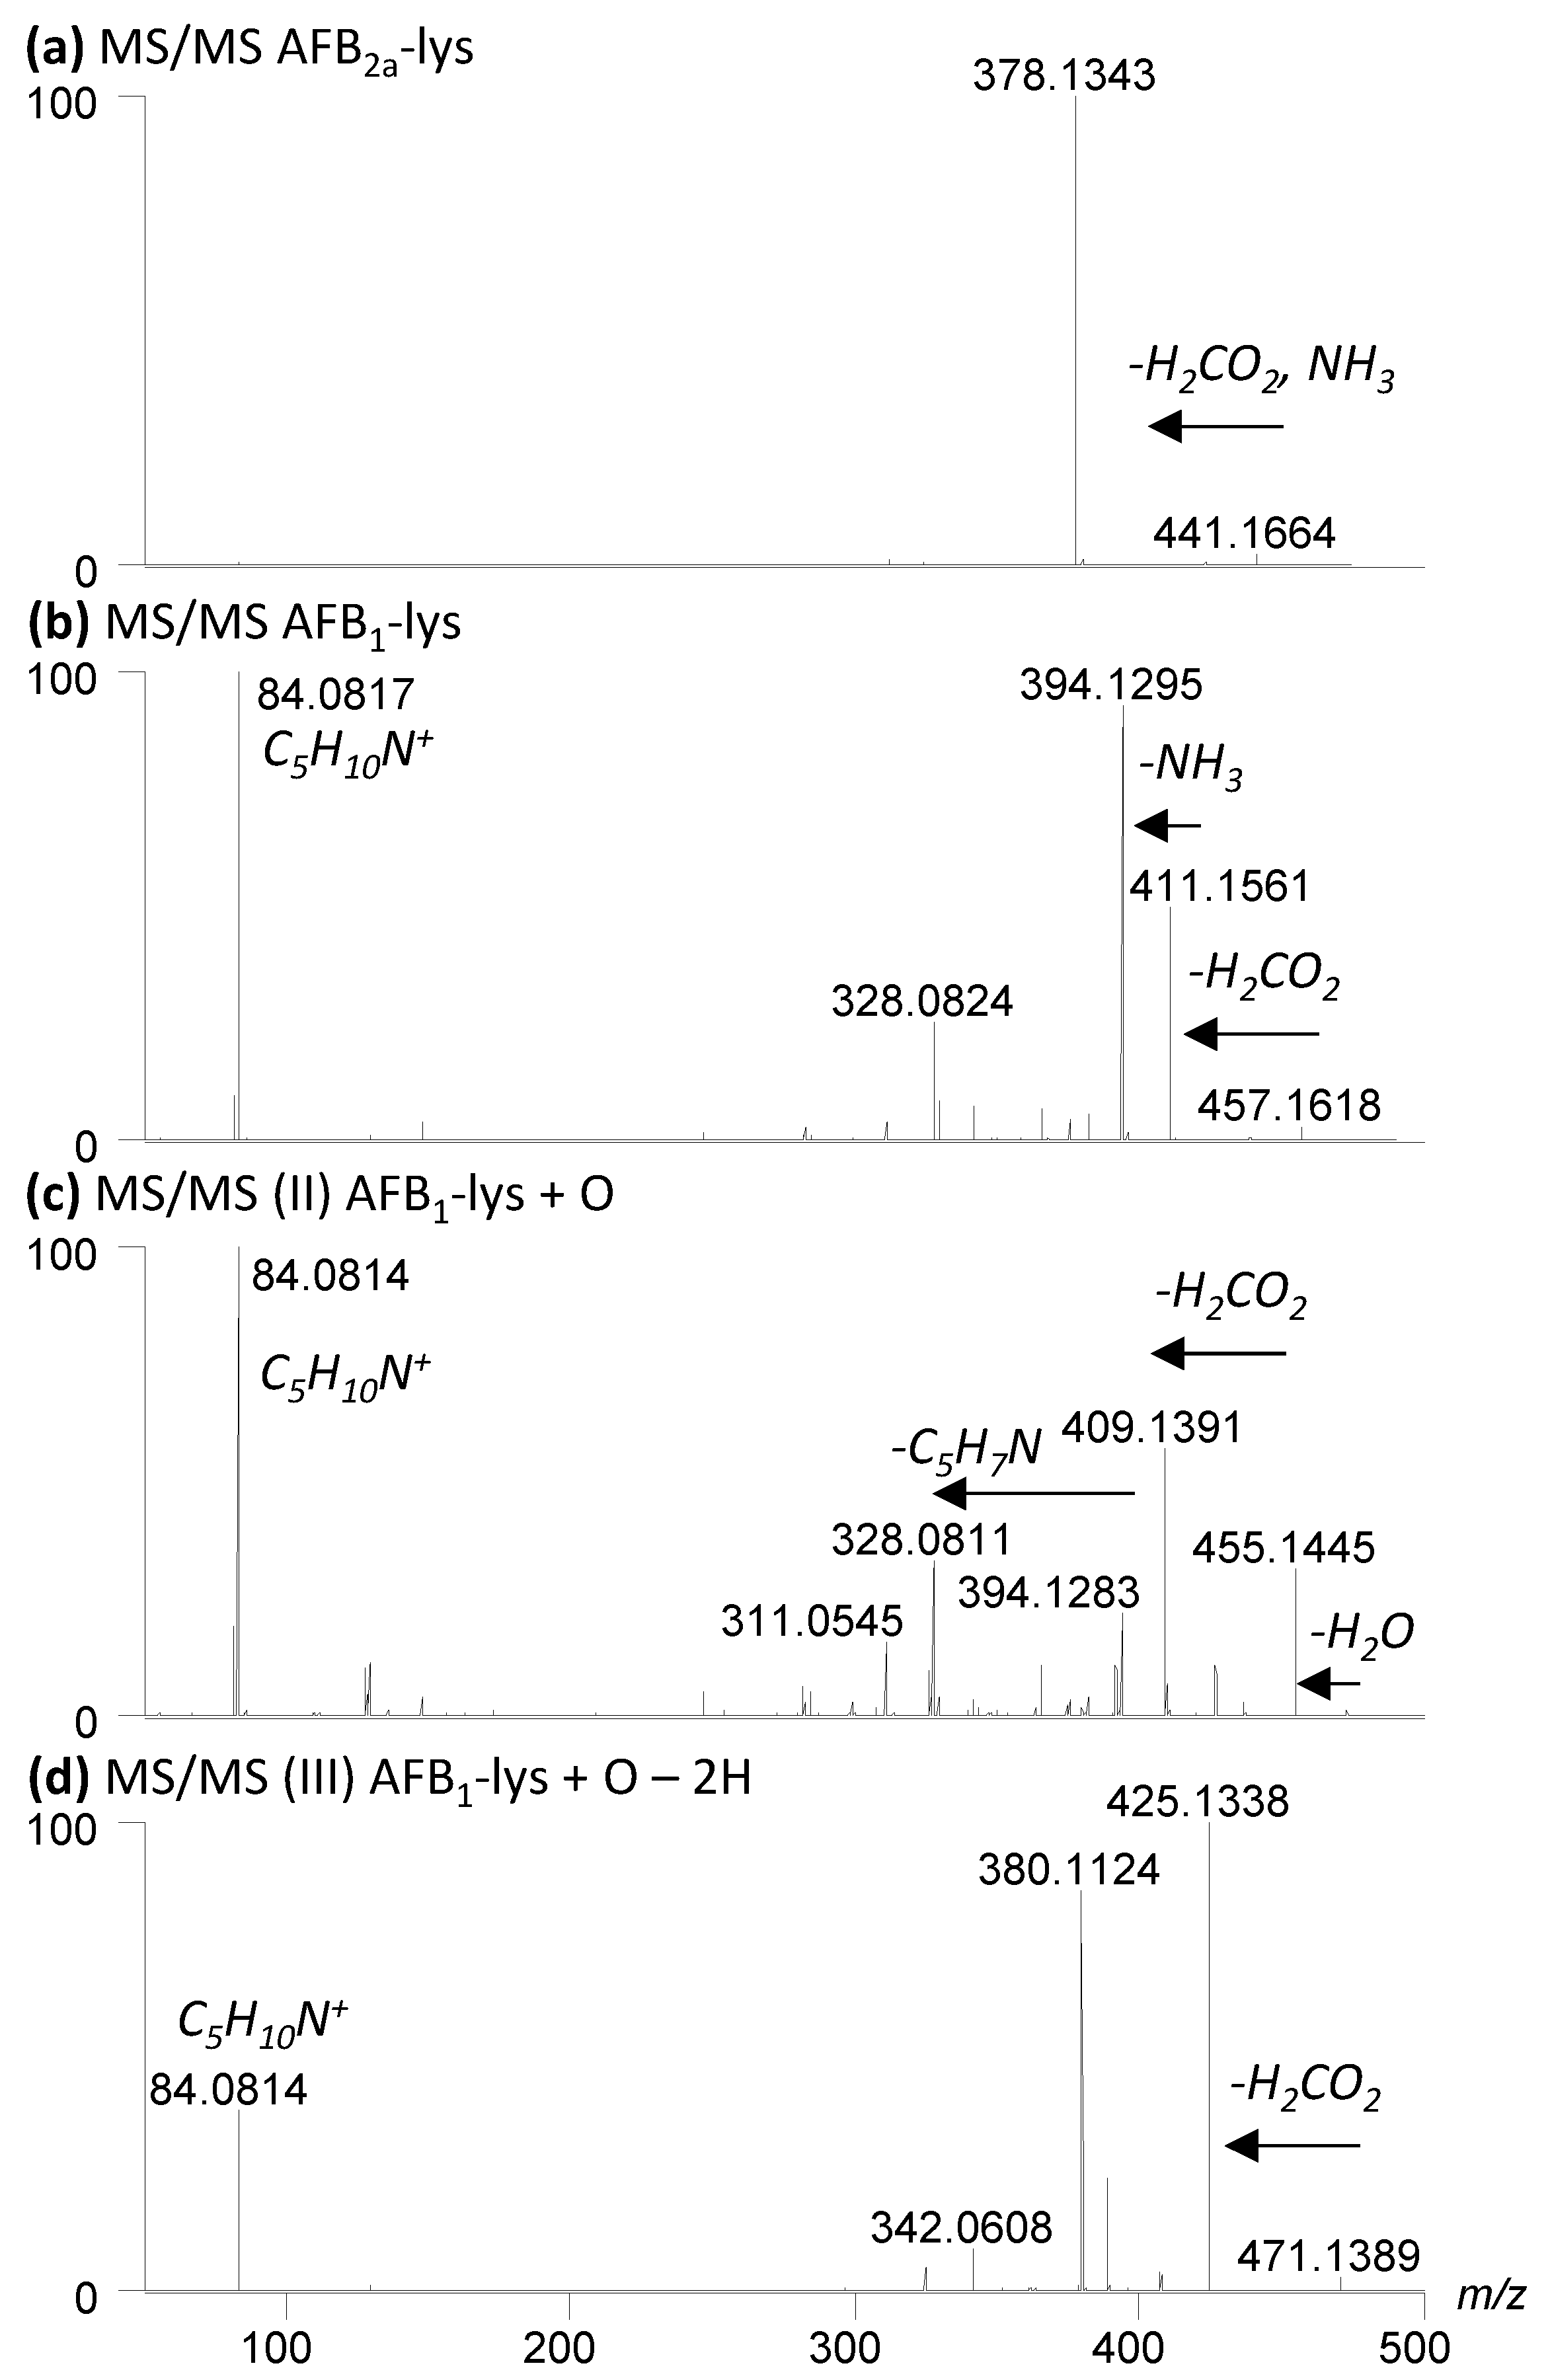
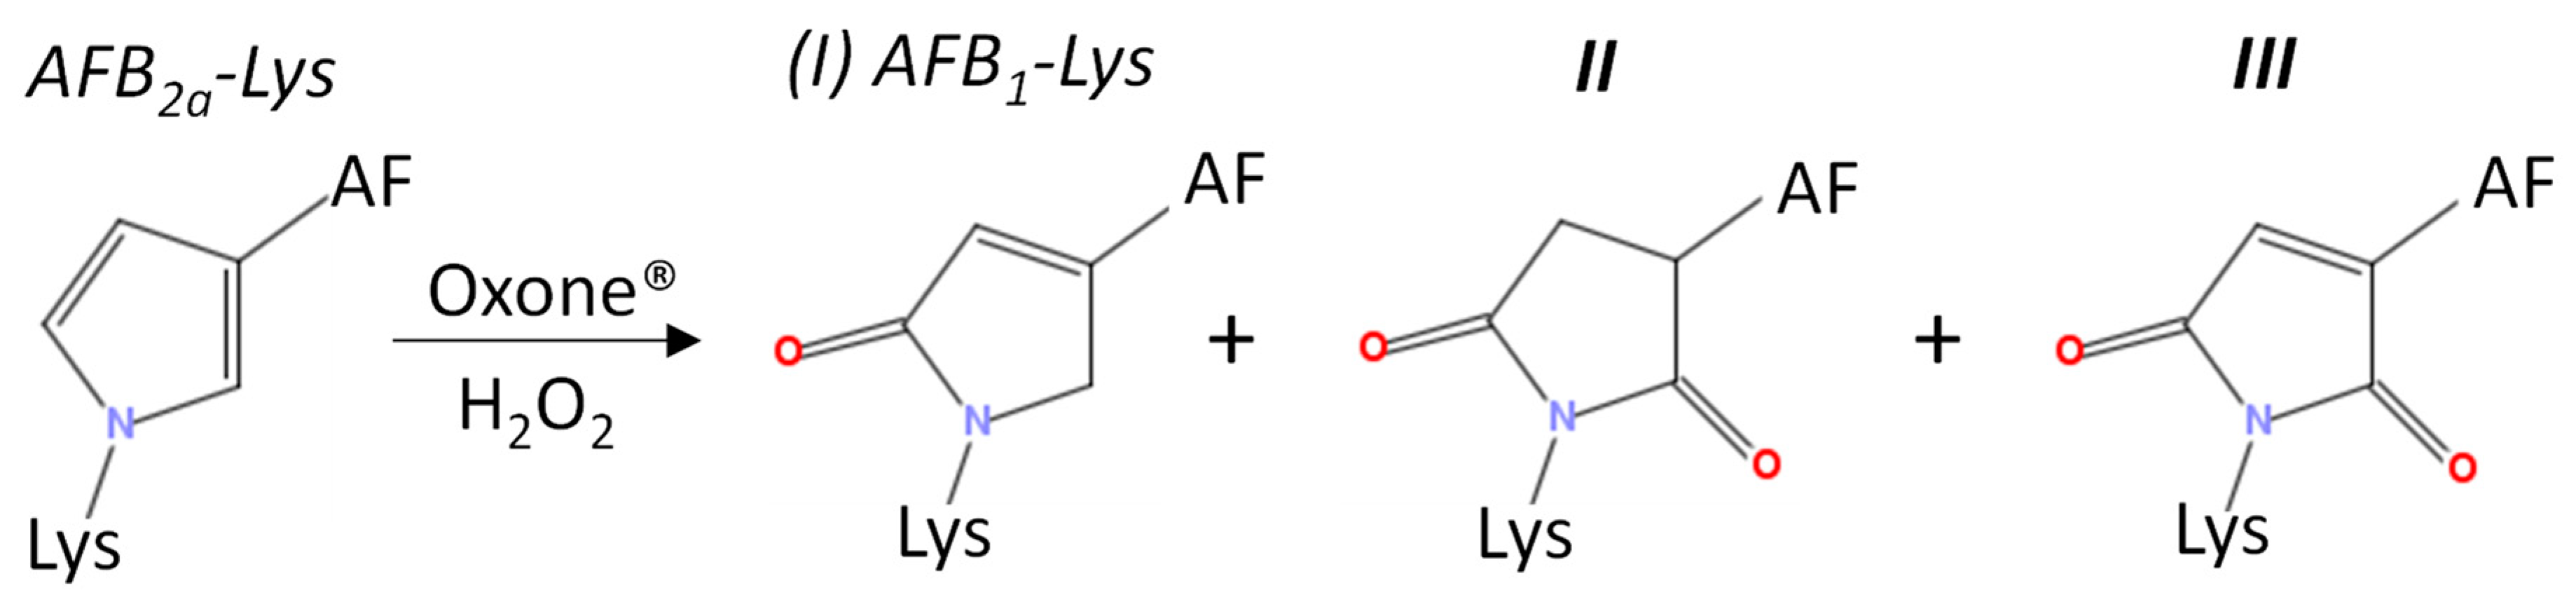
A small amount of AFB2a-Lys (10 µg AFB1 equivalents) was dried down and reconstituted in 195 µL of the 9 various solvents and buffers. A molar ratio of 1:10 AFB2a-Lys:H2O2 resulted in limited observable changes whereas 1:100 AFB2a-Lys:H2O2 and 1:1 AFB2a-Lys:Oxone® resulted in the appearance of new products. In addition to unreacted AFB2a-Lys, and the desired AFB1-Lys (I), AFB1-Lys with an additional oxygen (Scheme 3, II) and AFB1-Lys with an additional double bond and oxygen (Scheme 3, III) were significant by-products. These unknown oxidation products were examined by high resolution LC-MS/MS (Figure 4) and their structures are proposed in Scheme 3.
To systematically determine the best oxidizing agent for this reaction, we examined by LC-MS, both Oxone® and H2O2 under various reaction conditions (Figure 5 and Figure 6).
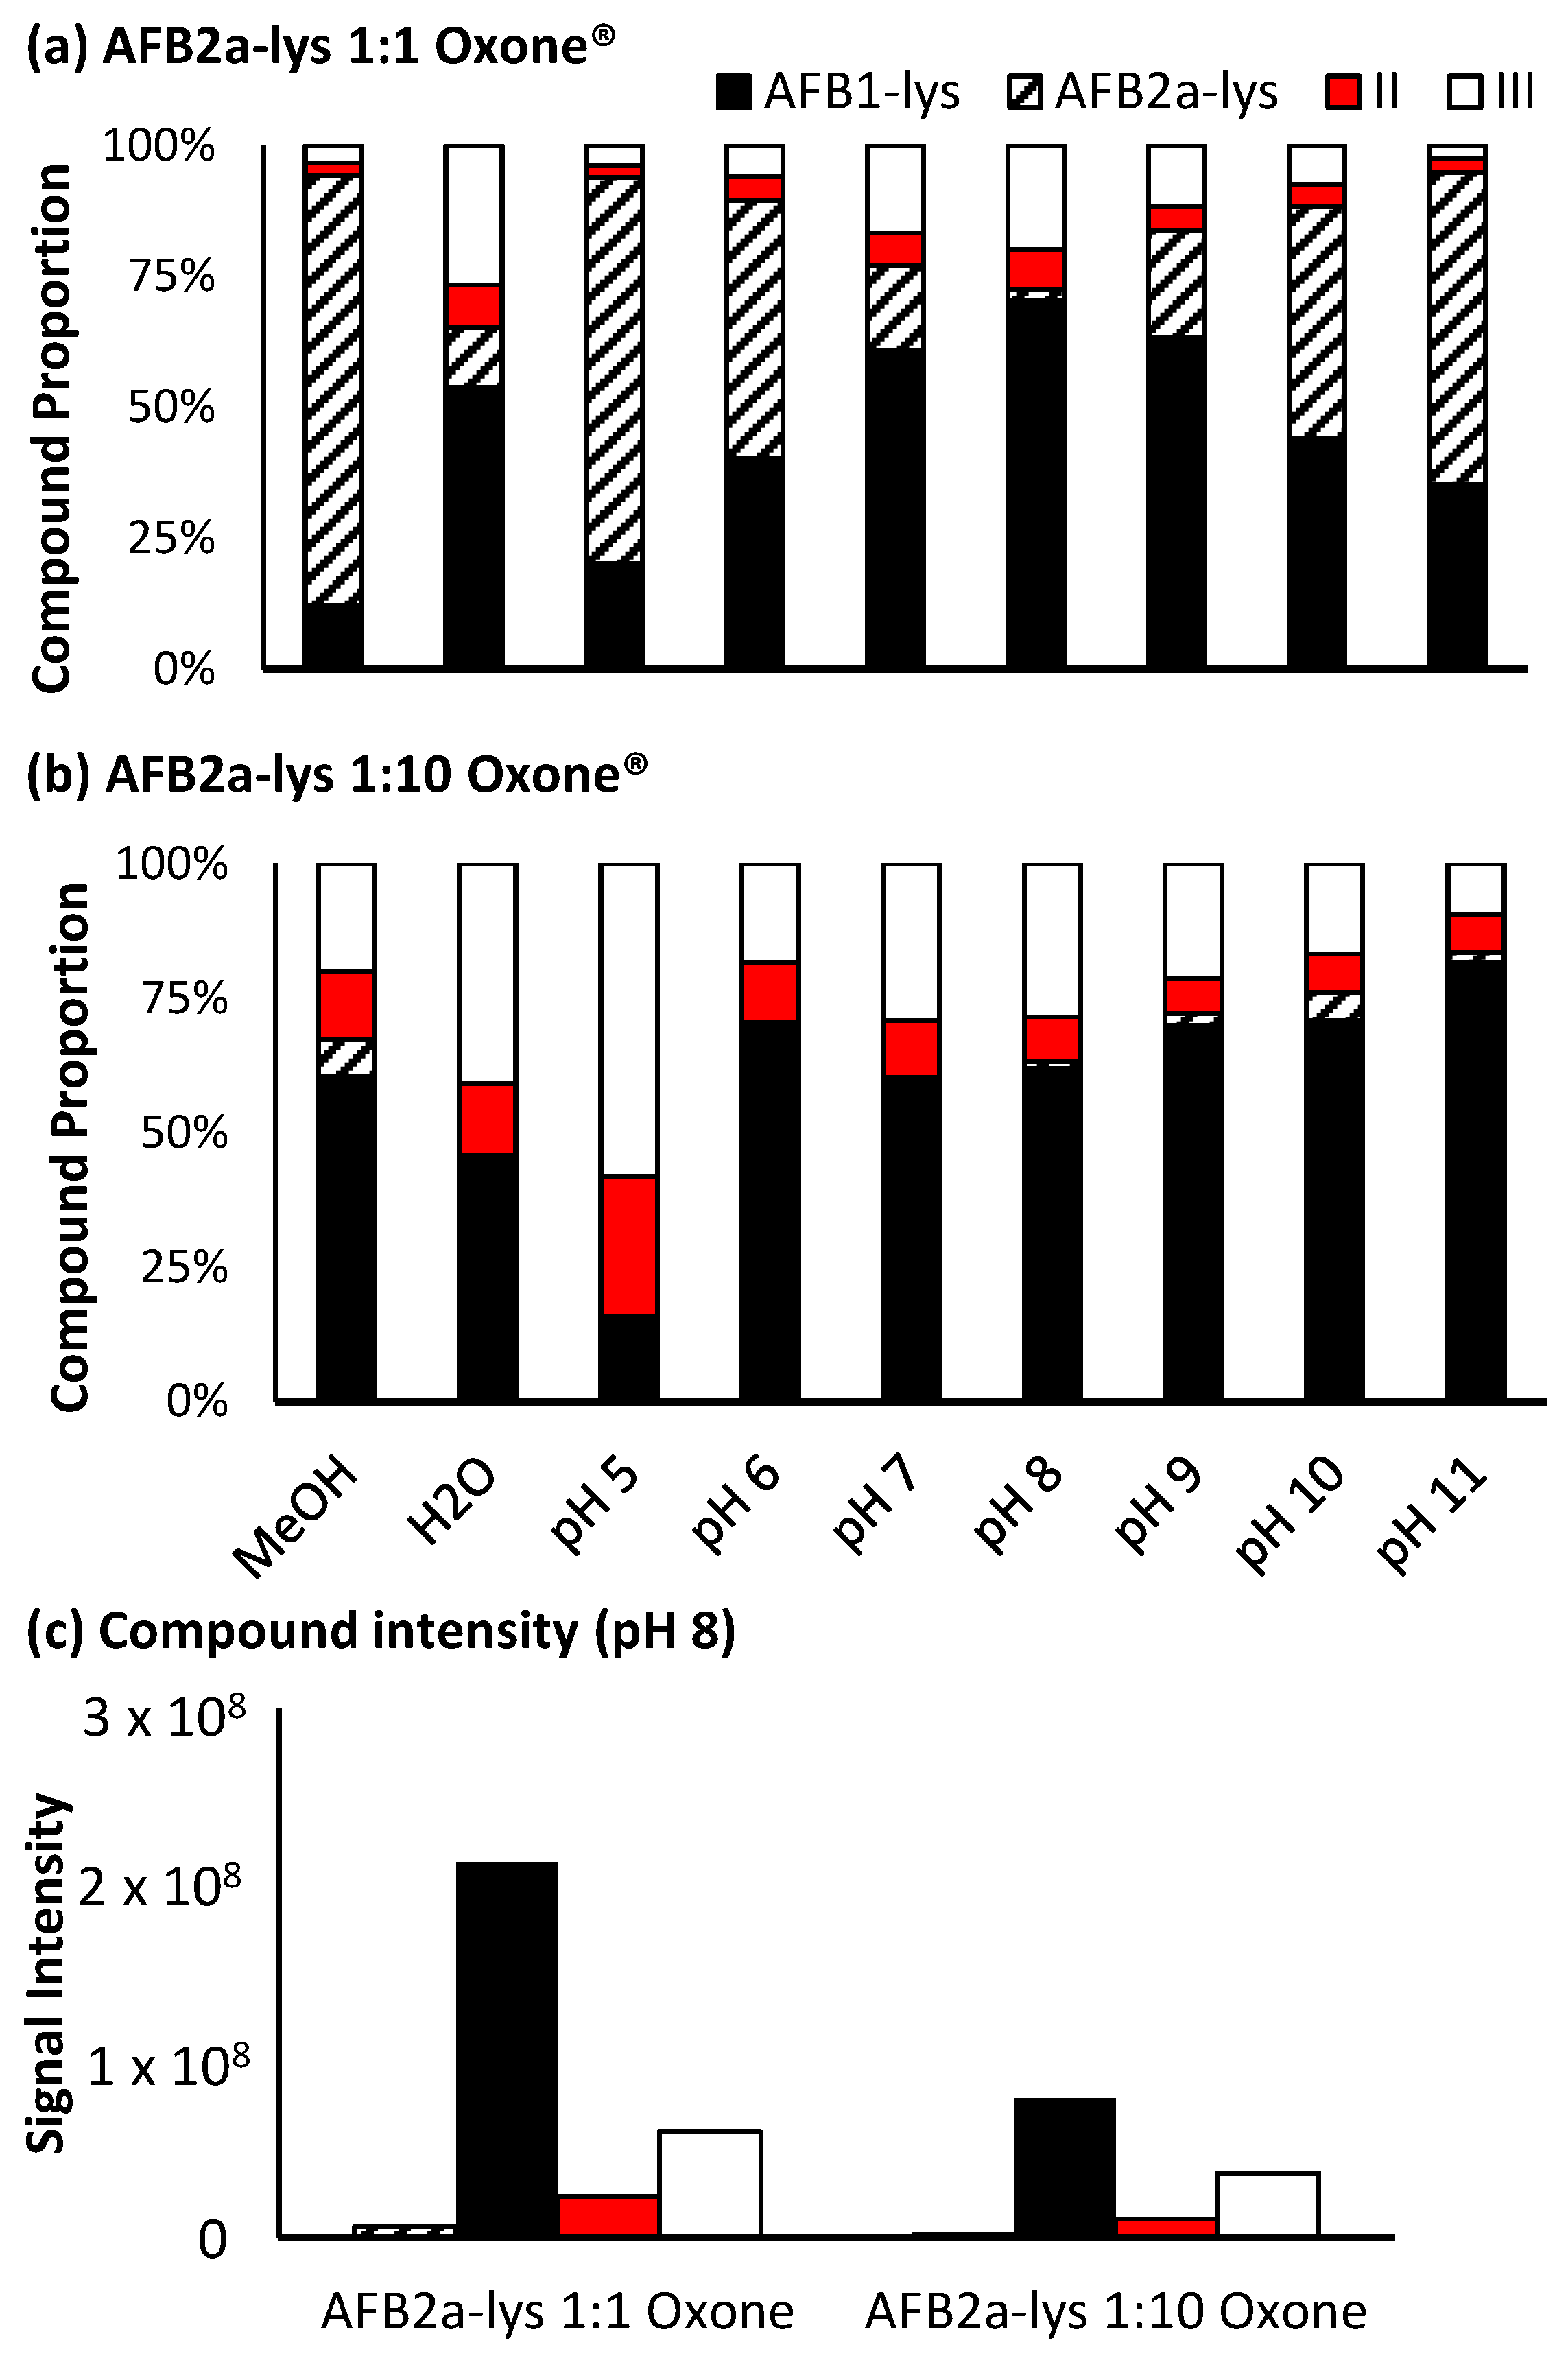
For Oxone®, a significant level of oxidation occurs at a molar ratio of 1:1, however this reaction is pH dependant. At pH 8, a maximum amount of AFB1-Lys is produced, while by-products II and III still account for approximately 30% of the products generated (Figure 5a). Increasing the amount of Oxone® used results in a decrease in unreacted AFB2a-Lys, however there is also an increase in the by-products with an added oxygen atom. Additionally, although the proportion of the desired AFB1-Lys product does increase with increasing Oxone®, the overall signal decreases (Figure 5c). This may be the result of the formation of pyrrole products that are able to polymerize [40].
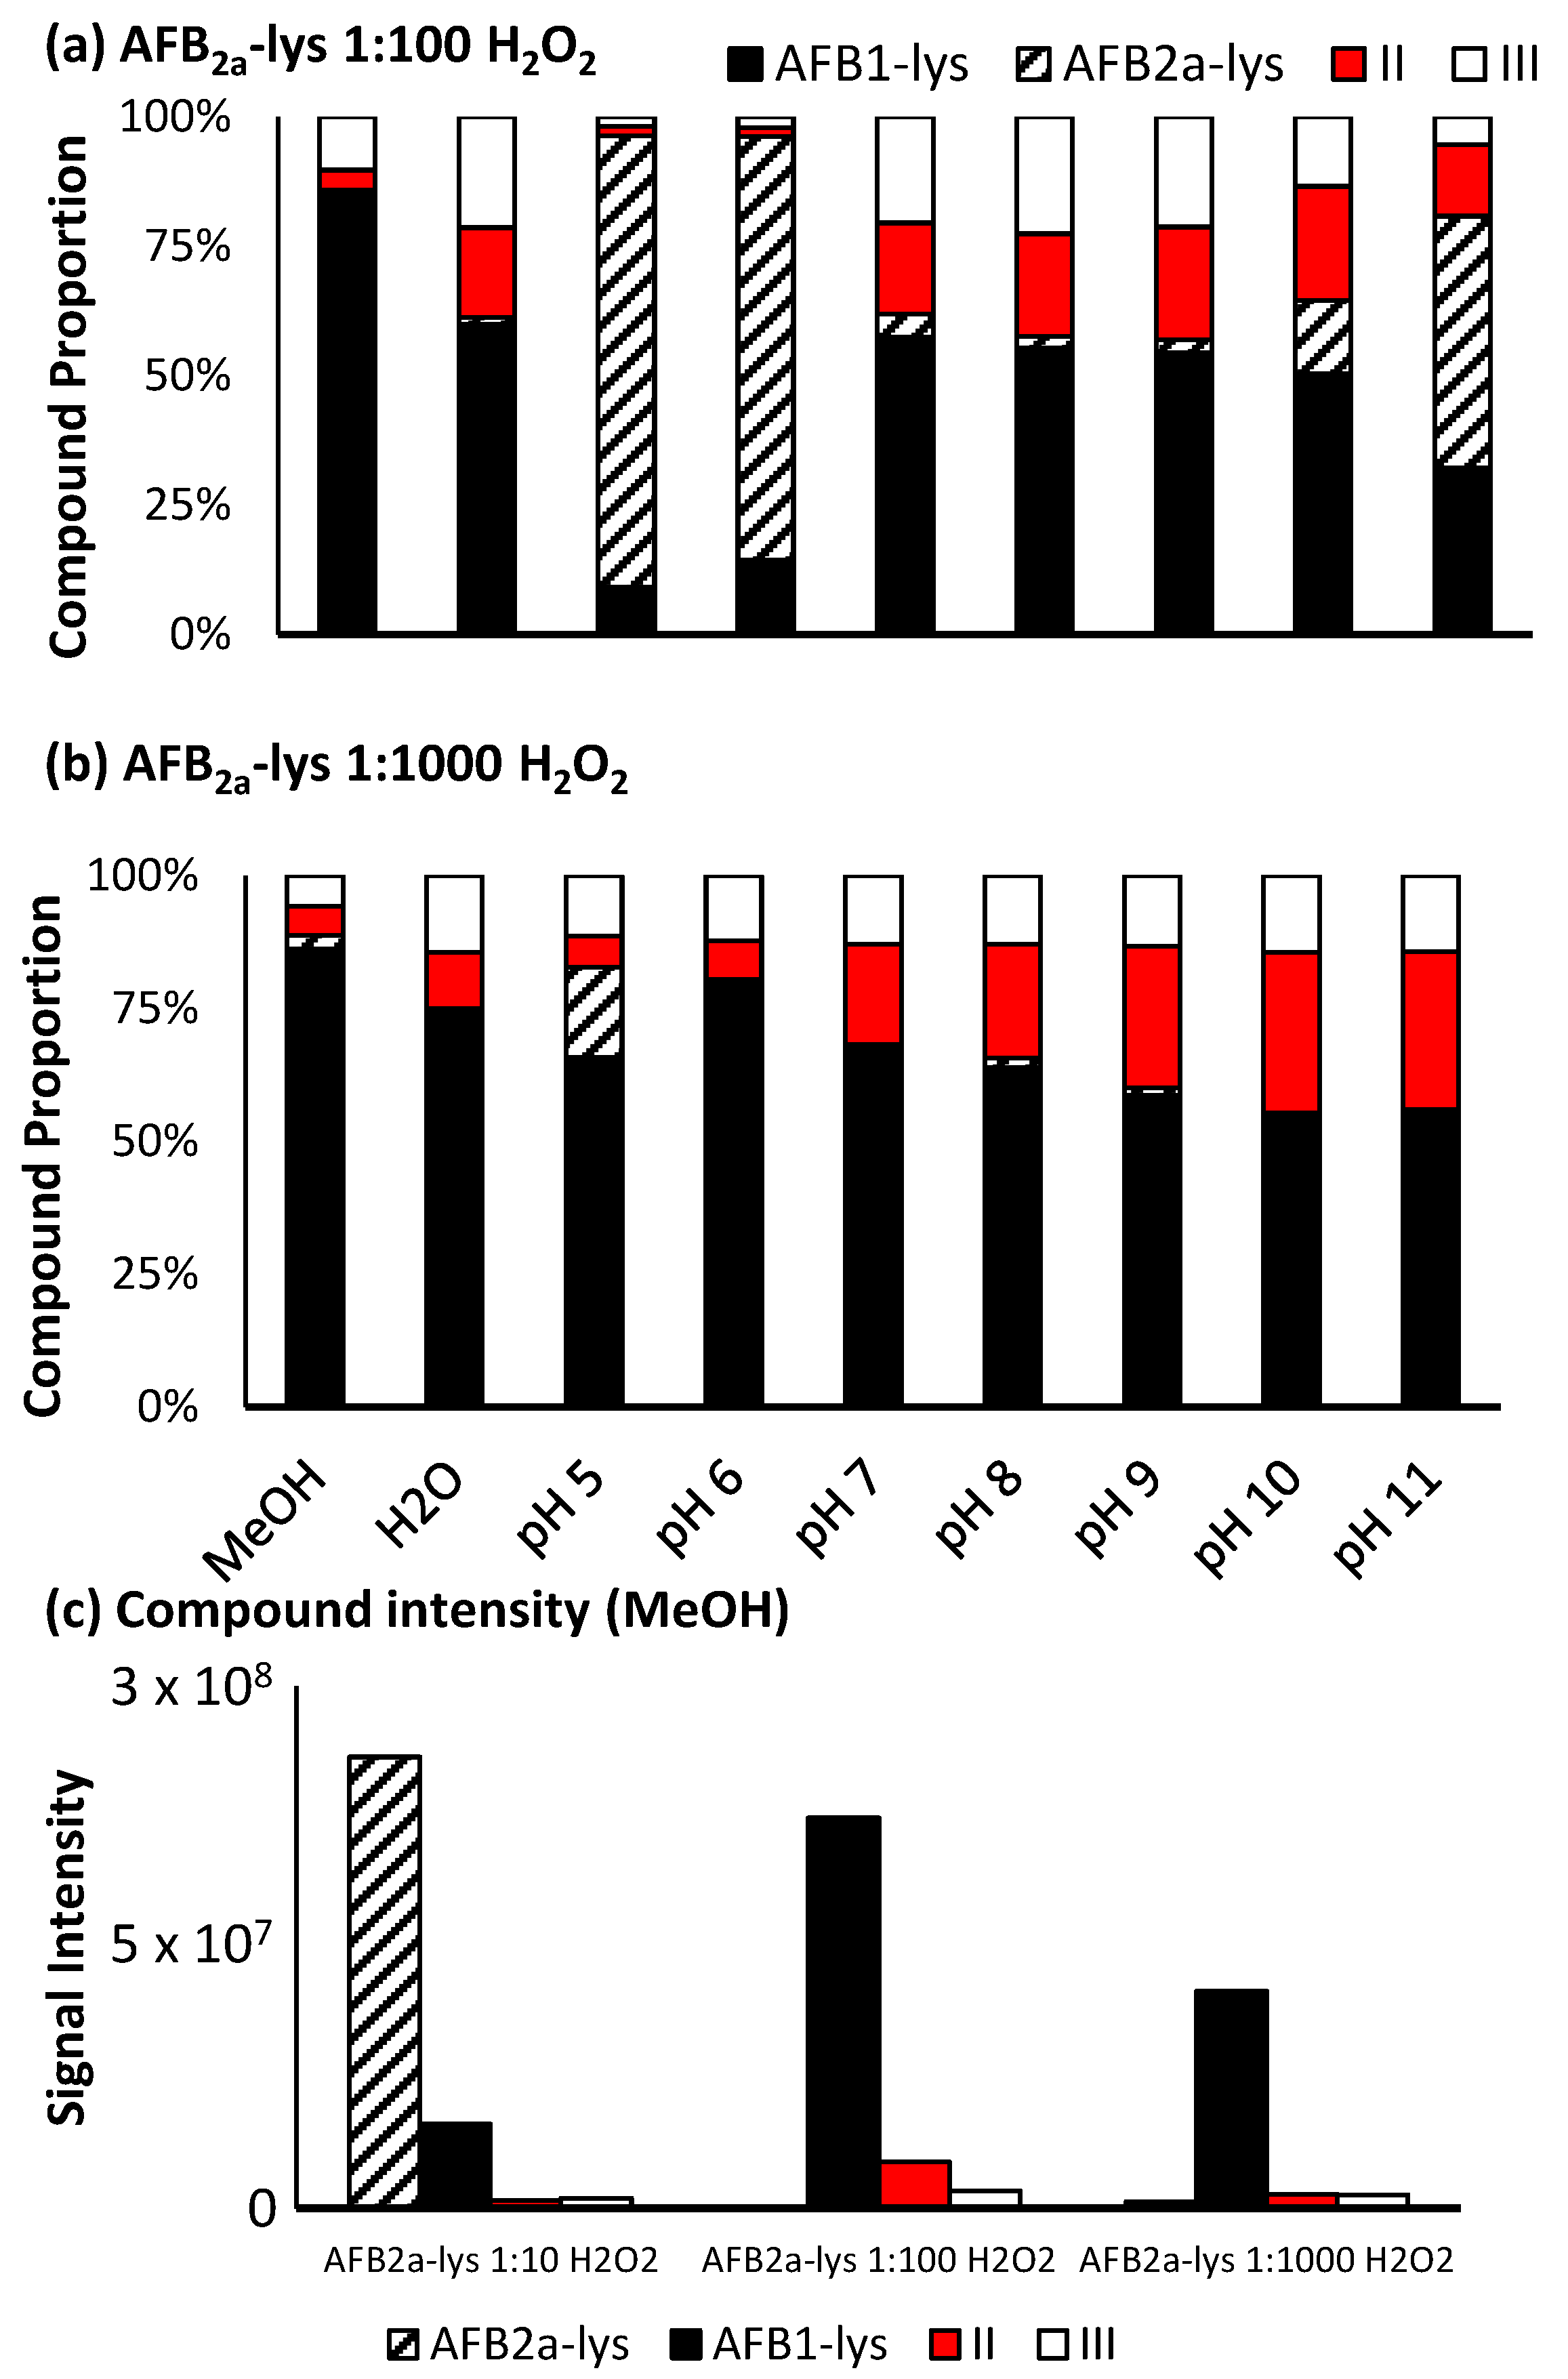
When H2O2 is added at a 1:10 ratio, limited conversion of AFB2a-Lys to AFB1-Lys was observed, however at a higher ratio, there was efficient oxidation. Notably, when performed in methanol, the reactant was nearly completely consumed and converted mostly to AFB1-Lys. The unwanted oxidized by-products (Scheme 3), were also minimized under these conditions. Increasing the pH of the reaction solution, did coincide with an increased quantity of oxidized by-products (Figure 6b). Unlike with Oxone®, H2O2 added to a methanolic solution did not greatly decrease the overall signal of the desired product AFB1-Lys. This may be due to conditions which do not favour polymerization (Figure 6c). Therefore, we determined that the most efficient route of converting AFB2a-Lys to AFB1-lys is via the addition of H2O2 in a methanolic solution.
2.4. Synthesis of Isotopically Labelled Standards
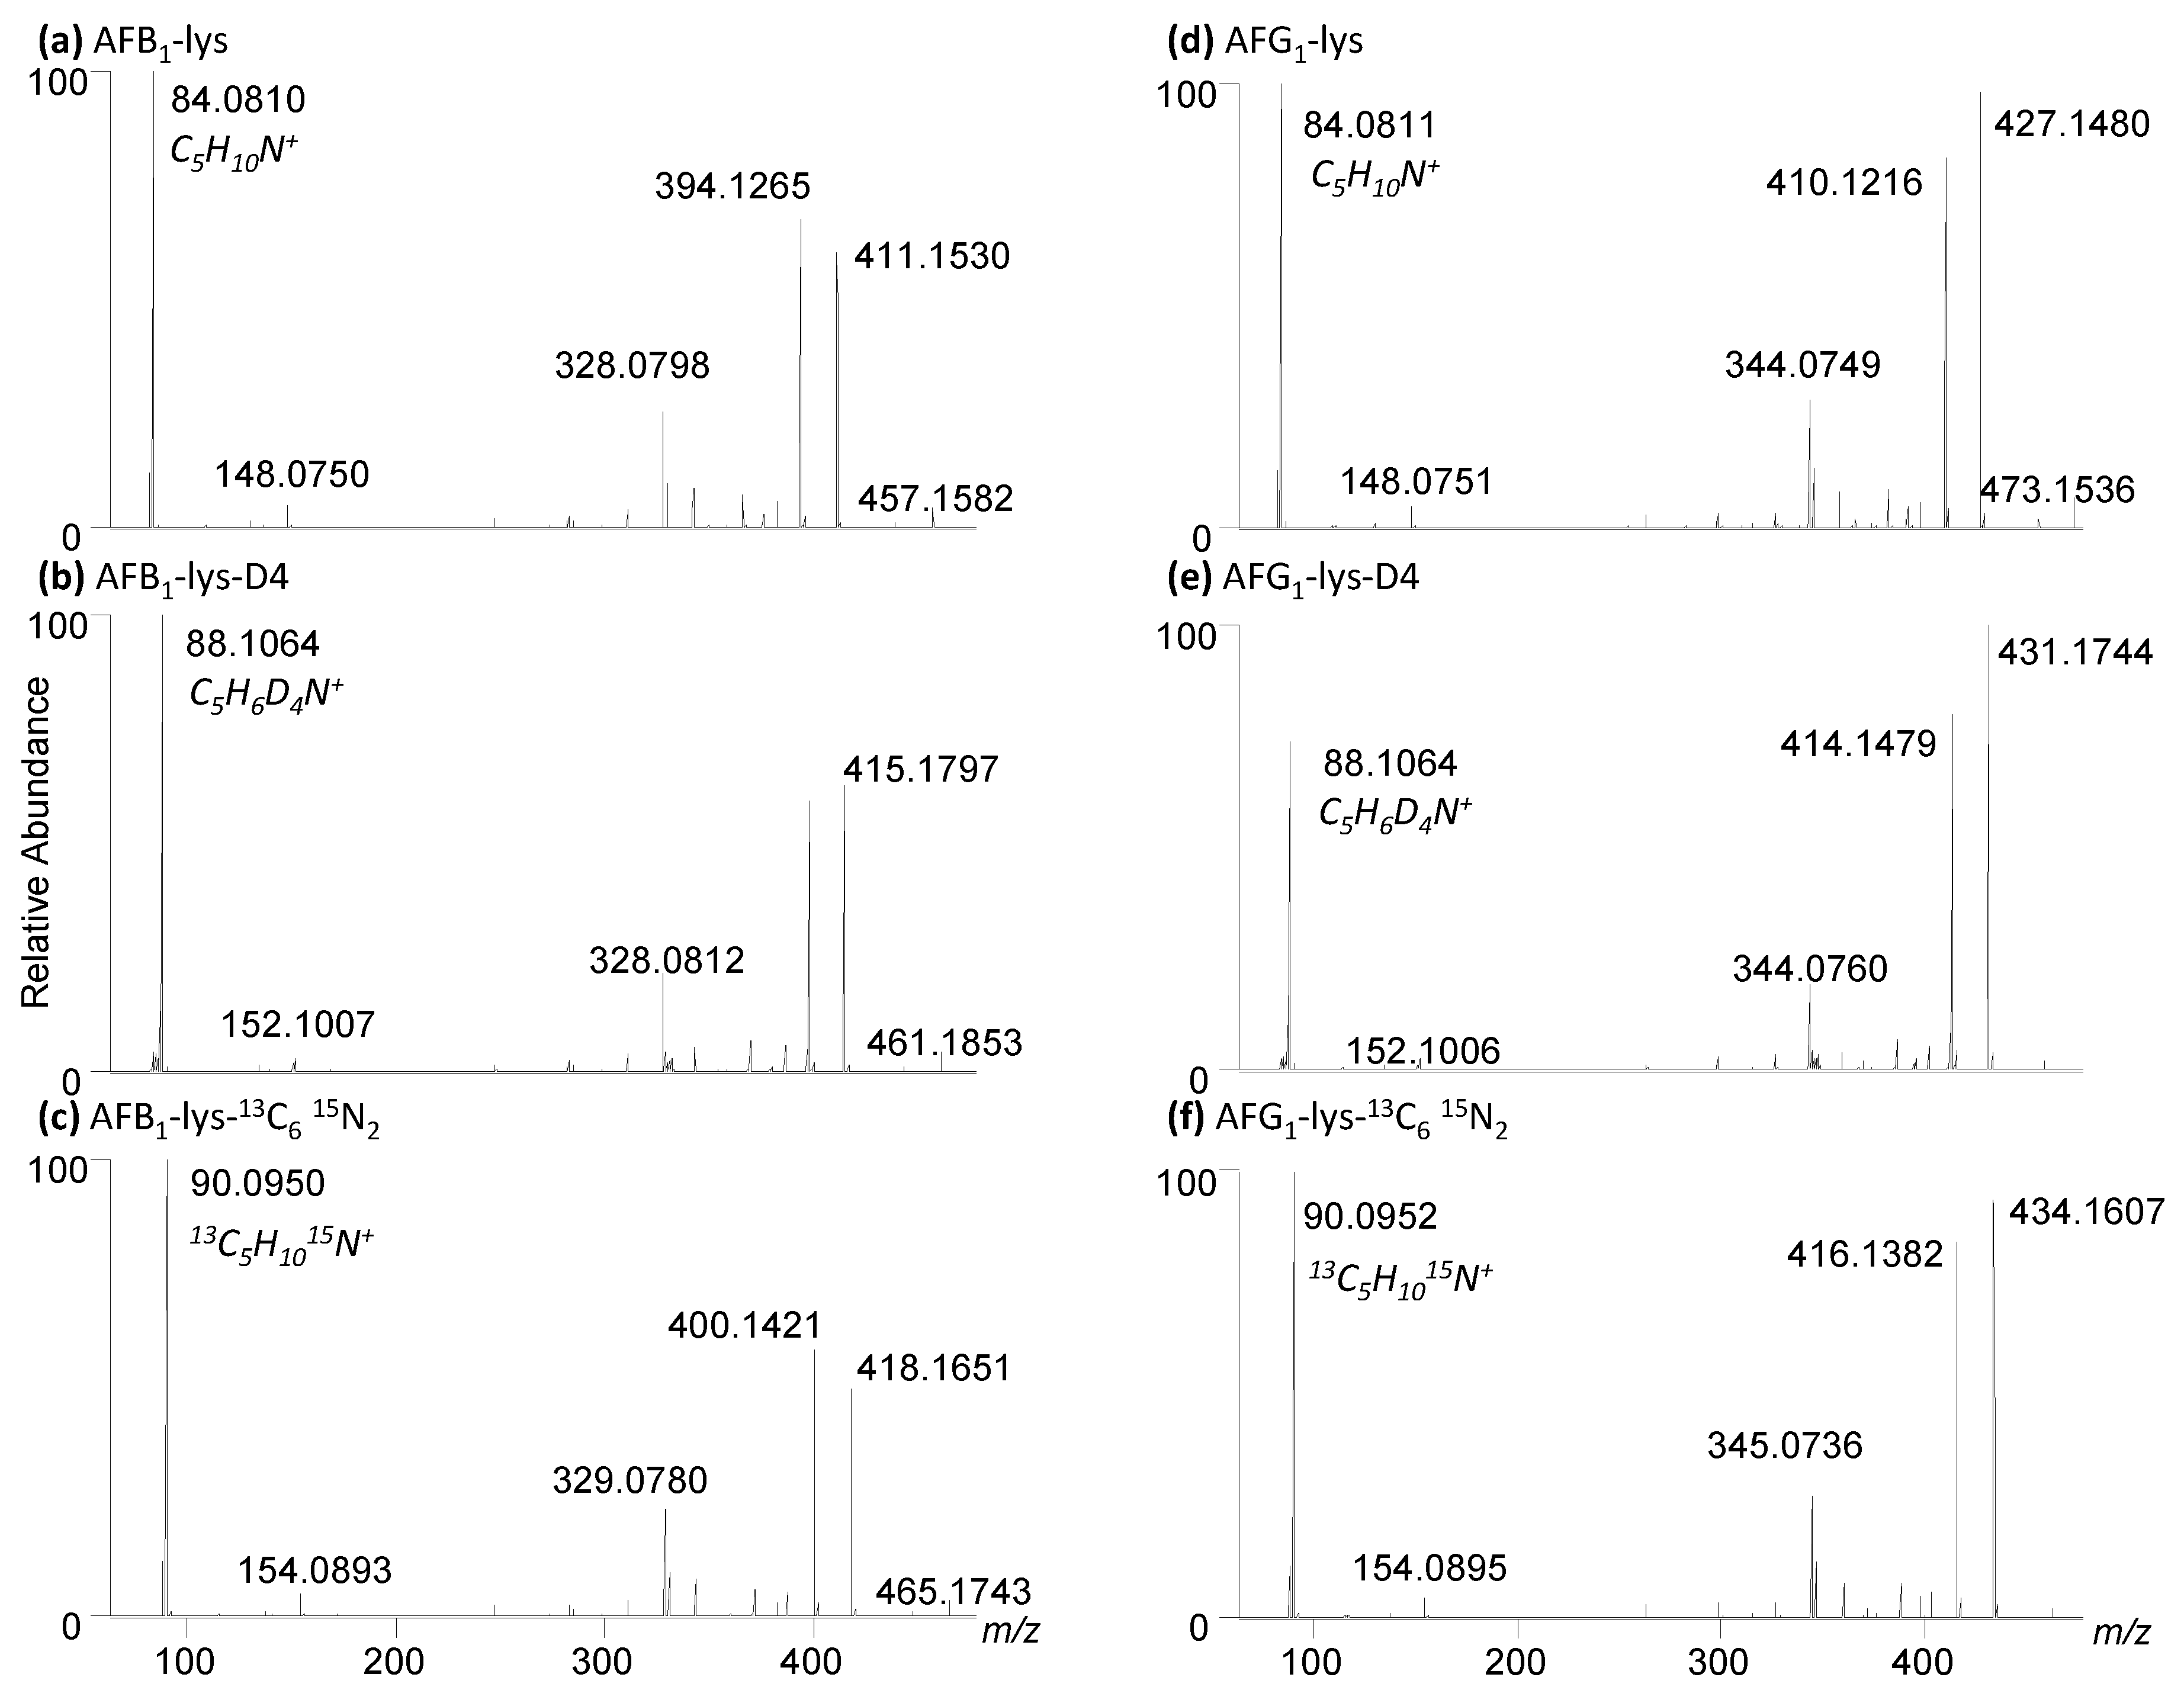
The analysis of AFB1-Lys by LC-MS/MS relies on isotopically labelled internal standards to account for sample matrix effects and analyte loss during sample cleanup. Previous studies used lysine-D4 [38], whereas we used 13C6,15N2 lysine [34]. In this work, using the optimized synthetic route described above, we were able to efficiently produce both AFB1-Lys and AFG1-Lys using unlabelled, deuterated and 13C6,15N2 lysine for a total of six standards (Figure 7). A minimum of one internal standard per analyte is required to quantify these analytes in samples, however having two distinct isotopically labelled standards will allow for an additional performance step such as SPE or the Pronase® digestion to be monitored.
2.5. Quantitative NMR
To our knowledge, the concentrations of synthetically derived AFB1-Lys were determined by the molar attenuation coefficients described by Sabbioni (ε399 25,400/M·cm at pH 7.0 [11] and ε400 30,866/M·cm pH 7.4 [37]). During our first attempts to dissolve the isolated standards at concentrations at or above 1 mg/mL, we observed the formation of precipitates with methanol, D2O, and D2O with 0.01 M K2DPO4. These precipitates could not be resolubilized by changing the solvent, or with heating and sonication. Therefore, we aimed to perform qNMR at lower concentrations (0.5–1 mg/mL) and using a mixed solvent system that contained 70% D2O and 30% MeCN-D3.
Although spectroscopic quantitation is more straightforward than qNMR, if different groups synthesize standards that contain oxidized impurities, these molar attenuation coefficients may not accurately describe the concentration of synthetic AFB1-Lys standards. Furthermore, should the standards undergo oxidation or degradation while in storage, checking the standard by spectrophotometry alone could also lead to inaccuracies. In this work, we undertook qNMR, using maleic acid as an internal standard. (Table 1).
We observed good agreement between concentrations of AFB1-Lys measured with UV–VIS and qNMR. This is significant as to our knowledge, all studies that have measured AFB1-Lys in samples have relied on standards that have been characterized by the published molar attenuation constant and therefore, are likely accurate. This contrasts with our results for AFG1-Lys, where we observed a significant disagreement between UV–VIS and qNMR derived concentrations. The UV–Vis AFG1-Lys concentration was lower (%) than the concentrations determined by qNMR; 1.89 vs. 0.634 mM, respectively. We re-examined this disagreement by recording the mass of the dried AFG1-Lys material in a pre-weighed vial, and resolubilizing the solution in 25% acetonitrile at 1 mg/mL. Similar to the qNMR comparison, UV–Vis concentrations were significantly less than what was expected based on the measured masses. The solution of AFG1-Lys that was 1 mg/mL by mass, gave a measured concentration of only 0.3 mg/mL by UV–Vis. Therefore, the molar attenuation constant previously reported for AFG1-Lys is likely not accurate and should not be used [25]. To our knowledge, AFG1-Lys has not been measured as a biomarker in any populations and therefore this discrepancy has likely had limited impact on any published studies.
2.6. Stability
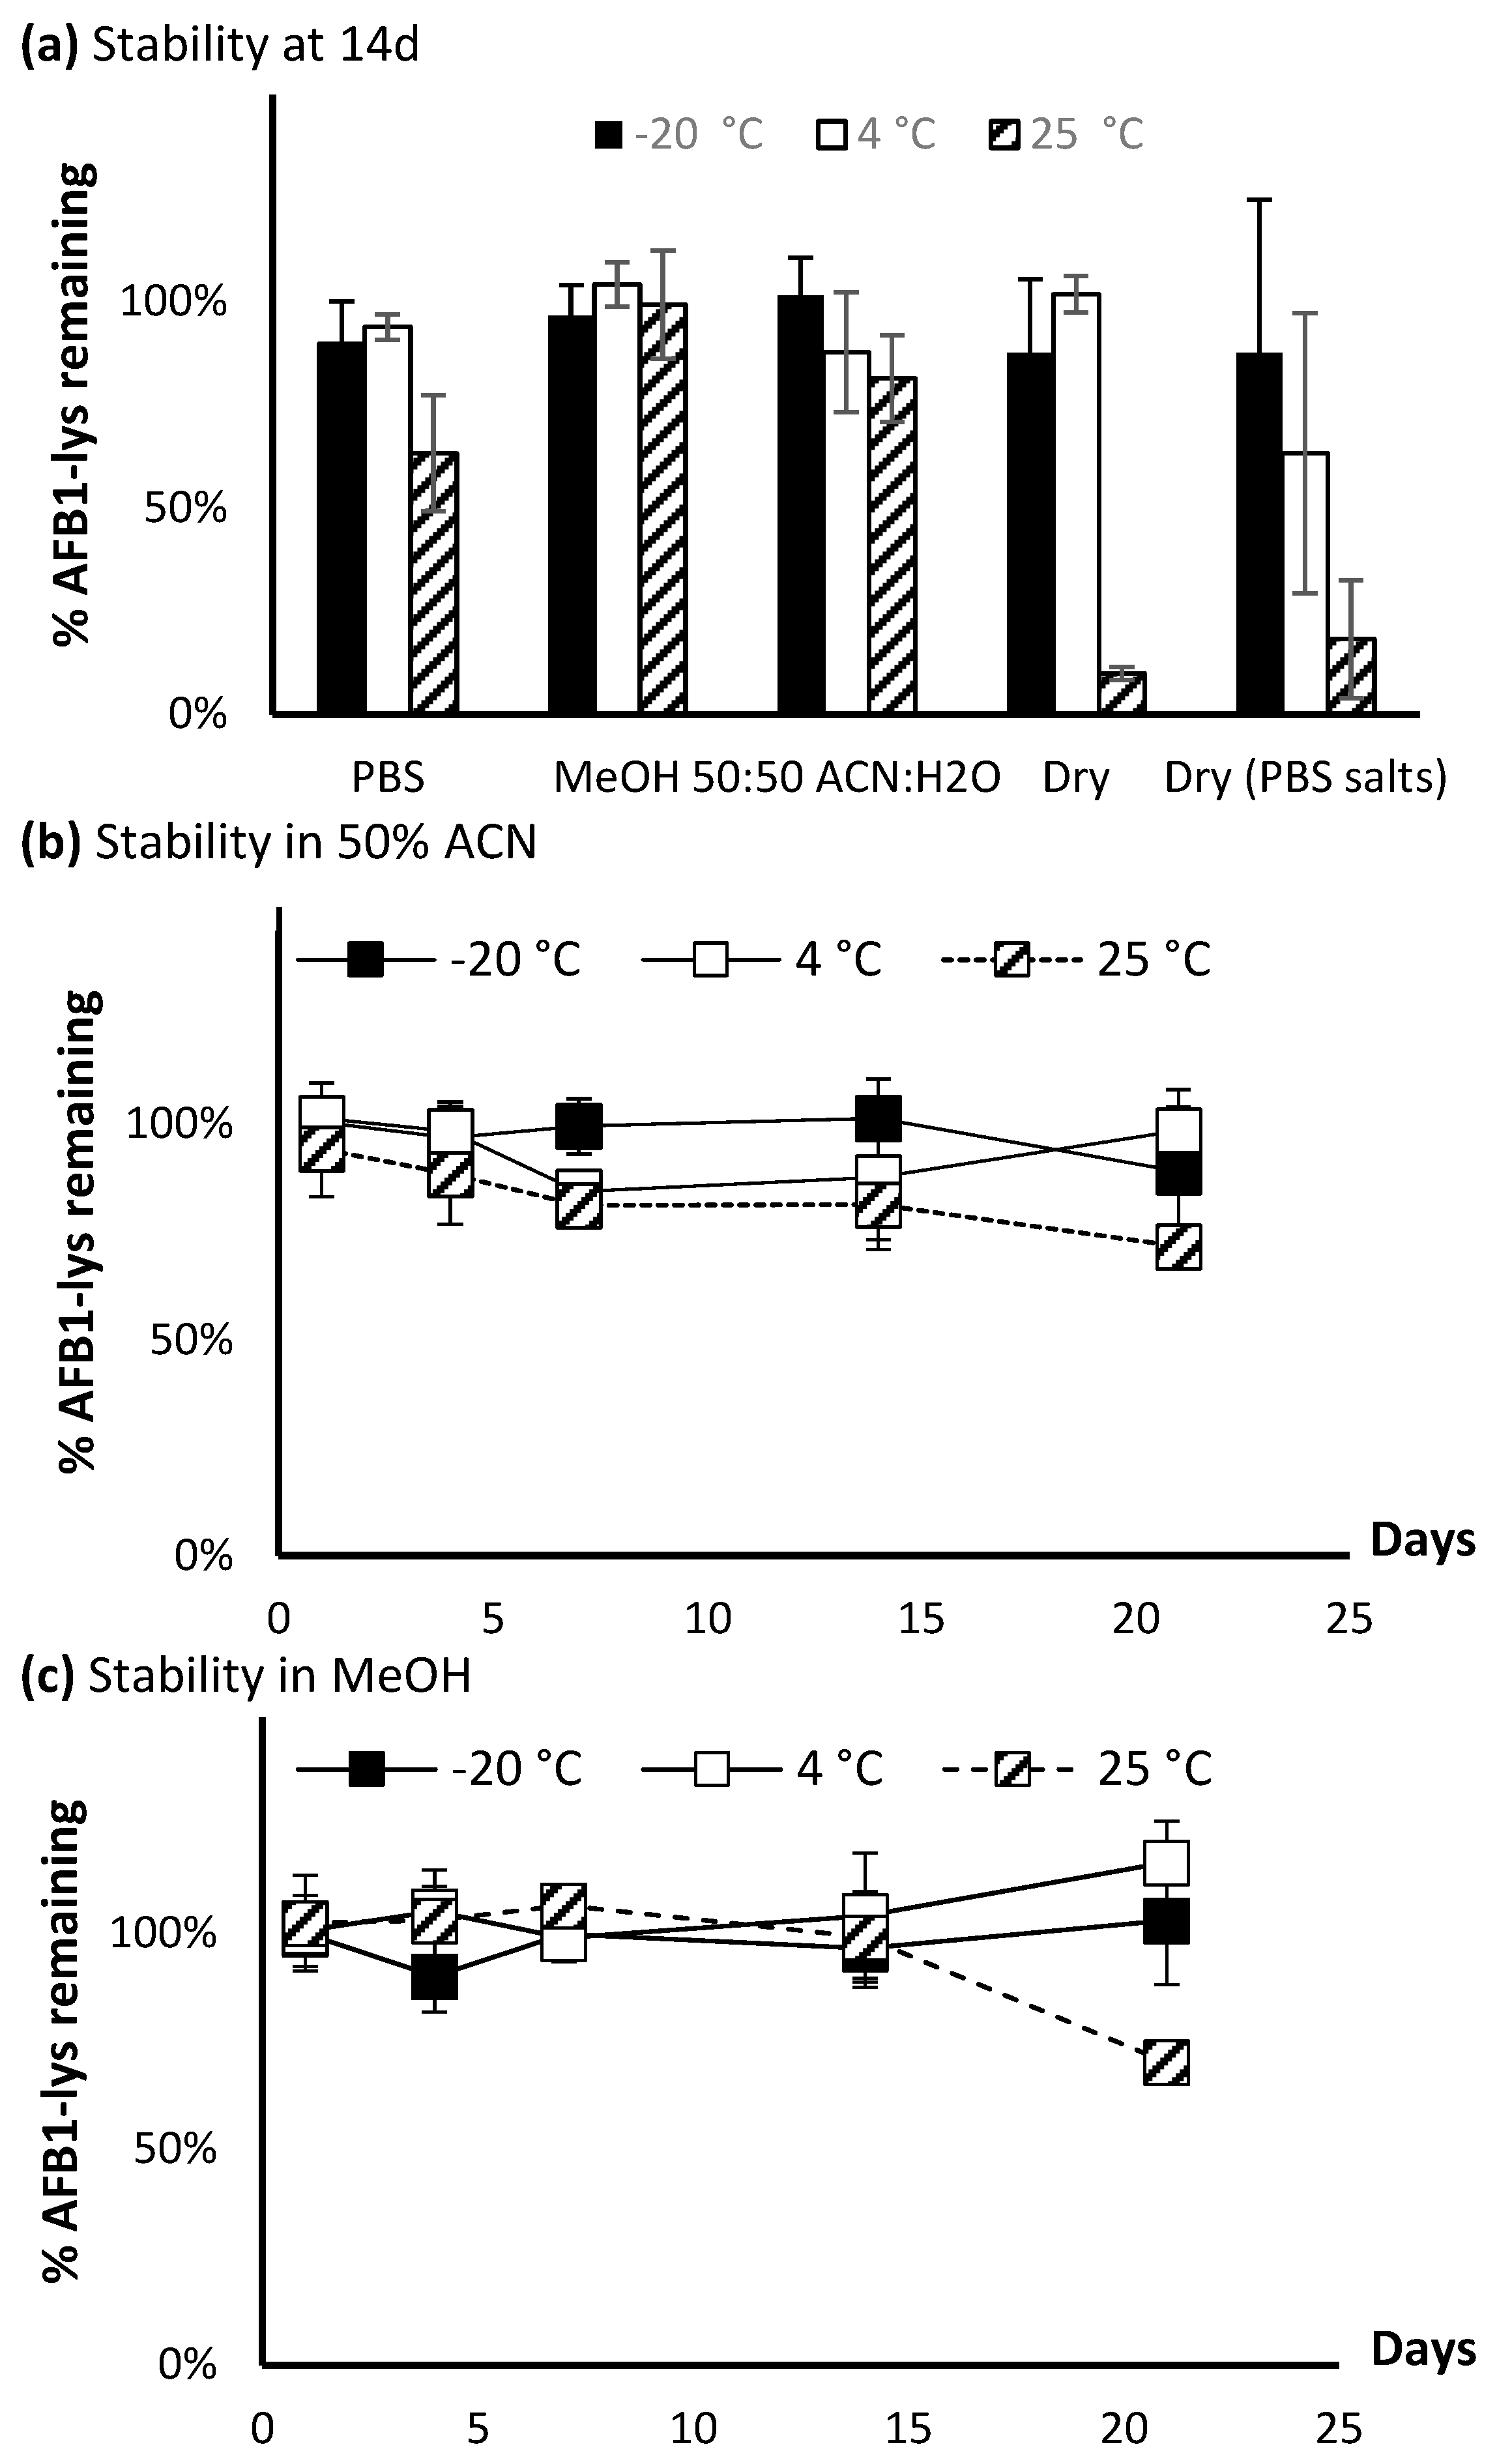
The stability of AFB1-Lys was assessed in a 21 day assay under various conditions. The standard at 50 ng/mL was initially tested in various solvents, where it was found that it rapidly degraded in DMSO and had limited solubility in acetonitrile. Therefore, these two conditions were omitted from the full 21-day assay. With the exception of being stored as a dried residue with PBS salts, after 14 days (Figure 8a), the analyte was stable in all tested conditions when kept at −20 °C or 4 °C. Conversely, at 25 °C, degradation was observed in all solvents with the exception of methanol. The most significant degradation was observed when the analyte was stored in PBS, as a dried residue, or a dried residue with PBS salts. Therefore, these synthetic AFB1-Lys and AFG1-Lys standards if possible should not be shipped or transported as a dry residue.
A closer inspection on the stability of AFB1-Lys over 21 days in 50% acetonitrile or methanol (Figure 8b,c) indicates good stability can be maintained at colder temperatures across the tested time frame. At lower concentrations, the standards could be stored in methanol, however based on observations that insoluble precipitates could form in methanol at higher concentrations, storing the standards in a 50:50 water:acetonitrile solution is preferred for long term storage.
3. Conclusions
In this study we simplified the synthesis of AFB1-Lys and presented the synthesis of AFG1-Lys for the first time. We also produced Lysine-D4 and Lysine 13C6, 15N2 labelled versions of both and studied their stability under a number of conditions. Access to these standards that are not commercially available is critical for conducting human aflatoxin exposure assessments. The next steps moving beyond this study are to develop a serum reference material and conduct a validation study comparing the currently available AFB1-Lys standards. This will ensure better cooperation between laboratories conducting aflatoxin exposure assessments and will also ensure that data are comparable from one study to the next, which is critical for studies conducted on human populations.
4. Materials and Methods
4.1. Materials
AFB1 and AFG1 were obtained from Toronto Research Chemicals (Toronto, ON, Canada). Sodium bicarbonate, 50% hydrogen peroxide solution, Oxone®, L-Lysine, L-Lysine-4,4,5,5-D4, hydrochloride, L-Lysine-13C,15N2 hydrochloride, D2O, acetonitrile-D3, and maleic acid (qNMR standard, TraceCert®) were obtained from Millipore Sigma (Oakville, ON, Canada). LC-MS grade solvents H2O, methanol, and acetonitrile were purchased from Fisher Scientific (Ottawa, ON, Canada).
LC-MS and high-resolution LC-MS/MS, all reactions were monitored using a Thermo Vanquish Duo UHPLC system coupled to a Thermo Altis triple quadrupole mass spectrometer. The UHPLC used an Agilent Zorbax C-18 column (50 × 2.1 mm; 1.8 µm) held at 35 °C, flow rate of 300 µL/min, aqueous mobile phase (A) of H2O +0.1% formic Acid (Fisher Optima™ LC/MS Grade) and organic mobile phase (B) of acetonitrile + 0.1% formic acid (Fisher, Optima™ LC/MS Grade) was used throughout. The gradient began with 2% B for 1.6 min before increasing to 100% over 2.4 min. B was held at 100% for 1 min before returning to 2% in 0.5 min. The analytes were monitored using an HESI source, in positive ionization full MS mode, with a range of m/z 150–800, scan rate of 1000 mass units/s, and resolution of 0.7 FWHM.
High resolution MS/MS spectra of analytes were obtained using a Q-Exactive Orbitrap mass spectrometer coupled to an Agilent 1290 UHPLC system. The chromatographic conditions were the same as previously described. Mass spectrometer analysis in positive mode was performed using the following conditions: heated electrospray ionization (HESI): capillary temperature, 400 °C; sheath gas, 17 arbitrary units; auxiliary gas, 8 units; probe heater temperature, 450 °C; S-Lens rf level, 45%; and capillary voltage, 3.9 kV. Analytes were analyzed by data-dependent analysis that included a full MS scan at 35,000 resolution, automatic gain control of 5 × 10⁵, followed by 3 MS/MS scans at 17,500 resolution, and normalized collision energy of 30.
4.2. Conversion of AFB1/AFG1 to AFB2a/AFG2a
AFB1 and AFG1 were converted to their ‘2a’ equivalents following the method of Ciegler et al. [28] with some modifications. One mg of each aflatoxin standard was placed in an amber HPLC vial and dissolved in 0.4 mL of LC-MS grade acetonitrile. The solution was vortexed for 10 s and sonicated in a 25 °C water bath for 3 min to ensure the compound was completely dissolved. A 0.5 mL aliquot of LC-MS grade H2O was added to the solution followed by 100 µL of 2 M HCl for a final acid concentration of 0.2 M. The vials were then placed on a thermomixer held at 42 °C with shaking at 300 rpm for 48 h. Following the incubation procedure, a 10 µL aliquot was removed and diluted in 990 µL of 50% acetonitrile and analyzed by LC-MS to ensure conversion was greater than 95% based on relative peak areas.
The resulting solutions were dried under a gentle stream of nitrogen gas at ambient temperature without additional heat. A 400 µL aliquot of acetonitrile was added to the residue and dried again to ensure that all residual acid was evaporated as it can negatively affect the coupling step. The dried aflatoxin residue was reconstituted in 50% acetonitrile at 1 mg/mL. Ten µL of this solution (10 µg AFB1 equivalents) was transferred into the wells of a costar® 250 µL 96 well plates (Product: 3596, Corning Inc. Corning, New York, NY, USA), and dried under a gentle stream of nitrogen without heat. The subsequent coupling step was performed immediately after the residue was dried.
4.3. Coupling of Lysine to AFB2a
L-Lysine was dissolved in LC-MS grade H2O at a stock concentration of 1.9 mg/mL Solutions of 0.05 M sodium bicarbonate were pH adjusted with either HCl or NaOH to 7.0, 7.5, 8, 8.5, 9, 9.5, 10, 10.5, and 11 (±0.1). Then 195 µL of H2O, methanol, acetonitrile, or the buffers at the various pHs were added individually to the wells of a 96 well plate that contained 10 µg of the dried AFB2a residue. A 5 µL aliquot of the 1.9 mg/mL lysine solution (9.4 µg) was added for a molar ratio of 1:2 AFB2a:Lysine and aspirated to ensure that any dried residue was solubilized. The plate was incubated at room temperature for 30 min. Ten µL aliquots were removed and diluted with 90 µL of 50% acetonitrile before being analyzed by LC-MS.
An equivalent experiment was performed in 0.05 M sodium bicarbonate buffer (pH 10.0 ± 0.1) and the volume of lysine was altered to obtain a molar ratios of AFB2a: Lysine of: 1:0 (25 µL H2O); 1:1 (2.5 µL Lys, 22.5 µL H2O); 1:2 (5 µL Lys, 20 µL H2O); 1:4 (10 µL Lys, 15 µL H2O), and 1:10 (25 µL Lys). The UV–VIS spectra in the range 220–800 nm were collected at 5 min and 30 min post addition of lysine using a Thermo Multiskan™ GO microplate spectrophotometer.
A scale up reaction was performed using 100 µg of dried AFB2a material in an amber glass vial, to which 195 µL of 0.05 M sodium bicarbonate (pH 10.0 ± 0.1) was added and 5 µL of lysine at 19 mg/mL in H2O. The solution was incubated at room temperature for 30 min and a 10 µL aliquot was removed, diluted in 990 µL of 50% acetonitrile and analyzed by LC-MS. A similar approach to the scale up described above was used for the production of AFB2a-Lys-D4, AFB2a-Lys-13C615N2, AFG2a-Lys, AFG2a-Lys-D4, and AFG2a-Lys-13C615N2.
4.4. Oxidation of AFB2a-Lysine to AFB1-Lysine
Twenty µL (~10 µg AFB1 equivalents) of AFB2a-Lys prepared from the scale-up reaction described above was transferred into a 96 well plate and dried under a gentle stream of nitrogen without heat. 0.05 M dipotassium hydrogen phosphate (K2HPO4) was adjusted to pH 5 and pH 6; while 0.05 M sodium bicarbonate buffer was adjusted to pH 7, 8, 9, 10, and 11; all buffers were pH adjusted with either NaOH or HCl. The dried AFB2a-Lys was reconstituted in 195 µL of methanol, H2O, or the seven buffers listed above. The residue could not be fully resolubilized in pure acetonitrile, which was not included in this experiment.
Oxone® (MW 152.2 Da) was dissolved in H2O at a concentration of 9.75 mg/mL (Oxone 10X). A portion of this solution was diluted with H2O to a concentration of 0.98 mg/mL (Oxone 1X). H2O2 (50% v/v, ρ = 1.197 g/mL) was diluted into H2O to a concentration of 18.3% (v/v) (H2O2 1000x). This solution was further diluted to 1.8% (H2O2 1X). Individually, 5 µL of either Oxone 10X, Oxone 1X, H2O2 1000X, and H2O2 100X were added to the dissolved AFB2a-Lys in the various solutions. The 1X represents a 1:1 molar ratio between the AFB2a-Lys and the Oxone®, the 10X solutions represent a 1:10 molar ratio. Similarly, 100x and 1000x represent a 1:100 and 1:1000 molar ratio between AFB2a-Lys and H2O2. Five µL of the stock 50% H2O2 solution added directly to the dried AFB2a-Lys material represented a 1:27,512 molar ratio between the AFB2a-Lys and the oxidant, respectively. The solutions with the oxidants were incubated at room temperature for 1 h with shaking at 300 rpm.
In a scale up reaction, dried AFB2a-Lys residue (100 µg AFB1 equiv.) in an amber glass vial, were resolubilized in 195 µL of MeOH and vortexed for 15 s. Five µL of 1000X H2O2 was added and the solution was incubated at room temperature for 1 h. The reaction mixture was then dried down under nitrogen gas without heat to remove any residual H2O2.
A similar approach to the scale up described above was used for the production of AFB1-lysine-D4, AFB1-Lys-13C615N2, AFG1-Lys, AFG1-Lys-D4, AFG1-Lys-13C615N2. A stepwise synthesis protocol is included in Supplementary Information (Table S1).
4.5. Purification by HPLC
The reaction products were isolated with an Agilent 1200 HPLC system (Supplementary Materials, Figure S2). Chromatographic conditions included an Eclipse XDB-C18 (9.4 × 250 mm, 5 μm; Agilent Technologies) column maintained at 35 °C with 100 µL injection volume. A 20-min gradient program consisting of a mobile phase of water with 0.1% trifluoroacetic acid (Sigma) (mobile phase A) and acetonitrile with 0.1% trifluoroacetic acid (mobile phase B) (Optima grade, Fisher Scientific) with a flow rate of 4 mL/min. The gradient began at 5% B, was held for 2 min, then increased to 45% B over 13 min, followed by an increase to 100% B over 0.5 min, then held at 100% B for 2.5 min. The method was completed by reconditioning the system to 5% B over 0.5 min and holding at 5% B for 1.5 min. Fractions were collected using time points established by analyzing the HPLC-UV spectra at 399 nm.
4.6. Quantitative NMR
Purified AFB1-Lys and AFG1-Lys were dried and reconstituted in D2O:acetonitrile-D3 (70:30 for AFB1-Lys and 75:25 for AFG1-Lys). A 25 µL aliquot was diluted in 975 µL of 0.1 M phosphate buffer (pH 7.4) and the concentrations were approximated by UV–VIS. The concentration of the AFB1-Lys solution approximated by UV–Vis using ε400 30,866/M·cm [37] while AFG1-Lys was approximated using ε413 27,783/M·cm [25]. Using this initial concentration, maleic acid (TraceCert®, Millipore, Sigma) dissolved in D2O was added to the aflatoxin standards to achieve a molar ratio with the aflatoxin-Lys adducts in the range 1:1–1:2 based on UV absorbance values.
Quantitative NMR (qNMR) data were obtained on a Varian 600 (I600) (Agilent Technologies, Santa Clara, CA, USA) with an Auto-XBD probe. The solvent system was D2O: acetonitrile-D3 (70:30 for AFB1-Lys and 75:25 for AFG1-Lys), and the NMR was locked to D2O. A five second relaxation delay was set, with a pulse angle of 45° with 256 scans at ambient temperature (22 °C). Quantitation was performed using five signals that were averaged and compared to the 1H NMR chemical shifts for maleic acid. The AFB1-Lys signals used were δ 2.57 (2H, integration: 2.00), δ 3.89 (2H, integration: 2.03), δ 3.37 (2H, integration: 1.97), δ 2.20 (1H, integration: 0.97), δ 3.45 (1H, integration: 1.04), averaged to 1.002 ± 0.024 per 1H, maleic acid was integrated for δ 3.20 (2H) or δ 1.60 (1H). For AFG1-Lys the signals used were δ 3.79 (1H, integration: 0.94), δ 3.45 (1H, integration: 1.00), δ 3.17 (2H, integration: 2.07), δ 1.78 (1H, integration: 1.06), δ 1.63 (2H, integration: 2.04), averaged to integration of 1.011 ± 0.041 per 1H, maleic acid was integrated for 0.670 (2H) or 0.335 (1H).
Using the qNMR derived concentrations, the solutions were diluted into 50% acetonitrile at a concentration of 10 µg/mL and transferred to Thermo Scientific Matrix barcoded storage tubes and stored at −80 °C.
4.7. Stability Assay
A solution of AFB1-Lys at 50 ng/mL was prepared in the following solvents: DMSO, 0.1M PBS (pH 7.4), methanol, H2O, and 50:50 acetonitrile: water. Aliquots of 50 µL at these concentrations were placed in individual polypropylene tubes and store at −20 °C, 4 °C, and 20 °C in darkness. Additionally, 50 µL solutions of 50 ng/mL AFB1-Lys in 0.1M PBS (pH 7.4) and H2O were placed into polypropylene tubes, and dried down using a centrivap and also placed at either −20 °C, 4 °C, or 20 °C.
At various time points, the tubes containing the AFB1-Lys were transferred to −80 °C and stored until the day of analysis. Prior to analysis, the samples were brought to room temperature and 10 µL of the 50 ng/mL solutions was transferred to fresh tubes and diluted with 90 µL of water. The peak areas of each time point at the various conditions and temperatures were normalized to the peak area of the t0 sample which was stored at −80 °C for the entirety of the assay.
Supplementary Materials
The following supporting information can be downloaded at: https://0-www-mdpi-com.brum.beds.ac.uk/article/10.3390/toxins14010056/s1, Figure S1, LC-MS/MS chromatogram of AFB2a reacted with a molar ratio of 1 to (a) 0, (b)1, (c) 2, (d) 4, (e) 10 lysine; Figure S2, Chromatogram of isolation AFB1-Lys was obtained using method described in Section 4.5. AFB1-Lys peak of interest is highlighted and was collected using time-based fraction collected. All fractions were screened by LC-MS to confirm identification. Chromatogram obtained at 399 nm referenced to 460 nm; Table S1, Synthesis of Aflatoxin B1-lysine (AFB1-lysine).
Author Contributions
Conceptualization, J.B.R. and M.W.S.; methodology, J.B.R. and J.P.W. Writing—original draft preparation, J.B.R.; writing—review and editing, J.P.W. and M.W.S.; project administration, M.W.S.; funding acquisition, M.W.S. All authors have read and agreed to the published version of the manuscript.
Funding
This research was funded by an AAFC grant #3022 to M.W.S.
Informed Consent Statement
Not applicable.
Data Availability Statement
Not applicable.
Acknowledgments
The authors thank J. David Miller (Carleton) for a critical review of the manuscript and D. McMullin (Carleton) for helpful comments on this manuscript.
Conflicts of Interest
The authors declare no conflict of interest.
References
- Evaluation of Certain Contaminants in Food: Eighty-Third Report of the Joint Fao/Who Expert Committee on Food Additives; Joint Food and Agriculture Organization/World Health Organization: Geneva, Switzerland, 2017.
- Pitt, J.I.; Wild, C.P.; Baan, R.A.; Gelderblom, W.C.; Miller, J.; Riley, R.; Wu, F. Improving Public Health through Mycotoxin Control; International Agency for Research on Cancer: Lyon, France, 2012. [Google Scholar]
- Wild, C.P.; Miller, J.D.; Groopman, J.D. Mycotoxin Control in Low-and Middle-Income Countries; International Agency for Research on Cancer: Lyon, France, 2015. [Google Scholar]
- Wojnowski, L.; Turner, P.C.; Pedersen, B.; Hustert, E.; Brockmöller, J.; Mendy, M.; Whittle, H.C.; Kirk, G.; Wild, C.P. Increased levels of aflatoxin-albumin adducts are associated with CYP3A5 polymorphisms in The Gambia, West Africa. Pharmacogenet. Genom. 2004, 14, 691–700. [Google Scholar] [CrossRef] [PubMed]
- Harris, T.; Stone, M.; Gopalakrishnan, S.; Baertschi, S.; Raney, K.; Byrd, S. Aflatoxin B1 epoxide, the ultimate carcinogenic form of aflatoxin B1: Synthesis and reaction with DNA. J. Toxicol. Toxin Rev. 1989, 8, 111–120. [Google Scholar] [CrossRef]
- Martin, C.N.; Garner, R.C. Aflatoxin B-oxide generated by chemical or enzymic oxidation of aflatoxin B1 causes guanine substitution in nucleic acids. Nature 1977, 267, 863–865. [Google Scholar] [CrossRef] [PubMed]
- Wong, J.J.; Hsieh, D. Mutagenicity of aflatoxins related to their metabolism and carcinogenic potential. Proc. Natl. Acad. Sci. USA 1976, 73, 2241–2244. [Google Scholar] [CrossRef] [Green Version]
- Theumer, M.G.; Henneb, Y.; Khoury, L.; Snini, S.; Tadrist, S.; Canlet, C.; Puel, O.; Oswald, I.P.; Audebert, M. Genotoxicity of aflatoxins and their precursors in human cells. Toxicol. Lett. 2018, 287, 100–107. [Google Scholar] [CrossRef] [PubMed]
- Johnson, W.W.; Harris, T.M.; Guengerich, F.P. Kinetics and mechanism of hydrolysis of aflatoxin B1 exo-8, 9-epoxide and rearrangement of the dihydrodiol. J. Am. Chem. Soc. 1996, 118, 8213–8220. [Google Scholar] [CrossRef]
- Guengerich, F.P.; Voehler, M.; Williams, K.M.; Deng, Z.; Harris, T.M. Structure of the aflatoxin B1 dialdehyde adduct formed from reaction with methylamine. Chem. Res. Toxicol. 2002, 15, 793–798. [Google Scholar] [CrossRef]
- Sabbioni, G.; Skipper, P.L.; Büchi, G.; Tannenbaum, S.R. Isolation and characterization of the major serum albumin adduct formed by aflatoxin B1 in vivo in rats. Carcinogenesis 1987, 8, 819–824. [Google Scholar] [CrossRef] [PubMed]
- Nassar, A.; Megalla, S.; Abd El-Fattah, H.; Hafez, A.; El-Deap, T. Binding of aflatoxin b1, g1 and m to plasma albumin. Mycopathologia 1982, 79, 35–38. [Google Scholar] [CrossRef]
- Gan, L.-S.; Skipper, P.L.; Peng, X.; Groopman, J.D.; Chen, J.-S.; Wogan, G.N.; Tannenbaum, S.R. Serum albumin adducts in the molecular epidemiology of aflatoxin carcinogenesis: Correlation with aflatoxin B1 intake and urinary excretion of aflatoxin m 1. Carcinogenesis 1988, 9, 1323–1325. [Google Scholar] [CrossRef] [PubMed]
- Ross, R.K.; Yu, M.; Henderson, B.; Yuan, J.-M.; Qian, G.-S.; Tu, J.-T.; Gao, Y.-T.; Wogan, G.; Groopman, J. Urinary aflatoxin biomarkers and risk of hepatocellular carcinoma. Lancet 1992, 339, 943–946. [Google Scholar] [CrossRef]
- Groopman, J.D.; Wild, C.P.; Hasler, J.; Junshi, C.; Wogan, G.N.; Kensler, T.W. Molecular epidemiology of aflatoxin exposures: Validation of aflatoxin-N7-guanine levels in urine as a biomarker in experimental rat models and humans. Environ. Health Perspect. 1993, 99, 107–113. [Google Scholar] [CrossRef]
- Wild, C.; Turner, P. The toxicology of aflatoxins as a basis for public health decisions. Mutagenesis 2002, 17, 471–481. [Google Scholar] [CrossRef] [PubMed]
- Nilsen, J.; Trabjerg, E.; Grevys, A.; Azevedo, C.; Brennan, S.O.; Stensland, M.; Wilson, J.; Sand, K.M.K.; Bern, M.; Dalhus, B. An intact C-terminal end of albumin is required for its long half-life in humans. Commun. Biol. 2020, 3, 1–11. [Google Scholar] [CrossRef]
- Wild, C.P.; Jiang, Y.-Z.; Sabbioni, G.; Chapot, B.; Montesano, R. Evaluation of methods for quantitation of aflatoxin-albumin adducts and their application to human exposure assessment. Cancer Res. 1990, 50, 245–251. [Google Scholar] [PubMed]
- Chapot, B.; Wild, C. ELISA for quantification of aflatoxin-albumin adducts and their application to human exposure assessment. Tech. Diagn. Pathol. 1991, 2, 135–155. [Google Scholar]
- Wild, C.P.; Hudson, G.J.; Sabbioni, G.; Chapot, B.; Hall, A.J.; Wogan, G.N.; Whittle, H.; Montesano, R.; Groopman, J.D. Dietary intake of aflatoxins and the level of albumin-bound aflatoxin in peripheral blood in The Gambia, West Africa. Cancer Epidemiol. Prev. Biomark. 1992, 1, 229–234. [Google Scholar]
- Xue, K.S.; Cai, W.; Tang, L.; Wang, J.-S. Aflatoxin B1-lysine adduct in dried blood spot samples of animals and humans. Food Chem. Toxicol. 2016, 98, 210–219. [Google Scholar] [CrossRef]
- McCoy, L.F.; Scholl, P.F.; Schleicher, R.L.; Groopman, J.D.; Powers, C.D.; Pfeiffer, C.M. Analysis of aflatoxin B1-lysine adduct in serum using isotope-dilution liquid chromatography/tandem mass spectrometry. Rapid Commun. Mass Spectrom. 2005, 19, 2203–2210. [Google Scholar] [CrossRef]
- Scholl, P.F.; Turner, P.C.; Sutcliffe, A.E.; Sylla, A.; Diallo, M.S.; Friesen, M.D.; Groopman, J.D.; Wild, C.P. Quantitative comparison of aflatoxin B1 serum albumin adducts in humans by isotope dilution mass spectrometry and elisa. Cancer Epidemiol. Biomark. Prev. 2006, 15, 823–826. [Google Scholar] [CrossRef] [Green Version]
- Baertschi, S.W.; Raney, K.D.; Shimada, T.; Harris, T.M.; Guengerich, F.P. Comparison of rates of enzymic oxidation of aflatoxin b1, aflatoxin g1, and sterigmatocystin and activities of the epoxides in forming guanyl-N7 adducts and inducing different genetic responses. Chem. Res. Toxicol. 1989, 2, 114–122. [Google Scholar] [CrossRef]
- Sabbioni, G.; Wild, C.P. Identification of an aflatoxin G1–serum albumin adduct and its relevance to the measurement of human exposure to aflatoxins. Carcinogenesis 1991, 12, 97–103. [Google Scholar] [CrossRef] [PubMed]
- Purchase, I.; Steyn, M. The metabolism of aflatoxin B1 in rats. Br. J. Cancer 1969, 23, 800–805. [Google Scholar] [CrossRef] [PubMed] [Green Version]
- Ruprich, J. Preparation and identification of aflatoxin B2a under laboratory conditions. Vet. Med. 1983, 28, 361–366. [Google Scholar]
- Ciegler, A.; Peterson, R. Aflatoxin detoxification: Hydroxydihydro-aflatoxin B. Appl. Microbiol. 1968, 16, 665–666. [Google Scholar] [CrossRef] [PubMed]
- Bean, T.; Yourtee, D.; Akande, B.; Ogunlewe, J. Aflatoxin metabolites in the urine of Nigerians comparison of chromatographic methods. J. Toxicol. Toxin Rev. 1989, 8, 43–52. [Google Scholar] [CrossRef]
- Ashoor, S.H.; Chu, F.S. Reduction of aflatoxin B2a with sodium borohydride. J. Agric. Food Chem. 1975, 23, 445–447. [Google Scholar] [CrossRef]
- Rushing, B.R.; Selim, M.I. Structure and oxidation of pyrrole adducts formed between aflatoxin B2a and biological amines. Chem. Res. Toxicol. 2017, 30, 1275–1285. [Google Scholar] [CrossRef]
- Rushing, B.R.; Selim, M.I. Aflatoxin B1: A review on metabolism, toxicity, occurrence in food, occupational exposure, and detoxification methods. Food Chem. Toxicol. 2019, 124, 81–100. [Google Scholar] [CrossRef] [PubMed]
- Cristina Sass, D.; Vincenzi Jager, A.; Gustavo Tonin, F.; Naira Zambelli Ramalho, L.; Silva Ramalho, F.; Gomes Constantino, M.; Augusto Fernandes Oliveira, C. Methods for chemical preparation of aflatoxin B1 adducts, AFB1-N7-guanine and AFB1-lysine. Toxin Rev. 2013, 32, 68–74. [Google Scholar] [CrossRef]
- McMillan, A.; Renaud, J.B.; Burgess, K.M.; Orimadegun, A.E.; Akinyinka, O.O.; Allen, S.J.; Miller, J.D.; Reid, G.; Sumarah, M.W. Aflatoxin exposure in nigerian children with severe acute malnutrition. Food Chem. Toxicol. 2018, 111, 356–362. [Google Scholar] [CrossRef] [PubMed]
- Iyer, R.S.; Harris, T.M. Preparation of aflatoxin B1 8, 9-epoxide using m-chloroperbenzoic acid. Chem. Res. Toxicol. 1993, 6, 313–316. [Google Scholar] [CrossRef] [PubMed]
- Sass, D.C.; Jager, A.V.; Tonin, F.G.; Rosim, R.E.; Constantino, M.G.; Oliveira, C.A.F. Synthesis and purification of the aflatoxin B1-lysine adduct. Toxin Rev. 2015, 34, 53–59. [Google Scholar] [CrossRef]
- Sabbioni, G. Chemical and physical properties of the major serum albumin adduct of aflatoxin B1 and their implications for the quantification in biological samples. Chem.-Biol. Interact. 1990, 75, 1–15. [Google Scholar] [CrossRef]
- Scholl, P.F.; Groopman, J.D. Synthesis of 5, 5, 6, 6-D4-l-lysine-aflatoxin Bl for use as a mass spectrometric internal standard. J. Label. Compd. Radiopharm. 2004, 47, 807–815. [Google Scholar] [CrossRef]
- Patterson, D.; Roberts, B. Aflatoxin metabolism in duck-liver homogenates: The relative importance of reversible cyclopentenone reduction and hemiacetal formation. Food Cosmet. Toxicol. 1972, 10, 501–512. [Google Scholar] [CrossRef]
- Howard, J.K.; Rihak, K.J.; Bissember, A.C.; Smith, J.A. The oxidation of pyrrole. Chem.-Asian J. 2016, 11, 155–167. [Google Scholar] [CrossRef]
Scheme 1.
When ingested, AFB1 is metabolized by human P450 liver enzymes into the carcinogen 8,9 exo-AFB1 epoxide. AFB1-epoxide either reacts with DNA or hydrolyzes to AFB1-dihydrodiol. AFB1-dihydrodiol is in equilibrium with AFB1-dialdehyde, which can form an adduct with lysine (Lys) in serum albumin. AFB1-Lys can be quantified by releasing it from serum albumin following treatment with Pronase. AFB1 can also be converted chemically to AFB2a under acidic conditions, which rearranges into AFB2a-dialdehyde and can react with free amines. Common AFB1 biomarkers are shown in bold.

Figure 1.
Total ion current chromatogram (m/z 150–800) showing the conversion of AFB1 (m/z 313) in 0.2 M HCl to AFB2a (m/z 331) at (a) t = 0 h, (b) t = 24 h, and (c) t = 48 h. After 48 h at 45 °C it showed <5% AFB1 remained by peak height intensity.
Figure 1.
Total ion current chromatogram (m/z 150–800) showing the conversion of AFB1 (m/z 313) in 0.2 M HCl to AFB2a (m/z 331) at (a) t = 0 h, (b) t = 24 h, and (c) t = 48 h. After 48 h at 45 °C it showed <5% AFB1 remained by peak height intensity.

Scheme 2.
AFB2a-dialdehyde can react with either amine groups of lysine. Within a polypeptide chain, only the ε-amino group is available to react and therefore the ε-coupled AFB2a-Lys is the desired reaction product.
Scheme 2.
AFB2a-dialdehyde can react with either amine groups of lysine. Within a polypeptide chain, only the ε-amino group is available to react and therefore the ε-coupled AFB2a-Lys is the desired reaction product.

Figure 2.
Extracted ion chromatograms for m/z 441 (AFB2a-Lys) when the coupling reaction proceeds at (a) pH 8 and (b) pH 10. The minor, earlier eluting peak is the undesired α-amino linked AFB2a-Lys while the major, less polar peak is the target ε-linked (c) AFB2a-lys. Although AFB2a-ε-Lys is the favoured product across the tested pH range, a higher pH favours its production and is associated to the degree of protonation.

Figure 3.
A series of molar ratios between AFB2a:lysine were investigated by UV–VIS at (a) 5 min post lysine addition and (b) 30 min post lysine addition. A clear progression of λmax was observed at the 5 min mark, whereas after 30 min, all mixtures possessed similar spectra with λmax values between 406 and 408 nm.

Scheme 3.
Observed oxidation products following the addition of Oxone® or H2O2 to AFB2a-Lys.

Figure 4.
High resolution LC-MS/MS of (a) AFB2a-Lys, (b) I; AFB1-Lys, (c) II; AFB1-Lys+O and (d) III; AFB1-Lys+O-2H. MS/MS dissociation pathways (b–d) show multiple product ions are formed, whereas the AFB2a-Lys, which does not possess a oxidized pyrrole ring, has one major product ion, that results from the loss of both H2CO2 and NH3 from the lysine amino acid. All compounds have a m/z 84.0814 product ion derived from the Lys residue.

Figure 5.
Proportion of the various unreacted and oxidized AF-Lys products produced by (a) 1:1 AFB2a-Lys: Oxone® and (b) 1:10 AFB2a-Lys: Oxone®. Overall adding Oxone® to a reaction does increase the relative purity of AFB1-Lys, (c) its overall intensity is dramatically decreased in this step.
Figure 5.
Proportion of the various unreacted and oxidized AF-Lys products produced by (a) 1:1 AFB2a-Lys: Oxone® and (b) 1:10 AFB2a-Lys: Oxone®. Overall adding Oxone® to a reaction does increase the relative purity of AFB1-Lys, (c) its overall intensity is dramatically decreased in this step.

Figure 6.
Proportion of the various unreacted and oxidized AF-Lys products produced by (a) 1:100 AFB2a-Lys: H2O2 and (b) 1:1000 AFB2a-Lys: H2O2. (c) Overall additional H2O2 to a reaction performed in methanol did dramatically decrease the intensity of the desired product.
Figure 6.
Proportion of the various unreacted and oxidized AF-Lys products produced by (a) 1:100 AFB2a-Lys: H2O2 and (b) 1:1000 AFB2a-Lys: H2O2. (c) Overall additional H2O2 to a reaction performed in methanol did dramatically decrease the intensity of the desired product.

Figure 7.
High resolution LC-MS/MS spectra of (a) AFB1-Lys, (b) AFB1-Lys-D4, (c) AFB1-Lys-13C6,15N2, (d) AFG1-Lys, (e) AFG1-Lys-D4, (f) AFB1-Lys-13C6,15N2.
Figure 7.
High resolution LC-MS/MS spectra of (a) AFB1-Lys, (b) AFB1-Lys-D4, (c) AFB1-Lys-13C6,15N2, (d) AFG1-Lys, (e) AFG1-Lys-D4, (f) AFB1-Lys-13C6,15N2.

Figure 8.
Stability of AFB1-Lys over 21 days at −20 °C, 4 °C, and 25 °C. (a) The stability at t = 14 d is showed for PBS, methanol, 50% acetonitrile as well as dried residue and dried residue + PBS salt. The stability from 0–21 d at different temperatures is showed for standards in (b) 50% ACN and (c) methanol.


Table 1.
Comparison of Concentrations Derived from UV–VIS and qNMR.
| Compound | ε (pH 7.4) | Concentration by UV–VIS (mM) | Concentration by qNMR (mM) |
|---|---|---|---|
| AFB1-Lys | 30,866 | 1.15 | 1.01 |
| AFG1-Lys | 27,783 | 0.634 | 1.89 |
Publisher’s Note: MDPI stays neutral with regard to jurisdictional claims in published maps and institutional affiliations. |
© 2022 by the authors. Licensee MDPI, Basel, Switzerland. This article is an open access article distributed under the terms and conditions of the Creative Commons Attribution (CC BY) license (https://creativecommons.org/licenses/by/4.0/).
Share and Cite
MDPI and ACS Style
Renaud, J.B.; Walsh, J.P.; Sumarah, M.W. Simplified Synthesis and Stability Assessment of Aflatoxin B1-Lysine and Aflatoxin G1-Lysine. Toxins 2022, 14, 56. https://0-doi-org.brum.beds.ac.uk/10.3390/toxins14010056
AMA Style
Renaud JB, Walsh JP, Sumarah MW. Simplified Synthesis and Stability Assessment of Aflatoxin B1-Lysine and Aflatoxin G1-Lysine. Toxins. 2022; 14(1):56. https://0-doi-org.brum.beds.ac.uk/10.3390/toxins14010056
Chicago/Turabian StyleRenaud, Justin B., Jacob P. Walsh, and Mark W. Sumarah. 2022. "Simplified Synthesis and Stability Assessment of Aflatoxin B1-Lysine and Aflatoxin G1-Lysine" Toxins 14, no. 1: 56. https://0-doi-org.brum.beds.ac.uk/10.3390/toxins14010056
Note that from the first issue of 2016, this journal uses article numbers instead of page numbers. See further details here.